Embed Size (px)
Citation preview
ASAR IMAGE AND WIDE SWATH MODE OPTIMISATIONS
AND PRODUCT QUALITY UPDATE
Betlem Rosich
ESA, ESRIN -Earth Observation Department Via Galileo Galilei C.P. 64 00044 Frascati, Italy Phone: +39 06 94180616, Fax: +39 06 94180280
1. INTRODUCTION A preliminary analysis of Image Mode (IM) and Wide Swath Mode (WSM) product quality was presented at the ENVISAT Calibration Review (ECR) based on a limited number of products and only VV polarisation. The results obtained showed that some quality aspects could be improved for IM and WS mode products. Therefore, after the ECR, actions were taken to improve the quality of IM and WS mode products. This has been achieved by a mode optimisation at instrument level, which of course has also required some adjustments in the processing level. This paper presents the modifications performed at instrument level for IM and WS modes, the corresponding changes in the processing settings, the evolution of the products quality and the final product quality achieved.
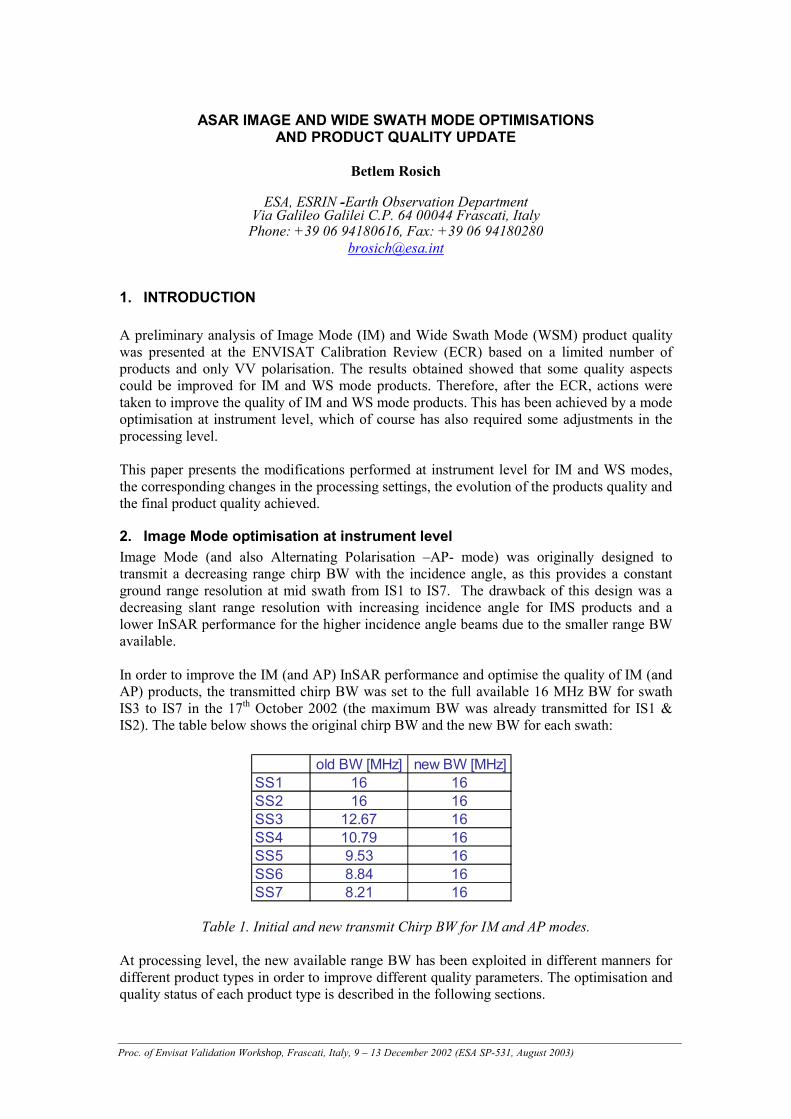
2. Image Mode optimisation at instrument level Image Mode (and also Alternating Polarisation –AP- mode) was originally designed to transmit a decreasing range chirp BW with the incidence angle, as this provides a constant ground range resolution at mid swath from IS1 to IS7. The drawback of this design was a decreasing slant range resolution with increasing incidence angle for IMS products and a lower InSAR performance for the higher incidence angle beams due to the smaller range BW available. In order to improve the IM (and AP) InSAR performance and optimise the quality of IM (and AP) products, the transmitted chirp BW was set to the full available 16 MHz BW for swath IS3 to IS7 in the 17th October 2002 (the maximum BW was already transmitted for IS1 & IS2). The table below shows the original chirp BW and the new BW for each swath:
Table 1. Initial and new transmit Chirp BW for IM and AP modes.
At processing level, the new available range BW has been exploited in different manners for different product types in order to improve different quality parameters. The optimisation and quality status of each product type is described in the following sections.
old BW [MHz] new BW [MHz]SS1 16 16SS2 16 16SS3 12.67 16SS4 10.79 16SS5 9.53 16SS6 8.84 16SS7 8.21 16
__________________________________________________________________________________________________________Proc. of Envisat Validation Workshop, Frascati, Italy, 9 – 13 December 2002 (ESA SP-531, August 2003)

Page - 2 -
3. IMS product optimisation and product quality update The main properties of IMS products are detailed below:
• Slant range, single look complex image. • Single polarisation VV or HH. Multiple incidence angles (IS1 to IS7). • Coverage from 100 Km (IS1) to 56 Km (IS7) • Natural pixel spacing in range and azimuth. • Azimuth resolution from 4 m to 5 m. • Constant slant range resolution around 9 m for all swaths. The original
IMS range resolution decreased from 9 m to 18 m due to the decreasing chirp bandwidth.
• Elevation antenna pattern correction not applied. Range spreading loss correction not applied.
• Hamming window with weighting factor 0.75 applied in azimuth and range. • Processing algorithm: Phase preserving Range Doppler.
Improved slant range resolution for IMS products For IMS products, the new Chirp BW is fully processed for all swaths, providing a constant slant range resolution from IS1 to IS7 (~ 9.4 m) and almost doubling the available BW for the high incidence angle beams. The plots below show the slant range resolution measured on IMS products before and after the BW increase.
Fig. 1 (Top) IMS slant range resolution for VV products acquired before the increase of Tx chirp BW. (Bottom) IMS slant range resolution for VV & HH products acquired aafter the increase of Tx chirp BW.
IMS slant range res. VV
8101214161820
1 2 3 4 5 6 7 8 9 10 11 12 13
m
IS1IS2IS3IS4IS5IS6IS7
IMS Slant range res. New BW. VV & HH
8.59
9.510
10.5
1 3 5 7 9 11 13 15
m
IS1...IS7

Page - 3 -
The change in chirp BW has no impact on the remaining image quality parameters. The results obtained with the new BW are equivalent to the ones derived from products acquired with the original BW, which are presented in [R1]. IMS Absolute calibration update No changes in the processing gains were needed to maintain the absolute calibration factor constant after the BW increase. Indeed, since PF-ASAR uses the full available range BW in the IMS processing, the BW increase is transparent for the IMS radiometric calibration and the same calibration factor applies for data acquired before and after the 17-10-2002. The plot below shows the absolute calibration factor derived from data acquired before and after the BW increase. Although the stability of the measurements is close to 1 dB, there is no clear difference between the measurements performed on both types of products. More information on the IMS absolute calibration factor stability can be found in [R1].
Fig.2. Relative absolute calibration factor derived from measurements on VV & HH products acquired after the BW increase over the ASAR transponders. The reference absolute calibration factor is the value derived from products acquired before the BW increase.
IMS azimuth ambiguities The averaged point target ambiguity ratio measured on IMS VV and HH products is –26 dB, being the ambiguity ratio requirement –25 dB. However, on HH products, for bright targets close to low backscattering areas, the azimuth ambiguities are clearly visible. This is often the case on the Flevoland area, as it can be observed in the image below. The highest distributed ambiguity ratio measured over these products is –24 dB which appears too high for HH products. Options to reduce the ambiguity ratio are under analysis.
IMS Rel RCS (K=45.6 dB). New BW
-0.8
-0.6
-0.4
-0.2
0
0.2
0.4
0.6
0.8
1
0 2 4 6 8 10 12
dB
new BW VVnew BW HH

Page - 4 -
Fig.3. Example of azimuth ambiguities on IMS HH products over Flevoland.
IMS product quality evolution Since no changes in the processing parameters are introduced after the BW increase, the quality of IMS products depends only on the data acquisition date as shown in the table below. The table includes the quality with respect to the PF-ASAR version as reference information.
Table 2. Evolution of IMS product quality versus acquisition date and processor version.
4. IMP product optimisation and product quality update The main characteristics of IMP products are listed below:
• Ground range detected imagery • Single polarisation (VV or HH) • Elevation antenna pattern and range spreading loss corrections applied • Size of up to 150 Mbytes with 2 byte (16bit) amplitude pixel values • Swath widths of 100 km (IS1) to 56 km (IS7) with azimuth extents of ~100
km
PF-ASAR version 3.01 & 3.02 3.03 3.01 & 3.02 3.03
IMSOK
(Nominal quality)OK
(Nominal quality)OK
(Higher Rg.res)OK
(Higher Rg.res)
Data Acquired After 17-Oct. 2002
Data Acquired Between 5-Sept. & 17-Oct. 2002
Page - 5 -
• 4 azimuth looks of 320 Hz each. • Azimuth resolution of 20.7m • 1 range look processing, with decreasing BW from IS2 to IS7 to achieve a
similar ground range resolution at mid range of each beam. • Range resolution from 21m (IS2 far range) to 37m (IS1 near range) and ~26m
for IS3 to IS7 • 12.5m by 12.5m pixel spacing
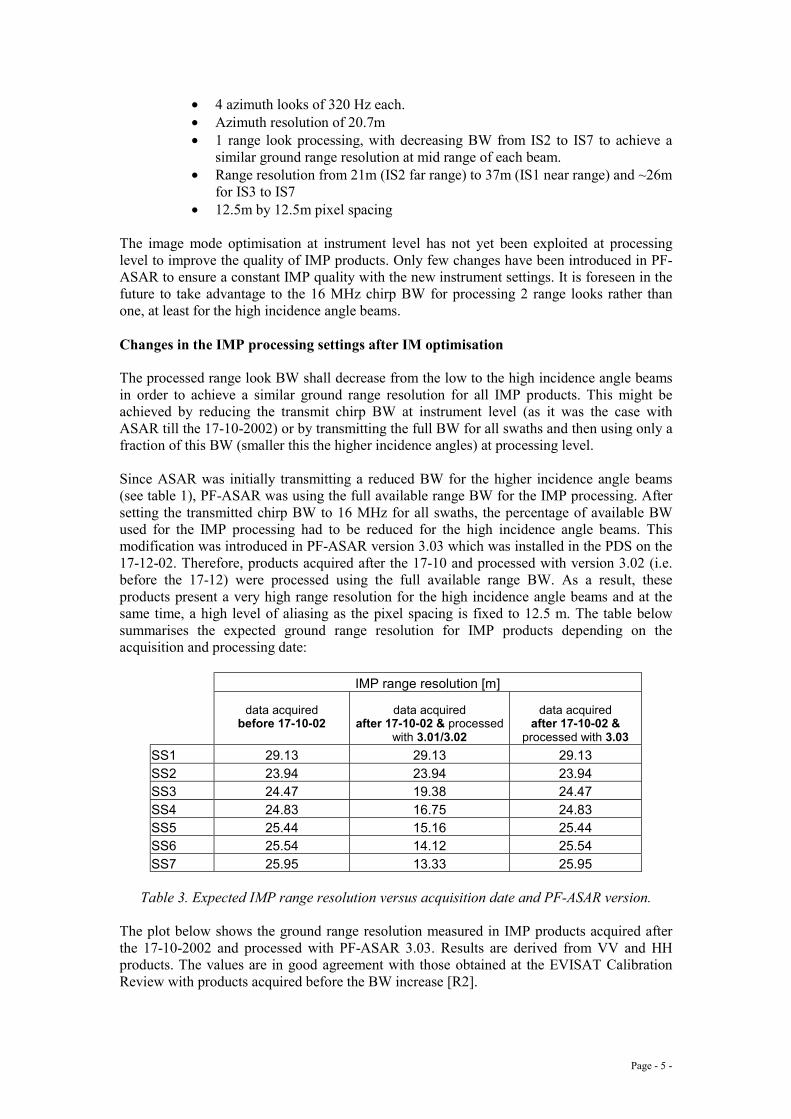
The image mode optimisation at instrument level has not yet been exploited at processing level to improve the quality of IMP products. Only few changes have been introduced in PF-ASAR to ensure a constant IMP quality with the new instrument settings. It is foreseen in the future to take advantage to the 16 MHz chirp BW for processing 2 range looks rather than one, at least for the high incidence angle beams. Changes in the IMP processing settings after IM optimisation The processed range look BW shall decrease from the low to the high incidence angle beams in order to achieve a similar ground range resolution for all IMP products. This might be achieved by reducing the transmit chirp BW at instrument level (as it was the case with ASAR till the 17-10-2002) or by transmitting the full BW for all swaths and then using only a fraction of this BW (smaller this the higher incidence angles) at processing level. Since ASAR was initially transmitting a reduced BW for the higher incidence angle beams (see table 1), PF-ASAR was using the full available range BW for the IMP processing. After setting the transmitted chirp BW to 16 MHz for all swaths, the percentage of available BW used for the IMP processing had to be reduced for the high incidence angle beams. This modification was introduced in PF-ASAR version 3.03 which was installed in the PDS on the 17-12-02. Therefore, products acquired after the 17-10 and processed with version 3.02 (i.e. before the 17-12) were processed using the full available range BW. As a result, these products present a very high range resolution for the high incidence angle beams and at the same time, a high level of aliasing as the pixel spacing is fixed to 12.5 m. The table below summarises the expected ground range resolution for IMP products depending on the acquisition and processing date:
Table 3. Expected IMP range resolution versus acquisition date and PF-ASAR version.
The plot below shows the ground range resolution measured in IMP products acquired after the 17-10-2002 and processed with PF-ASAR 3.03. Results are derived from VV and HH products. The values are in good agreement with those obtained at the EVISAT Calibration Review with products acquired before the BW increase [R2].
IMP range resolution [m]
data acquired before 17-10-02
data acquired after 17-10-02 & processed
with 3.01/3.02
data acquired after 17-10-02 &
processed with 3.03 SS1 29.13 29.13 29.13 SS2 23.94 23.94 23.94 SS3 24.47 19.38 24.47 SS4 24.83 16.75 24.83 SS5 25.44 15.16 25.44 SS6 25.54 14.12 25.54 SS7 25.95 13.33 25.95

Page - 6 -
Fig. 4. IMP range resolution for products acquired after the BW increase and processed with PF-ASAR 3.03 (or latter). More details on the quality of IMP products can be found in [R2]. IMP absolute calibration Another modification was introduced in the processing of IMP products after the increase of transmit chirp BW. Since the relationship between processed and available range BW was different for data acquired before and after the increase of Tx BW, the IMP processing gains had to be adjusted accordingly on order to keep the absolute calibration factor constant for products acquired before and after the BW increase. The measurement on IMP VV & HH products acquired after the BW increased and processed with PF-ASAR 3.03 demonstrates that there is no change in the absolute calibration factor (K). The average K from products acquired before the BW increase is 55.3 dB (standard deviation 0.31 dB) and the average K measured on new products is also 55.3 dB (standard deviation 0.33 dB).
Rg.Res. - IMP new Tx.Chirp BW, VV & HH
20
25
30
35
40
14 19 24 29 34 39 44inc.angle [deg[
rg.re
s. [m
]
IS1IS4IS5IS6IS7IS1 theor.IS4 theor.IS5 theor.IS6 theor.IS7 theor.
K - IMP VV
54.6
54.8
55
55.2
55.4
55.6
55.8
56
56.2
10 20 30 40 50Incidence Angle (degs)
K [d
B]

Page - 7 -
Fig. 5. (Top) IMP Absolute calibration factor for products acquired before the BW increase and processed with PF-ASAR up to 3.02. (Bottom) IMP Absolute calibration factor for products acquired after the BW increase and processed with PF-ASAR 3.03 or latter.
IMP Azimuth ambiguities As for IMS HH products, azimuth ambiguities are clearly visible on IMP HH products when bright targets are close to low backscattering areas. Clear examples are available in Flevoland as it can be seen in the Fig.6. The worst distributed ambiguity ratio measured on IMP HH products is –21 dB (the requirements is –25 dB as for the IMS products). One way to reduce the azimuth ambiguity levels is to reduce the processed azimuth BW. A test has been performed by processing only 2 azimuth looks (i.e. 640 Hz rather than 1280 Hz), which is not an acceptable option as the ENL would be roughly reduced by a factor of 2. However, in this case the azimuth ambiguities are still visible on the resulting IMP product, even the ambiguity level has decreased down to –28 dB. Other possibilities to reduce the azimuth ambiguity levels are under analysis. Fig. 6. Azimuth ambiguities on standard IMP products (left) and on IMP products processed with only 2 azimuth looks (right).
K - IMP new BW VV & HH
54.6
54.8
55
55.2
55.4
55.6
55.8
56
56.2
0 1 2 3 4 5 6No. of measurements
K [d
B]
IS1 VVIS4 HHIS5 HHIS5 VVIS6 VVIS7 VV
3354, IS5, 2 looks 3354, IS5, 4 looks

Page - 8 -
IMP product quality evolution Since the processor changes related to the chirp BW increase were not introduced till version 3.03, the geometric and radiometric quality of IMP products acquired after the BW increase and processed before PF-ASAR 3.03 cannot be regareded as nominal. The table below summarises the IMP quality status.
Table 4. IMP quality status versus acquisition date and PF-ASAR version.
5. IMM Product Optimisation and product quality update The main properties of IMM products are provided below:
• Ground range projected detected products • Nominal resolution better than 150 m . Pixel spacing 75 m. • 8 looks in azimuth, 10 looks in range. ENL up to 80. Initially, 5 looks were
processed in range, achieving an ENL close to 40 looks. • Antenna pattern and range spreading loss correction applied • Data output as unsigned 16 bit • Systematic stripline processing: products as long as the complete acquisition
segment • Innovative ground range projection to keep constant incidence angle at the
center of the product (common to all stripline products) The full transmitted chirp BW in all swaths has been exploited by the on-ground processor to dramatically improve the radiometric quality of IMM products (for the high incidence angle beams) by doubling the number of range looks processed. The range look BW is kept the same as for data acquired before the 17-10-02 and it is decreasing for higher incidence angle beams (from IS3 to IS7) in order to achieve a similar ground range resolution at mid range for all beams. The increase in number of range looks is optimum for IS6 & IS7, where the overlap is very small. For the low incidence angle beams (IS1 & IS2 in particular), the increase in range looks has a minor impact on the radiometric resolution as the overlap is more than 50 %. The table below summarises the range look BW used for each beam, the total processed BW for products acquired before and after the 17-10-02 and the look overlap for the 10 range looks processing case.
Table 5. IMM range look BW, total processed BW for products acquired before and after the BW increase and look overlap with 10 range looks processed and new Tx. BW.
PF-ASAR version 3.01 & 3.02 3.03 3.01 & 3.02 3.03
IMP/IMGOK
(Nominal quality)
Degraded Rg. Res. (IS3 to IS7) but acceptable quality
Higher Rg. Res. (for IS3 to IS7, e.g.13.3
m for IS7!!)OK
(Nominal quality)
Data Acquired Between 5-Sept. & 17-Oct. Data Acquired After 17-Oct. 2002
Swath rg.look BW [MHz] tot.orig.BW [MHz] tot. BW [MHz] % Overlap (10 looks)IS1 3.63 16 16 62IS2 3.02 16 16 52IS3 2.43 12.67 16 38IS4 2.11 10.79 16 27IS5 1.92 9.53 16 19IS6 1.78 8.84 16 11IS7 1.69 8.21 16 6

Page - 9 -
The measured ENL on IMM products acquired after the chirp BW increase and processed with PF-ASAR 3.03 is summarised in the table below. Measurement are not yet available for all beams.
Table 6. ENL for products acquired before and after the mode optimisation and the increase in the number of range looks. As it can be observed almost no improvement is obtained for IS1 (same for IS2) and the ENL is now increasing with the incidence angle. A change in the IMM ENL quality requirements is needed to reflect the new product quality. IMM Range resolution As already mentioned, the unique change at processing level after the increase in transmit ted chirp BW is the increase in the number of range looks. No changes in the range look BW have been introduced and the results for the new VV and HH products are close to the ones obtained at the ECR.
Fig. 7. IMM range resolution for products acquired after the Tx. BW increase.
BEAM
ENL before
Chirp BW change
ENL after Chirp BW change
IS1 27 35IS2 30 NAIS3 28 NAIS4 31 70IS5 32 70IS6 34 NAIS7 27 80
IMM new BW rg.res. VV & HH
120.000
130.000
140.000
150.000
160.000
170.000
15.00 20.00 25.00 30.00 35.00 40.00 45.00
inc.angle [deg]
reso
lutio
n [m
]
IS1 th.IS4 th.IS5 th.IS6 th.IS7 thIS1IS4IS5IS6IS7

Page - 10 -
IMM Absolute calibration Since the relationship between processed and available BW is different for products acquired before and after the 17-10-02, a change in the product intensity levels (i.e. in the absolute calibration factor in expected). Due to the difficulty to compensate accurately such variation in the processor, no change in the processing gain have been introduced and therefore a different absolute calibration factor applies for data acquired before and after the transmit chirp BW increase. The plots below show the measured absolute calibration factor on IMM VV products before the mode optimisation and on IMM VV & HH products after the mode optimisation. Fig. 8. (Top) IMM Absolute calibration factor for products acquired before the BW increase and processed with PF-ASAR version lower than 3.03 (Bottom) IMM Absolute calibration factor for products acquired after the BW increase and processed with PF-ASAR version 3.03 or latter. The absolute calibration factor for data before the mode optimisation is 70.22 dB while it is 67.5 dB for data after the optimisation and processed with PF-ASAR 3.03 or after. IMM Azimuth Ambiguities The same problem with azimuth ambiguities already mentioned for IMS and IMP HH products exists also for IMM HH products. The distributed azimuth ambiguity ratio on IMM products is around –20 dB (the requirement being –25 dB). Similar to the IMP products, a test processing has been performed using only 4 looks in azimuth rather than the 10 looks nominally processed. The ambiguity ratio decreases to –24.5 dB but the ambiguities in the image are still clearly visible. The images below show the azimuth ambiguities in standard IMM HH products and on products processed using less than half of the azimuth BW. As for the other products, options to reduce the azimuth ambiguities are being investigated.
K - IMM orig. BW, VV
666870727476
0 5 10 15No of Measurements
dB
IS1IS2IS3IS4IS5IS6IS7
K - IMM new BW, VV & HH
666768697071
0 1 2 3 4No of measurements
dB
IS1IS4IS5IS6IS7

Page - 11 -
Fig. 9. IMM HH azimuth ambiguities (Left) Standard IMM processing with 10 azimuth looks. (Right) Special IMM processing with 4 azimuth looks. IMM Product quality evolution The quality evolution of IMM products is summarised in the table below:
Table 7. IMM product quality versus acquisition date and processing version.
6. WSM Product optimisation and product quality update The main characteristics of WSM Level 1 products are described below:
• Ground range projected detected products • Nominal resolution better than 150 m • Swath width: 406 Km • Pixel spacing 75 m • ENL > 12 for all the different subswaths
PF-ASAR version 3.01 & 3.02 3.03 3.01 & 3.02 3.03
IMMOK
(Nominal quality)OK
(Nominal quality)OK
(Nominal quality, dif.K)OK (Higher
ENL, dif.K)
Data Acquired Between 5-Sept. & 17-Oct. 2002 Data Acquired After 17-Oct. 2002
3354 ,IS5, HH 3354 ,IS5, HH, 4 looks

Page - 12 -
• Antenna pattern and range spreading loss correction applied • Data output as unsigned 16 bit • Systematic stripline processing: products as long as the complete acquisition segment
The WSM product quality has considerably evolved during the commissioning phase period. From the instrument point of view, two main changes have been performed, one related to the transmitted chirp BW and the other to the mode timeline. The initial products (before any instrument change) presented a range resolution close to 150 m, an azimuth resolution close to 90 m and an ENL lower than 12 (8 for SS1 to 6 for SS5). These products had a non-square resolution, high undersampling in azimuth (as the pixel spacing is fixed to 75 m) and a poor radiometric quality. A first WSM optimisation, based on the analysis performed by the Politecnico di Milano, was performed on the 13-08-02 to solve some of the above anomalies by increasing the transmitted chirp BW for all the beams. In addition, the increase in transmit BW has a very positive impact on the WSM InSAR performance. The table below show the original transmitted chirp BW and the new BW per each swath:
Table 8. Original and new transmitted chirp BW for all WSM beams.
The transmitted chirp BW decreases for the higher incidence angle beams in order to achieve a similar ground range resolution across the WSM range. More details on the WSM optimisation can be found in [R3]. The larger available BW has been used in the ground processor to increase the range look BW (i.e. to improve the range resolution) and also to increase thee number of range looks (i.e. increase the ENL) from 3 to 7. The table below shows the original and the new range look BW in PF-ASAR. The new range look BW was applied since PF-ASAR version 3.03.
Table 9. Original and new range look BW used for WSM Level 1 processing. Careful analysis of WSM products (acquired both before and after the increase in Tx. Chirp BW) revealed an additional quality anomaly: inter-burst ambiguities (~-21 dB) in SS1 and SS3 over high contrast scenes (usually over the Antarctica). An example of such effect can be observed in fig. 10.
SS1 SS2 SS3 SS4 SS5Original BW [MHz] 7.15 5.33 4.39 3.01 2.82
SS1 SS2 SS3 SS4 SS514.75 12.86 10.48 9.54 8.78(x2) (x2.4) (x2.4) (x3) (x3)New BW [MHz]
SS1 SS2 SS3 SS4 SS5initial range look BW [MHz] 2.66 2.05 1.77 1.61 1.5new range look BW [MHz] 3.35 2.8 2.38 2.06 1.9

Page - 13 -
Fig. 10. Inter-burst azimuth ambiguities in WSM products. The best solution to this problem was a change of the mode timeline, reducing the number of pulses per burst (except for SS1). At the same time, the reduced number of pulses per burst would worsen the azimuth resolution for SS2 to SS5, reducing the initially strong under-sampling rate in azimuth. The new mode timeline was implemented on-board on the 30-10-2002. The table below shows the original and the new WSM timeline:
Old timeline New timeline SS1 50 50 SS2 80 65 SS3 67 55 SS4 87 71 SS5 74 60
Table 10. Number of WSM pulses per burst.
The change in the mode timeline at instrument level did not require any modification in the ground processor. Only the auxiliary file containing the number of pulses per burst had to be updated (ASA_INS_AX). As a result of these mode optimisations, the quality of WSM products has dramatically improved. No examples of IM-WSM interferometry are yet available with the new settings but an increase of the InSAR performance is also anticipated. The new WSM products have an almost square resolution around 110 m-120 m. They are still under-sampled although the under-sampling ratio has improved. In order to derive the most
WSM 2703

Page - 14 -
reliable product quality results, IRF measurements over the ASAR transponders are currently performed on over-sampled products with a pixels spacing of 40 m. These products are generated using the stand-alone PF-ASAR facility available at ESRIN. The plots below show the range and azimuth resolution of the “final” WSM products. As it can be observed the range resolution remains within 110-130 m for all swaths except near range of SS1, as expected. The azimuth resolution is presented versus the orbit number to emphasize the change in resolution between data acquired before and after the mode timeline change (before and after orbit 3483).
Fig.11. WSM range and azimuth resolution after the Tx.chirp BW increase and the mode timeline change. Products generated with PF-ASAR version 3.03 and with 40 m pixel spacing. The expected increase in ENL after the increase in the number of range looks has been confirmed over homogeneous areas of new WSM products. The table below shows the ENL measured on original products and the ENL measured on products acquired after mode optimisation:
Table 11. Comparison between ENL measured on initial WSM products and on WSM products acquired after the mode optimisation and processed with PF-ASAR 3.03. WSM absolute calibration The WSM absolute calibration factor has been derived from measurements over the ASAR transponders and compared with the values derived over the Amazon rain forest, assuming gamma equal to –6.4 dB over this area.
WSM rg.resolution VV & HH
90
100
110
120
130
140
150
14 24 34 44
inc. anglr [deg]
rg. r
es. [
m]
SS1
SS2
SS3
SS4
SS5
WSM Az. res. VV & HH
80
90
100
110
120
3100 3300 3500 3700 3900
orbit number
az. r
es. [
m]
Az. Res
Az.res (orig.)
initial ENL new ENLSS1 8.3 15.3SS2 8.1 15.8SS3 8.2 16.2SS4 6 16.1SS5 6.1 16.5

Page - 15 -
The plot below shows the absolute calibration factor derived over the ASAR transponders from VV and HH products.
Fig. 12. WSM absolute calibration factor derived over the ASAR transponders for data acquired after the mode optimisation and processed with PF-ASAR 3.03. The mean absolute calibration factor from the transponder measurements is presented in the table below:
Table 12. Absolute calibration factor for HH & VV WSM product acquired after the mode optimisation and processed with PF-ASAR 3.03 The mean absolute calibration factor derived over the rain forest scenes is 69.08 dB, i.e. in very good agreement with the result from the transponders.
7. Conclusions
The results presented in this paper are rather preliminary as they are based on a limited number of products. However, they allow deriving some main conclusions about the quality of IM and WSM products:
• The increase of Tx. Chirp BW for Image Mode and the corresponding changes introduced in PF-ASAR 3.03 have improved the IMS and IMM product quality as well as the IM InSAR performance. The quality of these products can be regarded now as stable.
• The increase of Tx. Chirp BW has been transparent for IMP products. It is however planned to take advantage of the new BW to performed multi-look in range and to increase the product number of looks (ENL).
• WSM optimizations provide a dramatic improvement of product quality in terms of resolution and ENL, as well as better InSAR performance. The quality of these products can be regarded now as stable.
• Quality results for HH polarization are equivalent to those for VV polarization for any mode and product type. The unique difference observed between both polarizations is the more visible azimuth ambiguities for IM HH products.
• A preliminary absolute calibration factor is available for IM and WSM products. In most of the cases, adjustments in the processor gain have been performed to maintain the same value as for data acquired before the modes optimization.
K: WSM final settings (VV & HH)
6767.5
6868.5
6969.5
70
3100 3300 3500 3700 3900orbit
K [d
B]
K (HH)
K (VV)
HH VV AllMean K [dB] 68.85 68.95 68.88K Std.dev. [dB] 0.59 0.33 0.50

Page - 16 -
8. References [R1] B. Rosich. ASAR IMS and WVI product quality. ENVISAT CAL/VAL Review. ESTEC, September 2002. [R2]: P. Meadows & P. Wright. ASAR IMP Image quality (VV Polarization). ENVISAT CAL/VAL Review. ESTEC, September 2002. [R3]: A. Monti-Guarnieri. ASAR WSM mode product status. ENVISAT CAL/VAL Review. ESTEC, September 2002.