Embed Size (px)
Citation preview
Polymer Coated Superparamagnetic Beads Walking on Polymer CoatedSurface
by
Stephanie E Moran
Submitted to the Department of MaterialsScience and Engineering in Partial
Fulfillment of the Requirements for theDegree of
Bachelor of Science
at the
Massachusetts Institute of Technology
ARCHIESMASSACHUSETTS INSTMTUTE
OF TECHNOLOGY
JUL 0 6 2012
LIBRARIES
June 2012
@ 2012 Stephanie MoranAll rights reserved
The author hereby grants to MIT permission to reproduce and to distribute publiclypaper and electronic copies of this thesis document in whole or in part in any
medium now known or hereafter created.
Signature of Author: (,/ 4Department of Material Science and Engineering
May 11, 2012
Certified by:.
Assistant Professor of MaterialsAlfredo Alexander-Katz
Science and EngineeringThesis Supervisor
I i
Accepted by: I::
I i' / Jeffrey GrossmanCarl Richard Soderberg Associate Professor of Power Engineering
Chairman, Committee for Undergraduate Students
1
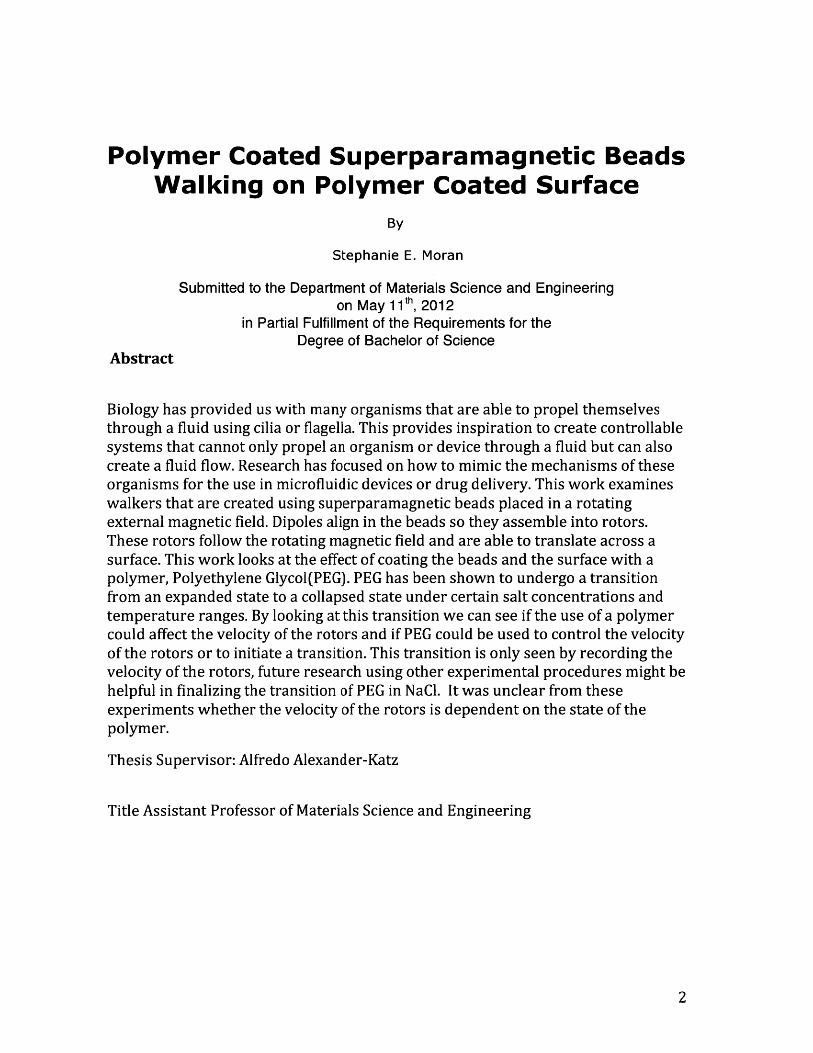
Polymer Coated Superparamagnetic BeadsWalking on Polymer Coated Surface
By
Stephanie E. Moran
Submitted to the Department of Materials Science and Engineeringon May 1 1th 2012
in Partial Fulfillment of the Requirements for theDegree of Bachelor of Science
Abstract
Biology has provided us with many organisms that are able to propel themselvesthrough a fluid using cilia or flagella. This provides inspiration to create controllablesystems that cannot only propel an organism or device through a fluid but can alsocreate a fluid flow. Research has focused on how to mimic the mechanisms of theseorganisms for the use in microfluidic devices or drug delivery. This work examineswalkers that are created using superparamagnetic beads placed in a rotatingexternal magnetic field. Dipoles align in the beads so they assemble into rotors.These rotors follow the rotating magnetic field and are able to translate across asurface. This work looks at the effect of coating the beads and the surface with apolymer, Polyethylene Glycol(PEG). PEG has been shown to undergo a transitionfrom an expanded state to a collapsed state under certain salt concentrations andtemperature ranges. By looking at this transition we can see if the use of a polymercould affect the velocity of the rotors and if PEG could be used to control the velocityof the rotors or to initiate a transition. This transition is only seen by recording thevelocity of the rotors, future research using other experimental procedures might behelpful in finalizing the transition of PEG in NaCl. It was unclear from theseexperiments whether the velocity of the rotors is dependent on the state of thepolymer.
Thesis Supervisor: Alfredo Alexander-Katz
Title Assistant Professor of Materials Science and Engineering
2
TABLE OF CONTENTS
1.Introduction... ...... ... ...... ... .... .. . .. ... mm mm mm .......o.m...5
1.1 Problem Statem ent.......................................................5
1.2 Assem bly of Rotors.................................................. 7
1.3 Beads and Surface Interaction................................9
1.4 Biotin-Streptavidin Interaction.............................12
2. Experimental Methods .... ............................. 4
2.1 Experim ental Setup............................................... 14
2.2 Setup for Polymer Coated Surface........................17
3. Results and Discussion...... .. .. .. .. .. .. .. . ....20
3.1 Variance of Temperature and Salt Concentration...20
3.2 Frequency Dependence............................................25
4. Conclusions and Future Work......................28
References ..... ... ... ..m E m.... ... .. .... ......... ... ... ... .. .. .30
3
List of Figures
Figure 1: Organisms that Propel Through a Liquid...............5
Figure 2: Assembled Rotors......................................7
Figure 3: Polyethylene Glycol Structure........................9
Figure 4: Extended Polymer State.................................10
Figure 5: Collapsed Polymer State.............................11
Figure 6: Methoxyl PEG-Biotin Structure......................11
Figure 7: Streptavidin Structure...................................12
Figure 8: Microscope Setup.......................................14
Figure 9: Image of Doublet.....................................18
Figure 10: Raw Data of Doublet Position....................19
Figure 11: First Set of Results for Varying Temperature. ..... 20and NaCl Concentrations
Figure 12: Second Set of Results for Varying................21Temperature and NaCl Concentrations
Figure 13: Combination of Figure 10 and Figure 11..........22
Figure 14: Collapse of PEO-PPO-PEO for Varying...... 23Temperature and Concentration
Figure 15: Velocity vs. Friction................................24
Figure 16: Velocity vs. Frequency ............................. 26
Figure 17: Velocity vs. Frequency for Varying..................27Downward Force
4
1. Introduction
1.1 Problem Statement
Biology has provided many examples of mechanisms that allow organisms to
propel through a liquid.' These biological systems provide an interesting source of
inspiration for this research. Unfortunately we do not have the ability to precisely
V~iAV,
ruocus(0190),
14- , Cycods
lprerr
a
Coccedium(sporozoon)
T remor ode
Figure 1. Organisms that usFluid Mech. (1977).)2
Arbacio Croyfish(Iso urchin)
Round-Worm
T c 04
-T dfsh
. Salomander
ecLOtheslac fowl
e flagella and cilia to propel through a fluid (C. Brennen, Ann. Rev.
control the mechanics and behavior of most biological propulsion systems. We can
only use these propulsion systems as a model for our own systems. There has been
extensive research to understand how these organisms propel themselves using
flagella and cilia. By using an oscillatory mechanism these organisms can translate
in a fluid. These mechanisms have been used recently in biomimetic devices.3 ,4,, 6,7 It
is important to understand how these systems function close to the surface when
5
we have a low Reynold's number condition. At low Reynolds number conditions
there is only laminar flow, due to the dominance of the viscous forces.
This research focuses on the self assembly of superparamagnetic particles on
a surface. These particles assemble into rotors in the presence of an external
magnetic field. The magnetic field creates dipoles in each of the beads and as a
result the beads align into a chain. By rotating the magnetic field these rotors follow
the field and rotate. A no-slip boundary condition near the surface breaks the
symmetry conditions and allows the chains to rotate.8 As the chains rotate they also
create a controlled fluid flow. Altering the frequency and strength of the external
magnetic field can precisely control these rotors. Previous research has shown that
the surface interaction and frequency of these rotors plays a large role in the speed
of the rotors.9"10 It was shown that with an increase in a downward force on the
rotors resulted in a reversal motion of the rotors.9 The increase in the downward
force could be interpreted as an increase in surface friction force between the beads
and the surface. This research focuses on the surface interaction of these rotors. By
coating the beads and surface in Polyethylene glycol (PEG) we observe how this
affects the velocity of the rotors. The PEG provides a system where the beads are
greatly slipping. We also look at how temperature affects the extension of the
polymer and how this affects the velocity of the rotors. These rotors could
potentially be used for drug delivery or to drive fluid flow in microfluidic devices.
6
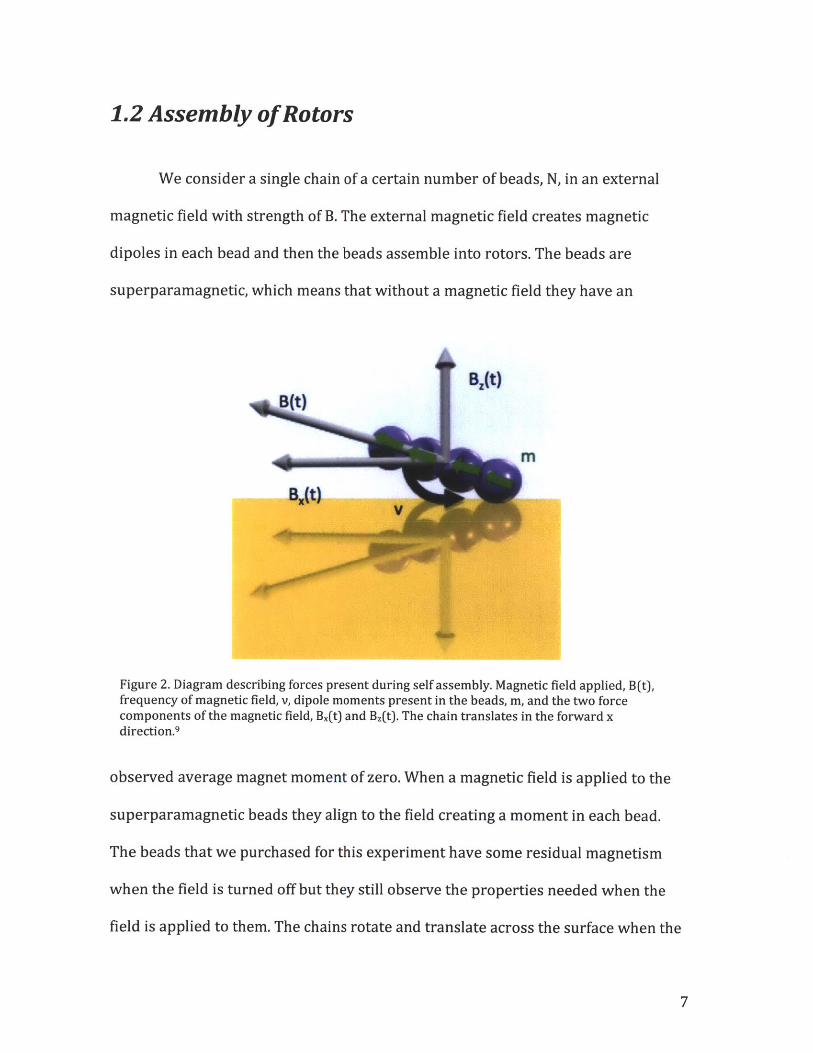
1.2 Assembly of Rotors
We consider a single chain of a certain number of beads, N, in an external
magnetic field with strength of B. The external magnetic field creates magnetic
dipoles in each bead and then the beads assemble into rotors. The beads are
superparamagnetic, which means that without a magnetic field they have an
Figure 2. Diagram describing forces present during self assembly. Magnetic field applied, B(t),frequency of magnetic field, v, dipole moments present in the beads, m, and the two forcecomponents of the magnetic field, Bx(t) and Bz(t). The chain translates in the forward xdirection.9
observed average magnet moment of zero. When a magnetic field is applied to the
superparamagnetic beads they align to the field creating a moment in each bead.
The beads that we purchased for this experiment have some residual magnetism
when the field is turned off but they still observe the properties needed when the
field is applied to them. The chains rotate and translate across the surface when the
7
magnetic field is rotated in the x-z plane at a frequency, v. Refer to figure 2 for the
translation of the rotor and the force present due to the external magnetic field
present. Chains rotating in a clockwise fashion translate in the forward x direction.
It has been shown in previous research that the translational velocity is greatly
dependent on N, B and v. Due to this, in this research we keep at least two of these
variables constant in order to isolate the surface interaction present. The magnet
moment in each bead can be defined as:
m = B.9,10go
Where Vc is the effective volume of the bead defined as V = 47ra3f where f is the3
fraction of the bead that is paramagnetic, a is the diameter of the bead and AX is the
difference in magnetic susceptibility between the bead and the medium it's placed in.
In this research we will be looking at a constant field of 10 mT, a frequency of
5 hz and 2 beads for the temperature variant experiments. We will also scan
frequencies with a constant temperature and a constant field of 10 mT. This
research will focus on this temperature and frequency change and how this affects
the velocity of the rotors. The temperature change will allow us to see if the
collapse of the polymer affects the interaction between the rotors and the surface.
8
1.3 Beads and Surface Interaction
The superparamagnetic beads are purchased from Solulink. The beads come
already coated in streptavidin. The beads have a diameter of 2.8 [m with a
Polystyrene core that is encapsulated in an Iron magnetite central layer. The beads
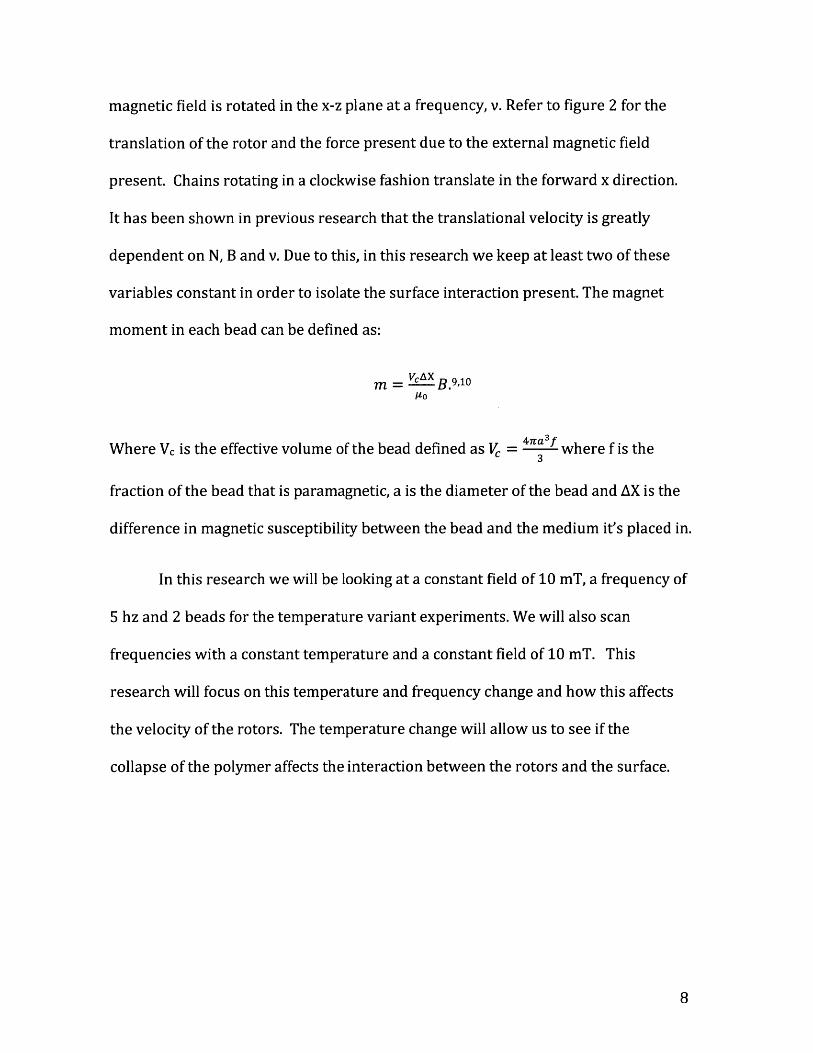
are put in a solution of Polytheylene Glycol-biotin. Polyethylene Glycol is polymer
nFigure 3. Polyethylene Glycol chemical structure.
that undergoes a transition from a collapsed state to an expanded state under
certain temperature and salt concentrations. The structure of PEG is seen in figure 3
this unique structure is what allows this transition to occur. PEG is soluble in water
and other polar solvents and is not soluble in nonpolar solvents. In this experiment
we use PEG with a molecular weight of 5000. Other research has shown that block
copolymers like PEG collapse under certain temperature and salt
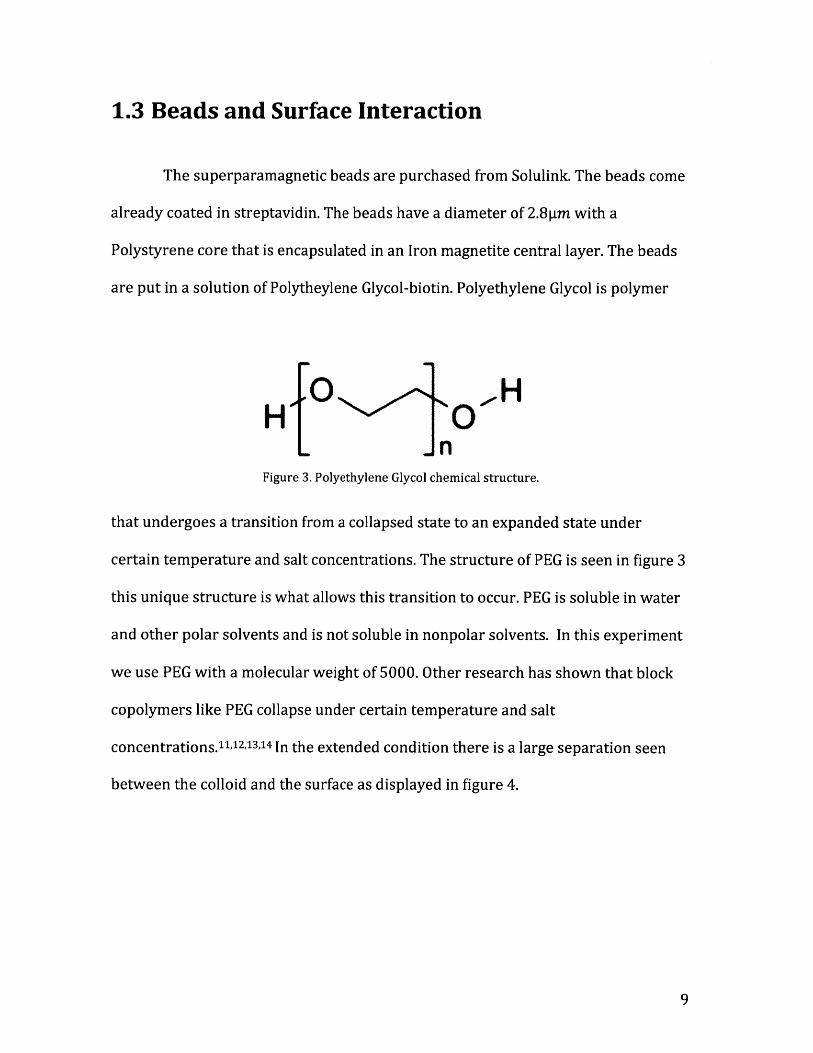
concentrations.11,2 ,3 , 4 In the extended condition there is a large separation seen
between the colloid and the surface as displayed in figure 4.
9
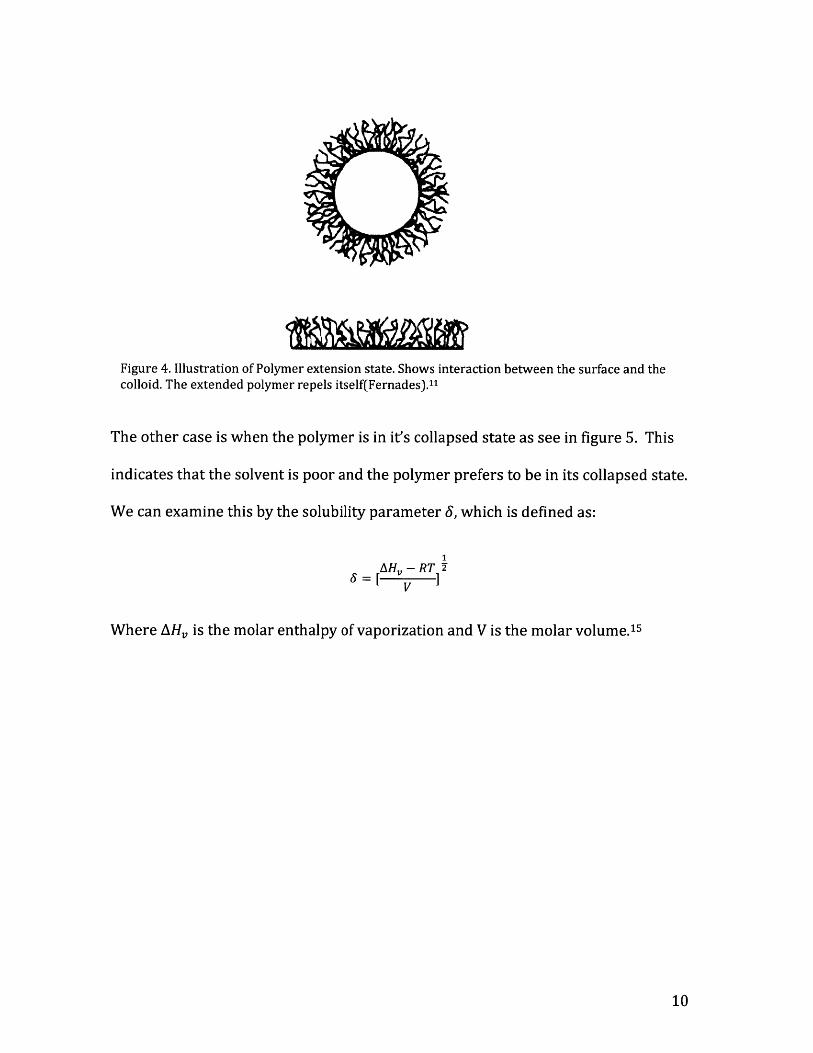
Figure 4. Illustration of Polymer extension state. Shows interaction between the surface and thecolloid. The extended polymer repels itself(Fernades)."
The other case is when the polymer is in it's collapsed state as see in figure 5. This
indicates that the solvent is poor and the polymer prefers to be in its collapsed state.
We can examine this by the solubility parameter 6, which is defined as:
1
AH, - RT Y
Where AH, is the molar enthalpy of vaporization and V is the molar volume.15
10
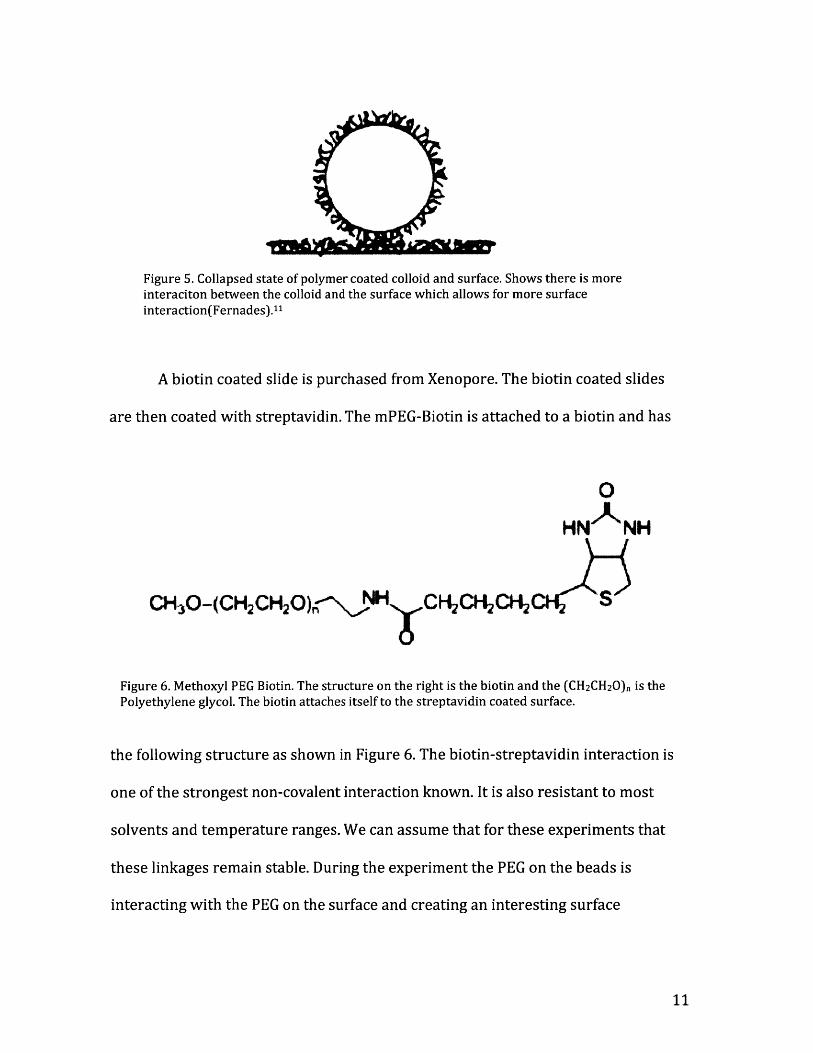
Figure 5. Collapsed state of polymer coated colloid and surface. Shows there is moreinteraciton between the colloid and the surface which allows for more surfaceinteraction(Fernades).11
A biotin coated slide is purchased from Xenopore. The biotin coated slides
are then coated with streptavidin. The mPEG-Biotin is attached to a biotin and has
0
HN' 'NH
CH30-(CH2CH 2O)CXNH CH2CHI 2 S
Figure 6. Methoxyl PEG Biotin. The structure on the right is the biotin and the (CH2CH20)n is thePolyethylene glycol. The biotin attaches itself to the streptavidin coated surface.
the following structure as shown in Figure 6. The biotin-streptavidin interaction is
one of the strongest non-covalent interaction known. It is also resistant to most
solvents and temperature ranges. We can assume that for these experiments that
these linkages remain stable. During the experiment the PEG on the beads is
interacting with the PEG on the surface and creating an interesting surface
11
chemistry as described earlier. From previous work it has been shown that the
surface friction plays a significant role in the velocity and direction of the beads. 9
1.4 Biotin-Streptavidin Interaction
This interaction was discovered in 1941 and is commonly regarded as the
strongest non-covalent interaction present. Streptavidin is a bacterial homologous
N
N C
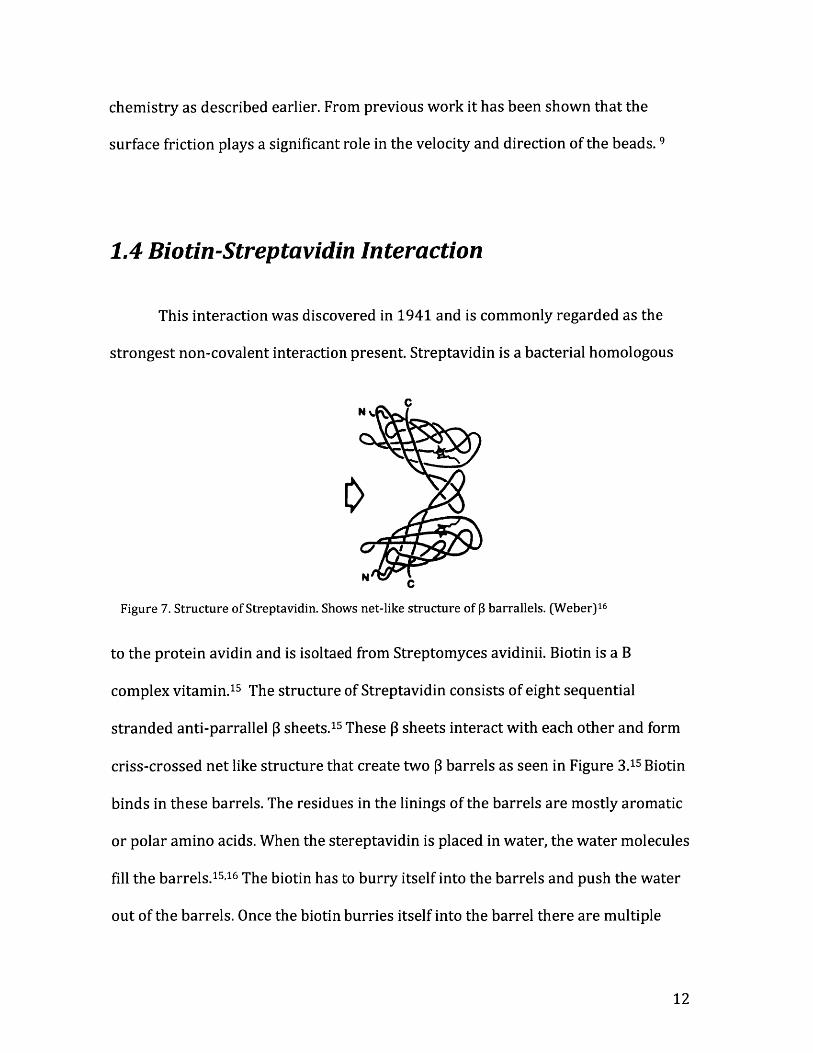
Figure 7. Structure of Streptavidin. Shows net-like structure of s barrallels. (Weber)16
to the protein avidin and is isoltaed from Streptomyces avidinii. Biotin is a B
complex vitamin. 15 The structure of Streptavidin consists of eight sequential
stranded anti-parrallel P sheets.15 These P sheets interact with each other and form
criss-crossed net like structure that create two P barrels as seen in Figure 3.15 Biotin
binds in these barrels. The residues in the linings of the barrels are mostly aromatic
or polar amino acids. When the stereptavidin is placed in water, the water molecules
fill the barrels.15 ,16 The biotin has to burry itself into the barrels and push the water
out of the barrels. Once the biotin burries itself into the barrel there are multiple
12

hydrogen bonds created and even some hydrophobic interactions. The burrying
mechanism of this interaction allows for a very strong interaction that can
withstand most tempartures and pH values. The biotin-streptavidin has been
observed to withstand temperatures as high as 70 degrees celcius. 5a,18
13
2. Experimental Methods
2.1 Experimental Setup
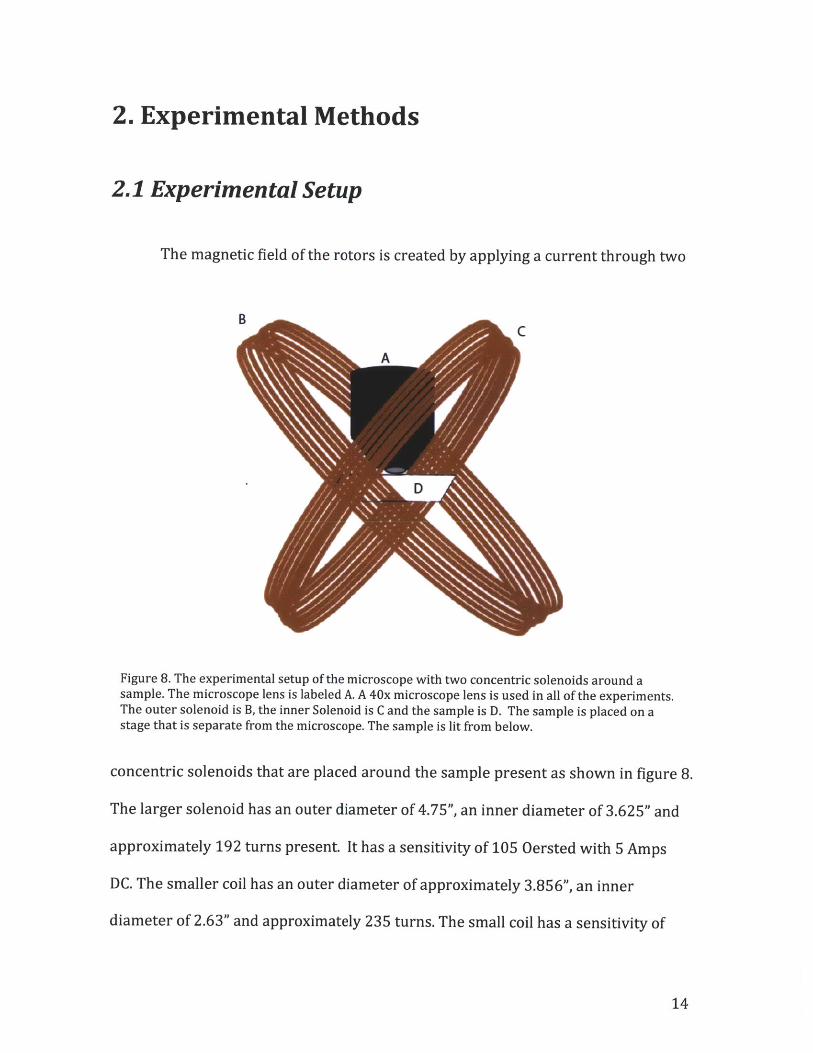
The magnetic field of the rotors is created by applying a current through two
B
Figure 8. The experimental setup of the microscope with two concentric solenoids around asample. The microscope lens is labeled A. A 40x microscope lens is used in all of the experiments.The outer solenoid is B, the inner Solenoid is C and the sample is D. The sample is placed on astage that is separate from the microscope. The sample is lit from below.
concentric solenoids that are placed around the sample present as shown in figure 8.
The larger solenoid has an outer diameter of 4.75", an inner diameter of 3.625" and
approximately 192 turns present It has a sensitivity of 105 Oersted with 5 Amps
DC. The smaller coil has an outer diameter of approximately 3.856", an inner
diameter of 2.63" and approximately 235 turns. The small coil has a sensitivity of
14
170 Oersted with Samps DC. The wire that the coils are constructed from is Teflon
coated in order to ensure that they will be resistant to the heat that is produced
from the current. A sinusoidal function is driven through the coils and is offset so
that a rotating magnetic field is produced. This field rotates parallel to the sample
allowing the rotors to walk in the horizontal direction of the microscope view.
The coils were constructed with help of Mike Tarkanian. Two plastic
mandrels were made that were mounted onto a lathe where the coils were wrapped,
then the mandrel could be dissembled and the coils removed. Winding the coils on
the lathe allowed for the maximum turns per area. Mike also helped make Teflon
bases to mount onto the microscope to ensure that the coils stay in place during
experiments and do not conduct heat to the microscope.
The microscope slide is placed on a manufactured piece of plastic that is
attached to a Newport MT Series XYZ mount. This allows for the microscope slide to
be precisely moved in order to focus the sample. The mount is separate from the
microscope in order to ensure that it doesn't affect the coils. The mount is attached
to a Newport Optic grid and the microscope is placed on top of that as well. This is
all placed on a nano-k Vibration Isolation stage by minus k Technology. This makes
sure that there is no vibration in the sample from the table it is placed on. This
vibration stage was borrowed from Matt Humbert.
The sinusoidal function is driven with a Quadrature Oscillator that was made
for this experiment with the help of David Bono. This device controls the magnitude
of the field and the frequency of the field produced. The device allows frequencies
15
ranging from hertz to kilohertz. The device also allows the magnitude of the two
signals to be aligned accordingly in order to ensure that the two signals are of equal
magnitude. The setup also allows the two signals to be offset, if that is what an
experiment requires.
The signal is put through a HP 54601A Oscilloscope where the frequency of
the field is measured. The current also goes through an analog oscilloscope that
allows us to proportionally determine the approximate magnitude of the magnetic
field present. The current is produced by a Crown DC-300A series II amplifier and
then the current is driven through two 2 Ohm resistors in parallel that create a
proportional 1 Ohm resistance. The current is driven through the oscillator and then
the oscilloscope and then into the coils.
The sample is placed in the center of the two coils in order to assure that the
sample has the strongest magnetic field. A 40x magnification is used for all of the
experiments. The size of the beads is known and is used to calibrate the image. A
multi-meter is placed on the sample in order to record the temperature. The multi-
meter is placed as close to the sample as possible in order to get the most accurate
temperature reading possible. The temperature is hand recorded along with the
timestamp of the video in order assure the velocities are recorded with their
corresponding temperature. The microscope feed is recorded through a computer.
The video is then processed using tracking software to record the velocity of the
rotors.
16
2.2 Setup for Polymer Coated Surface
Biotinated slides are purchased from Xenopore. These slides are then coated
with streptavidin. Cover slides are placed onto biotin coated slides with double
sided tape and a horizontal channel is left on the slide. The streptavidin is purchased
and diluted. The biotin and streptavidin interaction is one of the strongest non-
covalent bonds present as described earlier. The slides are left with streptavidin for
one hour. After an hour the streptavidin is removed and mPEG-Biotin is put onto the
sample. The streptavidin is removed by placing a kimwipe on the edge of the cover
slip and absorbing the streptavidin. The mPEG-Biotin creates another biotin-
streptavidin interaction leaving the surface coated with PEG. The mPEG-Biotin is
also left on the sample for one hour in order to assure that the surface is fully coated
with PEG.
Streptavidin coated superparamagnetic beads that are purchased from
Solulink are also coated with PEG. Equal parts Biotin-mPEG and streptavidin-coated
beads are put together and then 1mI of water is also added. For these experiments
20 microliters of Biotin-mPEG and 20 microliters of diluted beads are placed in 1ml
of water. The diluted beads are made from 10 microliters 10mg/ml solution with 1
ml of water. The PEG coated beads are then put onto the surface for one hour. This
is in order to allow for the liquid to mostly evaporate leaving just the beads on the
surface to make sure that the salt concentration is correct. Then the appropriate
solution of NaCl is added to the surface. This is left for around 10 minutes to ensure
that there isn't a concentration gradient present on the slide.
17
The sample is placed under the microscope and then attached to the stage to
ensure the sample doesn't move during the experiment. This is usually done with
electrical tape. The frequency of the field is set to 5hz and the strength of the field is
maximized around 10 mT. The thermocouple is attached to the slide in order to
record the temperature of the sample. A heat lamp is placed approximately 8" from
the sample and put on it's lowest setting. The temperature is hand recorded during
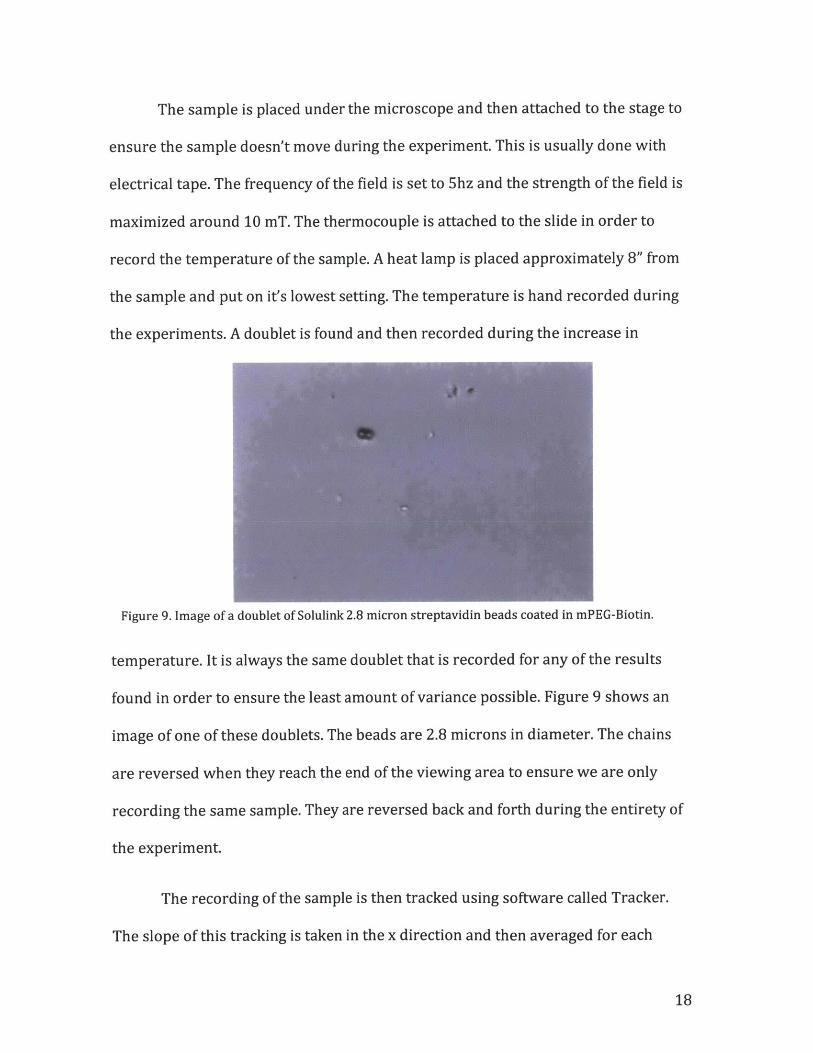
the experiments. A doublet is found and then recorded during the increase in
Figure 9. Image of a doublet of Solulink 2.8 micron streptavidin beads coated in mPEG-Biotin.
temperature. It is always the same doublet that is recorded for any of the results
found in order to ensure the least amount of variance possible. Figure 9 shows an
image of one of these doublets. The beads are 2.8 microns in diameter. The chains
are reversed when they reach the end of the viewing area to ensure we are only
recording the same sample. They are reversed back and forth during the entirety of
the experiment.
The recording of the sample is then tracked using software called Tracker.
The slope of this tracking is taken in the x direction and then averaged for each
18
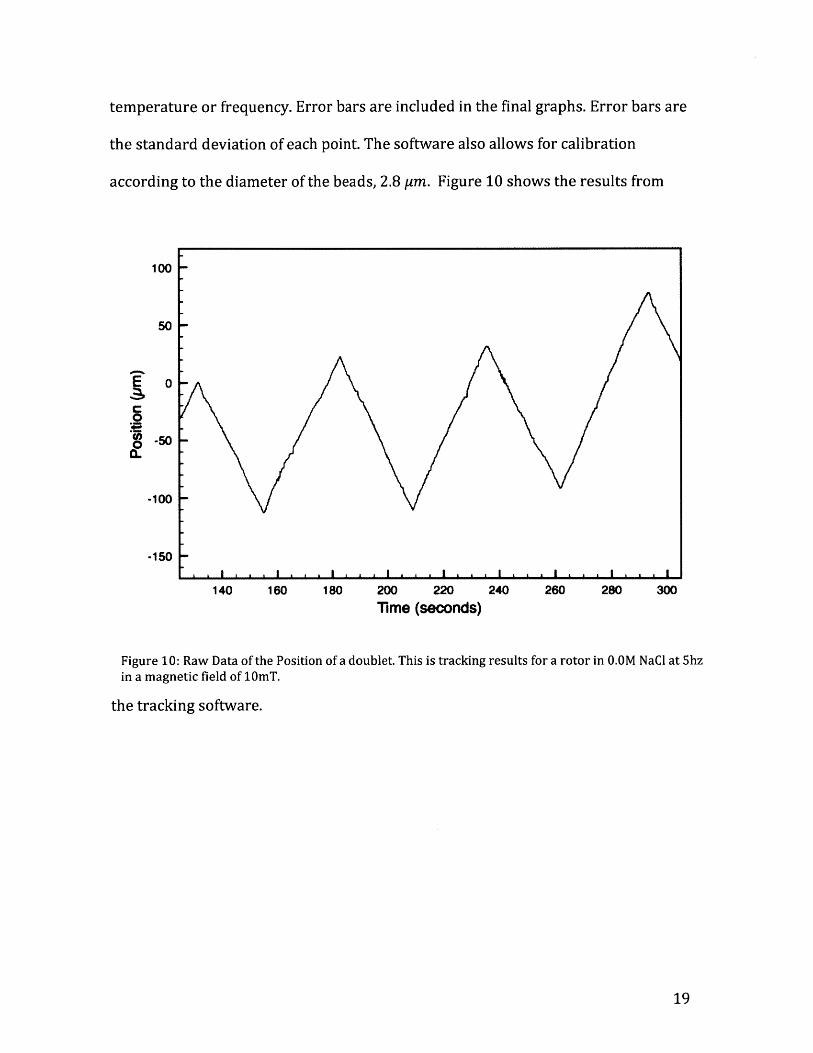
temperature or frequency. Error bars are included in the final graphs. Error bars are
the standard deviation of each point. The software also allows for calibration
according to the diameter of the beads, 2.8 ym. Figure 10 shows the results from
100
50
0-
0
0
-50
-100
-150
140 160 180 200 220 240 260 280 300Time (seconds)
Figure 10: Raw Data of the Position of a doublet. This is tracking results for a rotor in O.OM NaCl at 5hzin a magnetic field of 10mT.
the tracking software.
19
3. Results and Discussion
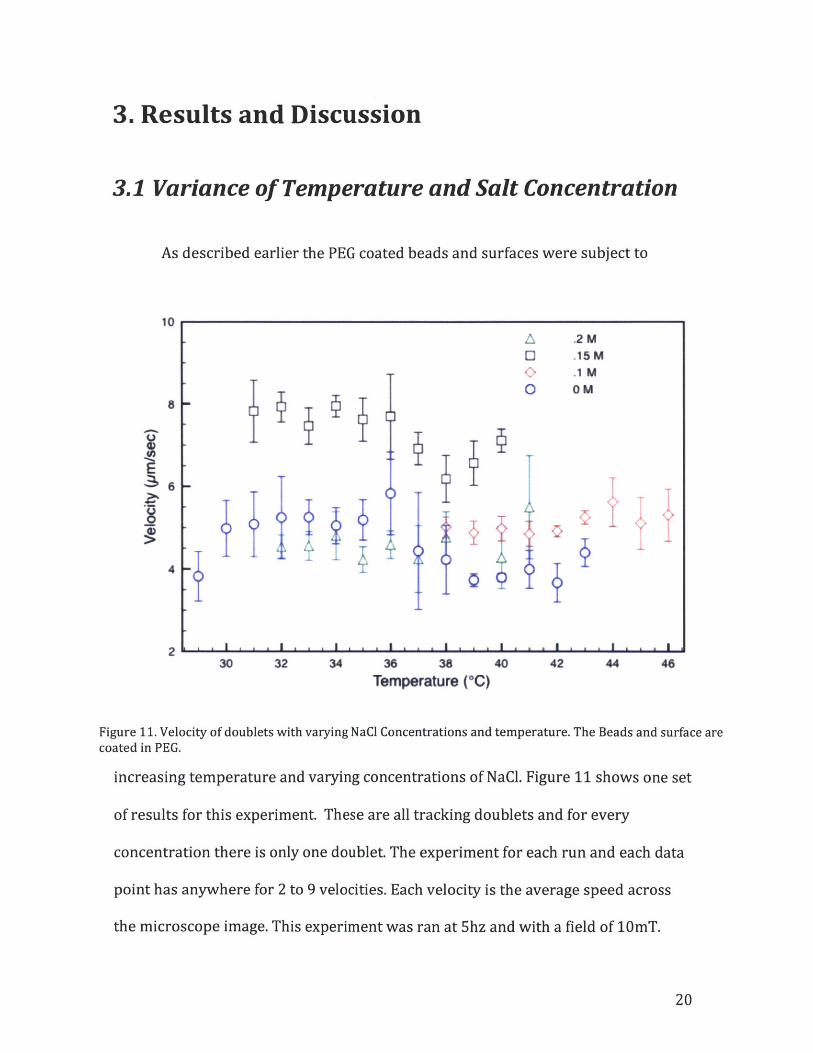
3.1 Variance of Temperature and Salt Concentration
As described earlier the PEG coated beads and surfaces were subject to
10.
8
6
4
.2 M
.15 M
.1 MOM
fi
I T.{}i~{
IAiii
0
4 -
0
I
30 32 34 36 38Temperature (*C)
40 42 44 46
Figure 11. Velocity of doublets with varying NaCl Concentrations and temperature. The Beads and surface arecoated in PEG.
increasing temperature and varying concentrations of NaCl. Figure 11 shows one set
of results for this experiment. These are all tracking doublets and for every
concentration there is only one doublet. The experiment for each run and each data
point has anywhere for 2 to 9 velocities. Each velocity is the average speed across
the microscope image. This experiment was ran at 5hz and with a field of 10mT.
20
3
2a a k a . I i . . I a a a I . . . I A A , I i , A I
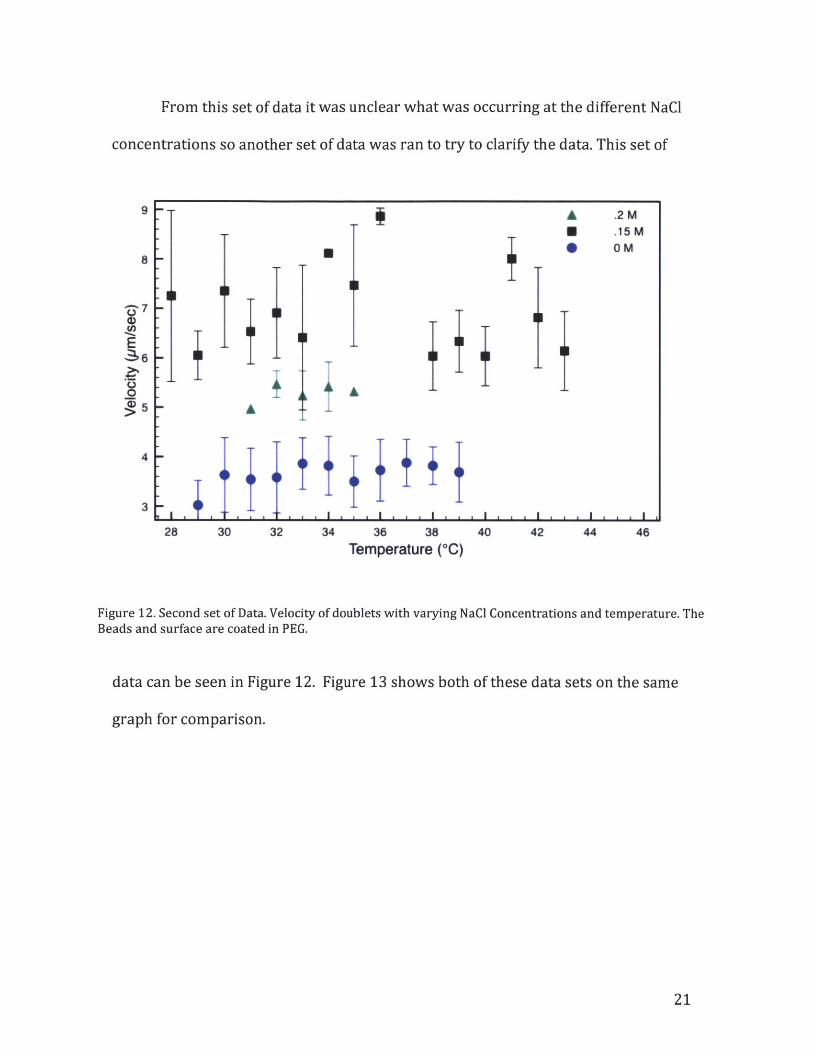
From this set of data it was unclear what was occurring at the different NaCl
concentrations so another set of data was ran to try to clarify the data. This set of
9
8
7
E$6
4
3
28 30 32 34 36 38
Temperature (*C)40 42 44 46
Figure 12. Second set of Data. Velocity of doublets with varying NaCl Concentrations and temperature. TheBeads and surface are coated in PEG.
data can be seen in Figure 12. Figure 13 shows both of these data sets on the same
graph for comparison.
21
A .2 M.15M
-M
± 4AA
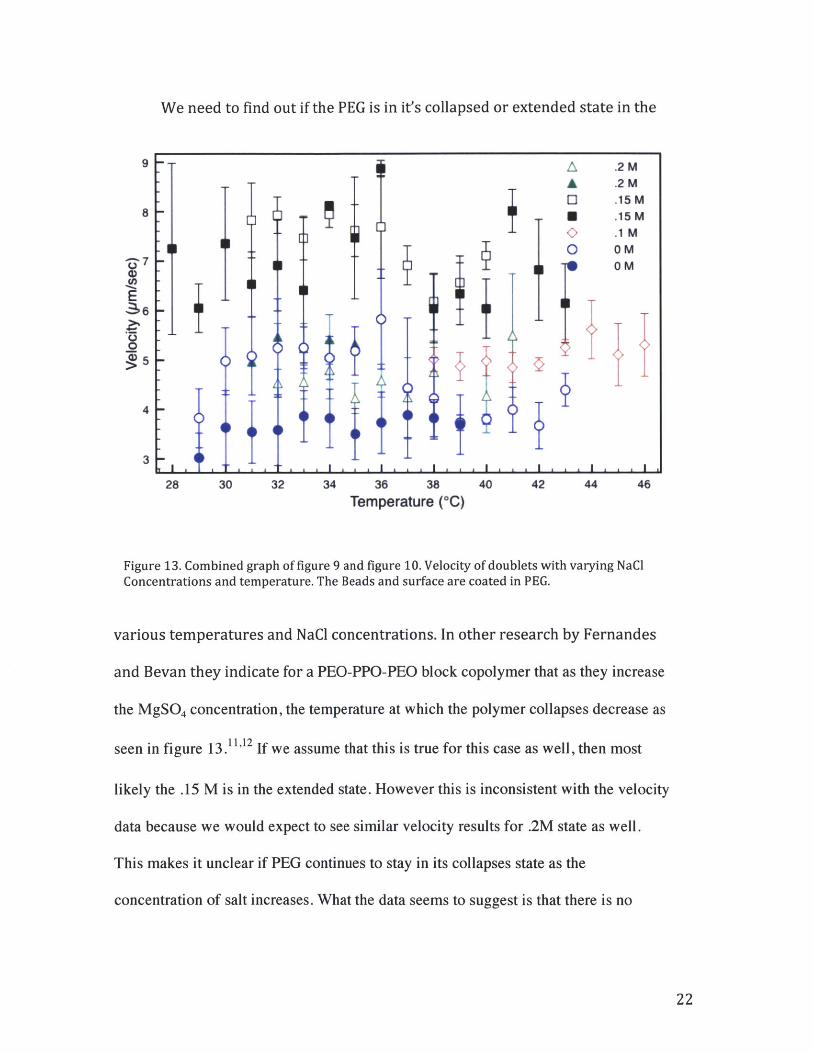
We need to find out if the PEG is in it's collapsed or extended state in the
A .2 MA .2 M0 .15 M
.15 M
.1 MOO M0 OM
OM
.+-J~L.
28 30 32 34 36 38
Temperature (*C)40 42 44 46
Figure 13. Combined graph of figure 9 and figure 10. Velocity of doublets with varying NaClConcentrations and temperature. The Beads and surface are coated in PEG.
various temperatures and NaCl concentrations. In other research by Fernandes
and Bevan they indicate for a PEO-PPO-PEO block copolymer that as they increase
the MgSO 4 concentration, the temperature at which the polymer collapses decrease as
seen in figure 13.11,12 If we assume that this is true for this case as well, then most
likely the .15 M is in the extended state. However this is inconsistent with the velocity
data because we would expect to see similar velocity results for .2M state as well.
This makes it unclear if PEG continues to stay in its collapses state as the
concentration of salt increases. What the data seems to suggest is that there is no
22
9
8
117
ES6
4
3
. .WA
(a) s
so
S40
A A
is 20 30 40 50
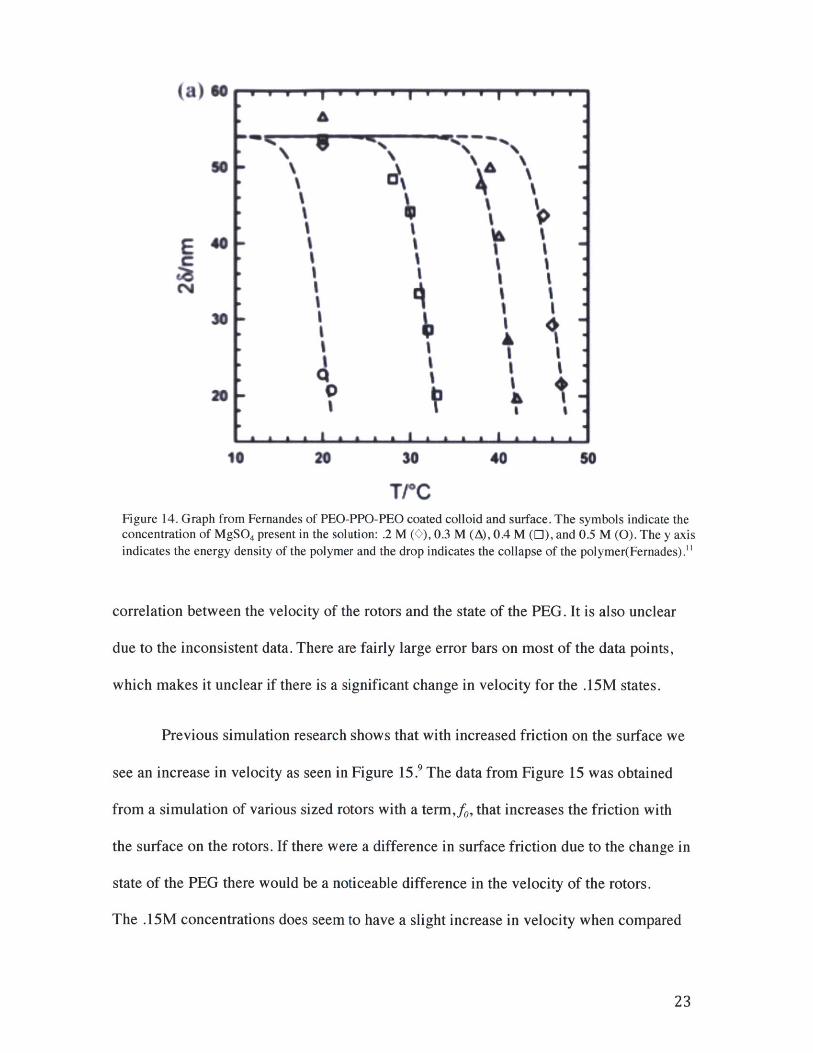
T/CFigure 14. Graph from Fernandes of PEO-PPO-PEO coated colloid and surface. The symbols indicate theconcentration of MgSO 4 present in the solution: .2 M (O), 0.3 M (A), 0.4 M (E), and 0.5 M (0). The y axisindicates the energy density of the polymer and the drop indicates the collapse of the polymer(Fernades)."
correlation between the velocity of the rotors and the state of the PEG. It is also unclear
due to the inconsistent data. There are fairly large error bars on most of the data points,
which makes it unclear if there is a significant change in velocity for the .15M states.
Previous simulation research shows that with increased friction on the surface we
see an increase in velocity as seen in Figure 15.9 The data from Figure 15 was obtained
from a simulation of various sized rotors with a term,fo, that increases the friction with
the surface on the rotors. If there were a difference in surface friction due to the change in
state of the PEG there would be a noticeable difference in the velocity of the rotors.
The .15M concentrations does seem to have a slight increase in velocity when compared
23
A A
20
944
I
I AI
II
pI
I A A ft A I A
.
44 44
9~'
I I
'4I I
S I
& ft * I A A * A
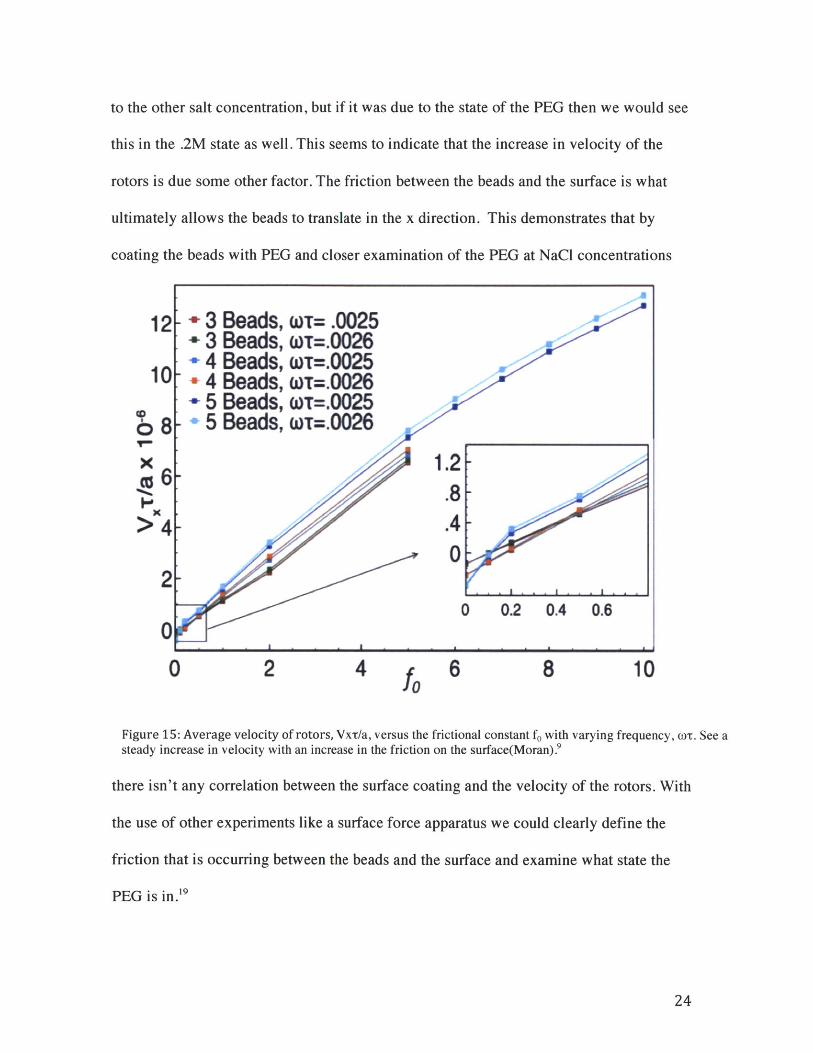
to the other salt concentration, but if it was due to the state of the PEG then we would see
this in the .2M state as well. This seems to indicate that the increase in velocity of the
rotors is due some other factor. The friction between the beads and the surface is what
ultimately allows the beads to translate in the x direction. This demonstrates that by
coating the beads with PEG and closer examination of the PEG at NaCl concentrations
1
X
X-
0 2 4 f 6 810
10
Figure 15: Average velocity of rotors, Vx-r/a, versus the frictional constant fo with varying frequency, otr. See asteady increase in velocity with an increase in the friction on the surface(Moran).9
there isn't any correlation between the surface coating and the velocity of the rotors. With
the use of other experiments like a surface force apparatus we could clearly define the
friction that is occurring between the beads and the surface and examine what state the
PEG is in. 9
24
3.2 Frequency Dependence
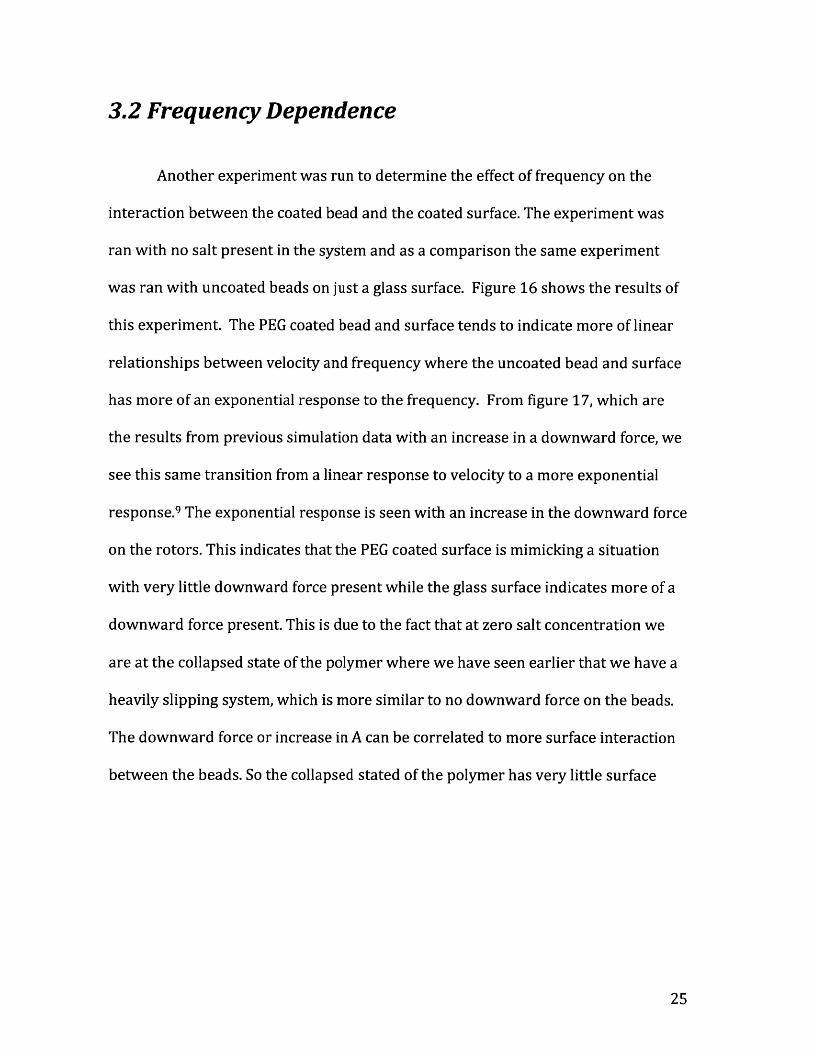
Another experiment was run to determine the effect of frequency on the
interaction between the coated bead and the coated surface. The experiment was
ran with no salt present in the system and as a comparison the same experiment
was ran with uncoated beads on just a glass surface. Figure 16 shows the results of
this experiment. The PEG coated bead and surface tends to indicate more of linear
relationships between velocity and frequency where the uncoated bead and surface
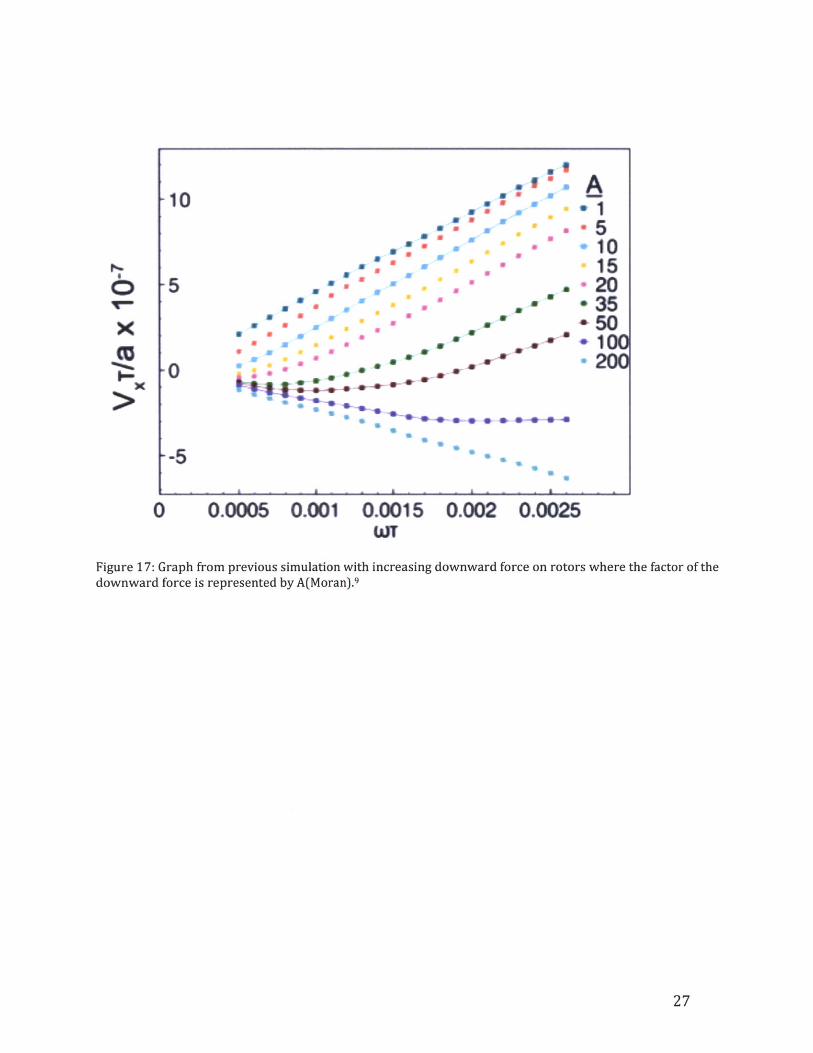
has more of an exponential response to the frequency. From figure 17, which are
the results from previous simulation data with an increase in a downward force, we
see this same transition from a linear response to velocity to a more exponential
response.9 The exponential response is seen with an increase in the downward force
on the rotors. This indicates that the PEG coated surface is mimicking a situation
with very little downward force present while the glass surface indicates more of a
downward force present. This is due to the fact that at zero salt concentration we
are at the collapsed state of the polymer where we have seen earlier that we have a
heavily slipping system, which is more similar to no downward force on the beads.
The downward force or increase in A can be correlated to more surface interaction
between the beads. So the collapsed stated of the polymer has very little surface
25
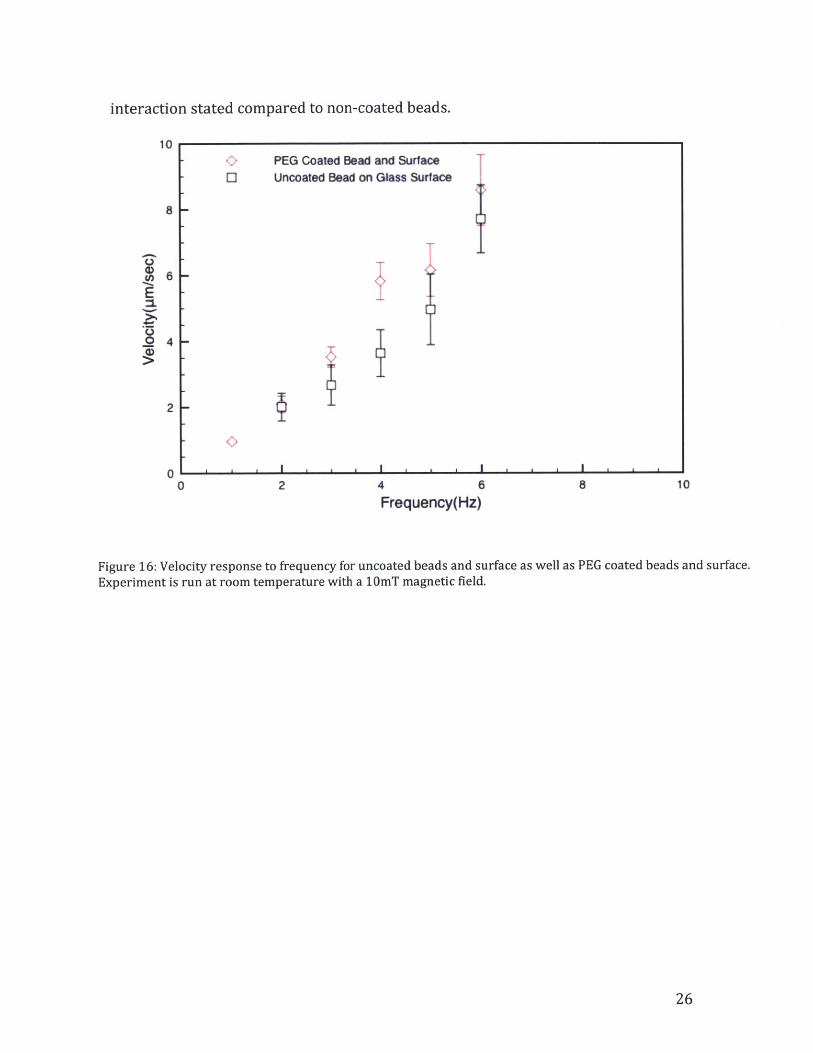
interaction stated compared to non-coated beads.
10
8
E
_2:
6
4
2
00
0 C> PEG Coated Bead and Surface* 0 Uncoated Bead on Glass Surface
- ii.
2 4 6
Frequency(Hz)8 10
Figure 16: Velocity response to frequency for uncoated beads and surface as well as PEG coated beads and surface.Experiment is run at room temperature with a 10mT magnetic field.
26
a8.
SE*3
a
a
-a
.-
-
- -
.- **a*
Ua
S
S
-
a
a Is*A
-1- 5
- 1015
.- 20.- -35*50
-200
4W -0 * W*--
0 0.0005 0.001 0.0015 0.002 0.0025WT
Figure 17: Graph from previous simulation with increasing downward force on rotors where the factor of thedownward force is represented by A(Moran). 9
27
-10
-5
x
x
-
-a'-
a
--a
*
.-
-
*0
.-
-,. S-& S
41 4P a
- -
-0 &, j
--W5
4. Conclusions and Future Work
From these results we see no direct correlation between the state of the PEG
and the velocity of the rotors; however with more experimentation it might be
apparent that there is correlation. It would be more beneficial to do an in depth
analysis of the collapse and expansion of the PEG that we had purchased using
experiments like surface force apparatus.'9 If the experiment was ran where we
could see the rotors from the side rather than the top one could measure the size of
the beads to correlate that to the state of the PEG on the surface and the beads. This
would allow us to pin point when the collapse occurs so it could potentially be
correlated to a velocity change in the rotors. In a microfluidic device the flow could
be increased by either an increase in temperature or the injection of a certain salt
concentration into the system, if this system did provide a controllable correlation
between the collapse state of the PEG and the velocity of the rotors.
This research leads itself to some interesting possibilities that could be
explored with the use of new equipment. With the current experimental setup that
our lab has it is unlikely to find exactly where the transition of the PEG occurs. Our
results do suggest that there is a possible correlation between the state of the PEG
and the velocity of the rotors, but currently it's inconclusive. It would be helpful to
run the same experiment with different salts like KCl, to make sure that there isn't a
problem with the NaCl.
28
Some experiments that we have ran show that by attaching magnetic beads
on the surface it is possible to increase the speed of the rotors significantly. As the
rotors walk across attached beads there is a slight increase in velocity. It would be
interesting to create different magnetic surfaces and see how one could control not
only the velocity of the rotors but also the path of the rotors. By making magnetic
channels with a turn it could be possible to steer the rotors. This would be especially
useful in understanding how to steer the rotors for drug delivery applications.
29
References
IllSleigh, M.A., Blake, J.R., & Liron, N. (1988) The propulsion of mucus by cilia. AmRev Respir Dis, 137, 726741.
[2] Brennen, C., Winet, H. (1977) Fluid Mechanics of Propulsion by Cillia and Flagella.Annual Review of Fluid Mechanics, Vol. (, 339-398.
[3] Chang, S.T., Paunov, V.N., Petsev, D.N., & Velev, O.D. (2007). Remotely poweredself propelling particles and micropumps based on miniature diodes. Nat Mater, 6,235240.30.
[4] Tierno, P., Gell, 0., & Sagus, F. (2010). Controlled propulsion in viscous fluids ofmagnetically actuated collodial doublets. Physical Review, 81.
[5]Derks, R. J. S., Frijns, A. J. H., Prins, M. W. J. & Dietzel, A. (2010). Multibodyinteractions of actuated magnetic particles used as fluid drivers in microchannels.Microfluid Nanofluid, 9, 357-364.
[6]Vilfan, M., Potocnik A., Kavcic, B.,Osterman, N., Poberac, I., Vilfan, A., & Babic, D.(2010). Self- assembled artificial cilia. PNAS, 107, no. 5, 1844-1847.
[7]Reichert, M., Stark, H. (2004). Hydrodynamic coupling of two rotating spherestrapped in harmonic poten- tials. Phys Rev E, 69, 031407.
[8] Blake, J.R. (1971). A note on the image system for a stokeslet in a no-slip boundary.Phys Rev Lett, 101, 218304.
[9] S.E. Moran, C.E. Sing, A. Alexander-Katz, Motion Reversal in Self-AssembledMicro-Walkers. Proc. of the 2nd Eur. Conf on Microfluidics (2010)
[10] C.E. Sing, L. Schmid, M.F. Schneider, T. Franke, A. Alexander-Katz. Controlledsurface-induced flows from the motion of self-assembled colloidal walkersProc. Natl. Acad. Sci. USA 107(2), 535-540 (2010).
[11] Fernandes, G., Bevan, M.A. (2007). Equivalent Temperature and Specific IonEffects in Macromolecule-Coated Colloid Interactions. Langmuir, 23, 1500-1506.
[12] Elisseeva, O.V., Besseling, N.A.M., Koopal, L.K., Stuart, M.A.C.(2005) Influence ofNaCl on the behavior of PEO-PPO-PEO Triblock Copolymers in Solution, at Interfaces,and in Asymmetric Liquid Films. Langmuir, 21, 4954-4963.
[13] 13Meenach, S.A, Anderson, K.W., Hilt, J.Z. (2010) Synthesis andCharacterization of Thermoresponsive Poly(ethylene glycol)-Based Hydrogels andTheir Magnetic Nanocomposites. J Polym Sci Part A: Polym Chem 48: 3229-3235.
30
[14] Wei, H., Ravarian, R., Dehn, S., Perrier, S., Dehghani, F.,(2011) Construction ofTemperature Responsive Hybrid Crosslinked Self-Assemblies Based on PEG-b-P(mma-co-MPMA)-B-PNIPAAm Triblock Copolymer: ATRP Synthesis andthermoinduced Association Behavior. J Polym Sci Part A: Polym Chem 49: 1809-1820.
[15] Young, R.J., Lovell, P.A.,(1991) Introduction to Polymers: SecondEdition .Chapman & Hall: New York.
[16]Lee, G.U., Kidwell, D.A., Colton, R.J. (1994) Sensing Discrete Streptavidin-BiotinInteraction Atomic Force Microscopy. Langmuir, 10, 354-357.
[17] Webl8er, P., Ohlendorf, D.H., Wendoloski, J.J., Salemme, F.R., (1989)StructuralOrigins of High-Affinity Biotin Binding to Streptavidin. Science, 243, 84-88.
[18] Holmberg, A., Blomstergren, A., Nord, 0., Lukacs, M., Lundeberg, J., Uhlen, M.(2005) The biotin-streptavidin interaction can be reversibly broken using water atelevated temperatures. Electrophoresis, 26, 501-510.
[19] Tsarkova, L.A., Protsenko, P.V., Klein, J., (2004) Interactions between Langmuir-Blodgett Polymer Monolayers Studied with the surface Force Apparatus. Colloid Journal,66,84-94.
31