Embed Size (px)
Citation preview
Brigham Young University Brigham Young University
BYU ScholarsArchive BYU ScholarsArchive
Theses and Dissertations
2016-03-01
Polymer Coated Urea in Kentucky Bluegrass Polymer Coated Urea in Kentucky Bluegrass
Jessica Chelise Buss Brigham Young University - Provo
Follow this and additional works at: https://scholarsarchive.byu.edu/etd
Part of the Plant Sciences Commons
BYU ScholarsArchive Citation BYU ScholarsArchive Citation Buss, Jessica Chelise, "Polymer Coated Urea in Kentucky Bluegrass" (2016). Theses and Dissertations. 5669. https://scholarsarchive.byu.edu/etd/5669
This Thesis is brought to you for free and open access by BYU ScholarsArchive. It has been accepted for inclusion in Theses and Dissertations by an authorized administrator of BYU ScholarsArchive. For more information, please contact [email protected], [email protected].
Polymer Coated Urea in Kentucky Bluegrass
Jessica Chelise Buss
A thesis submitted to the faculty of Brigham Young University
in partial fulfillment of the requirements for the degree of
Master of Science
Bryan G. Hopkins, Chair Neil C. Hansen
Brad Geary
Department of Plant and Wildlife Sciences
Brigham Young University
March 2016
Copyright © 2016 Jessica Chelise Buss
All Rights Reserved
ABSTRACT
Polymer Coated Urea in Kentucky Bluegrass
Jessica Chelise Buss Department of Plant and Wildlife Sciences, BYU
Master of Science
Nitrogen (N) is the most commonly over-applied nutrient in urban environments because of the large visual and growth increases. This over-application has led to an increase in the loss of N gas in the forms of ammonia and nitrous oxide, as well as an increase in nitrate leaching to surface and groundwater. Furthermore, excess N results in increased maintenance costs and landfill volume due to increased shoot growth from mowed clipping removal. Polymer coated urea (PCU) has proven to be an excellent source to these losses of N to the environment, but rate and timing parameters need study. A two-year field study, on sand and sandy loam soils in Provo, UT, was initiated in April 2014. Seven fertilized treatments included: urea split applied monthly; a single application of PCU (Agrium One Ap) applied in spring, a single PCU application in fall; two evenly split applications in spring and late summer; and three evenly split applications in spring, late summer, and late fall. These were compared to an untreated control. In addition the two application of PCU also had reduced rates of half and three-quarters, in addition to the full rate. Height and verdure measurements were taken on a weekly basis, along with periodic visual and biomass readings. All fertilized treatments resulted in a significant response to N as compared to the control. The single annual application treatments had significantly greater shoot growth during the weeks immediately after application and a significant reduction in verdure months later and, therefore, were unacceptable for consumer recommendation. Two applications of PCU, either at the three-quarter or full rates, were nearly identical in all measurements as compared to the spoon feeding of urea applied monthly. The half rate of two applications showed signs of inadequate N. Three applications of PCU was identical to two and, therefore, not recommended. This study shows two applications of PCU at the three-quarter rate is equally effective as spoon feeding the N. Doing so would result in less labor for fertilization. Further work is needed to evaluate other timing approaches for a single annual application, as well as long term effects of a reduced rate of N.
Keywords: polymer coated urea PCU, urea, Kentucky bluegrass, Poa pratensis, nitrogen fertilizer, nitrogen timing, nitrogen rate

ACKNOWLEDGEMENTS
Funding for this project was provided by Brigham Young University Grounds and Plant
and Wildlife Sciences Department. I express appreciation to Rachel Buck and the BYU Plant and
Soil Environmental Analytical Laboratory for their assistance in analyzing samples as well as the
use of the facilities. There were several students who helped along the way and I would like to
thank them for their time and efforts in helping. I would like to acknowledge the large influence
and help Jim Gish was to me throughout the program with data collections as well as being a
good source of advice. I would also like to thank BYU Grounds personnel for all of their help in
the maintenance and health of my research fields. I express gratitude to my committee for their
expertise and input throughout this project. I am especially grateful for the opportunity I had to
study with my major professor, Dr. Bryan G. Hopkins, and the mentoring I received from him.
He has taught me many life lessons which have helped me to grow. Finally, I would like to thank
my sweet family, and all of their continual support through my many endeavors.

iv
TABLE OF CONTENTS
TITLE PAGE .................................................................................................................................. i
ABSTRACT .................................................................................................................................... ii
ACKNOWLEDGEMENTS ........................................................................................................... iii
TABLE OF CONTENTS ............................................................................................................... iv
LIST OF FIGURES ...................................................................................................................... vii
LIST OF TABLES ......................................................................................................................... ix
CHAPTER 1..................................................................................................................................... 1
ABSTRACT ................................................................................................................................ 1
INTRODUCTION ....................................................................................................................... 2
MATERIALS AND METHODS ................................................................................................ 9
RESULTS .................................................................................................................................. 10
Growth: Loam Soil Trial ........................................................................................................ 11
Growth: Sand Soil Trial ......................................................................................................... 12
Health: Loam Soil Trial.......................................................................................................... 12
Health: Sand Soil Trial ........................................................................................................... 13
Shoot N Concentration ........................................................................................................... 14
Shoot Density ......................................................................................................................... 14
DISCUSSION ............................................................................................................................ 14
LITERATURE CITED .............................................................................................................. 18
FIGURES................................................................................................................................... 24
TABLES .................................................................................................................................... 29
CHAPTER 2 ................................................................................................................................. 44
ABSTRACT .............................................................................................................................. 44
v
INTRODUCTION ..................................................................................................................... 45
MATERIALS AND METHODS .............................................................................................. 53
RESULTS .................................................................................................................................. 54
Growth: Loam Soil Trial ........................................................................................................ 55
Growth: Sand Soil Trial ......................................................................................................... 55
Health: Loam Soil Trial.......................................................................................................... 56
Health: Sand Soil Trial ........................................................................................................... 57
Shoot N Concentration ........................................................................................................... 58
Shoot Density ......................................................................................................................... 58
DISCUSSION ............................................................................................................................ 58
LITERATURE CITED .............................................................................................................. 62
FIGURES................................................................................................................................... 70
TABLES .................................................................................................................................... 75
Chapter 1 Appendix A .................................................................................................................. 90
Root Density: Loam Soil Trial .................................................................................................. 90
Loam Biomass ........................................................................................................................... 91
Sand Biomass ............................................................................................................................ 92
Loam Visual .............................................................................................................................. 93
Sand Visual ................................................................................................................................ 94
Three Applications .................................................................................................................... 96
P-values ................................................................................................................................... 105
Chapter 1 Appendix B ................................................................................................................ 121
Chapter 2 Appendix A ................................................................................................................ 125
Root Density: Loam Soil Trial ................................................................................................ 125
Loam Growth ........................................................................................................................... 126
vi
Sand Growth ............................................................................................................................ 127
Loam Health ............................................................................................................................ 128
Sand Health.............................................................................................................................. 129
P-values ................................................................................................................................... 130
Chapter 2 Appendix B ................................................................................................................ 138
vii
LIST OF FIGURES
CHAPTER 1
Figure 1 Heights over two years for a trial on loam soil .............................................................. 24
Figure 2 Heights for 2014 for a trial on sand soil. ....................................................................... 25
Figure 3 NDVI readings over two years for a trial on loam soil ................................................. 26
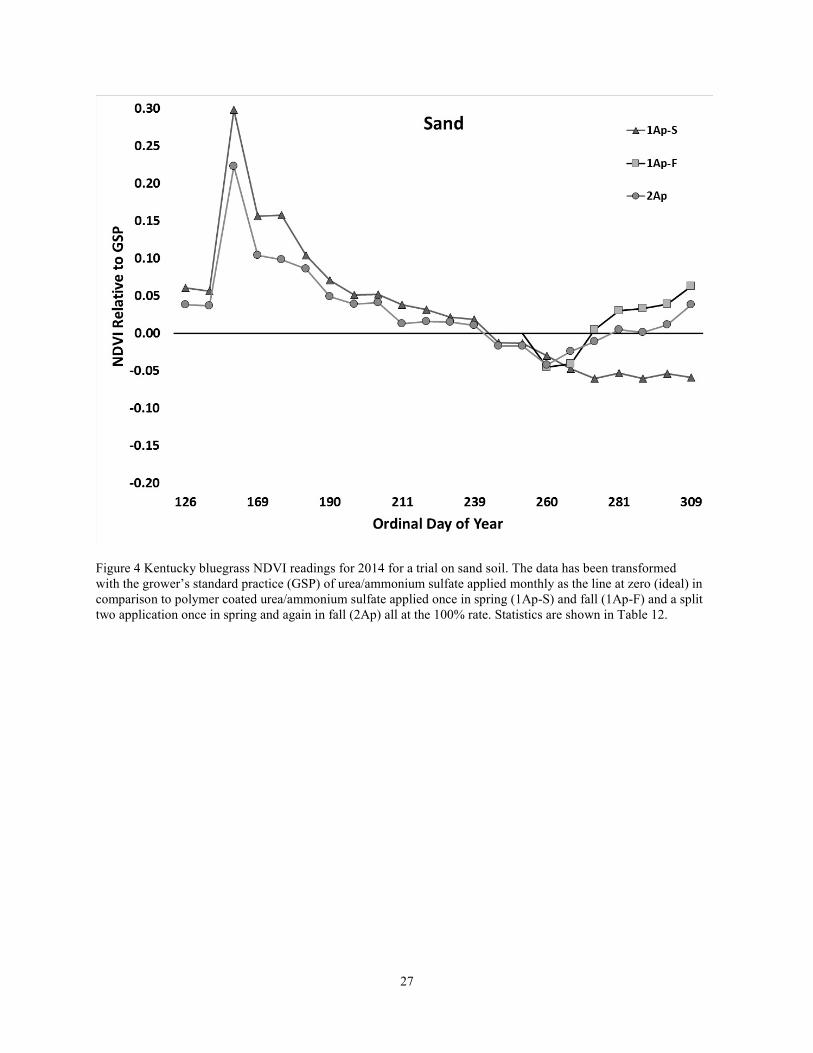
Figure 4 NDVI readings for 2014 for a trial on sand soil ............................................................ 27
Figure 5 Shoot density for 2015 for a trial on loam soil .............................................................. 28
CHAPTER 2
Figure 1 Heights over two years for a trial on loam soil .............................................................. 70
Figure 2 Heights for 2014 for a trial on sand soil ........................................................................ 71
Figure 3 Verdure as measured by NDVI readings over two years for a trial on loam soil .......... 72
Figure 4 Verdure as measured by NDVI readings for 2014 for a trial on sand soil ................... 73
Figure 5 Shoot density for 2015 for a trial on loam soil .............................................................. 74
APPENDIX CHAPTER 1
Appendix Figure 1 Biomass for 2014 and 2015 for a trial on loam soil ..................................... 92
Appendix Figure 2 Biomass for 2014 for a trial on sand soil ..................................................... 93
Appendix Figure 3 Visual ratings for 2014 and 2015 for a trial on loam soil ............................ 94
Appendix Figure 4 Visual ratings for 2014 for a trial on sand soil............................................. 95
viii
Appendix Figure 5 Picture of the treatments in the loam trial in November 2014 ................... 121
Appendix Figure 6 Picture of the treatments in the sand trial in November 2014 .................... 121
Appendix Figure 7 Picture of the treatments in the loam trial in April 2015 ........................... 122
Appendix Figure 8 Picture of the treatments in the sand trial in September 2015 ................... 122
Appendix Figure 9 Picture of the treatments in the loam trial in November 2014 ................... 123
Appendix Figure 10 Picture of the treatments in the sand trial in December 2014 .................. 124
APPENDIX CHAPTER 2
Appendix Figure 1 Biomass for 2014 and 2015 for a trial on loam soil ................................... 126
Appendix Figure 2 Biomass for 2014 for a trial on sand soil ................................................... 127
Appendix Figure 3 Visual ratings for 2014 and 2015 for a trial on loam soil .......................... 128
Appendix Figure 4 Visual ratings for 2014 for a trial on sand soil........................................... 129
Appendix Figure 5 Picture of the treatments in the loam trial in November 2014 ................... 138
Appendix Figure 6 Picture of the treatments in the sand trial in November 2014 .................... 138
Appendix Figure 7 Picture of the treatments in the loam trial in April 2015 .......................... 139
Appendix Figure 8 Picture of the treatments in the sand trial in September 2015 ................... 139
ix
LIST OF TABLES
CHAPTER 1
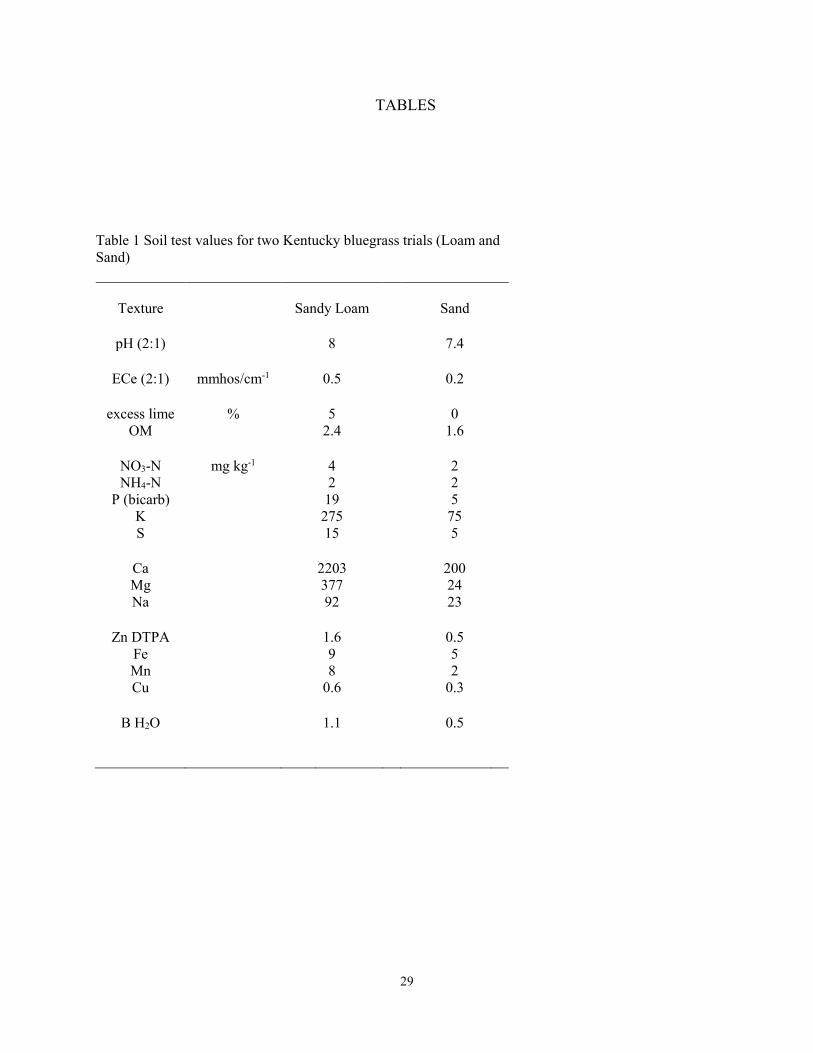
Table 1 Soil test values for trials (Loam and Sand) ..................................................................... 29
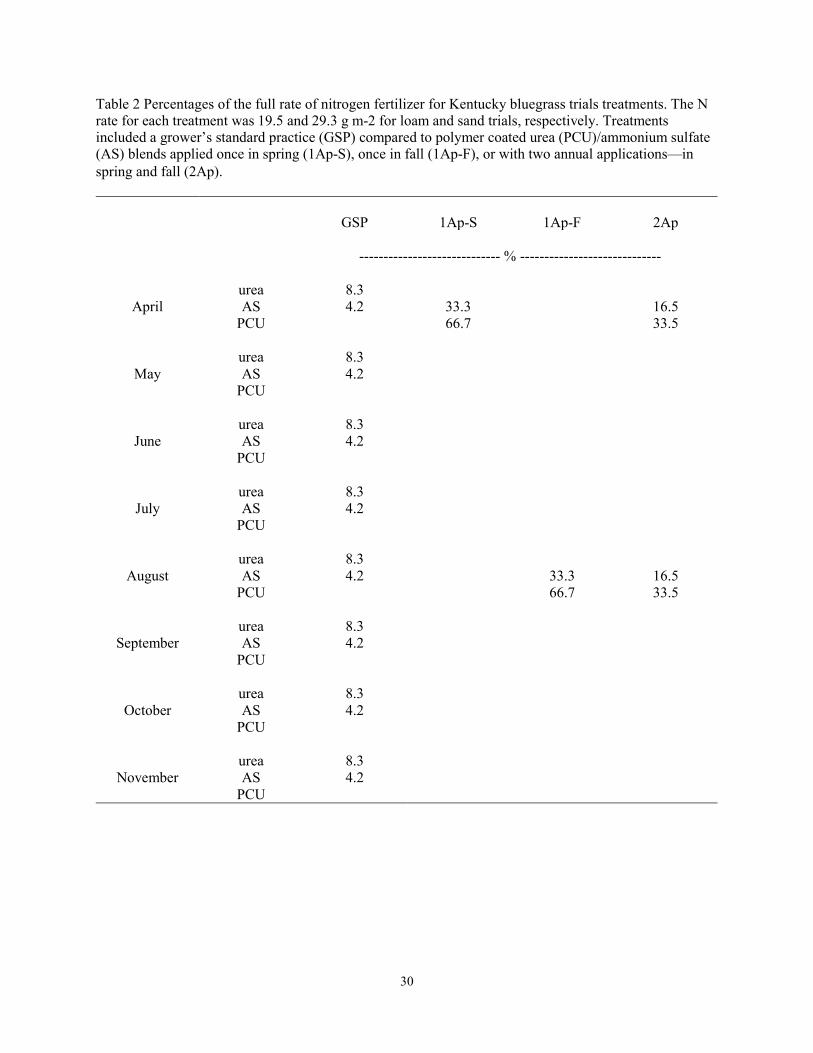
Table 2 Percentages of nitrogen fertilizer for trials treatments. ................................................... 30
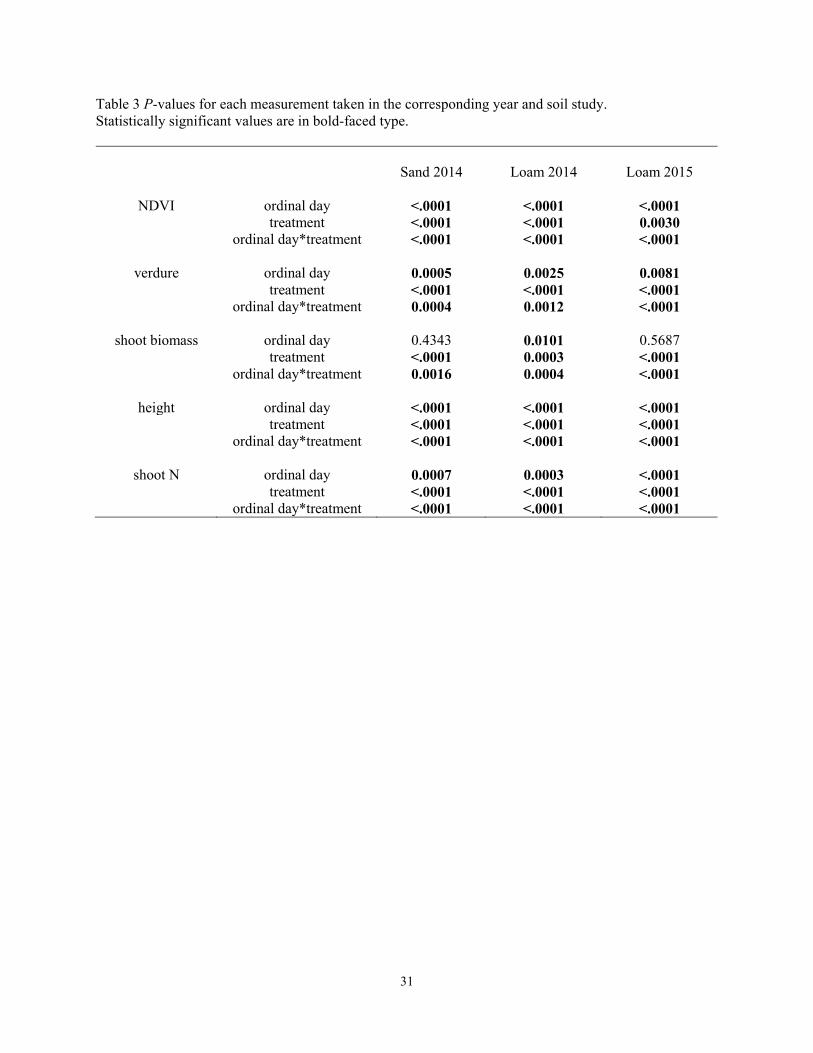
Table 3 P-values for matrix .......................................................................................................... 31
Table 4 Height values with statistical analysis for trial at the loam site in 2014 ......................... 32
Table 5 Height values with statistical analysis for trial at the loam site in 2015 ......................... 33
Table 6 Biomass values with statistical analysis for trials at the loam site in 2014 and 2015 ..... 34
Table 7 Height values with statistical analysis for trial at the sand site in 2014 .......................... 35
Table 8 Biomass values with statistical analysis for trial at the sand site in 2014 ....................... 36
Table 9 NDVI values with statistical analysis for trial at the loam site in 2014 .......................... 37
Table 10 NDVI values with statistical analysis for trial at the loam site in 2015 ........................ 38
Table 11 Visual values with statistical analysis for trials at the loam site in 2014 and 2015 ...... 39
Table 12 NDVI values with statistical analysis for trial at the sand site in 2014 ......................... 40
Table 13 Visual values with statistical analysis for trial at the sand site in 2014 ........................ 41
Table 14 Total N values with statistical analysis for trials at the loam site in 2014 and 2015 .... 42
Table 15 Shoot density with statistical analysis for trial at the loam site in 2015 ....................... 43
x
CHAPTER 2
Table 1 Soil test values for trials (Loam and Sand) ...................................................................... 75
Table 2 Percentages of nitrogen fertilizer for trials treatments. ................................................... 76
Table 3 P values for matrix .......................................................................................................... 77
Table 4 Height values for trial at the loam site in 2014 ............................................................... 78
Table 5 Height values for trial at the loam site in 2015 ............................................................... 79
Table 6 Biomass values for trials at the loam site in 2014 and 2015 ........................................... 80
Table 7 Height values for trial at the sand site in 2014 ................................................................ 81
Table 8 Biomass values for trial at the sand site in 2014 ............................................................. 82
Table 9 NDVI values for trial at the loam site in 2014 ................................................................ 83
Table 10 NDVI values for trial at the loam site in 2015 .............................................................. 84
Table 11 Visual values for trials at the loam site in 2014 and 2015 ............................................ 85
Table 12 NDVI values for trial at the sand site in 2014 ............................................................... 86
Table 13 Visual values for trial at the sand site in 2014 .............................................................. 87
Table 14 Total N values for trials at the loam site in 2014 and 2015 .......................................... 88
Table 15 Shoot density for trial at the loam site in 2015 ............................................................. 89

xi
APPENDIX CHAPTER 1
Appendix Table 1 Root density for a trial at the loam site in 2015 ............................................ 90
Appendix Table 2 Height values for a trial at the loam site in 2014 ........................................... 96
Appendix Table 3 Height values for a at the loam site in 2015 .................................................. 97
Appendix Table 4 Height values for a trial at the sand site in 2014 ........................................... 98
Appendix Table 5 Biomass values for trials at the loam site in 2014 and 2015 ......................... 99
Appendix Table 6 Biomass values for a trial at the sand site in 2014 ........................................ 99
Appendix Table 7 NDVI values for a trial at the loam site in 2014.......................................... 100
Appendix Table 8 NDVI values for a trial at the loam site in 2015.......................................... 101
Appendix Table 9 NDVI values for a trial at the sand site in 2014 .......................................... 102
Appendix Table 10 Visual values for trials at the loam site in 2014 and 2015......................... 103
Appendix Table 11 Visual values for a Kentucky bluegrass trial at the sand site in 2014 ....... 103
Appendix Table 12 Total N values for trials at the loam site in 2014 and 2015 and the sand site
in 2014 ........................................................................................................................................ 104
Appendix Table 13 P-values for root biomass in the loam trial in 2015................................... 105
Appendix Table 14 P-values for root biomass in the sand trial in 2015 ................................... 106
Appendix Table 15 P-values height in the loam trial in 2014 ................................................... 106
Appendix Table 16 P-values height in the loam trial in 2015 ................................................... 107

xii
Appendix Table 17a P-values height in the sand trial in 2014 ................................................. 108
Appendix Table 17b P-values height in the sand trial in 2014 ................................................. 109
Appendix Table 18 P-values for biomass in the loam trial in 2014 .......................................... 110
Appendix Table 19 P-values for biomass in the loam trial in 2015 .......................................... 110
Appendix Table 20 P-values for biomass in the sand trial in 2014 ........................................... 111
Appendix Table 21 P-values for NDVI readings for the loam trial in 2014 ............................. 111
Appendix Table 22 P-values for NDVI readings for the loam trial in 2015 ............................. 112
Appendix Table 23a P-values for NDVI readings for the sand trial in 2014 ............................ 113
Appendix Table 23b P-values for NDVI readings for the sand trial in 2014 ........................... 114
Appendix Table 24 P-values for visual ratings for the loam trial in 2014 ................................ 115
Appendix Table 25 P-values for visual ratings for the loam trial in 2015 ................................ 115
Appendix Table 26 P-values for visual ratings for the sand trial in 2014 ................................. 116
Appendix Table 27 P-values for nitrogen concentration for the loam trial in 2014 ................. 117
Appendix Table 28 P-values for nitrogen concentration for the loam trial in 2015 ................. 117
Appendix Table 29 P-values for nitrogen concentration for the sand trial in 2014 .................. 118
Appendix Table 30 P-values for shoot density in the loam trial in 2015 .................................. 119
Appendix Table 31 P-values for shoot density in the sand trial in 2015 .................................. 120
xiii
APPENDIX CHAPTER 2
Appendix Table 1 Root density (g) for a trial at the loam site in 2015 ..................................... 125
Appendix Table 2 P-values for root biomass in the loam trial in 2015 ..................................... 130
Appendix Table 3 P-values for root biomass in the sand trial in 2015 ..................................... 130
Appendix Table 4 P-values for height in the loam trial in 2014 ............................................... 131
Appendix Table 5 P-values for height in the loam trial in 2015 ............................................... 131
Appendix Table 6 P-values for height in the sand trial in 2014 ................................................ 132
Appendix Table 7 P-values for biomass in the loam trial in 2014-2015 ................................... 132
Appendix Table 8 P-values for biomass in the sand trial in 2014 ............................................. 132
Appendix Table 9 P-values for NDVI readings in the loam trial in 2014 ................................. 133
Appendix Table 10 P-values for NDVI readings in the loam trial in 2015............................... 133
Appendix Table 11 P-values for NDVI readings in the sand trial in 2014 ............................... 134
Appendix Table 12 P-values for visual ratings in the loam trial in 2014 .................................. 135
Appendix Table 13 P-values for visual ratings in the loam trial in 2015 .................................. 135
Appendix Table 14 P-values for visual ratings in the sand trial in 2014 .................................. 135
Appendix Table 15 P-values for nitrogen concentration in the loam trial in 2014-2015 .......... 136
Appendix Table 16 P-values for nitrogen concentration in the sand trial in 2014 .................... 136

xiv
Appendix Table 17 P-values for crown density in the loam trial in 2015................................. 137
Appendix Table 18 P-values for crown density in the sand trial in 2015 ................................. 137
1
Polymer Coated Urea in Kentucky Bluegrass: Application Timing
Jessica C. Buss, James H. Gish, Neil C. Hansen, and Bryan G. Hopkins
Brigham Young University, Provo, UT, USA
ABSTRACT
Nitrogen (N) is the most commonly over-applied nutrient in urban environments because of the
obvious difference in “greenness”. This over-application has led to nutrient pollution of the
atmosphere and hydrosphere. Furthermore, excess N results in increases in maintenance costs
and solid waste volume. A two-year study was initiated in April 2014. Four fertilized treatments
were applied at two locations in Provo, UT. Treatments included a urea and ammonium sulfate
blend split applied monthly compared to a polymer coated urea (PCU) and ammonium sulfate
blend applied either once in spring, once in fall, or twice in spring and just ahead of early fall—
all applied at the same rate of N at each location. The single annual application treatments
resulted in uneven growth and verdure with significant increases shortly after application, but a
steady reduction after several weeks. The two-application PCU treatment was virtually identical
in verdure and plant growth as compared to the spoon feeding of urea applied monthly. This
study shows that one application of PCU is not ideal under the application method tested in this
study due to increased need for mowing, but two applications results in steady growth and, as
such, is effective. Further work is needed to evaluate other timing approaches for a single annual
application.

2
INTRODUCTION
As urban and suburban developments grow, turfgrass is quickly growing as the principle
managed land cover (National Turfgrass Federation, 2003; Walker, 2007). According to the
combination of studies done by Milesi et al. (2005) and Runfola et al. (2014) turfgrass coverage
in the U.S. is estimated to be 111,683 km2. Turfgrass occupies 1.9% of the total surface area in
the United States and is the leading irrigated crop in the country (Milesi et al., 2005). Turfgrass
serves important roles in society. Despite the many benefits, there are also concerns due to
consumption of natural resources and pollution issues.
One such concern is related to nitrogen (N) fertilization. Turfgrass managers typically
apply between 75 and 500 kg N ha-1 each year because it is the nutrient of greatest need and is
most likely to show visual symptoms if deficient (Milesi et al., 2005). As such, many home
owners and turfgrass managers make the mistake of over applying N. The recommended rate of
N to be applied varies between and within species. Warm-season turfgrass requires ~50 kg N ha-1
for each month of active growth. Cool-season turfgrass requires ~150-250 kg N ha-1yr-1
(Christians, 2007).
Annual worldwide N fertilizer demand for crops is projected to total over 112 thousand
metric tons in 2015 but the actual amount applied is projected to be over 156,300,000 tons for
the same year (FAO, 2011). Over application of N-based fertilizers leads to an increase in shoot
growth at the expense of root growth (Christians, 2007). Poor rooting can result in unhealthy
plants, poor surface conditions, and inefficient water and fertilizer recovery rates. In addition,
excessive shoot growth results in increased mowing and an increase in clipping wastes and/or
damage to the turfgrass if excessive clippings are not removed (Christians, 2007). In addition to
problems with plant health, excessive N application increases risk of environmental problems
(LeMonte et al., 2016). Nitrogen cycling in the ecosystem is a vital and normal process, but

3
excesses can result in problems with leaching of nitrate (NO3-) to groundwater and runoff of
NO3- and ammonium (NH4
+) to surface water bodies and atmospheric pollution through nitrous
oxide (N2O) emission and ammonia (NH3) volatilization.
Ammonia volatilization results in increases in air quality problems, including:
photochemical smog, particulate matter, strong odors, and acid rain. In addition, the
volatilization of NH3 is a concern with deposition on land or water bodies in sensitive systems.
Excessive N deposition can lead to reduction in plant community loss, as well as a reduction in
biodiversity (Sutton et al., 2008). The deposition of NH3 can also lead to soil acidification
(Sutton et al., 2008), as well as surface water eutrophication (Boyd, 2000).
Another gaseous N environmental issue is related to N2O. Hirsch et al. (2006) estimated
anthropogenic emissions of N2O to have increased by about 40-50% over preindustrial levels. It
is estimated that emissions directly related to fertilization account for 78% of the total annual
anthropogenic N2O losses (LeMonte et al., 2016; USEPA, 2007). The processes of nitrification
and denitrification lead to the formation of N2O which is lost to the environment (McTaggart et
al., 1994). The concern with N2O is that it is a long-lived, potent greenhouse gas with a
significantly greater potential of global warming by almost 300 times that of carbon dioxide
(CO2) (IPCC, 1995; USEPA, 2007).
Nitrogen excess in the hydrosphere is also a serious concern. Soil NO3- is easily leached
below the rooting zone due to it being a highly soluble anion that is repelled by negatively
charged soil. It has been reported that the annual rate of N leaching from turfgrass ranges
between 0 and 160 kg N ha-1 year-1—representing up to 30% of applied N (Barton, 2006).
Contaminated drinking water high in NO3- causes methemoglobinemia (baby blue syndrome) in
4
mammalian infants (Olson et al., 2009). It is also speculated to cause other health issues in
humans, but this is not proven.
Surface water contamination is also a concern. Both NH4+ and NO3
- can be easily
transported via surface water runoff and soil erosion (Easton, 2004). As with groundwater, NO3-
in surface water is also a potential drinking water problem. Additionally, excess N in surface
water can lead to problems from algal blooms—which can result in injury or death of the aquatic
life or organisms drinking the water, decreases in biodiversity, unsightly conditions, strong
odors, economic losses, and a decrease in recreational use (Fangmeier et al., 1994; Mulvaney et
al., 2009).
Along with needing to reduce the environmental impacts of N loss, it is also important to
recognize that N fertilizers are manufactured using natural gas and other nonrenewable
resources. In order to conserve resources and minimize environmental impacts, N loss needs to
be minimized by maximizing plant utilization of the applied N (Hopkins et al., 2008). Many
argue that planting turfgrass should be discouraged or even illegal. Although there are negative
impacts associated with turfgrass due to the over fertilization of the crop in agriculture and urban
settings and other issues (such as pesticide use and water consumption), there are many positive
impacts to society and the environment.
In addition to being aesthetically pleasing, providing a safe surface for many recreational
activities, and generating oxygen, turfgrass reduces: air temperature, atmospheric pollutants,
erosion, water and chemicals in storm drains, chemicals leached to groundwater, flooding, noise
pollution, and fire risk. By maintaining a low growing and green plant material next to buildings,
fires are less likely to spread. Air quality is improved because turfgrass is a good filter for
capturing smoke and dust. Sulfur and carbon dioxides are also absorbed from the atmosphere—
5
reducing acid rain and greenhouse gas concentration. In addition to the impact on global
temperature, the cooling effect of turfgrass makes for a more pleasant urban environment and
results in reduced use of natural resources to cool the interiors of neighboring buildings.
Sequestering carbon (C) into the soil results in improved soil health. Carbon
sequestration is the removal of C from the atmosphere in the form of carbon dioxide (CO2),
which is then held in the soil (Bremer, 2007). A possible concern with turfgrass is that it has to
be mowed and that the mowers are putting C into the atmosphere. It has been found that turfgrass
is able to sequester four times more C from the air than is put into the air by the typical
lawnmower engine. If the lawn is cared for with proper water, fertilizer, and mowing inputs then
the net carbon intake is five to seven times higher, which is up to 800 lbs of C per acre per year
(Qian, 2015), than the carbon output of the mowers used in managing the lawn (Bandaranayake,
2003; Milesi; Qian, 2015; Sahu).
However, in order to have these benefits, N is needed. Turfgrass requires a steady supply
of N to grow successfully (Christians, 2007; Geary et al., 2015). Nitrogen is the mineral nutrient
generally found in the highest concentration in plants and deficiencies can be dramatic from a
visual perspective. Nitrogen plays a vital role in many processes in the life cycle of a plant and
they would not be able to complete their life cycles without it. One of the most important
biochemical processes which N plays a role in is the formation of chlorophyll (Marschner, 2012).
With N playing such a vital role in many processes there is a high demand for N to facilitate the
essential biochemical processes. Due to this high demand, as well as the high mobile nature of N
causing it to be easily lost to the surrounding environment, N is often the primary limiting factor
for plant growth (Chatterjee, 2012). Without the adequate concentrations of N, plant vigor, visual
quality, verdure, recovery from damage, and overall health are affected due to the production of

6
less chlorophyll and proteins resulting in an increased susceptibility to pests and diseases
(Bowman, 2002; Marschner, 2012). The essentialness of N leads to efficient use within the plant
following the absorption. Nitrogen is only lost from the plant by rain or mist-induced foliage
leaching or defoliation (Barker, 2007). The repeated removal of plant biomass by harvesting or
mowing can result in a depletion of N reserves within the plant. Plants are not able to regenerate
N to the levels required following the removal of plant biomass—N must be replenished mainly
through the addition of fertilizer and soil amendments. A small fraction of N can be replenished
through atmospheric deposition, irrigation, and fixation of atmospheric N by legumes.
Atmospheric deposition and fixation do not provide adequate amounts of N to meet the demands
of plants. In order to meet the demands needed for high crop production and most urban
landscapes, N fertilization is required (LeMonte, 2011). Ideally, fertilizer rate and application
would be applied to meet the needs of the plant precisely. Unfortunately, this ideal is not possible
due to the inherent inefficiencies in the system. Substantial increases in the efficiency of N are
possible if best management practices (BMP) are implemented. The key to good stewardship
depends on using the right source, at the right rate, at the right time, and with the right placement
(Snyder et al., 2007).
The use of inefficient fertilizer types is a contributor to the negative environmental
impacts due to a low N-use efficiency (NUE) (Cameron, 2013; Nielson, 2006). It is estimated
that NUE for worldwide cereal production is only 33% (Blaylock et al., 2005). Schlesinger
(1992) estimated that 10% of all manufactured N fertilizer worldwide is volatilized as NH3-N
gas. In a growth chamber study, volatilization of surface-applied N fertilizers reached an excess
of 60% over the first 10 days following fertilization using warm-season bentgrass (Agrostis
palustris Huds.; Knight et al., 2007). Within North and Central America, about 54% of N2O-N
7
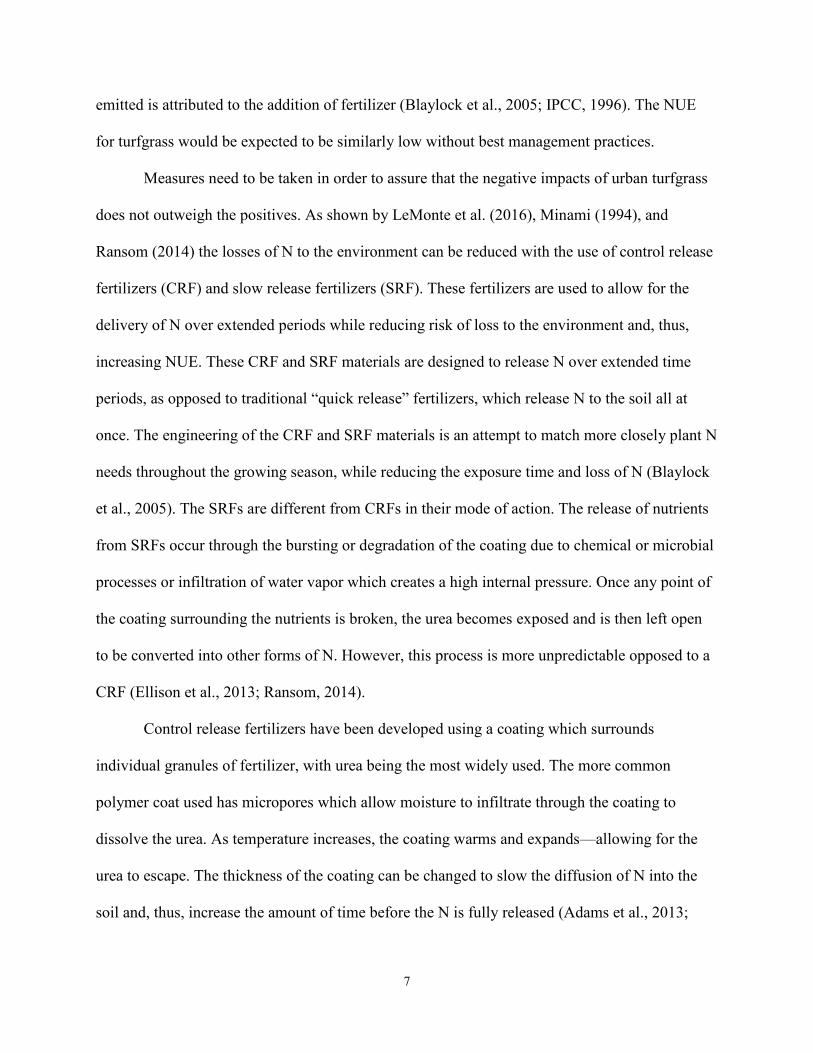
emitted is attributed to the addition of fertilizer (Blaylock et al., 2005; IPCC, 1996). The NUE
for turfgrass would be expected to be similarly low without best management practices.
Measures need to be taken in order to assure that the negative impacts of urban turfgrass
does not outweigh the positives. As shown by LeMonte et al. (2016), Minami (1994), and
Ransom (2014) the losses of N to the environment can be reduced with the use of control release
fertilizers (CRF) and slow release fertilizers (SRF). These fertilizers are used to allow for the
delivery of N over extended periods while reducing risk of loss to the environment and, thus,
increasing NUE. These CRF and SRF materials are designed to release N over extended time
periods, as opposed to traditional “quick release” fertilizers, which release N to the soil all at
once. The engineering of the CRF and SRF materials is an attempt to match more closely plant N
needs throughout the growing season, while reducing the exposure time and loss of N (Blaylock
et al., 2005). The SRFs are different from CRFs in their mode of action. The release of nutrients
from SRFs occur through the bursting or degradation of the coating due to chemical or microbial
processes or infiltration of water vapor which creates a high internal pressure. Once any point of
the coating surrounding the nutrients is broken, the urea becomes exposed and is then left open
to be converted into other forms of N. However, this process is more unpredictable opposed to a
CRF (Ellison et al., 2013; Ransom, 2014).
Control release fertilizers have been developed using a coating which surrounds
individual granules of fertilizer, with urea being the most widely used. The more common
polymer coat used has micropores which allow moisture to infiltrate through the coating to
dissolve the urea. As temperature increases, the coating warms and expands—allowing for the
urea to escape. The thickness of the coating can be changed to slow the diffusion of N into the
soil and, thus, increase the amount of time before the N is fully released (Adams et al., 2013;

8
Carrow, 1997; Ellison et al., 2013). This mode of action is typically more controlled and
predictable, so N applications can potentially be reduced. The polymer coated urea (PCU)
products have shown a significant decrease in both NO3-N leaching (Du et al., 2006; Guillard
and Kopp, 2004; Nelson et al., 2009; Pack and Hutchinson, 2003); Pack et al., 2006; Wilson et
al., 2010), NH3 volatilization (Knight et al., 2007; Pereira et al., 2009; Rochette et al., 2009) and
N2O-N emission (LeMonte, 2011; LeMonte et al., 2016; Ransom, 2014). Hyatt et al. (2010)
showed that the slow release of N from the PCU products can improve economics as well as
environmental impacts due to the ability to eliminate additional in-season applications of N. This
can be seen in a study done by Miltner and Stahnke (2004) using PCU in cool-season turf. The
PCU was applied in November in Washington, USA, and there was significantly greater turf
quality in February through May. This showed that applying a SRF can reduce the need for
applying multiple applications of N in the early spring. Although PCU fertilizers have been
shown to be very effective in many situations, there is minimal information available on the
number of applications needed. The fertilizer industry is promoting a single yearly application as
being appropriate. Ransom (2014) showed that N release from PCU incorporated into the soil
resulted in extended N release approximately in correlation with manufacturer claims. However,
he also showed that surface application of PCU resulted in more rapid release with all N
escaping the prill within 45 d. These findings make the suggestion of a single PCU application
suspect.
The purpose of this study was to evaluate the impacts of PCU on Kentucky bluegrass
height, biomass, health (NDVI), and verdure with one to three applications and to examine the
timing of a single PCU application.
9
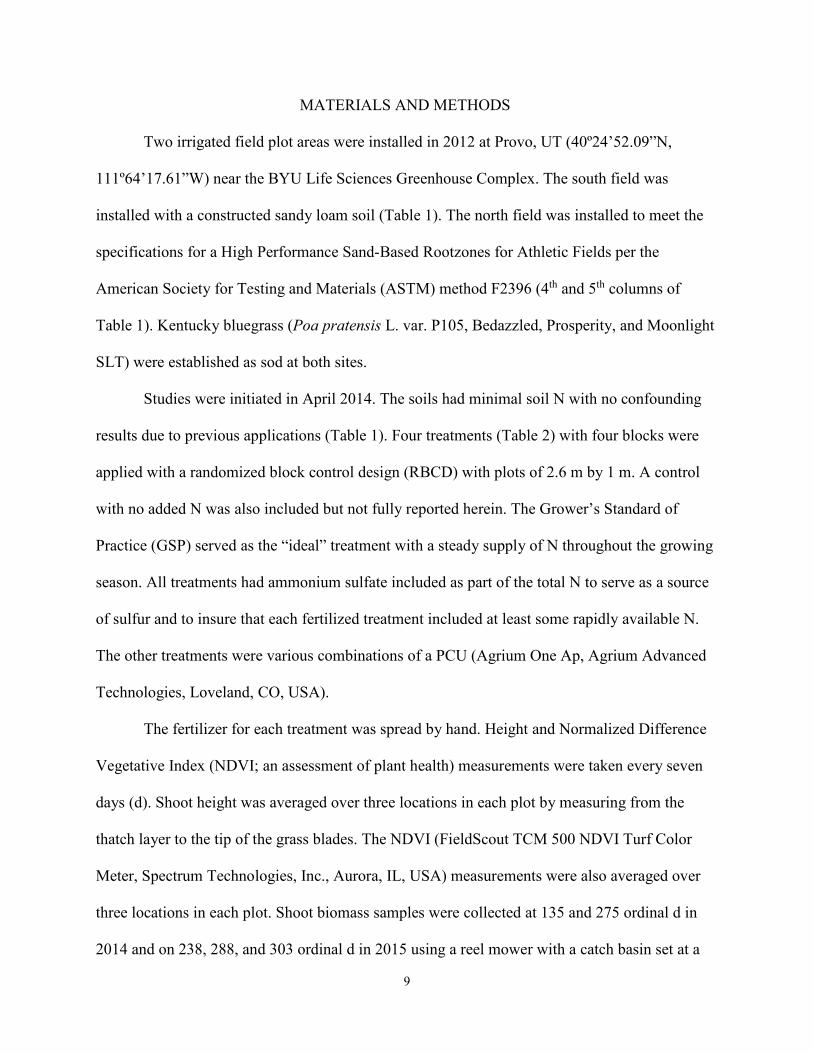
MATERIALS AND METHODS
Two irrigated field plot areas were installed in 2012 at Provo, UT (40º24’52.09”N,
111º64’17.61”W) near the BYU Life Sciences Greenhouse Complex. The south field was
installed with a constructed sandy loam soil (Table 1). The north field was installed to meet the
specifications for a High Performance Sand-Based Rootzones for Athletic Fields per the
American Society for Testing and Materials (ASTM) method F2396 (4th and 5th columns of
Table 1). Kentucky bluegrass (Poa pratensis L. var. P105, Bedazzled, Prosperity, and Moonlight
SLT) were established as sod at both sites.
Studies were initiated in April 2014. The soils had minimal soil N with no confounding
results due to previous applications (Table 1). Four treatments (Table 2) with four blocks were
applied with a randomized block control design (RBCD) with plots of 2.6 m by 1 m. A control
with no added N was also included but not fully reported herein. The Grower’s Standard of
Practice (GSP) served as the “ideal” treatment with a steady supply of N throughout the growing
season. All treatments had ammonium sulfate included as part of the total N to serve as a source
of sulfur and to insure that each fertilized treatment included at least some rapidly available N.
The other treatments were various combinations of a PCU (Agrium One Ap, Agrium Advanced
Technologies, Loveland, CO, USA).
The fertilizer for each treatment was spread by hand. Height and Normalized Difference
Vegetative Index (NDVI; an assessment of plant health) measurements were taken every seven
days (d). Shoot height was averaged over three locations in each plot by measuring from the
thatch layer to the tip of the grass blades. The NDVI (FieldScout TCM 500 NDVI Turf Color
Meter, Spectrum Technologies, Inc., Aurora, IL, USA) measurements were also averaged over
three locations in each plot. Shoot biomass samples were collected at 135 and 275 ordinal d in
2014 and on 238, 288, and 303 ordinal d in 2015 using a reel mower with a catch basin set at a

10
height of 2.5 cm. After each subplot was mowed, the blades and catch basin were wiped clean.
Each biomass sample was stored in a paper bag and left to air dry and then weighed. Visual
verdure ratings were taken prior to mowing at 126, 239 and 260 ordinal d in 2014 and on 238
and 305 ordinal d in 2015. Visual ratings were done on a scale of 1-5 with one being completely
dormant and five being dense, dark green turfgrass. Final shoot density and biomass
measurements were taken at the end of the two year study. Shoot density was measured by
taking a plug from each plot and counting the crowns of the turfgrass in two random areas (3
cm2). After shoot density was measured, all of the shoot biomass was harvested above the
crowns. After biomass was calculated, the shoots were ground and analyzed for N content using
the CN Determinator (TruSpec Micro, LECO, St. Joseph, MI, USA). Root biomass was
measured using the same plugs taken from the plots for shoot density and biomass. The roots
were also harvested by washing the soil off and collecting the biomass in a 1 mm screen. Data
was checked for normality and analyzed by analysis of variance (ANOVA) with R (R project for
Statistical Computing), with significance indicated at P ≤ 0.05. Any significant means were then
separated using a Tukey-Kramer test.
RESULTS
The models for all dependent variables were highly significant with the interaction
between treatment and sampling date always significant (Table 3). Therefore, all statistical
evaluations were performed for each individual sampling date and the interactions shown in Figs.
1-4. The results for the control are not included in the results below in order to simplify the
output, but it is important to note that all fertilized treatments gave a typical N response over the
control with significant increases in all cases (see Appendix 1 for control data). It is also
noteworthy that a three application of PCU treatment was also evaluated and is not reported
11
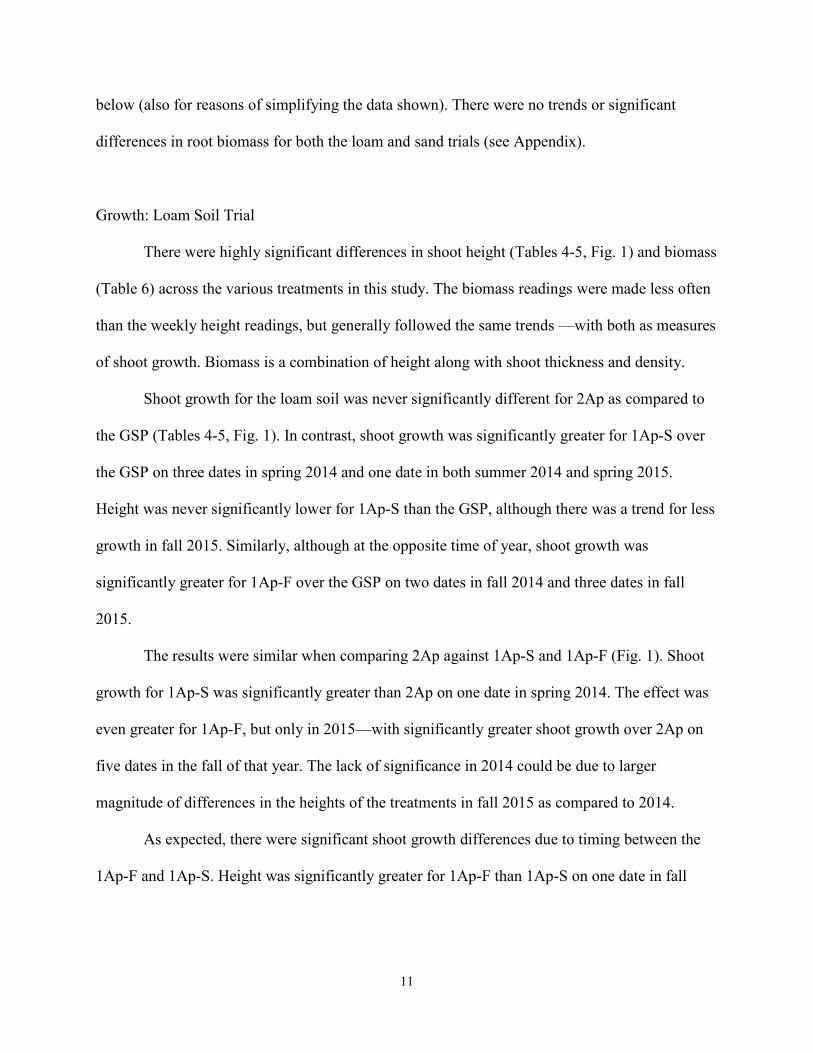
below (also for reasons of simplifying the data shown). There were no trends or significant
differences in root biomass for both the loam and sand trials (see Appendix).
Growth: Loam Soil Trial
There were highly significant differences in shoot height (Tables 4-5, Fig. 1) and biomass
(Table 6) across the various treatments in this study. The biomass readings were made less often
than the weekly height readings, but generally followed the same trends —with both as measures
of shoot growth. Biomass is a combination of height along with shoot thickness and density.
Shoot growth for the loam soil was never significantly different for 2Ap as compared to
the GSP (Tables 4-5, Fig. 1). In contrast, shoot growth was significantly greater for 1Ap-S over
the GSP on three dates in spring 2014 and one date in both summer 2014 and spring 2015.
Height was never significantly lower for 1Ap-S than the GSP, although there was a trend for less
growth in fall 2015. Similarly, although at the opposite time of year, shoot growth was
significantly greater for 1Ap-F over the GSP on two dates in fall 2014 and three dates in fall
2015.
The results were similar when comparing 2Ap against 1Ap-S and 1Ap-F (Fig. 1). Shoot
growth for 1Ap-S was significantly greater than 2Ap on one date in spring 2014. The effect was
even greater for 1Ap-F, but only in 2015—with significantly greater shoot growth over 2Ap on
five dates in the fall of that year. The lack of significance in 2014 could be due to larger
magnitude of differences in the heights of the treatments in fall 2015 as compared to 2014.
As expected, there were significant shoot growth differences due to timing between the
1Ap-F and 1Ap-S. Height was significantly greater for 1Ap-F than 1Ap-S on one date in fall

12
2014 and six dates in fall 2015. Surprisingly, there were no differences in spring between these
treatments.
Growth: Sand Soil Trial
As with the loam study, there were significant differences in shoot growth with the sand
study (Tables 7-8, Fig. 2). Results were similar for the sandy soil with the same general trends
and interactions in 2014 as with the loam soil (Figs. 1-2). Results are not shown for 2015 in the
sand due to the failure of the sand field in the early spring. Although incomplete for the season,
data was collected for late season on the sand in 2015 and is found in Appendix 1.
Shoot growth for 2Ap was significantly different from the GSP on one date in the spring
of 2014. However, shoot growth was significantly greater for 1Ap-S over the GSP on six dates in
spring. Shoot growth was significantly greater for 1Ap-F over the GSP on one date in fall. These
results are virtually the same as with the study done with loam soil, but with a much greater
magnitude in differences between treatments
The results were similar when comparing 2Ap against 1Ap-S with shoot growth
significantly greater than 2Ap on four dates in the spring (Fig. 2). However, the differences were
not significant between 2Ap and 1Ap-F. Additionally, height for 1Ap-F was significantly greater
than 1Ap-S on three dates in the fall.
Health: Loam Soil Trial
Plant health and verdure, as represented by weekly NDVI measurements, for the loam
soil was never significantly different for 2Ap as compared to the GSP (Tables 9-10; Fig. 3). In
contrast, NDVI was significantly greater for 1Ap-S over the GSP on three dates in spring 2014

13
and no differences in 2015. The NDVI readings for 1Ap-S were never significantly lower than
the GSP, although there was a trend for lower NDVI readings in 2015. The NDVI for 1Ap-F was
never significantly different than the GSP.
The results were similar when comparing 2Ap to 1Ap-S and 1Ap-F (Fig. 3). NDVI for
1Ap-S was significantly greater than 2Ap on two dates in the spring of 2014, but reverse was
true on one date in fall of that year. There were no differences between 2Ap and 1Ap-S in 2015.
The NDVI of 1Ap-F was significantly greater than 2Ap on two dates in fall of 2015, but no
differences in the prior year.
As expected, there were significant differences between 1Ap-S and 1Ap-F due to timing
of application (Fig. 3). The NDVI was significantly greater for 1Ap-F on three dates in the fall of
both years. Surprisingly, the NDVI of 1Ap-S was not significantly greater than 1Ap-F in the
spring of 2015. The visual ratings had the same general trends as the NDVI readings (Table 11).
Health: Sand Soil Trial
Results were similar for the plant health for the sandy soil (Table 12; Fig. 4) with the
same general trends in 2014 but with greater magnitude in the differences over what was
observed with the loam study in spring (Figs. 3). In 2014, the 2Ap was significantly greater than
the GSP on four dates in the spring and never worse (Fig. 4). Similar to the loam, NDVI was
significantly greater for 1Ap-S over the GSP, again with greater magnitude of differences, with it
being higher on five dates in the spring. Although not significant, there was a trend in both of the
sand and loam studies for the 1Ap-S NDVI to trend below GSP in the fall. NDVI was
significantly greater for 1Ap-F over the GSP on one date in the fall. Unfortunately, the spring
evaluation for this treatment was not possible due to loss of the sand plots in spring 2015.
14
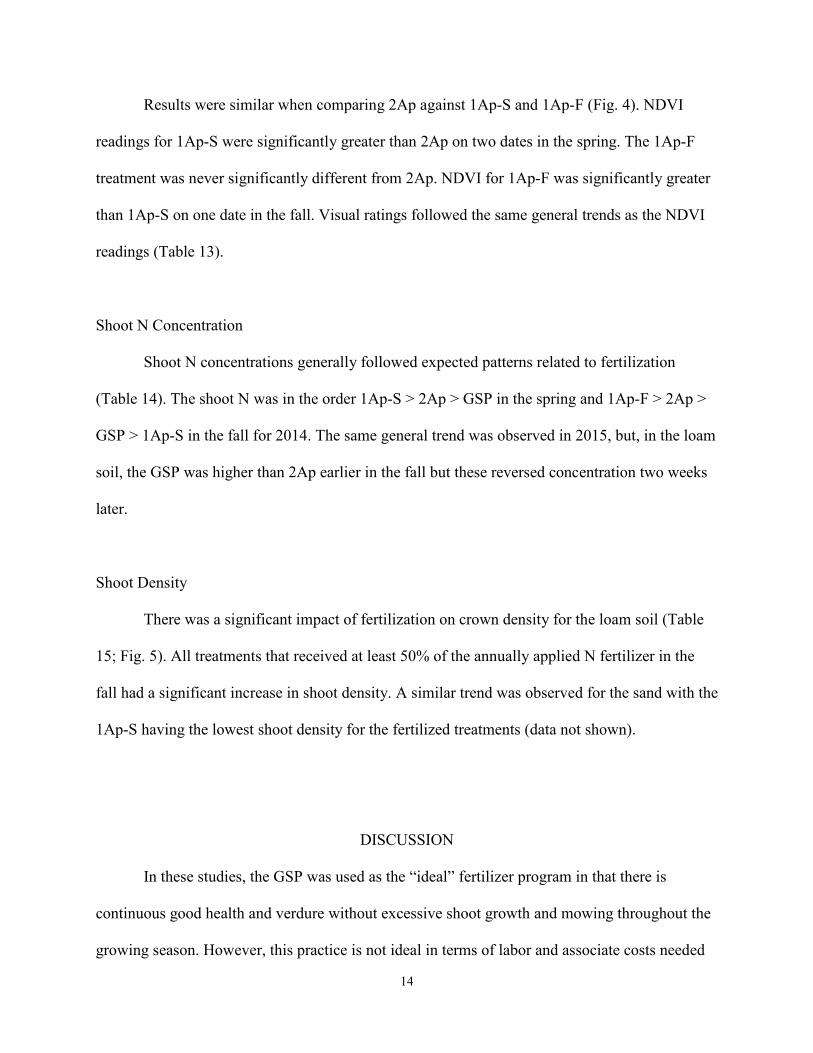
Results were similar when comparing 2Ap against 1Ap-S and 1Ap-F (Fig. 4). NDVI
readings for 1Ap-S were significantly greater than 2Ap on two dates in the spring. The 1Ap-F
treatment was never significantly different from 2Ap. NDVI for 1Ap-F was significantly greater
than 1Ap-S on one date in the fall. Visual ratings followed the same general trends as the NDVI
readings (Table 13).
Shoot N Concentration
Shoot N concentrations generally followed expected patterns related to fertilization
(Table 14). The shoot N was in the order 1Ap-S > 2Ap > GSP in the spring and 1Ap-F > 2Ap >
GSP > 1Ap-S in the fall for 2014. The same general trend was observed in 2015, but, in the loam
soil, the GSP was higher than 2Ap earlier in the fall but these reversed concentration two weeks
later.
Shoot Density
There was a significant impact of fertilization on crown density for the loam soil (Table
15; Fig. 5). All treatments that received at least 50% of the annually applied N fertilizer in the
fall had a significant increase in shoot density. A similar trend was observed for the sand with the
1Ap-S having the lowest shoot density for the fertilized treatments (data not shown).
DISCUSSION
In these studies, the GSP was used as the “ideal” fertilizer program in that there is
continuous good health and verdure without excessive shoot growth and mowing throughout the
growing season. However, this practice is not ideal in terms of labor and associate costs needed
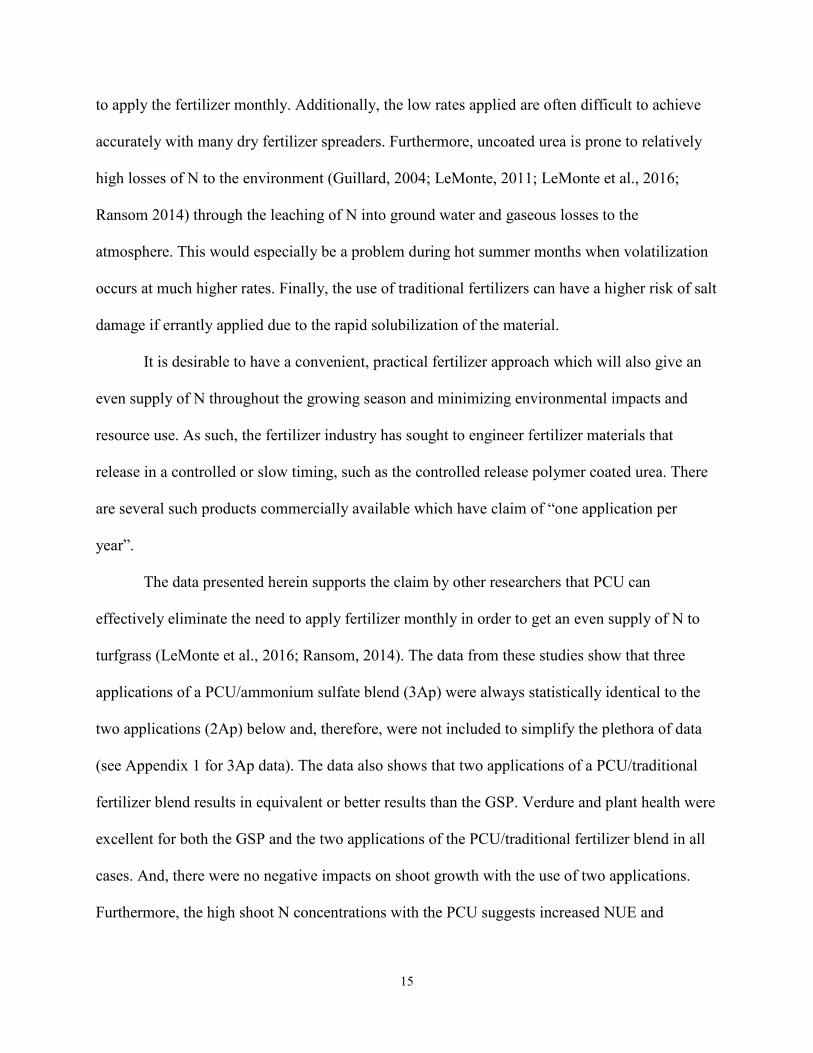
15
to apply the fertilizer monthly. Additionally, the low rates applied are often difficult to achieve
accurately with many dry fertilizer spreaders. Furthermore, uncoated urea is prone to relatively
high losses of N to the environment (Guillard, 2004; LeMonte, 2011; LeMonte et al., 2016;
Ransom 2014) through the leaching of N into ground water and gaseous losses to the
atmosphere. This would especially be a problem during hot summer months when volatilization
occurs at much higher rates. Finally, the use of traditional fertilizers can have a higher risk of salt
damage if errantly applied due to the rapid solubilization of the material.
It is desirable to have a convenient, practical fertilizer approach which will also give an
even supply of N throughout the growing season and minimizing environmental impacts and
resource use. As such, the fertilizer industry has sought to engineer fertilizer materials that
release in a controlled or slow timing, such as the controlled release polymer coated urea. There
are several such products commercially available which have claim of “one application per
year”.
The data presented herein supports the claim by other researchers that PCU can
effectively eliminate the need to apply fertilizer monthly in order to get an even supply of N to
turfgrass (LeMonte et al., 2016; Ransom, 2014). The data from these studies show that three
applications of a PCU/ammonium sulfate blend (3Ap) were always statistically identical to the
two applications (2Ap) below and, therefore, were not included to simplify the plethora of data
(see Appendix 1 for 3Ap data). The data also shows that two applications of a PCU/traditional
fertilizer blend results in equivalent or better results than the GSP. Verdure and plant health were
excellent for both the GSP and the two applications of the PCU/traditional fertilizer blend in all
cases. And, there were no negative impacts on shoot growth with the use of two applications.
Furthermore, the high shoot N concentrations with the PCU suggests increased NUE and
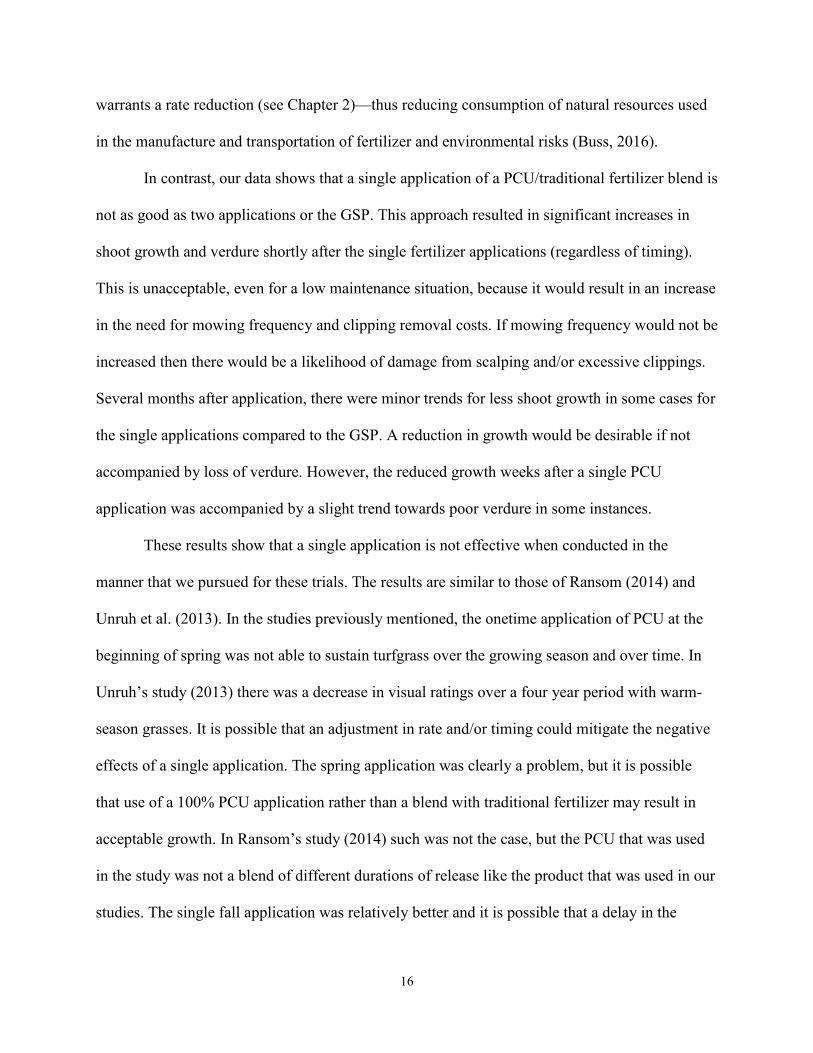
16
warrants a rate reduction (see Chapter 2)—thus reducing consumption of natural resources used
in the manufacture and transportation of fertilizer and environmental risks (Buss, 2016).
In contrast, our data shows that a single application of a PCU/traditional fertilizer blend is
not as good as two applications or the GSP. This approach resulted in significant increases in
shoot growth and verdure shortly after the single fertilizer applications (regardless of timing).
This is unacceptable, even for a low maintenance situation, because it would result in an increase
in the need for mowing frequency and clipping removal costs. If mowing frequency would not be
increased then there would be a likelihood of damage from scalping and/or excessive clippings.
Several months after application, there were minor trends for less shoot growth in some cases for
the single applications compared to the GSP. A reduction in growth would be desirable if not
accompanied by loss of verdure. However, the reduced growth weeks after a single PCU
application was accompanied by a slight trend towards poor verdure in some instances.
These results show that a single application is not effective when conducted in the
manner that we pursued for these trials. The results are similar to those of Ransom (2014) and
Unruh et al. (2013). In the studies previously mentioned, the onetime application of PCU at the
beginning of spring was not able to sustain turfgrass over the growing season and over time. In
Unruh’s study (2013) there was a decrease in visual ratings over a four year period with warm-
season grasses. It is possible that an adjustment in rate and/or timing could mitigate the negative
effects of a single application. The spring application was clearly a problem, but it is possible
that use of a 100% PCU application rather than a blend with traditional fertilizer may result in
acceptable growth. In Ransom’s study (2014) such was not the case, but the PCU that was used
in the study was not a blend of different durations of release like the product that was used in our
studies. The single fall application was relatively better and it is possible that a delay in the

17
timing and/or composition of the blend may result in less fall growth and better spring/summer
carryover. This research is underway.
Although two applications of PCU was better than a single application, further splits were
unnecessary as evidenced by no significant differences between two and three applications in
this study (data not shown here—see Appendix 1).
Although there is a significant amount of published research on PCU, there is minimal
work done with timing in turfgrass. In a study conducted by Nelson on fall planted wheat
(Triticum aestivum L.) grown in Novelty, Missouri, the results showed that there was a
significant gain in yield when PCU was used, but there was no significant difference in yield
between the split application of N in a spring and fall application versus a full application in fall
(2014). In Nelson’s study, the “fall” application was applied in late October, which could have
been the reason why there was no significant difference between the yield for the split
application versus the one application. Of course, wheat is grown for grain in contrast to how
turfgrass is grown. But examining this data leads to a possible hypothesis that pushing the “fall”
application into September or later for the turfgrass study may reduce the spike in shoot growth
for the 1Ap-F.
The excess amount of N being applied in agricultural and urban landscapes has negative
impacts on the environment due to the loss of N through different loss mechanisms. The process
of making N fertilizer also has an impact on the environment due to natural resources being used.
Based on the work of LeMonte (2011), LeMonte et al. (2016), and Ransom (2014) it is expected
that the environmental benefits in terms of reduced N loss due to leaching and volatilization will
be available. A reduction of N applied will also decrease economic and environmental costs
associated with applying more N.
18
LITERATURE CITED
Adams, C., Frantz, J., & Bugbee, B. (2013). Macro- and micronutrient-release characteristics of
three polymer-coated fertilizers: Theory and measurements. J. Plant Nutr. Soil Sci. Journal
of Plant Nutrition and Soil Science, 176(1), 76-88.
Bandaranayake, W., Qian, Y., Parton, W., Ojima, D., & Follet, R. (2003). Estimation of Soil
Organic Carbon Changes in Turfgrass Systems Using the CENTURY Model. Agronomy
Journal, 95(3), 558-558. Doi:10.2134/agronj2003.0558
Barker, A., and Pilbeam, D. (2007). Handbook of Plant Nutrition. CRC Press, Boca Raton, FL.
Blaylock, A., Binford. G., Dowbenko, R., Kaufmann, J., & Islam, R. (2005). ESN, Controlled-
Release Nitrogen for Enhanced Nitrogen Efficiency and Improved Environmental Safety.
Science Press and Science Press USA, 381-390.
Bowman, D., Cherney, C., & Rufty, T. (2002). Fate and Transport of Nitrogen Applied to Six
Warm-Season Turfgrasses. Crop Science, 42(3), 833-840. Retrieved December 2, 2014, from
http://www.carleton.edu/departments/GEOL/Resources/comps/CompsPDFfiles/2009/Linetd
WebPg/Papers/Fate and Transport of Nitrogen Applied to Six Warm Season Turfgrasses.pdf
Bremer, D. (2007) Carbon Sequestration in Turfgrass: An Eco-Friendly Benefit of Your Lawn.
Turfnews, a quarterly Kansas Turfgrass Foundation Newsletter.
Burton, D. L., Li. X., and Grant, C. A. (2003) Reducing nitrous oxide emissions through the use
of fertilizer management technologies. Dept. Soil Science, University of Manitoba,
Winnipeg, Manitoba, Canada.
Cameron, K., Di, H., & Moir, J. (2013). Nitrogen Losses From the Soil/Plant System: A
review.Annals of Applied Biology, 162, 145-173.
Carrow, R. N. (1997). Turfgrass Response to Slow-Release Nitrogen Fertilizers. Agronomy
Journal, 89(3), 491.

19
Chatterjee, A. (2012). Reducing Denitrification Loss of Nitrogen Fertilizer. Crop and Soil
Magazine: 45: 14-15.
Christians, N. (2007). Fertilization. In Fundamentals of turfgrass management (4th ed., pp. 141-
143). Hoboken, N.J.: John Wiley & Sons.
Du, C., Zhou, J., & Shaviv, A. (2006). Release Characteristics of Nutrients from Polymer-Coated
Compound Controlled Release Fertilizers. Journal of Polymers and the Environment J Polym
Environ, 14, 223-230.
Easton, Z. M., & Petrovic, A. M. (2004). Fertilizer Source Effect on Ground and Surface Water
Quality in Drainage from Turfgrass. Journal of Environment Quality, 33(2), 645.
Ellison, E., Blaylock, A., Sanchez, C., & Smith, R. (2013, November 17). Exploring Controlled
Release Nitrogen Fertilizers for Vegetable and Melon Crop Production in California and
Arizona. Lecture presented at Western Nutrient Management Conference, Reno.
Food and Agriculture Organization of the United Nations. Current world fertilizer trends and
outlook to 2014/15. Rep. Rome: FAO, 2011.
Guillard, K., & Kopp, K. (2004). Nitrogen Fertilizer Form and Associated Nitrate Leaching from
Cool-Season Lawn Turf. Journal of Environment Quality, 1822-1827.
Hirsch, A., Michalak, A., Bruhwiler, L., Peters, W., Dlugokencky, E., & Tans, P. (2006). Inverse
modeling estimates of the global nitrous oxide surface flux from 1998-2001.Global
Biogeochem. Cycles Global Biogeochemical Cycles.
Hopkins, B., Rosen, C., Shiffler, A., & Taysom, T. (2008). Enhanced Efficiency Fertilizers for
Improved Nutrient Management: Potato. Crop Management. Doi:10_1094/CM-20080317-01-
RV.

20
Hyatt, C., Venterea, R., Rosen, C., Mcnearney, M., Wilson, M., & Dolan, M. (2010). Polymer-
Coated Urea Maintains Potato Yields and Reduces Nitrous Oxide Emissions in a Minnesota
Loamy Sand. Soil Science Society of America Journal, 74, 419-428.
IPCC. (1996) Climate Change 1995: Impacts, Adaptations and Mitigation of Climate Change:
ScientificTechnical Analyses. Intergovernmental Panel on Climate Change, Cambridge
University Press, Melbourne, Australia.
Knight, E., Guertal, E., & Wood, C. (2007). Mowing and Nitrogen Source Effects on Ammonia
Volatilization from Turfgrass. Crop Science, 47, 1628-1634.
LeMonte, J. 2011 Environmental Implications of Polymer Coated Urea. Thesis. Brigham Young
University. Department of Plant and Wildlife Sciences. Scholars Archive. Brigham Young
University.
Lemonte, J. J., Jolley, V. D., Summerhays, J. S., Terry, R. E., & Hopkins, B. G. (2016). Polymer
Coated Urea in Turfgrass Maintains Vigor and Mitigates Nitrogen's Environmental Impacts.
PLOS ONE PLoS ONE, 11(1).
Marschner, P. (2012). Mineral Nutrition of Higher Plants (3rd ed.). San Diego, CA: Elsevier.
McTaggart, I., Clayton, H., and Smith, K. (1994) Nitrous oxide flux from fertilized grassland:
strategies for reducing emissions. In: Non-CO2 Greenhouse Gases [van Ham, L. et al., Eds.].
Kluwer Academic Publishers, Dordrecht, Netherlands, 421-426.
Milesi, C., Running, S., Elyidge, C., Dietz, J., Tuttle, B., & Nemani, R. (2005). Mapping and
Modeling the Biogeochemical Cycling of Turf Grasses in the United States. Environmental
Management, 36(3), 426-438.

21
Milesi, C., Elyidge, C., Dietz, J., Tuttle, B., Nemani, R., & Running, S. (n.d.). A Strategy for
Mapping and Modeling the Ecological Effects of US Lawns. Retrieved January 8, 2016, from
http://www.isprs.org/proceedings/XXXVI/8-W27/milesi.pdf.
Miltner, E., Stahnke, G., Johnston, W., & Golob, C. (2004). Late Fall and Winter Nitrogen
Fertilization of Turfgrass in Two Pacific Northwest Climates. Hortscience, (39), 1745-1749.
Minami, K. (1994) Effect of Nitrification Inhibitors and Slow-Release Fertilizer on Emission of
Nitrous Oxide from Fertilized Soils. In CH4 and N2O: global Emissions and Controls from
Rice Fields and Other Agricultural and Industrial Sources. [Minami, K., Mosier, A.R., and
Sass, R. Eds.] NIAES Series 2, Yokendo Publishers, Tokyo, Japan.
National Turfgrass Federation. (2003). The Turfgrass Industry- Present and Future. Retrieved
November 28, 2014, from http://www.turfresearch.org/pdf/Industry Turf Initiative.pdf
Nelson, K., Motayalli, P., & Nathan, M. (2014). Nitrogen Fertilizer Sources and Application
Timing Affects Wheat and Inter-Seeded Red Clover Yields on Claypan Soils. Agronomy,
497-513. doi: 10.3390/agronomy4040497.
Nelson, K., Paniagua, S., & Motavalli, P. (2009). Effect of Polymer Coated Urea, Irrigation, and
Drainage on Nitrogen Utilization and Yield of Corn in a Claypan Soil. Agronomy Journal,
101, 681-687.
Nielson, R. (2006). N Loss Mechanisms and Nitrogen Use Efficiency. Purdue Nitrogen
Management Workshops, 1-5. Retrieved December 1, 2014, from
http://www.agry.purdue.edu/ext/pubs/2006NLossMechanisms.pdf
Norton, R., Mikkelsen, R., & Jensen, T. (2013). Sulfur for Plant Nutrition. Better Crops 97.2 10-
12.
22
Pack, J., & Hutchinson, C. (2003). Potato (Solanum tuberosum L.) Tuber Yields, Specific
Gravities, and Nitrate Leaching Under Polymer Coated Urea and Ammonium Nitrate
Fertilizer Program. Hortscience. (38), 719-720.
Pack, J., Hutchinson, C., & Simonne, E. (2006). Evaluation of Controlled-Release Fertilizers for
Northeast Florida Chip Potato Production. Journal of Plant Nutrition, 29, 1301-1313.
Qian, Y., & Follett, R. (2015). Assessing Soil Carbon Sequestration in Turfgrass Systems Using
Long-Term Soil Testing Data. Agronomy Journal, 930-930. doi:10.2134/agronj2002.0930
Ransom, C. (2014) Nitrogen Use Efficiency of Polymer-Coated Urea. Thesis. Brigham Young
University. Department of Plant and Wildlife Sciences. Scholars Archive. Brigham Young
University.
Runfola, D. S., Hamill, T., Pontius, R. G., Jr., Rogan, J., Giner, N., & Decatur, A. (2014). Using
Fine Resolution Orthoimagery and Spatial Interpolation to Rapidly Map Turf Grass in
Suburban Massachusetts. International Journal of Geospatial and Environmental Research,
1(1). Retrieved February 10, 2016, from
http://dc.uwm.edu/cgi/viewcontent.cgi?article=1004&context=ijger.
Sahu, R. (n.d.). Technical Assessment of the Carbon Sequestration Potential of Managed
Turfgrass in the United States. Retrieved January 8, 2016, from
http://opei.org/content/uploads/2014/02/TurfGrassSahu.pdf.
Snyder, C., Bruulsema, T., and Jensen, T. (2007). Greenhouse Gas Emissions from Cropping
Systems and the Influence of Fertilizer Management—a literature review. International Plant
Nutrition Institute, Norcross, Georgia, U.S.A.
23
Sutton, M., Erisman, J., Dentener, F., & Moller, D. (2008). Ammonia in the Environment: From
Ancient Times to the Present. Environmental Pollution. (156), 583-604.
Unruh, J.B., Telenko, D. E. P, &Trenholm, L.E. (2013). Influence of Nitrogen Source on
Nitratenitrogen Leaching When Applied to Centipedegrass and St. Augustinegrass. In
Abstracts, ASA•CSSA•SSSA International Annual Meetings, Tampa, FL. 3-6 Nov. 2013.
ASACSSA-SSSA, Madison, WI.
USEPA (2007). Inventory of U.S. Greenhouse Gas Emissions and Sinks:1990–2005. EPA 430-
R- 07-002. USEPA, Washington, DC.
Walker, K., Bigelow, C., Smith, D., Scoyoc, G., & Reicher, Z. (2007). Aboveground Responses
of Cool-Season Lawn Species to Nitrogen Rates and Application Timings. Crop Science,
47(3), 1225-1225. doi:10.2135/cropsci2003.09.0595.
Wilson, M., Rosen, C., & Moncrief, J. (2010). Effects of Polymer-Coated Urea on Nitrate
Leaching and Nitrogen Uptake by Potato. Journal of Environment Quality, 39, 492-499.
24
FIGURES
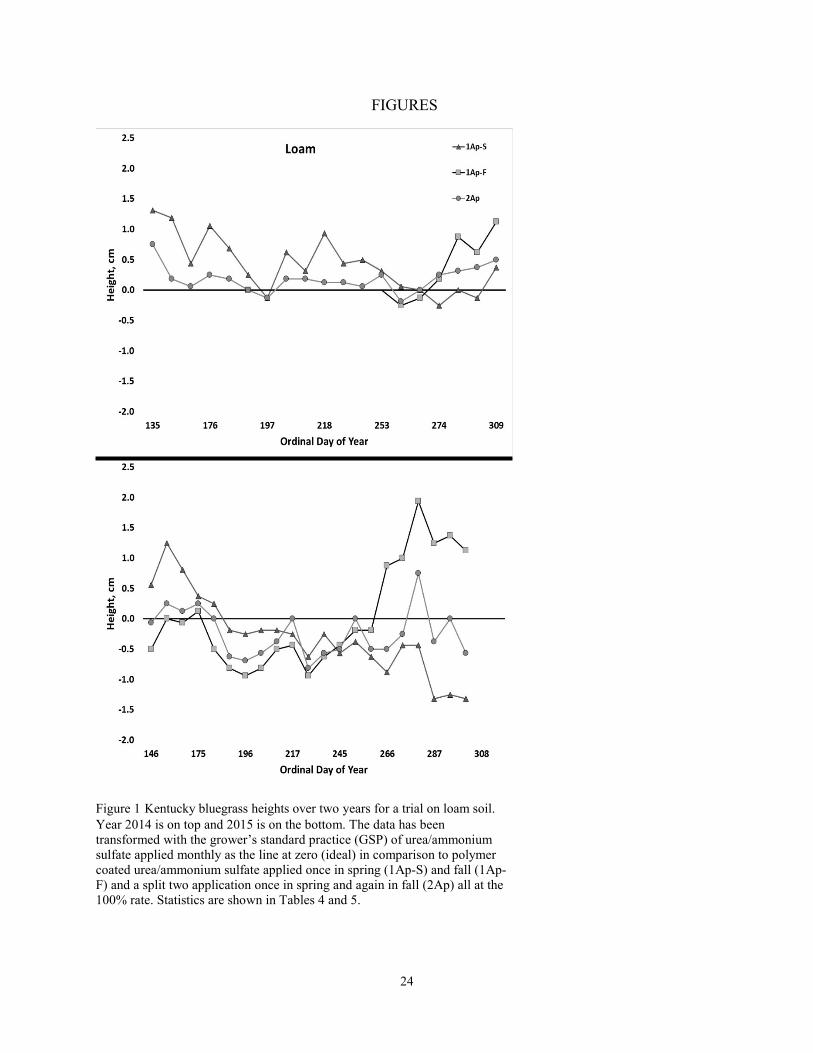
Figure 1 Kentucky bluegrass heights over two years for a trial on loam soil. Year 2014 is on top and 2015 is on the bottom. The data has been transformed with the grower’s standard practice (GSP) of urea/ammonium sulfate applied monthly as the line at zero (ideal) in comparison to polymer coated urea/ammonium sulfate applied once in spring (1Ap-S) and fall (1Ap-F) and a split two application once in spring and again in fall (2Ap) all at the100% rate. Statistics are shown in Tables 4 and 5.
25
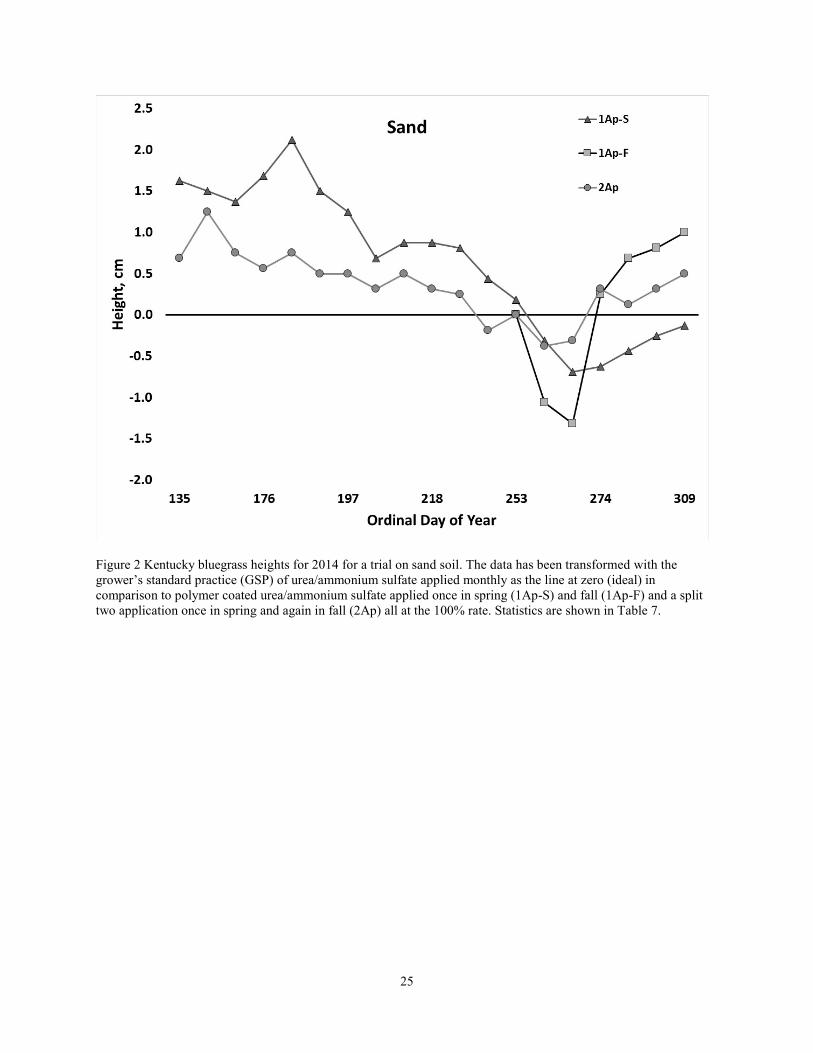
Figure 2 Kentucky bluegrass heights for 2014 for a trial on sand soil. The data has been transformed with the grower’s standard practice (GSP) of urea/ammonium sulfate applied monthly as the line at zero (ideal) in comparison to polymer coated urea/ammonium sulfate applied once in spring (1Ap-S) and fall (1Ap-F) and a split two application once in spring and again in fall (2Ap) all at the 100% rate. Statistics are shown in Table 7.
26
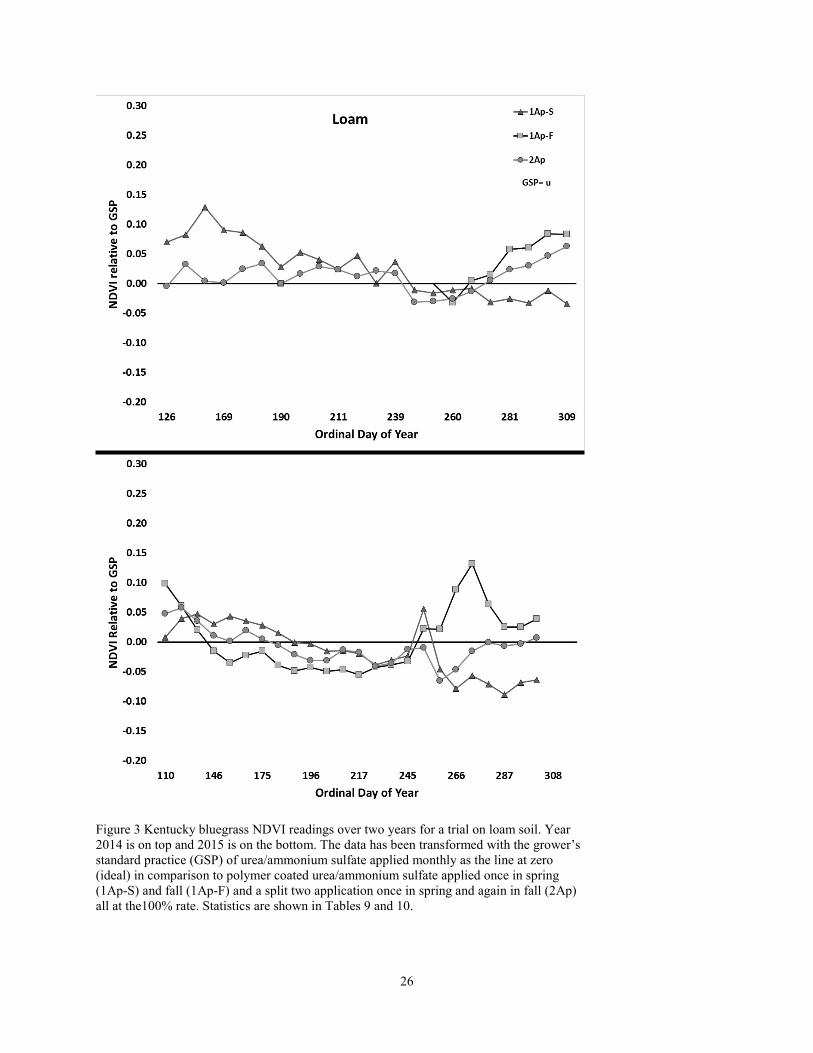
Figure 3 Kentucky bluegrass NDVI readings over two years for a trial on loam soil. Year 2014 is on top and 2015 is on the bottom. The data has been transformed with the grower’s standard practice (GSP) of urea/ammonium sulfate applied monthly as the line at zero (ideal) in comparison to polymer coated urea/ammonium sulfate applied once in spring (1Ap-S) and fall (1Ap-F) and a split two application once in spring and again in fall (2Ap) all at the100% rate. Statistics are shown in Tables 9 and 10.
27
Figure 4 Kentucky bluegrass NDVI readings for 2014 for a trial on sand soil. The data has been transformed with the grower’s standard practice (GSP) of urea/ammonium sulfate applied monthly as the line at zero (ideal) in comparison to polymer coated urea/ammonium sulfate applied once in spring (1Ap-S) and fall (1Ap-F) and a split two application once in spring and again in fall (2Ap) all at the 100% rate. Statistics are shown in Table 12.

28
Figure 5 Kentucky bluegrass shoot density for 2015 for a trial on loam soil. The grower’s standard practice (GSP) of urea/ammonium sulfate applied monthly, and polymer coated urea/ammonium sulfate applied once in spring (1Ap-S) and fall (1Ap-F) and a split two application once in spring and again in fall (2Ap) all at the 100% rate are shown. Astericks correspond with significance. Data shown in Table 15.
29
TABLES
Table 1 Soil test values for two Kentucky bluegrass trials (Loam and Sand)
Texture Sandy Loam Sand
pH (2:1) 8 7.4
ECe (2:1) mmhos/cm-1 0.5 0.2
excess lime % 5 0 OM 2.4 1.6
NO3-N mg kg-1 4 2 NH4-N 2 2
P (bicarb) 19 5 K 275 75 S 15 5
Ca 2203 200 Mg 377 24 Na 92 23
Zn DTPA 1.6 0.5 Fe 9 5 Mn 8 2 Cu 0.6 0.3
B H2O 1.1 0.5
30
Table 2 Percentages of the full rate of nitrogen fertilizer for Kentucky bluegrass trials treatments. The N rate for each treatment was 19.5 and 29.3 g m-2 for loam and sand trials, respectively. Treatments included a grower’s standard practice (GSP) compared to polymer coated urea (PCU)/ammonium sulfate (AS) blends applied once in spring (1Ap-S), once in fall (1Ap-F), or with two annual applications—in spring and fall (2Ap).
GSP 1Ap-S 1Ap-F 2Ap
----------------------------- % -----------------------------
April urea 8.3 AS 4.2 33.3 16.5
PCU 66.7 33.5
May urea 8.3 AS 4.2
PCU
June urea 8.3 AS 4.2
PCU
July urea 8.3 AS 4.2
PCU
August urea 8.3 AS 4.2 33.3 16.5
PCU 66.7 33.5
September urea 8.3 AS 4.2
PCU
October urea 8.3 AS 4.2
PCU
November urea 8.3 AS 4.2
PCU
31
Table 3 P-values for each measurement taken in the corresponding year and soil study. Statistically significant values are in bold-faced type.
Sand 2014 Loam 2014 Loam 2015
NDVI ordinal day <.0001 <.0001 <.0001 treatment <.0001 <.0001 0.0030
ordinal day*treatment <.0001 <.0001 <.0001
verdure ordinal day 0.0005 0.0025 0.0081 treatment <.0001 <.0001 <.0001
ordinal day*treatment 0.0004 0.0012 <.0001
shoot biomass ordinal day 0.4343 0.0101 0.5687 treatment <.0001 0.0003 <.0001
ordinal day*treatment 0.0016 0.0004 <.0001
height ordinal day <.0001 <.0001 <.0001 treatment <.0001 <.0001 <.0001
ordinal day*treatment <.0001 <.0001 <.0001
shoot N ordinal day 0.0007 0.0003 <.0001 treatment <.0001 <.0001 <.0001
ordinal day*treatment <.0001 <.0001 <.0001
32
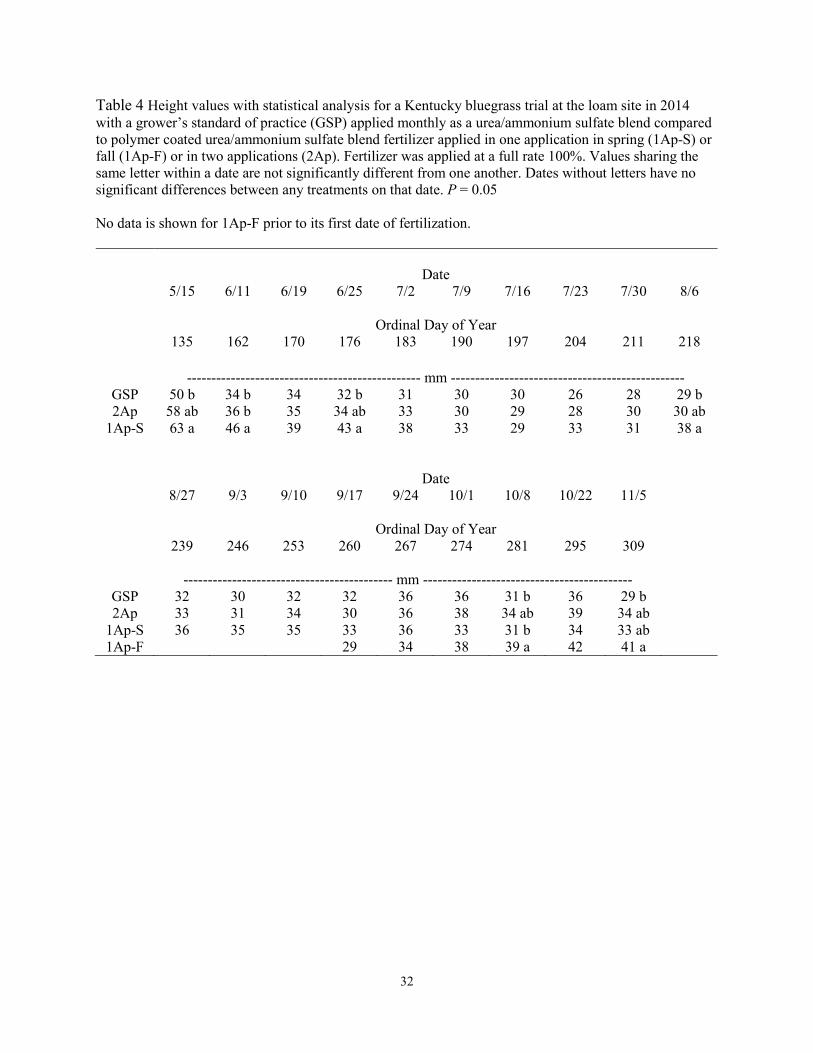
Table 4 Height values with statistical analysis for a Kentucky bluegrass trial at the loam site in 2014 with a grower’s standard of practice (GSP) applied monthly as a urea/ammonium sulfate blend compared to polymer coated urea/ammonium sulfate blend fertilizer applied in one application in spring (1Ap-S) or fall (1Ap-F) or in two applications (2Ap). Fertilizer was applied at a full rate 100%. Values sharing the same letter within a date are not significantly different from one another. Dates without letters have no significant differences between any treatments on that date. P = 0.05
No data is shown for 1Ap-F prior to its first date of fertilization.
Date 5/15 6/11 6/19 6/25 7/2 7/9 7/16 7/23 7/30 8/6
Ordinal Day of Year 135 162 170 176 183 190 197 204 211 218
------------------------------------------------ mm ------------------------------------------------ GSP 50 b 34 b 34 32 b 31 30 30 26 28 29 b 2Ap 58 ab 36 b 35 34 ab 33 30 29 28 30 30 ab
1Ap-S 63 a 46 a 39 43 a 38 33 29 33 31 38 a
Date 8/27 9/3 9/10 9/17 9/24 10/1 10/8 10/22 11/5
Ordinal Day of Year 239 246 253 260 267 274 281 295 309
------------------------------------------- mm ------------------------------------------- GSP 32 30 32 32 36 36 31 b 36 29 b 2Ap 33 31 34 30 36 38 34 ab 39 34 ab
1Ap-S 36 35 35 33 36 33 31 b 34 33 ab 1Ap-F 29 34 38 39 a 42 41 a
33
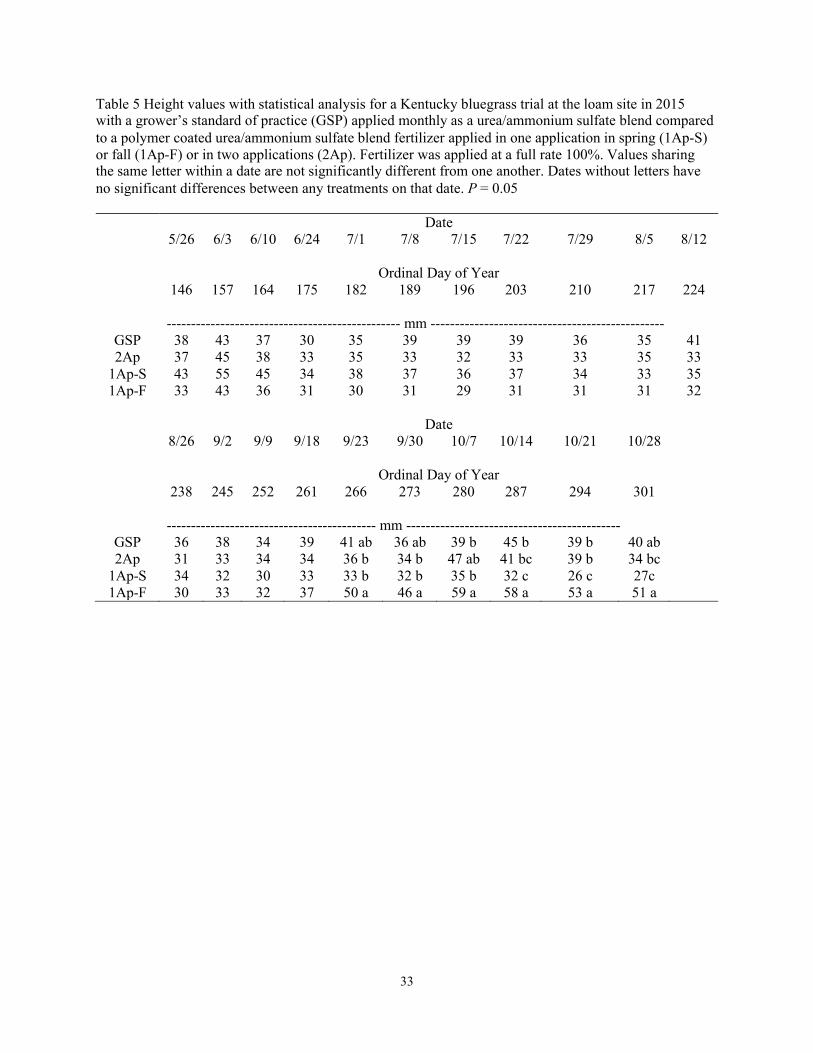
Table 5 Height values with statistical analysis for a Kentucky bluegrass trial at the loam site in 2015 with a grower’s standard of practice (GSP) applied monthly as a urea/ammonium sulfate blend compared to a polymer coated urea/ammonium sulfate blend fertilizer applied in one application in spring (1Ap-S) or fall (1Ap-F) or in two applications (2Ap). Fertilizer was applied at a full rate 100%. Values sharing the same letter within a date are not significantly different from one another. Dates without letters have no significant differences between any treatments on that date. P = 0.05
Date 5/26 6/3 6/10 6/24 7/1 7/8 7/15 7/22 7/29 8/5 8/12
Ordinal Day of Year 146 157 164 175 182 189 196 203 210 217 224
------------------------------------------------ mm ------------------------------------------------ GSP 38 43 37 30 35 39 39 39 36 35 41 2Ap 37 45 38 33 35 33 32 33 33 35 33
1Ap-S 43 55 45 34 38 37 36 37 34 33 35 1Ap-F 33 43 36 31 30 31 29 31 31 31 32
Date 8/26 9/2 9/9 9/18 9/23 9/30 10/7 10/14 10/21 10/28
Ordinal Day of Year 238 245 252 261 266 273 280 287 294 301
------------------------------------------- mm -------------------------------------------- GSP 36 38 34 39 41 ab 36 ab 39 b 45 b 39 b 40 ab 2Ap 31 33 34 34 36 b 34 b 47 ab 41 bc 39 b 34 bc
1Ap-S 34 32 30 33 33 b 32 b 35 b 32 c 26 c 27c 1Ap-F 30 33 32 37 50 a 46 a 59 a 58 a 53 a 51 a
34
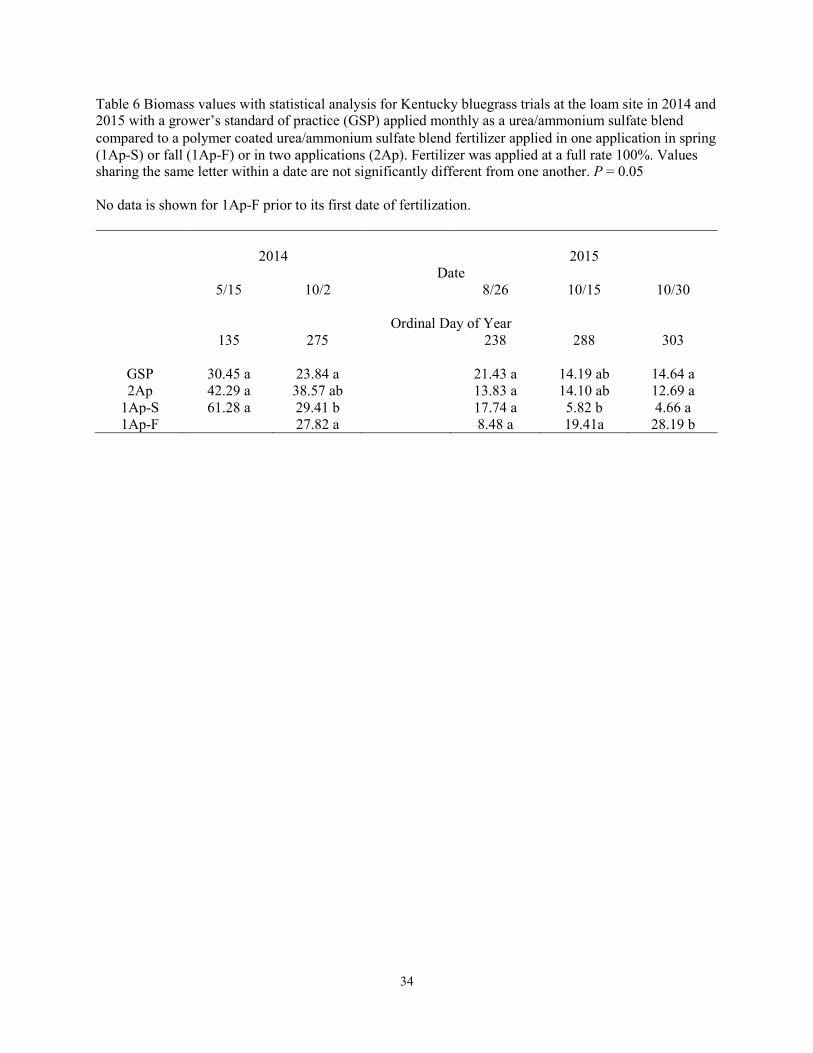
Table 6 Biomass values with statistical analysis for Kentucky bluegrass trials at the loam site in 2014 and 2015 with a grower’s standard of practice (GSP) applied monthly as a urea/ammonium sulfate blend compared to a polymer coated urea/ammonium sulfate blend fertilizer applied in one application in spring (1Ap-S) or fall (1Ap-F) or in two applications (2Ap). Fertilizer was applied at a full rate 100%. Values sharing the same letter within a date are not significantly different from one another. P = 0.05
No data is shown for 1Ap-F prior to its first date of fertilization.
2014 2015 Date
5/15 10/2 8/26 10/15 10/30
Ordinal Day of Year 135 275 238 288 303
GSP 30.45 a 23.84 a 21.43 a 14.19 ab 14.64 a 2Ap 42.29 a 38.57 ab 13.83 a 14.10 ab 12.69 a
1Ap-S 61.28 a 29.41 b 17.74 a 5.82 b 4.66 a 1Ap-F 27.82 a 8.48 a 19.41a 28.19 b

35
Table 7 Height values with statistical analysis for a Kentucky bluegrass trial at the sand site in 2014 with a grower’s standard of practice (GSP) applied monthly as a urea/ammonium sulfate blend compared to a polymer coated urea/ammonium sulfate blend fertilizer applied in one application in spring (1Ap-S) or fall (1Ap-F) or in two applications (2Ap). Fertilizer was applied at a full rate 100%. Values sharing the same letter within a date are not significantly different from one another. Dates without letters have no significant differences between any treatments on that date. P = 0.05
No data is shown for 1Ap-F prior to its first date of fertilization.
Date 5/15 6/11 6/19 6/25 7/2 7/9 7/16 7/23 7/30 8/6
Ordinal Day of Year 135 162 170 176 183 190 197 204 211 218
------------------------------------------ mm ------------------------------------------ GSP 53 b 45 b 36 36 b 35 b 34 b 34 b 28 31 29 2Ap 60 ab 58 a 44 41 b 43 b 39 b 39 ab 31 36 32
1Ap-S 69 a 60 a 50 53 a 56 a 49 a 46 a 35 40 38
Date 8/27 9/3 9/10 9/17 9/24 10/1 10/8 10/22 11/5
Ordinal Day of Year 239 246 253 260 267 274 281 295 309
--------------------------------------- mm --------------------------------------- GSP 31 33 37 37 a 41 a 43 35 ab 33 ab 31 b 2Ap 33 31 37 33 ab 38 a 46 36 ab 36 ab 36 ab
1Ap-S 39 37 39 34 ab 34 ab 36 31 b 30 b 29 b 1Ap-F 26 b 28 b 45 42 a 41 a 41 a
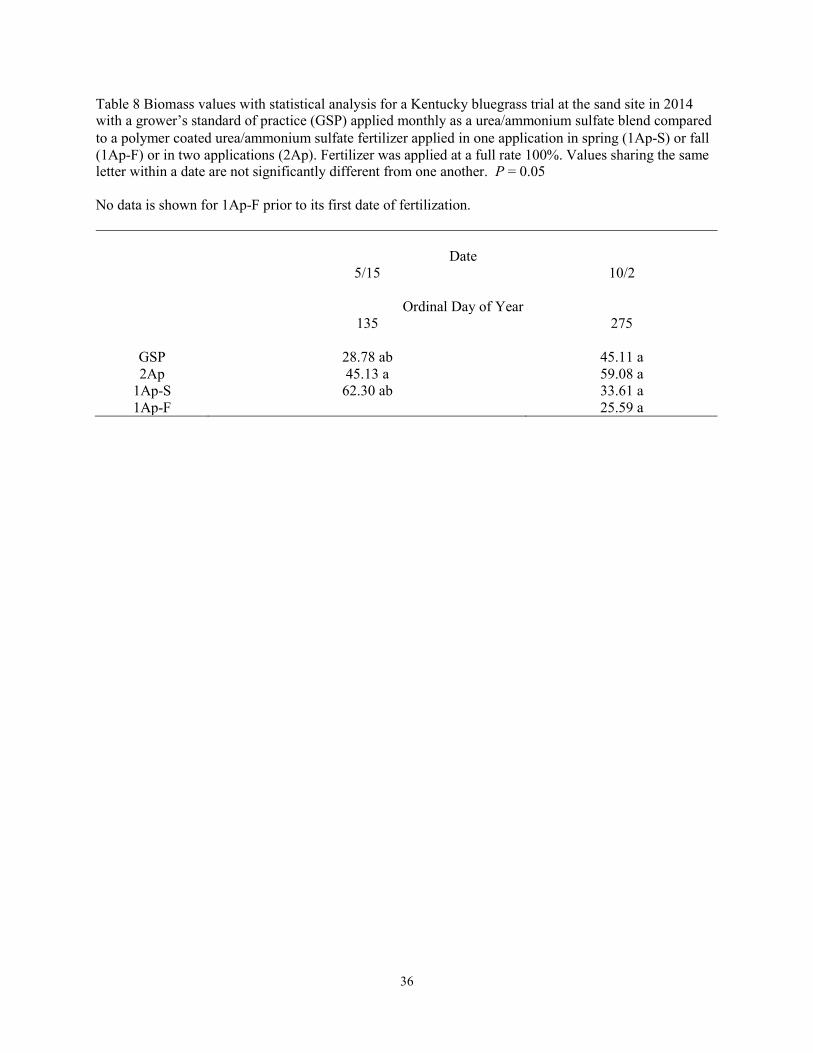
36
Table 8 Biomass values with statistical analysis for a Kentucky bluegrass trial at the sand site in 2014 with a grower’s standard of practice (GSP) applied monthly as a urea/ammonium sulfate blend compared to a polymer coated urea/ammonium sulfate fertilizer applied in one application in spring (1Ap-S) or fall (1Ap-F) or in two applications (2Ap). Fertilizer was applied at a full rate 100%. Values sharing the same letter within a date are not significantly different from one another. P = 0.05
No data is shown for 1Ap-F prior to its first date of fertilization.
Date 5/15 10/2
Ordinal Day of Year 135 275
GSP 28.78 ab 45.11 a 2Ap 45.13 a 59.08 a
1Ap-S 62.30 ab 33.61 a 1Ap-F 25.59 a
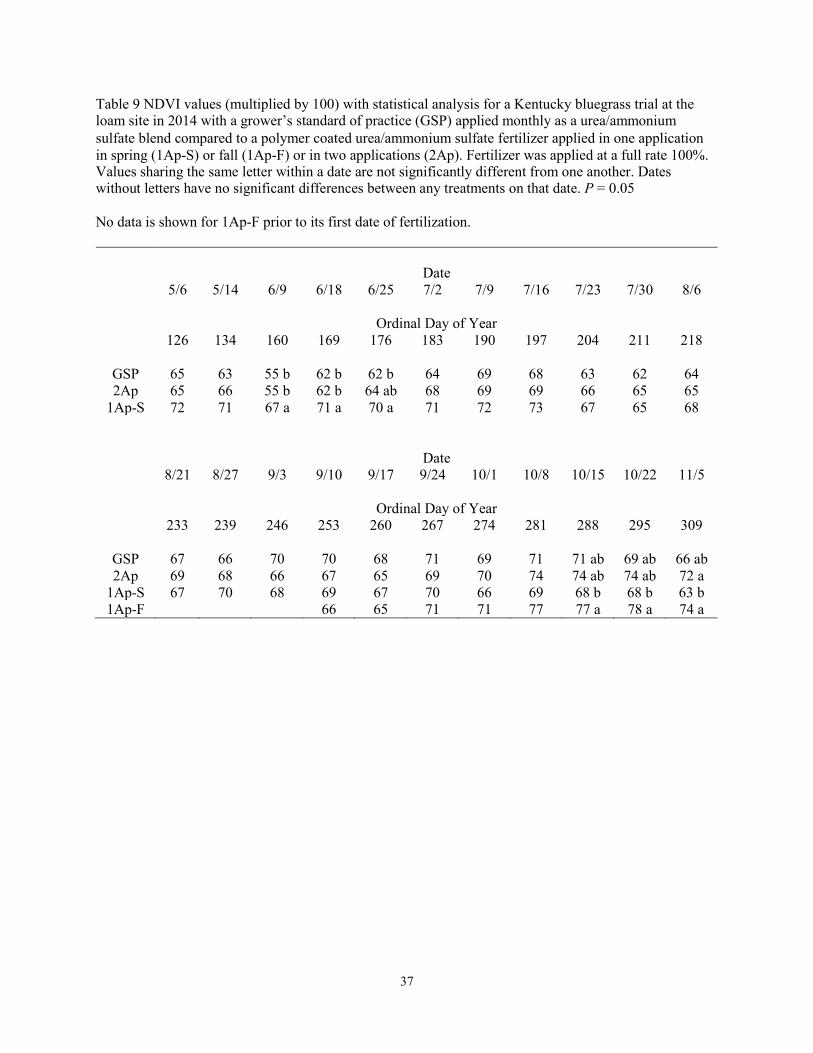
37
Table 9 NDVI values (multiplied by 100) with statistical analysis for a Kentucky bluegrass trial at the loam site in 2014 with a grower’s standard of practice (GSP) applied monthly as a urea/ammonium sulfate blend compared to a polymer coated urea/ammonium sulfate fertilizer applied in one application in spring (1Ap-S) or fall (1Ap-F) or in two applications (2Ap). Fertilizer was applied at a full rate 100%. Values sharing the same letter within a date are not significantly different from one another. Dates without letters have no significant differences between any treatments on that date. P = 0.05
No data is shown for 1Ap-F prior to its first date of fertilization.
Date 5/6 5/14 6/9 6/18 6/25 7/2 7/9 7/16 7/23 7/30 8/6
Ordinal Day of Year 126 134 160 169 176 183 190 197 204 211 218
GSP 65 63 55 b 62 b 62 b 64 69 68 63 62 64 2Ap 65 66 55 b 62 b 64 ab 68 69 69 66 65 65
1Ap-S 72 71 67 a 71 a 70 a 71 72 73 67 65 68
Date 8/21 8/27 9/3 9/10 9/17 9/24 10/1 10/8 10/15 10/22 11/5
Ordinal Day of Year 233 239 246 253 260 267 274 281 288 295 309
GSP 67 66 70 70 68 71 69 71 71 ab 69 ab 66 ab 2Ap 69 68 66 67 65 69 70 74 74 ab 74 ab 72 a
1Ap-S 67 70 68 69 67 70 66 69 68 b 68 b 63 b 1Ap-F 66 65 71 71 77 77 a 78 a 74 a
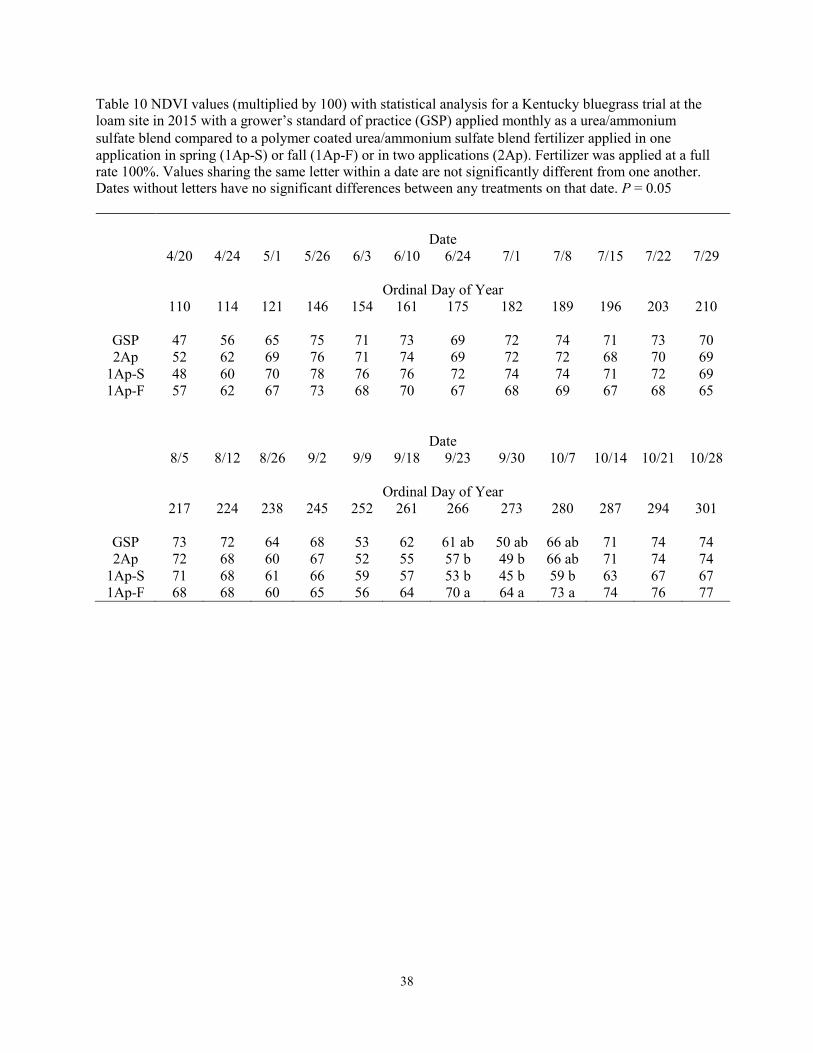
38
Table 10 NDVI values (multiplied by 100) with statistical analysis for a Kentucky bluegrass trial at the loam site in 2015 with a grower’s standard of practice (GSP) applied monthly as a urea/ammonium sulfate blend compared to a polymer coated urea/ammonium sulfate blend fertilizer applied in one application in spring (1Ap-S) or fall (1Ap-F) or in two applications (2Ap). Fertilizer was applied at a full rate 100%. Values sharing the same letter within a date are not significantly different from one another. Dates without letters have no significant differences between any treatments on that date. P = 0.05
Date 4/20 4/24 5/1 5/26 6/3 6/10 6/24 7/1 7/8 7/15 7/22 7/29
Ordinal Day of Year 110 114 121 146 154 161 175 182 189 196 203 210
GSP 47 56 65 75 71 73 69 72 74 71 73 70 2Ap 52 62 69 76 71 74 69 72 72 68 70 69
1Ap-S 48 60 70 78 76 76 72 74 74 71 72 69 1Ap-F 57 62 67 73 68 70 67 68 69 67 68 65
Date 8/5 8/12 8/26 9/2 9/9 9/18 9/23 9/30 10/7 10/14 10/21 10/28
Ordinal Day of Year 217 224 238 245 252 261 266 273 280 287 294 301
GSP 73 72 64 68 53 62 61 ab 50 ab 66 ab 71 74 74 2Ap 72 68 60 67 52 55 57 b 49 b 66 ab 71 74 74
1Ap-S 71 68 61 66 59 57 53 b 45 b 59 b 63 67 67 1Ap-F 68 68 60 65 56 64 70 a 64 a 73 a 74 76 77

39
Table 11 Visual values with statistical analysis for Kentucky bluegrass trials at the loam site in 2014 and 2015 with a grower’s standard of practice (GSP) applied monthly as a urea/ammonium sulfate blend compared to a polymer coated urea/ammonium sulfate blend fertilizer applied in one application in spring (1Ap-S) or fall (1Ap-F) or in two applications (2Ap). Fertilizer was applied at a full rate 100%. The statistics within the table display those treatments with the same letters as not being significantly different. Values sharing the same letter within a date are not significantly different from one another. P = 0.05.
No data is shown for 1Ap-F prior to its first date of fertilization.
2014 2015 Date
5/6 8/27 9/17 8/26 11/1
Ordinal Day of Year 126 239 260 238 305
GSP 2.00 ab 2.75 ab 3.00 a 3.44 a 3.69 ab 2Ap 2.50 a 2.88 ab 2.75 a 2.88 a 3.63 ab
1Ap-S 4.00 b 3.63 ab 3.13 a 2.69 a 2.88 a 1Ap-F 1.88 a 2.25 a 2.63 b 4.13 b

40
Table 12 NDVI values (multiplied by 100) with statistical analysis for a Kentucky bluegrass trial at the sand site in 2014 with a grower’s standard of practice (GSP) applied monthly as a urea/ammonium sulfate blend compared to a polymer coated urea/ammonium sulfate blend fertilizer applied in one application in spring (1Ap-S) or fall (1Ap-F) or in two applications (2Ap). Fertilizer was applied at a full rate 100%. Values sharing the same letter within a date are not significantly different from one another. Dates without letters have no significant differences between any treatments on that date. P = 0.05
No data is shown for 1Ap-F prior to its first date of fertilization.
Date 5/6 5/14 6/9 6/18 6/25 7/2 7/9 7/16 7/23 7/30 8/6
Ordinal Day of Year 126 134 160 169 176 183 190 197 204 211 218
GSP 63 64 31 b 53 b 57 b 64 b 68 68 68 66 65 2Ap 67 68 53 a 63 a 66 a 72 a 73 72 72 67 67
1Ap-S 69 70 61 a 69 a 72 a 74 a 75 73 73 70 68
Date 8/21 8/27 9/3 9/10 9/17 9/24 10/1 10/8 10/15 10/22 11/5
Ordinal Day of Year 233 239 246 253 260 267 274 281 288 295 309
GSP 71 69 70 69 71 74 74 75 75 a 74 ab 70 ab 2Ap 72 70 68 68 66 71 73 75 75 a 76 a 74 a
1Ap-S 73 71 69 68 68 69 68 70 69 b 69 b 64 b 1Ap-F 67 66 70 75 78 78 a 78 a 76 a

41
Table 13 Visual values with statistical analysis for a Kentucky bluegrass trial at the sand site in 2014 with a grower’s standard of practice (GSP) applied monthly as a urea/ammonium sulfate blend compared to a polymer coated urea/ammonium sulfate blend fertilizer applied in one application in spring (1Ap-S) or fall (1Ap-F) or in two applications (2Ap). Fertilizer was applied at a full rate 100%. Values sharing the same letter within a date are not significantly different from one another. P = 0.05
No data is shown for 1Ap-F prior to its first date of fertilization.
Date 5/6 8/27 9/17
Ordinal Day of Year 126 239 260
GSP 2.25 a 3.25 ab 3.50 ab 2Ap 2.75 a 3.88 ab 3.38 ab
1Ap-S 3.00 a 4.13 a 3.75 a 1Ap-F 1.75 b 2.13 b
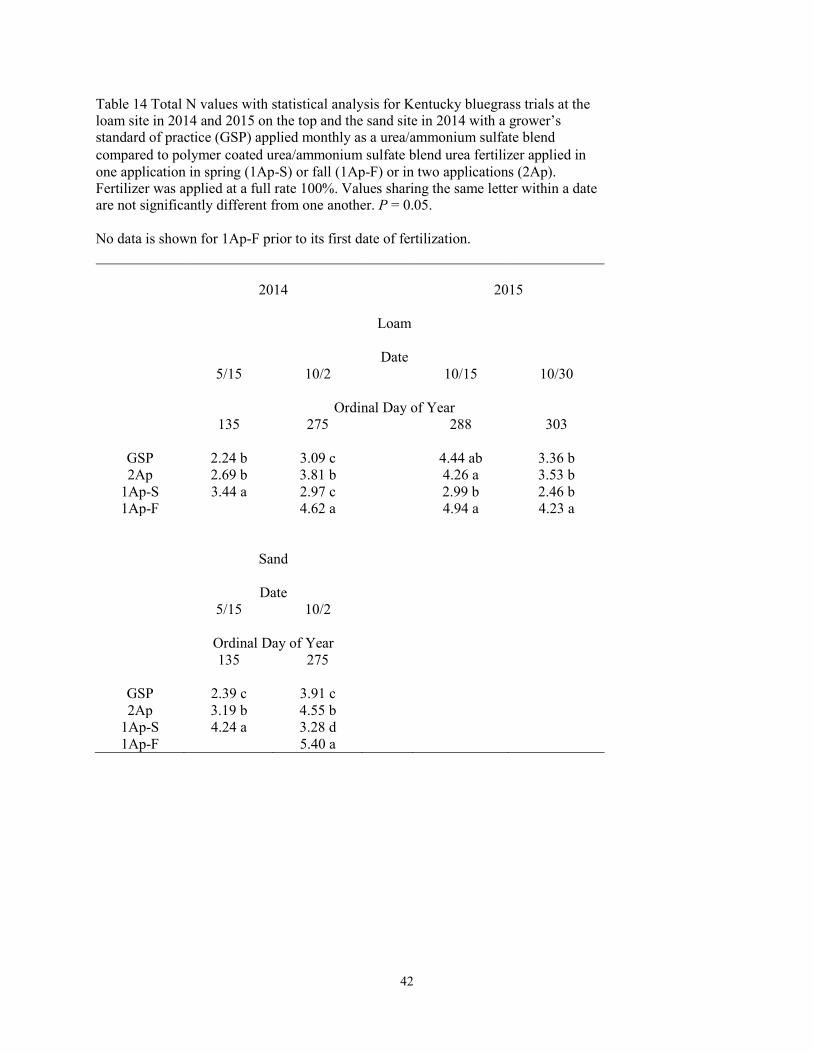
42
Table 14 Total N values with statistical analysis for Kentucky bluegrass trials at the loam site in 2014 and 2015 on the top and the sand site in 2014 with a grower’s standard of practice (GSP) applied monthly as a urea/ammonium sulfate blend compared to polymer coated urea/ammonium sulfate blend urea fertilizer applied in one application in spring (1Ap-S) or fall (1Ap-F) or in two applications (2Ap). Fertilizer was applied at a full rate 100%. Values sharing the same letter within a date are not significantly different from one another. P = 0.05.
No data is shown for 1Ap-F prior to its first date of fertilization.
2014 2015
Loam
Date 5/15 10/2 10/15 10/30
Ordinal Day of Year 135 275 288 303
GSP 2.24 b 3.09 c 4.44 ab 3.36 b 2Ap 2.69 b 3.81 b 4.26 a 3.53 b
1Ap-S 3.44 a 2.97 c 2.99 b 2.46 b 1Ap-F 4.62 a 4.94 a 4.23 a
Sand
Date 5/15 10/2
Ordinal Day of Year 135 275
GSP 2.39 c 3.91 c 2Ap 3.19 b 4.55 b
1Ap-S 4.24 a 3.28 d 1Ap-F 5.40 a

43
Table 15 Shoot density with statistical analysis for a Kentucky bluegrass trial at the loam site in 2015 with a grower’s standard of practice (GSP) applied monthly as a urea/ammonium sulfate blend compared to a polymer coated urea/ammonium sulfate blend fertilizer applied in one application in spring (1Ap-S) or fall (1Ap-F) or in two applications (2Ap). Fertilizer was applied at a full rate 100%. Values sharing the same letter within a date are not significantly different from one another. P = 0.05
Date
10/30
Ordinal Day of Year
303
GSP 61.5 2Ap 68.5
1Ap-S 47.0 1Ap-F 70.5
44
Polymer Coated Urea in Kentucky Bluegrass: Rate of Application
Jessica C. Buss, James H. Gish, Neil C. Hansen, and Bryan G. Hopkins
Brigham Young University, Provo, UT, USA
ABSTRACT
Nitrogen (N) is the most commonly over-applied nutrient in urban environments because of the
obvious difference in “greenness”. This over-application has led to nutrient pollution of the
atmosphere and hydrosphere. Furthermore, excess N results in increases in maintenance costs
and solid waste volume. A two-year study was initiated in April 2014. Four fertilized treatments
were applied at two locations in Provo, UT. Treatments included full recommended rate of a urea
and ammonium sulfate blend split applied monthly compared to a polymer coated urea (PCU)
and ammonium sulfate blend applied at 50, 75, or 100% of the full rate applied in two equal
applications early and late in the growing season. The PCU blend applied at the full rate
performed virtually the same as the blend with uncoated urea. Reducing the rate to 75% gave
very similar results for verdure and shoot growth at both locations. However, further reduction to
the half rate consistently had significantly lower plant verdure as compared to the other
treatments. This study shows that a reduction in rate by 25% results in similar plant verdure and
shoot growth as the full rate, but reducing the rate by 50% results in lower shoot growth as well
as lower plant verdure. Further work is needed to evaluate the long-term effects of a reduced rate
of N.
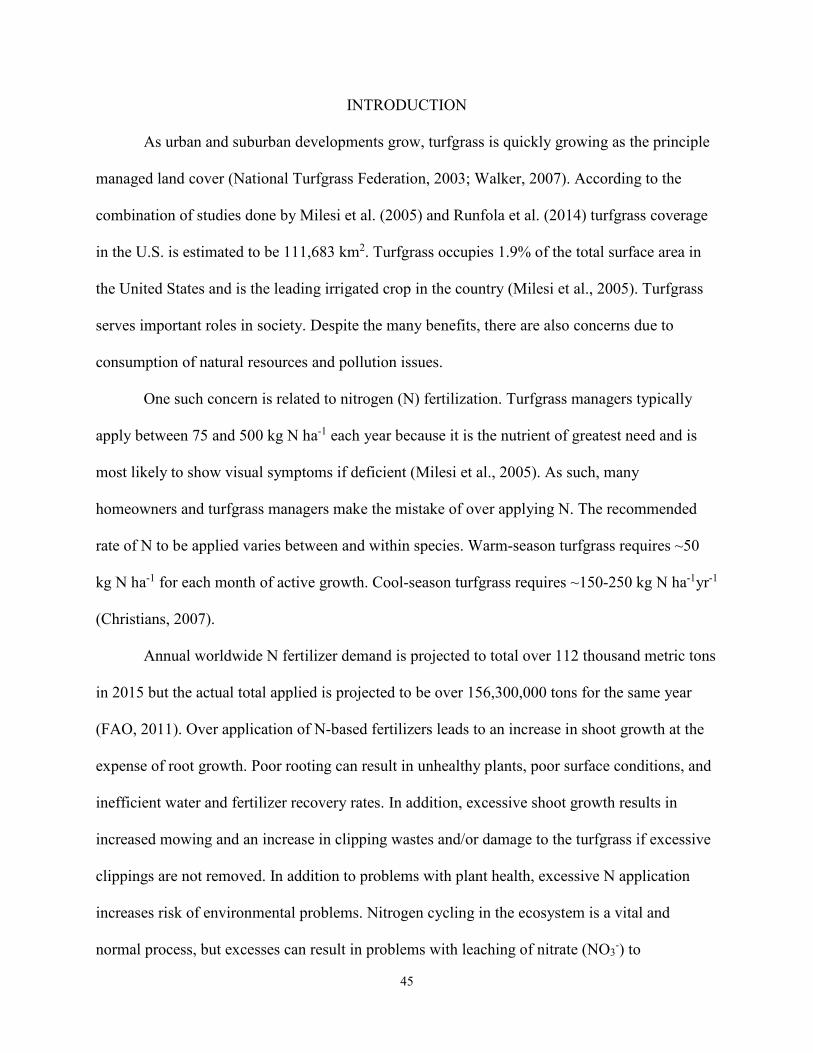
45
INTRODUCTION
As urban and suburban developments grow, turfgrass is quickly growing as the principle
managed land cover (National Turfgrass Federation, 2003; Walker, 2007). According to the
combination of studies done by Milesi et al. (2005) and Runfola et al. (2014) turfgrass coverage
in the U.S. is estimated to be 111,683 km2. Turfgrass occupies 1.9% of the total surface area in
the United States and is the leading irrigated crop in the country (Milesi et al., 2005). Turfgrass
serves important roles in society. Despite the many benefits, there are also concerns due to
consumption of natural resources and pollution issues.
One such concern is related to nitrogen (N) fertilization. Turfgrass managers typically
apply between 75 and 500 kg N ha-1 each year because it is the nutrient of greatest need and is
most likely to show visual symptoms if deficient (Milesi et al., 2005). As such, many
homeowners and turfgrass managers make the mistake of over applying N. The recommended
rate of N to be applied varies between and within species. Warm-season turfgrass requires ~50
kg N ha-1 for each month of active growth. Cool-season turfgrass requires ~150-250 kg N ha-1yr-1
(Christians, 2007).
Annual worldwide N fertilizer demand is projected to total over 112 thousand metric tons
in 2015 but the actual total applied is projected to be over 156,300,000 tons for the same year
(FAO, 2011). Over application of N-based fertilizers leads to an increase in shoot growth at the
expense of root growth. Poor rooting can result in unhealthy plants, poor surface conditions, and
inefficient water and fertilizer recovery rates. In addition, excessive shoot growth results in
increased mowing and an increase in clipping wastes and/or damage to the turfgrass if excessive
clippings are not removed. In addition to problems with plant health, excessive N application
increases risk of environmental problems. Nitrogen cycling in the ecosystem is a vital and
normal process, but excesses can result in problems with leaching of nitrate (NO3-) to
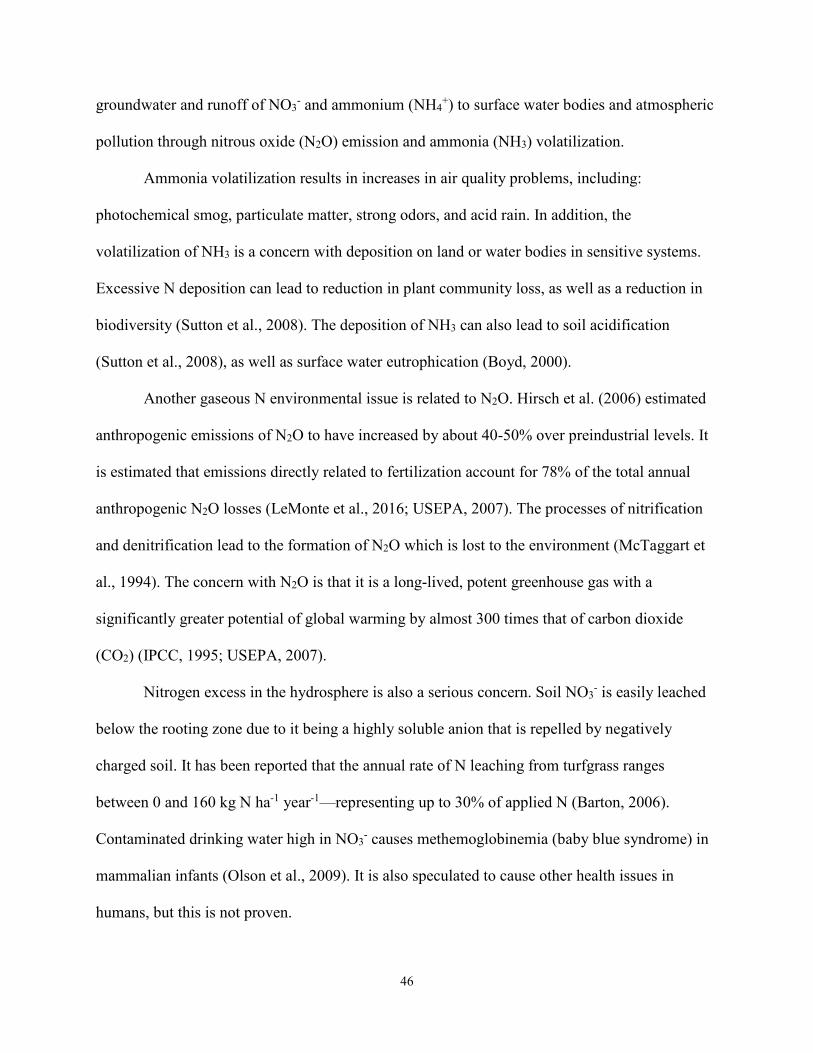
46
groundwater and runoff of NO3- and ammonium (NH4
+) to surface water bodies and atmospheric
pollution through nitrous oxide (N2O) emission and ammonia (NH3) volatilization.
Ammonia volatilization results in increases in air quality problems, including:
photochemical smog, particulate matter, strong odors, and acid rain. In addition, the
volatilization of NH3 is a concern with deposition on land or water bodies in sensitive systems.
Excessive N deposition can lead to reduction in plant community loss, as well as a reduction in
biodiversity (Sutton et al., 2008). The deposition of NH3 can also lead to soil acidification
(Sutton et al., 2008), as well as surface water eutrophication (Boyd, 2000).
Another gaseous N environmental issue is related to N2O. Hirsch et al. (2006) estimated
anthropogenic emissions of N2O to have increased by about 40-50% over preindustrial levels. It
is estimated that emissions directly related to fertilization account for 78% of the total annual
anthropogenic N2O losses (LeMonte et al., 2016; USEPA, 2007). The processes of nitrification
and denitrification lead to the formation of N2O which is lost to the environment (McTaggart et
al., 1994). The concern with N2O is that it is a long-lived, potent greenhouse gas with a
significantly greater potential of global warming by almost 300 times that of carbon dioxide
(CO2) (IPCC, 1995; USEPA, 2007).
Nitrogen excess in the hydrosphere is also a serious concern. Soil NO3- is easily leached
below the rooting zone due to it being a highly soluble anion that is repelled by negatively
charged soil. It has been reported that the annual rate of N leaching from turfgrass ranges
between 0 and 160 kg N ha-1 year-1—representing up to 30% of applied N (Barton, 2006).
Contaminated drinking water high in NO3- causes methemoglobinemia (baby blue syndrome) in
mammalian infants (Olson et al., 2009). It is also speculated to cause other health issues in
humans, but this is not proven.

47
Surface water contamination is also a concern. Both NH4+ and NO3
- can be easily
transported via surface water runoff and soil erosion (Easton, 2004). As with groundwater, NO3-
in surface water is also a potential drinking water problem. Additionally, excess N in surface
water can lead to problems from algal blooms—which can result in injury or death of the aquatic
life or organisms drinking the water, decreases in biodiversity, unsightly conditions, strong
odors, economic losses, and a decrease in recreational use (Fangmeier et al., 1994; Mulvaney et
al., 2009).
Along with needing to reduce the environmental impacts of N loss, it is also important to
recognize that N fertilizers are manufactured using natural gas and other nonrenewable
resources. In order to conserve resources and minimize environmental impacts, N loss needs to
be minimized by maximizing plant utilization of the applied N (Hopkins et al., 2008). Many
argue that planting turfgrass should be discouraged or even illegal. Although there are negative
impacts associated with turfgrass due to the over fertilization of the crop in agriculture and urban
settings and other issues (such as pesticide use and water consumption), there are many positive
impacts to society and the environment.
In addition to being aesthetically pleasing, providing a safe surface for many recreational
activities, and generating oxygen, turfgrass reduces: air temperature, atmospheric pollutants,
erosion, water and chemicals in storm drains, chemicals leached to groundwater, flooding, noise
pollution, and fire risk. By maintaining a low growing and green plant material next to buildings,
fires are less likely to spread. Air quality is improved because turfgrass is a good filter for
capturing smoke and dust. Sulfur and carbon dioxides are also absorbed from the atmosphere—
reducing acid rain and greenhouse gas concentration. In addition to the impact on global
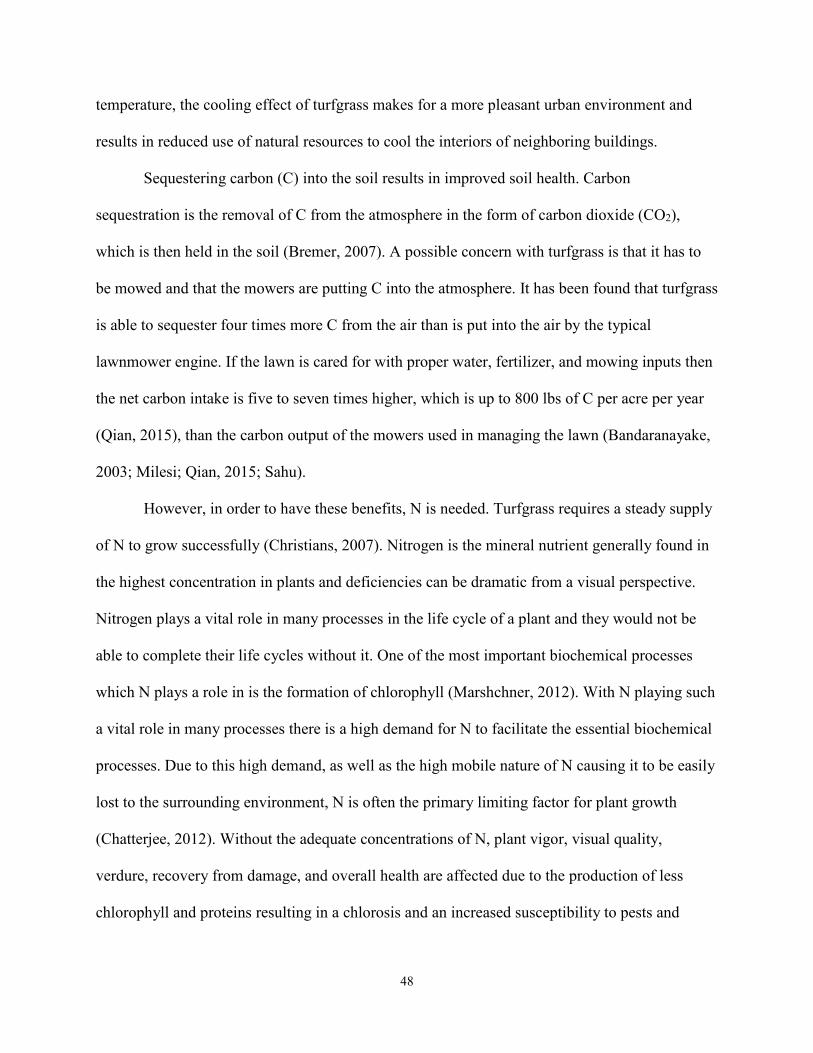
48
temperature, the cooling effect of turfgrass makes for a more pleasant urban environment and
results in reduced use of natural resources to cool the interiors of neighboring buildings.
Sequestering carbon (C) into the soil results in improved soil health. Carbon
sequestration is the removal of C from the atmosphere in the form of carbon dioxide (CO2),
which is then held in the soil (Bremer, 2007). A possible concern with turfgrass is that it has to
be mowed and that the mowers are putting C into the atmosphere. It has been found that turfgrass
is able to sequester four times more C from the air than is put into the air by the typical
lawnmower engine. If the lawn is cared for with proper water, fertilizer, and mowing inputs then
the net carbon intake is five to seven times higher, which is up to 800 lbs of C per acre per year
(Qian, 2015), than the carbon output of the mowers used in managing the lawn (Bandaranayake,
2003; Milesi; Qian, 2015; Sahu).
However, in order to have these benefits, N is needed. Turfgrass requires a steady supply
of N to grow successfully (Christians, 2007). Nitrogen is the mineral nutrient generally found in
the highest concentration in plants and deficiencies can be dramatic from a visual perspective.
Nitrogen plays a vital role in many processes in the life cycle of a plant and they would not be
able to complete their life cycles without it. One of the most important biochemical processes
which N plays a role in is the formation of chlorophyll (Marshchner, 2012). With N playing such
a vital role in many processes there is a high demand for N to facilitate the essential biochemical
processes. Due to this high demand, as well as the high mobile nature of N causing it to be easily
lost to the surrounding environment, N is often the primary limiting factor for plant growth
(Chatterjee, 2012). Without the adequate concentrations of N, plant vigor, visual quality,
verdure, recovery from damage, and overall health are affected due to the production of less
chlorophyll and proteins resulting in a chlorosis and an increased susceptibility to pests and
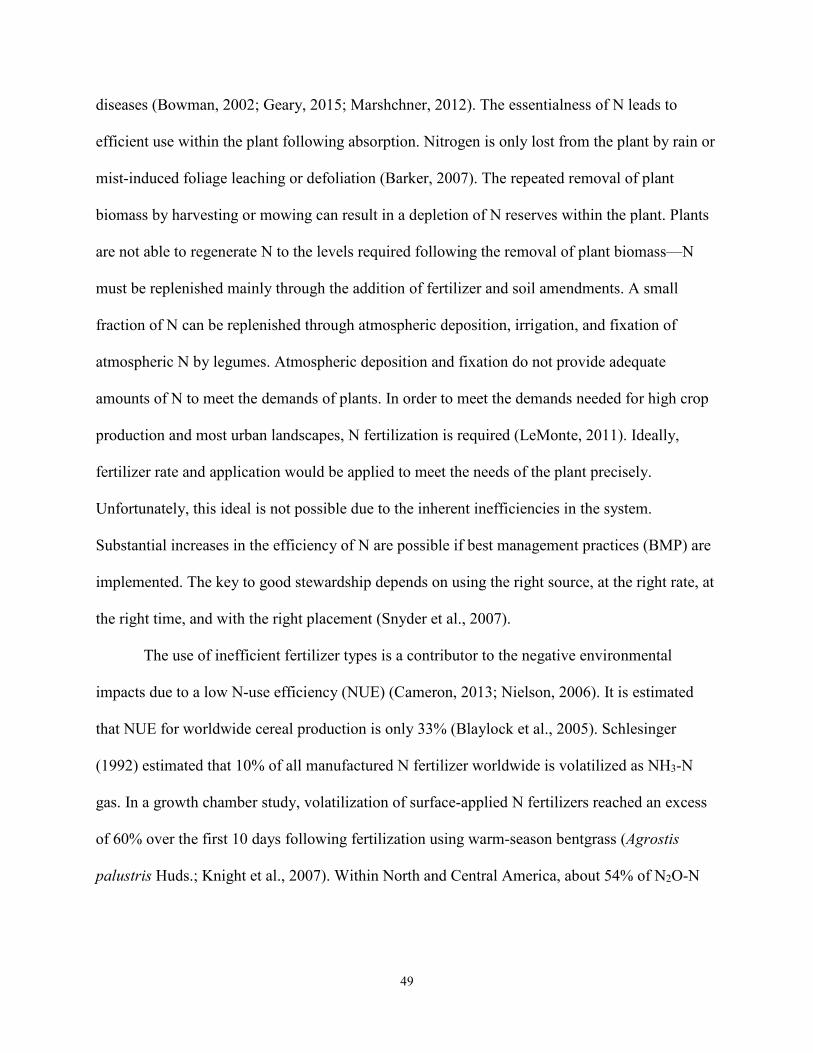
49
diseases (Bowman, 2002; Geary, 2015; Marshchner, 2012). The essentialness of N leads to
efficient use within the plant following absorption. Nitrogen is only lost from the plant by rain or
mist-induced foliage leaching or defoliation (Barker, 2007). The repeated removal of plant
biomass by harvesting or mowing can result in a depletion of N reserves within the plant. Plants
are not able to regenerate N to the levels required following the removal of plant biomass—N
must be replenished mainly through the addition of fertilizer and soil amendments. A small
fraction of N can be replenished through atmospheric deposition, irrigation, and fixation of
atmospheric N by legumes. Atmospheric deposition and fixation do not provide adequate
amounts of N to meet the demands of plants. In order to meet the demands needed for high crop
production and most urban landscapes, N fertilization is required (LeMonte, 2011). Ideally,
fertilizer rate and application would be applied to meet the needs of the plant precisely.
Unfortunately, this ideal is not possible due to the inherent inefficiencies in the system.
Substantial increases in the efficiency of N are possible if best management practices (BMP) are
implemented. The key to good stewardship depends on using the right source, at the right rate, at
the right time, and with the right placement (Snyder et al., 2007).
The use of inefficient fertilizer types is a contributor to the negative environmental
impacts due to a low N-use efficiency (NUE) (Cameron, 2013; Nielson, 2006). It is estimated
that NUE for worldwide cereal production is only 33% (Blaylock et al., 2005). Schlesinger
(1992) estimated that 10% of all manufactured N fertilizer worldwide is volatilized as NH3-N
gas. In a growth chamber study, volatilization of surface-applied N fertilizers reached an excess
of 60% over the first 10 days following fertilization using warm-season bentgrass (Agrostis
palustris Huds.; Knight et al., 2007). Within North and Central America, about 54% of N2O-N
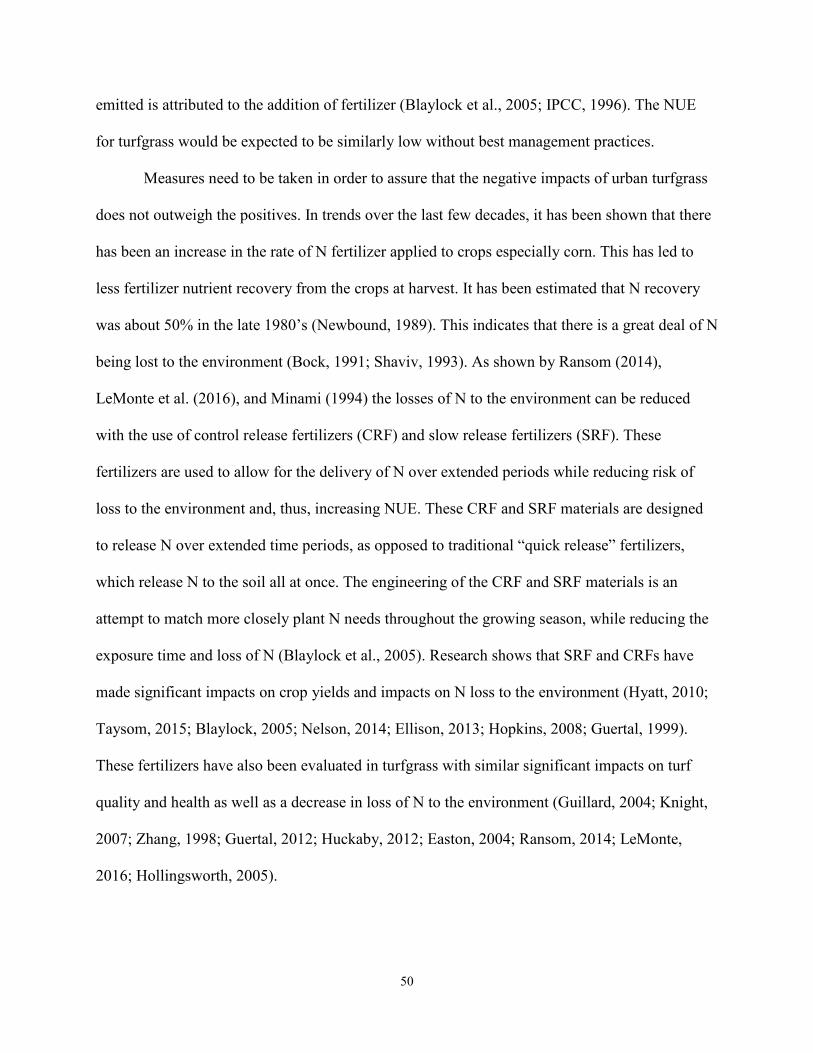
50
emitted is attributed to the addition of fertilizer (Blaylock et al., 2005; IPCC, 1996). The NUE
for turfgrass would be expected to be similarly low without best management practices.
Measures need to be taken in order to assure that the negative impacts of urban turfgrass
does not outweigh the positives. In trends over the last few decades, it has been shown that there
has been an increase in the rate of N fertilizer applied to crops especially corn. This has led to
less fertilizer nutrient recovery from the crops at harvest. It has been estimated that N recovery
was about 50% in the late 1980’s (Newbound, 1989). This indicates that there is a great deal of N
being lost to the environment (Bock, 1991; Shaviv, 1993). As shown by Ransom (2014),
LeMonte et al. (2016), and Minami (1994) the losses of N to the environment can be reduced
with the use of control release fertilizers (CRF) and slow release fertilizers (SRF). These
fertilizers are used to allow for the delivery of N over extended periods while reducing risk of
loss to the environment and, thus, increasing NUE. These CRF and SRF materials are designed
to release N over extended time periods, as opposed to traditional “quick release” fertilizers,
which release N to the soil all at once. The engineering of the CRF and SRF materials is an
attempt to match more closely plant N needs throughout the growing season, while reducing the
exposure time and loss of N (Blaylock et al., 2005). Research shows that SRF and CRFs have
made significant impacts on crop yields and impacts on N loss to the environment (Hyatt, 2010;
Taysom, 2015; Blaylock, 2005; Nelson, 2014; Ellison, 2013; Hopkins, 2008; Guertal, 1999).
These fertilizers have also been evaluated in turfgrass with similar significant impacts on turf
quality and health as well as a decrease in loss of N to the environment (Guillard, 2004; Knight,
2007; Zhang, 1998; Guertal, 2012; Huckaby, 2012; Easton, 2004; Ransom, 2014; LeMonte,
2016; Hollingsworth, 2005).
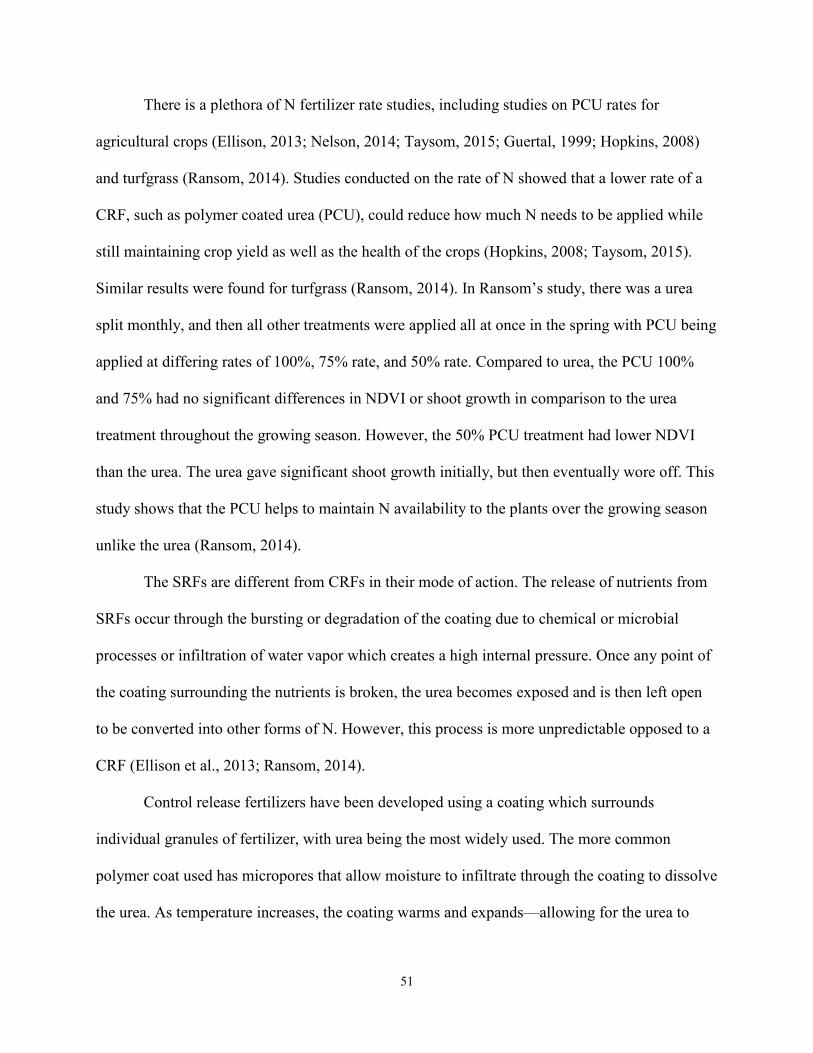
51
There is a plethora of N fertilizer rate studies, including studies on PCU rates for
agricultural crops (Ellison, 2013; Nelson, 2014; Taysom, 2015; Guertal, 1999; Hopkins, 2008)
and turfgrass (Ransom, 2014). Studies conducted on the rate of N showed that a lower rate of a
CRF, such as polymer coated urea (PCU), could reduce how much N needs to be applied while
still maintaining crop yield as well as the health of the crops (Hopkins, 2008; Taysom, 2015).
Similar results were found for turfgrass (Ransom, 2014). In Ransom’s study, there was a urea
split monthly, and then all other treatments were applied all at once in the spring with PCU being
applied at differing rates of 100%, 75% rate, and 50% rate. Compared to urea, the PCU 100%
and 75% had no significant differences in NDVI or shoot growth in comparison to the urea
treatment throughout the growing season. However, the 50% PCU treatment had lower NDVI
than the urea. The urea gave significant shoot growth initially, but then eventually wore off. This
study shows that the PCU helps to maintain N availability to the plants over the growing season
unlike the urea (Ransom, 2014).
The SRFs are different from CRFs in their mode of action. The release of nutrients from
SRFs occur through the bursting or degradation of the coating due to chemical or microbial
processes or infiltration of water vapor which creates a high internal pressure. Once any point of
the coating surrounding the nutrients is broken, the urea becomes exposed and is then left open
to be converted into other forms of N. However, this process is more unpredictable opposed to a
CRF (Ellison et al., 2013; Ransom, 2014).
Control release fertilizers have been developed using a coating which surrounds
individual granules of fertilizer, with urea being the most widely used. The more common
polymer coat used has micropores that allow moisture to infiltrate through the coating to dissolve
the urea. As temperature increases, the coating warms and expands—allowing for the urea to
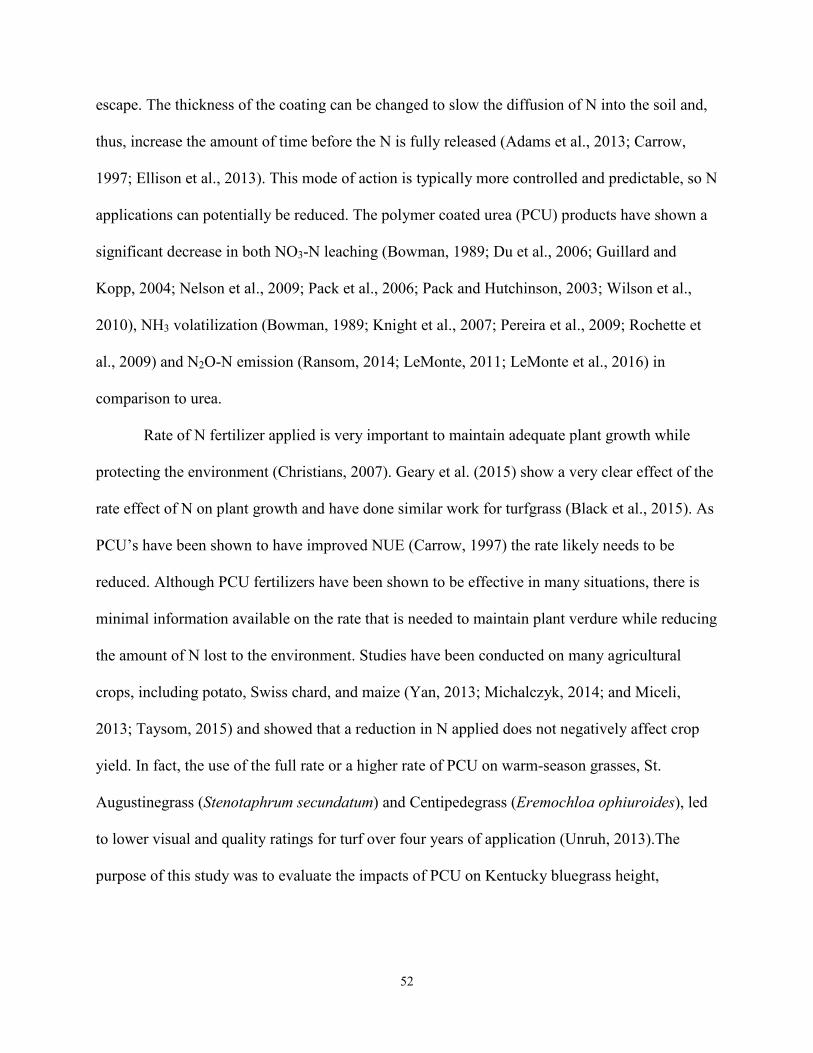
52
escape. The thickness of the coating can be changed to slow the diffusion of N into the soil and,
thus, increase the amount of time before the N is fully released (Adams et al., 2013; Carrow,
1997; Ellison et al., 2013). This mode of action is typically more controlled and predictable, so N
applications can potentially be reduced. The polymer coated urea (PCU) products have shown a
significant decrease in both NO3-N leaching (Bowman, 1989; Du et al., 2006; Guillard and
Kopp, 2004; Nelson et al., 2009; Pack et al., 2006; Pack and Hutchinson, 2003; Wilson et al.,
2010), NH3 volatilization (Bowman, 1989; Knight et al., 2007; Pereira et al., 2009; Rochette et
al., 2009) and N2O-N emission (Ransom, 2014; LeMonte, 2011; LeMonte et al., 2016) in
comparison to urea.
Rate of N fertilizer applied is very important to maintain adequate plant growth while
protecting the environment (Christians, 2007). Geary et al. (2015) show a very clear effect of the
rate effect of N on plant growth and have done similar work for turfgrass (Black et al., 2015). As
PCU’s have been shown to have improved NUE (Carrow, 1997) the rate likely needs to be
reduced. Although PCU fertilizers have been shown to be effective in many situations, there is
minimal information available on the rate that is needed to maintain plant verdure while reducing
the amount of N lost to the environment. Studies have been conducted on many agricultural
crops, including potato, Swiss chard, and maize (Yan, 2013; Michalczyk, 2014; and Miceli,
2013; Taysom, 2015) and showed that a reduction in N applied does not negatively affect crop
yield. In fact, the use of the full rate or a higher rate of PCU on warm-season grasses, St.
Augustinegrass (Stenotaphrum secundatum) and Centipedegrass (Eremochloa ophiuroides), led
to lower visual and quality ratings for turf over four years of application (Unruh, 2013).The
purpose of this study was to evaluate the impacts of PCU on Kentucky bluegrass height,
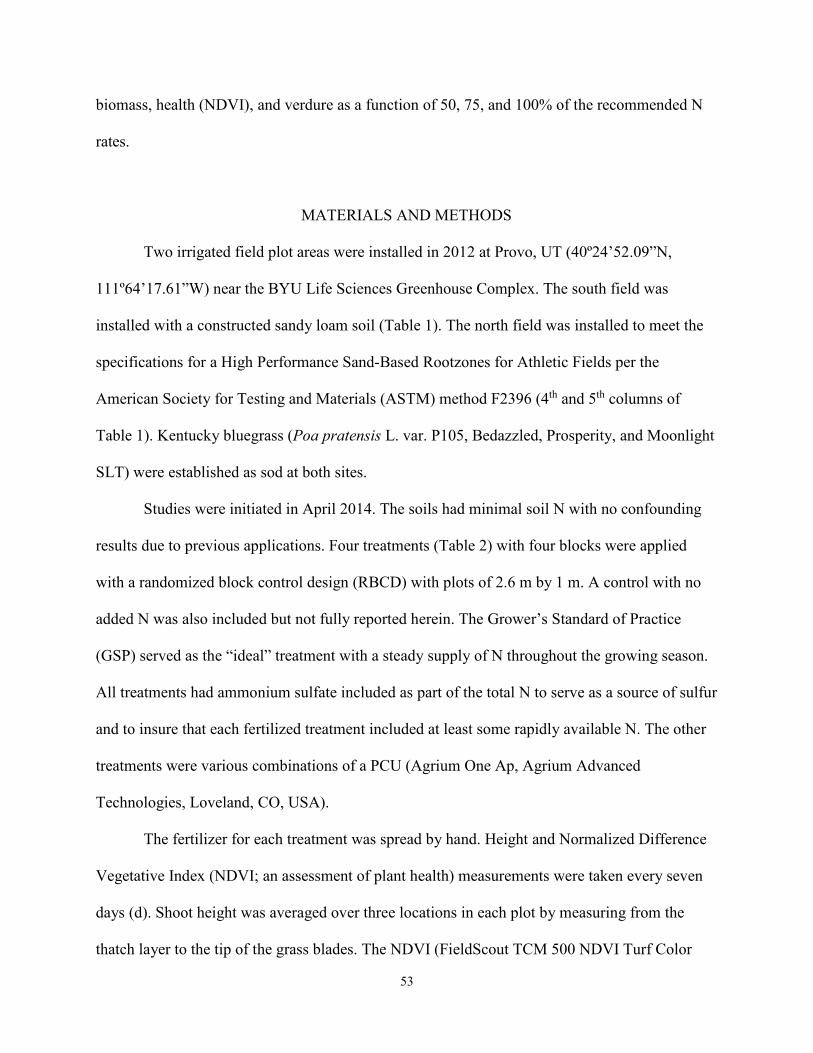
53
biomass, health (NDVI), and verdure as a function of 50, 75, and 100% of the recommended N
rates.
MATERIALS AND METHODS
Two irrigated field plot areas were installed in 2012 at Provo, UT (40º24’52.09”N,
111º64’17.61”W) near the BYU Life Sciences Greenhouse Complex. The south field was
installed with a constructed sandy loam soil (Table 1). The north field was installed to meet the
specifications for a High Performance Sand-Based Rootzones for Athletic Fields per the
American Society for Testing and Materials (ASTM) method F2396 (4th and 5th columns of
Table 1). Kentucky bluegrass (Poa pratensis L. var. P105, Bedazzled, Prosperity, and Moonlight
SLT) were established as sod at both sites.
Studies were initiated in April 2014. The soils had minimal soil N with no confounding
results due to previous applications. Four treatments (Table 2) with four blocks were applied
with a randomized block control design (RBCD) with plots of 2.6 m by 1 m. A control with no
added N was also included but not fully reported herein. The Grower’s Standard of Practice
(GSP) served as the “ideal” treatment with a steady supply of N throughout the growing season.
All treatments had ammonium sulfate included as part of the total N to serve as a source of sulfur
and to insure that each fertilized treatment included at least some rapidly available N. The other
treatments were various combinations of a PCU (Agrium One Ap, Agrium Advanced
Technologies, Loveland, CO, USA).
The fertilizer for each treatment was spread by hand. Height and Normalized Difference
Vegetative Index (NDVI; an assessment of plant health) measurements were taken every seven
days (d). Shoot height was averaged over three locations in each plot by measuring from the
thatch layer to the tip of the grass blades. The NDVI (FieldScout TCM 500 NDVI Turf Color

54
Meter, Spectrum Technologies, Inc., Aurora, IL, USA) measurements were also averaged over
three locations in each plot. Shoot biomass samples were collected at 135 and 275 ordinal d in
2014 and on 238, 288, and 303 ordinal d in 2015 using a reel mower with a catch basin set at a
height of 2.5 cm. After each subplot was mowed, the blades and catch basin were wiped clean.
Each biomass sample was stored in a paper bag and left to air dry and then weighed. Visual
verdure ratings were taken prior to mowing at 126, 239 and 260 ordinal d in 2014 and on 238
and 305 ordinal d in 2015. Visual ratings were done on a scale of 1-5 with one being completely
dormant and five being dense, dark green turfgrass. Final shoot density and biomass
measurements were taken at the end of the two-year study. Shoot density was measured by
taking a plug from each plot and counting the crowns of the turfgrass in two random areas (3
cm2). After shoot density was measured, all of the shoot biomass was harvested above the
crowns. After biomass was calculated, the shoots were ground and analyzed for N content using
the CN Determinator (TruSpec Micro, LECO, St. Joseph, MI, USA). Root biomass was
measured using the same plugs taken from the plots for shoot density and biomass. The roots
were also harvested by washing the soil off and collecting the biomass in a 1 mm screen. Data
was checked for normality and analyzed by analysis of variance (ANOVA) with R (R project for
Statistical Computing), with significance indicated at P ≤ 0.05. Any significant means were then
separated using a Tukey-Kramer test.
RESULTS
The models for all dependent variables were highly significant with the interaction
between treatment and sampling date always significant (Table 3). Therefore, all statistical
evaluations were performed for each individual sampling date and the interactions shown in Figs.
1-4. In general, the PCU blend applied at the full rate (P100) and the GSP were numerically
55
similar and statistically identical—as discussed in Chapter 1 of this thesis. There were no trends
or significant differences in root biomass (see Appendix). The focus of the remaining discussion
will be upon the effect of reducing the rate for the PCU/ammonium sulfate blend applied twice
annually.
Growth: Loam Soil Trial
Shoot growth, as determined by height and biomass measurements, was never
significantly different for P75 as compared to the GSP and P100 applied to loam soil (Tables 4-
6, Fig. 1). The P75 mimicked the P100 and GSP quite closely for a majority of both years of this
study.
In contrast, the reduced rate (P50) was consistently below the GSP and P100 (Tables 4-
6; Fig. 1). This rate resulted in significantly lower shoot heights than the GSP on one date in the
spring and one date in the fall of 2015. The P50 was also significantly below P100 on one date in
the spring and one date in the fall of 2014, as well as two dates in the spring of 2015. In the
second year of the study, the differences in shoot height had greater magnitude with P50 trending
much lower than the other treatments as compared to 2014. The shoot biomass results generally
followed these same trends—especially in the second year with very low growth for P50 (Table
6). Unfortunately, some of the biomass data was lost due to technician error and direct
comparisons across years for spring/summer dates were not possible.
Growth: Sand Soil Trial
In comparison to the loam study, there were more significant differences and a greater
magnitude in the differences in shoot growth with the sand soil study (Tables 7-8, Fig. 2).

56
Although the differences were larger, the results were similar for the trials conducted on both soil
types. Unfortunately, the sand field failed during the spring of 2015 and had to be replanted.
Treatments were applied and data was collected for late summer and fall, but is not presented
here due to this problem (see Appendix 2 for the sand 2015 data).
As with the loam study, there were no significant differences for shoot growth among the
reduced rate of P75 as compared to the full rates applied with the GSP and P100 (Table 7). In
contrast, shoot growth for P50 was significantly lower than the GSP on two dates in the fall and
significantly lower than P100 on two dates in each spring, summer, and fall.
Although shoot biomass followed similar trends as heights, it is interesting to observe
that both of the reduced rates showed significantly less overall growth than the P100 at the spring
sampling date (Table 8). The P50 treatment had significantly lower growth than the GSP on that
date as well. There were no differences in biomass by the end of the fall.
Health: Loam Soil Trial
Plant health and verdure, as represented by weekly NDVI measurements, for the loam
soil was never significantly different for any of the treatments which included as PCU as
compared to the GSP in both years of the study (Tables 9-10, Fig. 3). The NDVI readings for
P100 was significantly greater than P50 on one date in the spring of 2015, otherwise there are no
other significant differences in NDVI readings between the treatments. Although not significant,
there is a trend for P50 to be below all of the other treatments throughout the two year study (Fig.
3).
Although NDVI did not show a difference on ordinal day 126 when the first visual
ratings of plant verdure were made in 2014, the P100 treatment had significantly higher visual

57
ratings than P50 (Table 11). On the following visual rating dates, there were no significant
differences, which corresponds with the NDVI readings on the same dates. Similarly, the GSP
had significantly greater visual ratings than P50 on the first date in 2015 although the NDVI
readings for the same date were not statistically different. The second date in 2015 did not show
any significance in the visual ratings or the NDVI readings for the same date.
Health: Sand Soil Trial
Results were different for plant health in sandy soil (Tables 12-13, Fig. 4) in 2014
compared to what was observed with the loam study in spring (Tables 9 and 11, Fig. 3). As with
the loam, the P100 never had worse NDVI values than the GSP. However, the P100 treatment
had significantly greater NDVI values than the GSP on four dates in the spring. Even one of the
reduced rate PCU treatments (P75) was significantly greater than GSP on one date in the spring.
However, similar to the loam study the P50 was significantly lower than the GSP on one date in
the summer. Although not significant, there was a trend in both of the sand and loam studies for
the P50 NDVI to trend below the GSP throughout the entire growing season, especially in the
second year.
When comparing P100 against P75 and P50 there were significant differences in NDVI
(Table 12, Fig. 4). The P100 was significantly greater than P75 on one date in the spring, and
significantly greater than P50 on four dates in the spring and three dates in the summer. And, the
P75 was significantly greater than P50 on three dates in the spring and one date in the summer.
Visual ratings on the first date evaluated showed a significant difference between P100
and P50, which did not correspond with the NDVI readings for that same date but did follow the
overall trend (Tables 12-13, Fig. 4). On both the second and third dates, the visual ratings

58
showed no significant differences between the treatments which did correspond with the NDVI
readings for those dates.
Shoot N Concentration
The P100 tended to have the highest concentration of shoot N in both soils in both years
(Table 14). The N in P100 treated plants was numerically higher than the GSP in five of six
instances, with significant differences half of the time. The P100 resulted in significantly greater
N as compared to P75 in the sand, but not in the loam. The 75% rate (P75) resulted in
approximately the same N concentration as the GSP, with no instances of these being
significantly different than one another. Not surprisingly, the 50% rate (P50) had significantly
lower N concentration than the other treatments, being significantly lower than the P100 four
instances and lower than the P75 twice. The P50 treatment had the same shoot N concentration
as the GSP for the loam, but was lower in the sand trial.
Shoot Density
There was a significant impact of fertilization on crown density for the loam soil (Table
15; Fig. 5). All treatments receiving two applications of PCU had a significant increase in shoot
density, but the GSP did not. A similar trend was observed for the sand with the exception that
the GSP also had increased shoot density for the fertilized treatments (data not shown).
DISCUSSION
The GSP was used as the “ideal” fertilizer program in that there was continuous good
health and verdure without excessive shoot growth and mowing throughout the growing season.
However, this practice is not ideal in terms of labor and associated costs needed to apply the
59
fertilizer monthly. Additionally, the low rates applied are often difficult to achieve accurately
with the use of many dry fertilizer spreaders. Furthermore, uncoated urea is prone to relatively
high losses of N to the environment (Guillard, 2004; LeMonte, 2011; LeMonte et al., 2016;
Ransom, 2014) through the leaching of N into ground water and gaseous losses to the
atmosphere. This would especially be a problem during hot summer months when volatilization
occurs at much higher rates. Finally, the use of traditional fertilizers can have a higher risk of salt
damage if errantly applied due to the rapid solubilization of the material.
It is desirable to have a convenient, practical fertilizer program which will also
give an even supply of N throughout the growing season while minimizing the environmental
impacts and the amount of resources used. As such, the fertilizer industry has developed products
which release in a controlled or slow timing, such as the controlled release polymer coated urea.
In a study done by Buss (2016) it was found that the use of a polymer coated urea/ammonium
sulfate blend resulted in the ability to reduce the number of applications of N to two in a growing
season without excessive shoot growth or any negative effects on turf health. The next step is to
determine if a reduction in the rate would result in similar plant health and greenness as the full
rate, thus reducing the amount of fertilizer being applied and in turn reducing the negative
environmental impacts. The excess amount of N being applied in agricultural and urban
landscapes has negative impacts on the environment due to the loss of N through different loss
mechanisms. The process of making N fertilizer also has an impact on the environment due to
natural resources being used. Based on the work of LeMonte (2011), LeMonte et al. (2016), and
Ransom (2014) it is expected that the environmental benefits in terms of reduced N loss due to
leaching and volatilization will be available. A reduction of N applied will also decrease
economic and environmental costs associated with applying more N.
60
The data presented herein shows that a reduction in the rate will give similar results as the
full rate without having significant negative impacts. The data from these studies show that two
applications of a PCU/traditional fertilizer blend results in equivalent or better results than the
GSP. The two application of PCU at the full rate was almost never different from the GSP in
both the loam and sand trials in shoot growth. Similarly the plant health for the two application at
the full rate was never significantly different than the GSP in the loam trial, and had significantly
greater plant health in the sand trial on multiple dates in the spring. The reduced rate of 75% was
rarely statistically different from the GSP or the two application full rate for shoot growth and
verdure in both the loam and sand trials. This data shows that a reduction in the rate to 75% does
not have any negative effects on plant verdure throughout the growing season. These results are
similar to those found by Carrow (1997), JaiLin et al. (2009), Karcher and Robinson (2007), and
Ransom (2014) in turfgrass as well as the results found in agricultural crops (maize and Swiss
chard) in the studies conducted by Yan (2013), Miceli (2013), and Michalczyk (2014). JaiLin et
al. (2009) found that when PCU was applied in early spring to tall fescue, there was similar turf
quality to urea with less clipping collection needed as well as greater uniformity of turf growth.
In Ransom’s study (2014) it was found that a reduction of 50% gave lower NDVIs for the turf
but there was no significant difference between the 75% rate and the 100% rate of PCU. As well
as there was no significant difference between the 75% rate and 100% rate of PCU when
compared to the urea split monthly, which is the same result which was found in this study. In
his study there was only one application of PCU that was meant for 120d release, whereas in the
studies conducted herein there were two applications of PCU, but the results are similar. In these
studies, they found that a reduction in applied N maintained plant health while reducing the
amount of N applied as well as the N lost to the environment. The studies conducted on

61
agricultural crops used urea and ammonium nitrate, but it can be assumed that using a PCU
product would have similar to better results due to the slow release of N. In Yan’s study (2013),
it was found that the rate of N could be reduced by 33% while maintaining the crop yields
similar to the crops which received the full rate. In Miceli’s (2013) study they found with the
higher N rates the Swiss chard had more growth in the leaves resulting in larger leaves.
However, the reduced rates of N Swiss chard had no significant difference in the size of the leaf
or in the yield. The difference was that there was more leaf growth than petiole growth (which is
not harvested) for the reduced rate of N. This is similar to our findings in that there was not a
significant difference in shoot growth which then means that mowing requirements were not
minimized, but plant verdure was maintained while applying less N. In most high maintenance
turfgrass environments mowing is already being done frequently, and a greener, more healthy
turf is desirable. The 75% rate would be more ideal for this type of environment due to the
higher plant verdure while helping to conserve on fertilizer costs as well as reduce the amount of
N being lost to the environment.
However, the further reduction of N to 50% led to less shoot growth, but at the expense
of lower plant verdure. Although the reduced rate of 50% rarely had significant differences in
shoot growth and plant verdure from all of the other treatments, it consistently trended much
lower. This practice of using half the rate could be tolerable if used in a low maintenance
environment where mowing requirements need to be minimal while maintaining a plant verdure
that is bearable and still functional.
The lower trend of the 50% rate began to be more drastic in the second year in the loam
trial, indicating that there could be negative effects of the reduced rate. Due to seeing this trend
in the second year, ongoing studies are being conducted to see if there are long term negative
62
effects on having a reduced rate of N. These studies were only conducted over a two year period
on Kentucky bluegrass in calcareous soils in Utah, USA. Further studies should be conducted in
different climates, with multiple different turf species for a longer period of time to determine if
there are more long term effects of the reduced rates of N. Further studies should also be
conducted on fine tuning how much the rate can be reduced before there are negative effects on
turf. The excess amount of N being applied has negative effects on the environment due to the
loss of N into the environment. It is expected that if the rate of application is reduced then the
associated environmental benefits of less N in the system will be available. Other benefits such
as less labor costs due to mowing less, less clippings being put into a landfill, and lower financial
costs associated with the purchase of fertilizer will also be available (Cisar, 2004; Walker, 2007).
LITERATURE CITED
Adams, C., Frantz, J., & Bugbee, B. (2013). Macro- and micronutrient-release characteristics of
three polymer-coated fertilizers: Theory and measurements. J. Plant Nutr. Soil Sci. Journal
of Plant Nutrition and Soil Science, 176(1), 76-88.
Bandaranayake, W., Qian, Y., Parton, W., Ojima, D., & Follet, R. (2003). Estimation of Soil
Organic Carbon Changes in Turfgrass Systems Using the CENTURY Model. Agronomy
Journal, 95(3), 558-558. Doi:10.2134/agronj2003.0558
Barker, A., & Pilbeam, D. (2007). Handbook of Plant Nutrition. CRC Press, Boca Raton, FL.
Black, B., Neville, B., Ewell, C., Geary, B. D., & Hopkins, B. G. (2015). Nitrogen Nutrition
Impact on Incidence of Rhizoctonia Infection of Agrostis Stolonifera. In Western Nutrient
Management Conference (Vol. 11, pp. 112-116). Reno, NV. Retrieved from
http://www.ipni.net/ipniweb/conference/wnmc.nsf/e0f085ed5f091b1b852579000057902e/4b
e3031d1d87927a85257e37004fa7a8/$FILE/WNMC2015 Neville pg112.pdf
63
Blaylock, A., Binford. G., Dowbenko, R., Kaufmann, J., & Islam, R. (2005). ESN, Controlled-
Release Nitrogen for Enhanced Nitrogen Efficiency and Improved Environmental Safety.
Science Press and Science Press USA, 381-390.
Bock, B. & Hergert, G. (1991). Fertilizer Nitrogens Management. In: Follet RF et al. (eds)
Managing Nitrogen for Ground Water Quality and Farm Profitability, 139-164. SSSA
Madison, WI.
Bowman, D., Cherney, C., & Rufty, T. (2002). Fate and Transport of Nitrogen Applied to Six
Warm-Season Turfgrasses. Crop Science, 42(3), 833-840. Retrieved December 2, 2014, from
http://www.carleton.edu/departments/GEOL/Resources/comps/CompsPDFfiles/2009/Linetd
WebPg/Papers/Fate and Transport of Nitrogen Applied to Six Warm Season Turfgrasses.pdf
Bremer, D. (2007) Carbon Sequestration in Turfgrass: An Eco-Friendly Benefit of Your Lawn.
Turfnews, a quarterly Kansas Turfgrass Foundation Newsletter.
Burton, D. L., Li. X., and Grant, C. A. (2003) Reducing nitrous oxide emissions through the use
of fertilizer management technologies. Dept. Soil Science, University of Manitoba,
Winnipeg, Manitoba, Canada.
Cameron, K., Di, H., & Moir, J. (2013). Nitrogen Losses From the Soil/Plant System: A
review.Annals of Applied Biology, 162, 145-173.
Carrow, R. N. (1997). Turfgrass Response to Slow-Release Nitrogen Fertilizers. Agronomy
Journal, 89(3), 491. Chatterjee, A. (2012). Reducing Denitrification Loss of Nitrogen
Fertilizer. Crop and Soil Magazine: 45: 14-15.
Christians, N. (2007). Fertilization. In Fundamentals of turfgrass management (4th ed., pp. 141-
143). Hoboken, N.J.: John Wiley & Sons.
64
Cisar, J.L. (2004). Managing Turf Sustainably. In 4th International Crop Science Congress Proc.,
26 Sep. – 1 Oct 2004, Brisbane, Austalia. CSSA, Madison, WI.
Du, C., Zhou, J., & Shaviv, A. (2006). Release Characteristics of Nutrients from Polymer-Coated
Compound Controlled Release Fertilizers. Journal of Polymers and the Environment J Polym
Environ, 14, 223-230.
Easton, Z. M., & Petrovic, A. M. (2004). Fertilizer Source Effect on Ground and Surface Water
Quality in Drainage from Turfgrass. Journal of Environment Quality, 33(2), 645.
Ellison, E., Blaylock, A., Sanchez, C., & Smith, R. (2013, November 17). Exploring Controlled
Release Nitrogen Fertilizers for Vegetable and Melon Crop Production in California and
Arizona. Lecture presented at Western Nutrient Management Conference, Reno.
Food and Agriculture Organization of the United Nations. Current world fertilizer trends and
outlook to 2014/15. Rep. Rome: FAO, 2011.
Geary, B., Clark, J., Hopkins, B., & Jolley, V. (2015). Deficient, Adequate and Excess Nitrogen
Levels Established in Hydroponics for Biotic and Abiotic Stress-Interaction Studies in
Potato. Journal of Plant Nutrition. 38: 41-50.
Guillard, K., & Kopp, K. (2004). Nitrogen Fertilizer Form and Associated Nitrate Leaching from
Cool-Season Lawn Turf. Journal of Environment Quality, 1822-1827.
Hirsch, A., Michalak, A., Bruhwiler, L., Peters, W., Dlugokencky, E., & Tans, P. (2006). Inverse
modeling estimates of the global nitrous oxide surface flux from 1998-2001.Global
Biogeochem. Cycles Global Biogeochemical Cycles.
65
Hopkins, B., Rosen, C., Shiffler, A., & Taysom, T. (2008). Enhanced Efficiency Fertilizers for
Improved Nutrient Management: Potato. Crop Management. Doi:10_1094/CM-20080317-01-
RV.
Hyatt, C., Venterea, R., Rosen, C., Mcnearney, M., Wilson, M., & Dolan, M. (2010). Polymer-
Coated Urea Maintains Potato Yields and Reduces Nitrous Oxide Emissions in a Minnesota
Loamy Sand. Soil Science Society of America Journal, 74, 419-428.
IPCC. (1996) Climate Change 1995: Impacts, Adaptations and Mitigation of Climate Change:
ScientificTechnical Analyses. Intergovernmental Panel on Climate Change, Cambridge
University Press, Melbourne, Australia.
Karcher, D. E., & Richardson, M. D. (2003). Quantifying Turfgrass Color Using Digital Image
Analysis. Crop Science, 43(3), 943.
Knight, E., Guertal, E., & Wood, C. (2007). Mowing and Nitrogen Source Effects on Ammonia
Volatilization from Turfgrass. Crop Science, 47, 1628-1634.
LeMonte, J. 2011 Environmental Implications of Polymer Coated Urea. Thesis. Brigham Young
University. Department of Plant and Wildlife Sciences. Scholars Archive. Brigham Young
University.
Lemonte, J. J., Jolley, V. D., Summerhays, J. S., Terry, R. E., & Hopkins, B. G. (2016). Polymer
Coated Urea in Turfgrass Maintains Vigor and Mitigates Nitrogen's Environmental Impacts.
PLOS ONE PLoS ONE, 11(1).
Marshchner, P. (2012). Mineral Nutrition of Higher Plants (3rd ed.). San Diego, CA: Elsevier.
McTaggart, I., Clayton, H., and Smith, K. (1994) Nitrous oxide flux from fertilized grassland:
strategies for reducing emissions. In: Non-CO2 Greenhouse Gases [van Ham, L. et al., Eds.].
Kluwer Academic Publishers, Dordrecht, Netherlands, 421-426.

66
Miceli, A., & Miceli, C. (2014). Effect of Nitrogen Fertilization on the Quality of Swiss Chard at
Harvest and During Storage as Minimally Processed Produce. Journal of Food Quality J
Food Qual, 125-134.
Michalczyk, A., Kersebaum, K., Roelcke, M., Hartmann, T., Yue, S., Chen, X., & Zhang, F.
(2014) Model-Based Optimisation of Nitrogen and Water Management for Wheat-Maize
Systems in the North China Plain. Nutrient Cycling in Agroecosystems Nutr Cycl
Agroecosyst, 98, 203-222.
Milesi, C., Running, S., Elyidge, C., Dietz, J., Tuttle, B., & Nemani, R. (2005). Mapping and
Modeling the Biogeochemical Cycling of Turf Grasses in the United States. Environmental
Management, 36(3), 426-438.
Milesi, C., Elyidge, C., Dietz, J., Tuttle, B., Nemani, R., & Running, S. (n.d.). A Strategy for
Mapping and Modeling the Ecological Effects of US Lawns. Retrieved January 8, 2016, from
http://www.isprs.org/proceedings/XXXVI/8-W27/milesi.pdf.
Miltner, E., Stahnke, G., Johnston, W., & Golob, C. (2004). Late Fall and Winter Nitrogen
Fertilization of Turfgrass in Two Pacific Northwest Climates. Hortscience, (39), 1745-1749.
Minami, K. (1994) Effect of Nitrification Inhibitors and Slow-Release Fertilizer on Emission of
Nitrous Oxide from Fertilized Soils. In CH4 and N2O: global Emissions and Controls from
Rice Fields and Other Agricultural and Industrial Sources. [Minami, K., Mosier, A.R., and
Sass, R. Eds.] NIAES Series 2, Yokendo Publishers, Tokyo, Japan.
National Turfgrass Federation. (2003). The Turfgrass Industry- Present and Future. Retrieved
November 28, 2014, from http://www.turfresearch.org/pdf/Industry Turf Initiative.pdf

67
Nelson, K., Motayalli, P., & Nathan, M. (2014). Nitrogen Fertilizer Sources and Application
Timing Affects Wheat and Inter-Seeded Red Clover Yields on Claypan Soils. Agronomy,
497-513. doi: 10.3390/agronomy4040497.
Nelson, K., Paniagua, S., & Motavalli, P. (2009). Effect of Polymer Coated Urea, Irrigation, and
Drainage on Nitrogen Utilization and Yield of Corn in a Claypan Soil. Agronomy Journal,
101, 681-687.
Newbound, P. (1989). The Use of Fertiliser in Agriculture. Where Do We Go Practically and
Ecologically? Plant Soil 115:297-311.
Nielson, R. (2006). N Loss Mechanisms and Nitrogen Use Efficiency. Purdue Nitrogen
Management Workshops, 1-5. Retrieved December 1, 2014, from
http://www.agry.purdue.edu/ext/pubs/2006NLossMechanisms.pdf
Norton, R., Mikkelsen, R., & Jensen, T. (2013). Sulfur for Plant Nutrition. Better Crops 97.2 10-
12.
Pack, J., & Hutchinson, C. (2003). Potato (Solanum tuberosum L.) Tuber Yields, Specific
Gravities, and Nitrate Leaching Under Polymer Coated Urea and Ammonium Nitrate
Fertilizer Program. Hortscience. (38), 719-720.
Pack, J., Hutchinson, C., & Simonne, E. (2006). Evaluation of Controlled-Release Fertilizers for
Northeast Florida Chip Potato Production. Journal of Plant Nutrition, 29, 1301-1313.
Qian, Y., & Follett, R. (2015). Assessing Soil Carbon Sequestration in Turfgrass Systems Using
Long-Term Soil Testing Data. Agronomy Journal, 930-930. doi:10.2134/agronj2002.0930
Ransom, C. (2014) Nitrogen Use Efficiency of Polymer-Coated Urea. Thesis. Brigham Young
University. Department of Plant and Wildlife Sciences. Scholars Archive. Brigham Young
University.

68
Runfola, D. S., Hamill, T., Pontius, R. G., Jr., Rogan, J., Giner, N., & Decatur, A. (2014). Using
Fine Resolution Orthoimagery and Spatial Interpolation to Rapidly Map Turf Grass in
Suburban Massachusetts. International Journal of Geospatial and Environmental Research,
1(1). Retrieved February 10, 2016, from
http://dc.uwm.edu/cgi/viewcontent.cgi?article=1004&context=ijger.
Sahu, R. (n.d.). Technical Assessment of the Carbon Sequestration Potential of Managed
Turfgrass in the United States. Retrieved January 8, 2016, from
http://opei.org/content/uploads/2014/02/TurfGrassSahu.pdf.
Shaviv, A. and Mikkelsen, R.L (1993) Controlled-release fertilizers to increase efficiency of
nutrient use and minimize environmental degradation - a review. Fertilizer Res. 35 1-12.
Snyder, C., Bruulsema, T., and Jensen, T. (2007). Greenhouse Gas Emissions from Cropping
Systems and the Influence of Fertilizer Management—a literature review. International Plant
Nutrition Institute, Norcross, Georgia, U.S.A.
Sutton, M., Erisman, J., Dentener, F., & Moller, D. (2008). Ammonia in the Environment: From
Ancient Times to the Present. Environmental Pollution. (156), 583-604.
Taysom, T. W. (2015). Polymer Coated Urea in Russet Burbank Potato Production
(Unpublished master's thesis). University of Idaho.
USEPA (2007). Inventory of U.S. Greenhouse Gas Emissions and Sinks:1990–2005. EPA 430-
R- 07-002. USEPA, Washington, DC.
Walker, K., Bigelow, C., Smith, D., Scoyoc, G., & Reicher, Z. (2007). Aboveground Responses
of Cool-Season Lawn Species to Nitrogen Rates and Application Timings. Crop Science,
47(3), 1225-1225. doi:10.2135/cropsci2003.09.0595.
69
Wilson, M., Rosen, C., & Moncrief, J. (2010). Effects of Polymer-Coated Urea on Nitrate
Leaching and Nitrogen Uptake by Potato. Journal of Environment Quality, 39, 492-499.
Yan, G., Zheng, X., Cui, F., Yao, Z., Zhou, Z., Deng, J., & Xu, Y. (2013) Two-year
Simultaneous Records of N2O and NO Fluxes from a Farmed Cropland in the Northern
China Plain with a Reduced Nitrogen Addition Rate by One-Third. Agriculture, Ecosystems
& Environment, 178, 39-50.
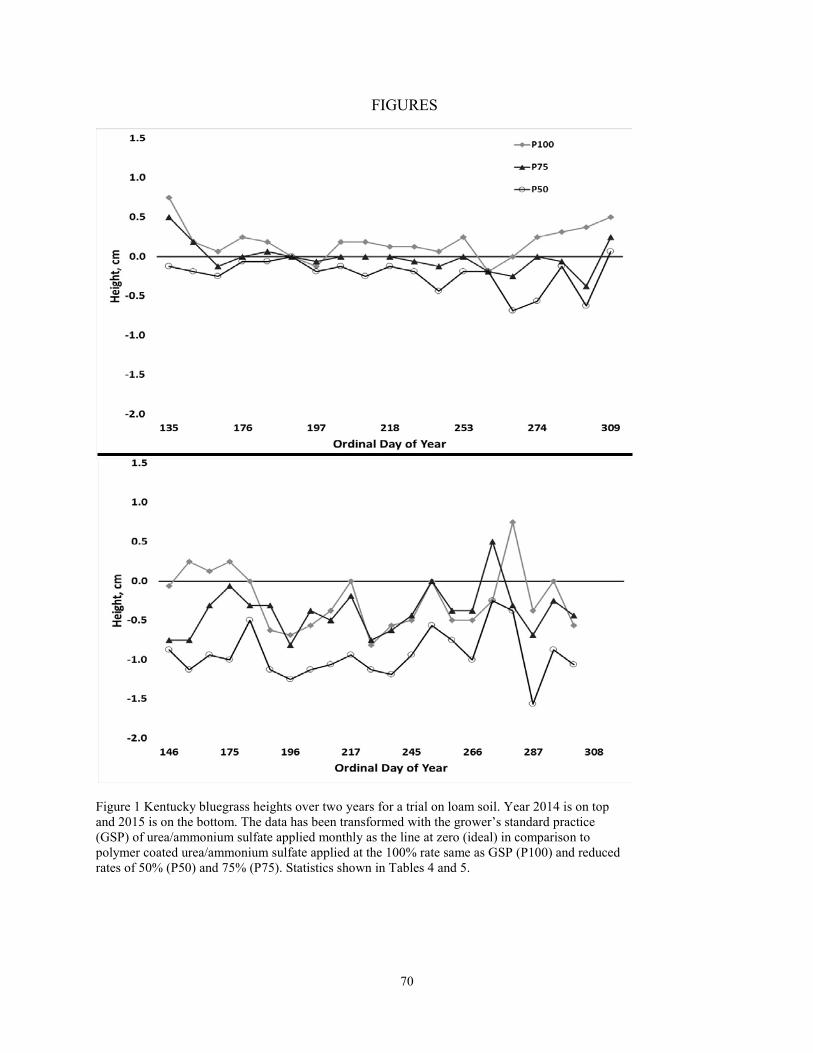
70
FIGURES
Figure 1 Kentucky bluegrass heights over two years for a trial on loam soil. Year 2014 is on top and 2015 is on the bottom. The data has been transformed with the grower’s standard practice (GSP) of urea/ammonium sulfate applied monthly as the line at zero (ideal) in comparison to polymer coated urea/ammonium sulfate applied at the 100% rate same as GSP (P100) and reduced rates of 50% (P50) and 75% (P75). Statistics shown in Tables 4 and 5.
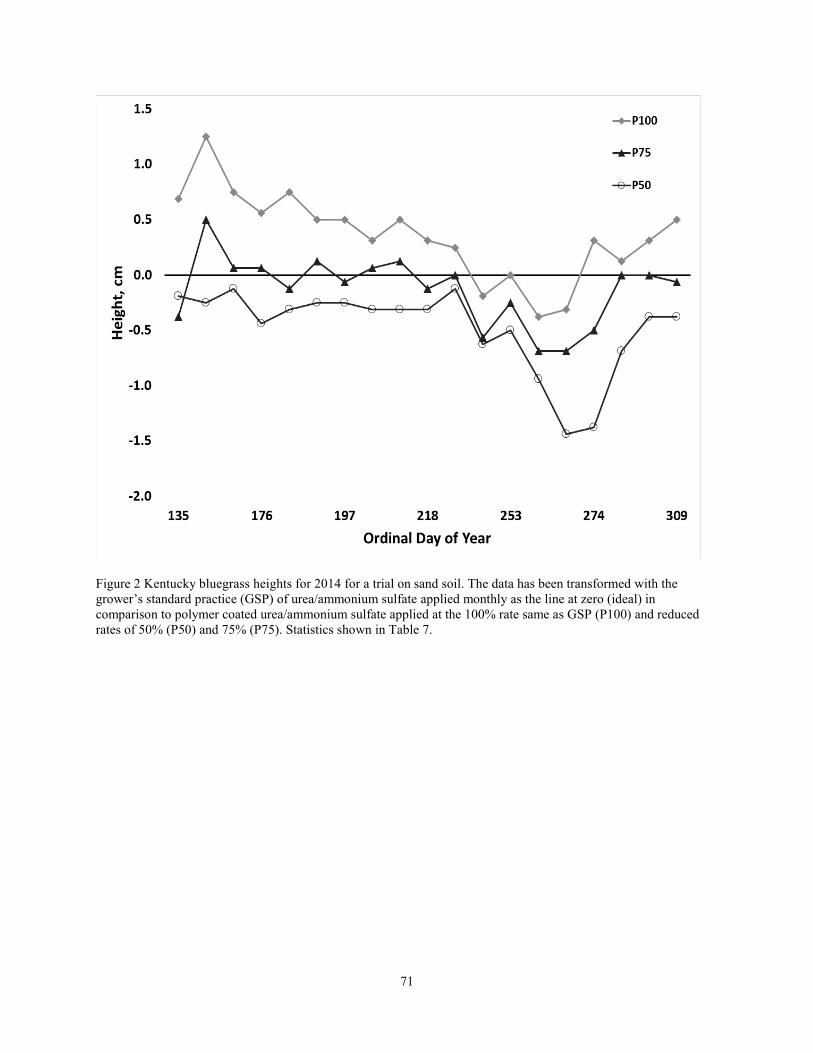
71
Figure 2 Kentucky bluegrass heights for 2014 for a trial on sand soil. The data has been transformed with the grower’s standard practice (GSP) of urea/ammonium sulfate applied monthly as the line at zero (ideal) in comparison to polymer coated urea/ammonium sulfate applied at the 100% rate same as GSP (P100) and reduced rates of 50% (P50) and 75% (P75). Statistics shown in Table 7.
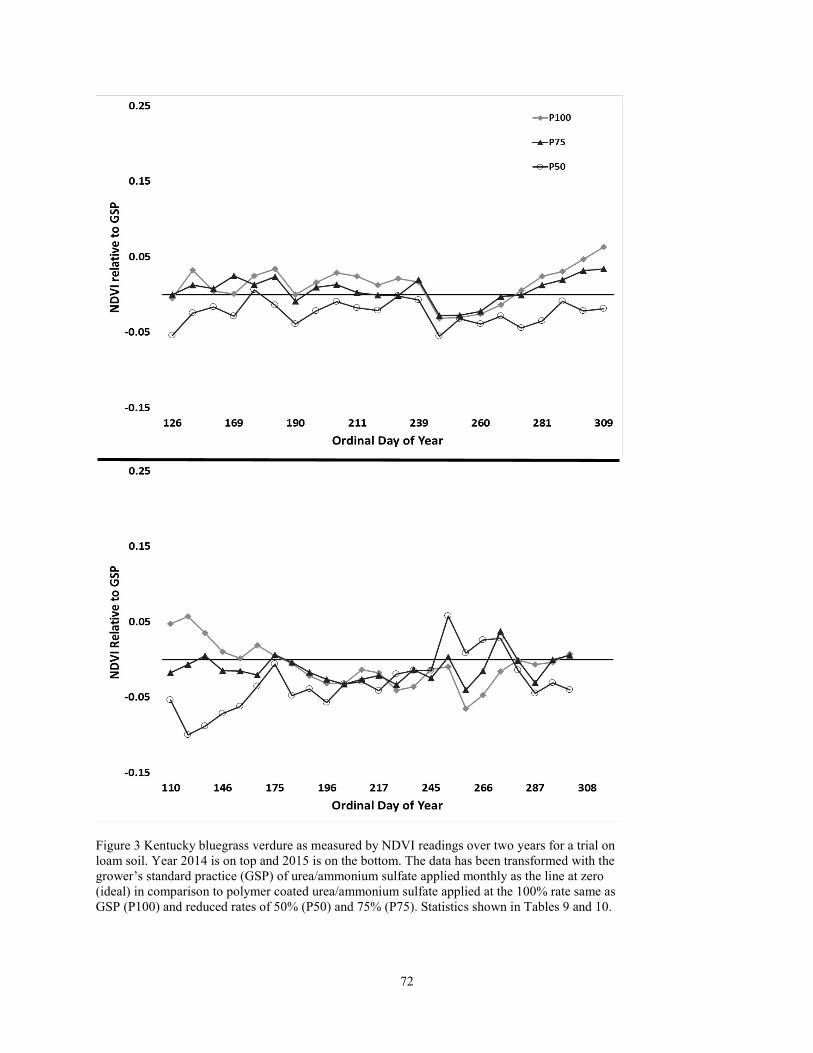
72
Figure 3 Kentucky bluegrass verdure as measured by NDVI readings over two years for a trial on loam soil. Year 2014 is on top and 2015 is on the bottom. The data has been transformed with the grower’s standard practice (GSP) of urea/ammonium sulfate applied monthly as the line at zero (ideal) in comparison to polymer coated urea/ammonium sulfate applied at the 100% rate same as GSP (P100) and reduced rates of 50% (P50) and 75% (P75). Statistics shown in Tables 9 and 10.
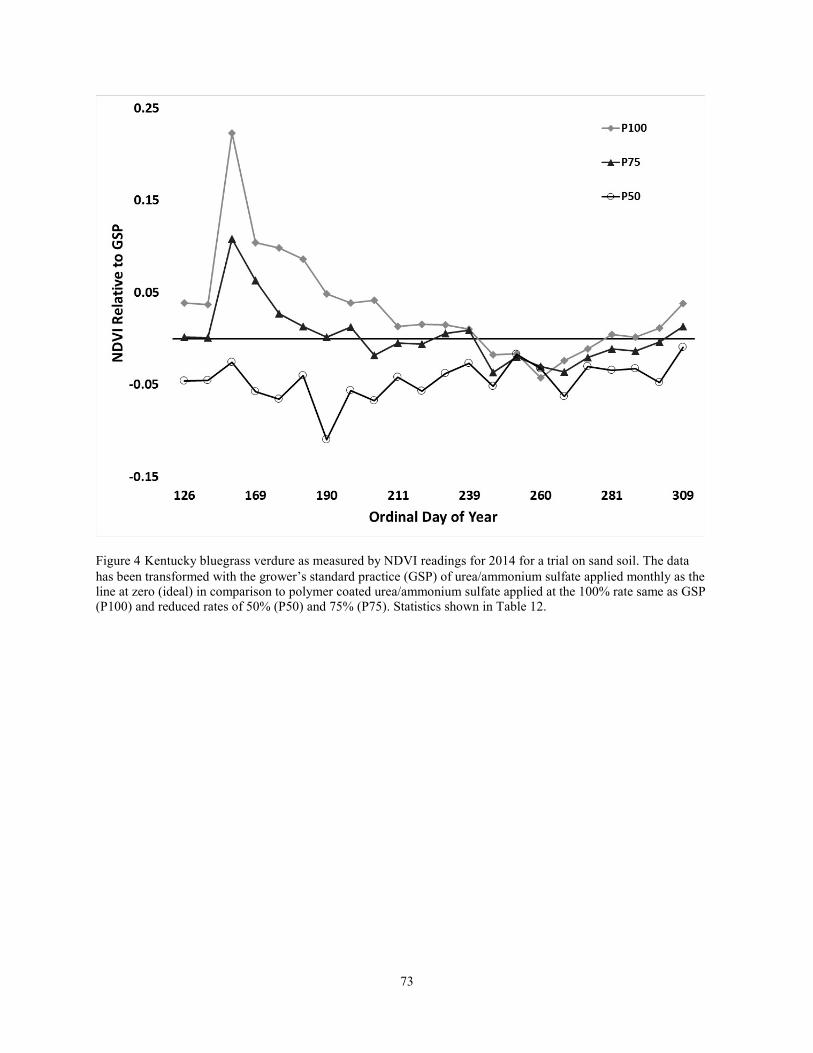
73
Figure 4 Kentucky bluegrass verdure as measured by NDVI readings for 2014 for a trial on sand soil. The data has been transformed with the grower’s standard practice (GSP) of urea/ammonium sulfate applied monthly as the line at zero (ideal) in comparison to polymer coated urea/ammonium sulfate applied at the 100% rate same as GSP (P100) and reduced rates of 50% (P50) and 75% (P75). Statistics shown in Table 12.

74
Figure 5 Kentucky bluegrass Shoot density for 2015 for a trial on loam soil. The data has been transformed with the control in comparison to the grower’s standard practice (GSP) of urea/ammonium sulfate applied monthly, and polymer coated urea/ammonium polymer coated urea applied at the 100% rate same as GSP (P100) and reduced rates of 50% (P50) and 75% (P75). Data shown in Table 15.

75
TABLES
Table 1 Soil test values for two Kentucky bluegrass trials (Loam and Sand)
Texture Sandy Loam Sand
pH (2:1) 8 7.4
ECe (2:1) mmhos cm-1 0.5 0.2
excess lime % 5 0 OM 2.4 1.6
NO3-N mg kg-1 4 2 NH4-N 2 2
P (bicarb) 19 5 K 275 75 S 15 5
Ca 2203 200 Mg 377 24 Na 92 23
Zn DTPA 1.6 0.5 Fe 9 5 Mn 8 2 Cu 0.6 0.3
B H2O 1.1 0.5
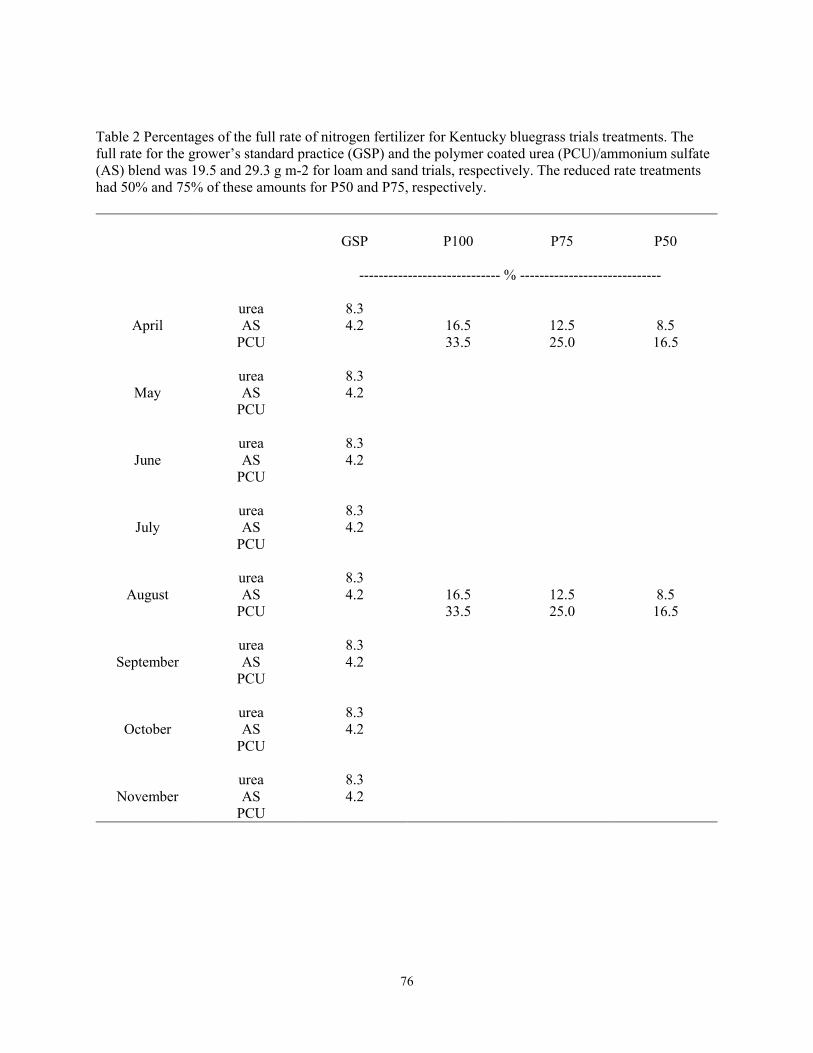
76
Table 2 Percentages of the full rate of nitrogen fertilizer for Kentucky bluegrass trials treatments. The full rate for the grower’s standard practice (GSP) and the polymer coated urea (PCU)/ammonium sulfate (AS) blend was 19.5 and 29.3 g m-2 for loam and sand trials, respectively. The reduced rate treatments had 50% and 75% of these amounts for P50 and P75, respectively.
GSP P100 P75 P50
----------------------------- % -----------------------------
April urea 8.3 AS 4.2 16.5 12.5 8.5
PCU 33.5 25.0 16.5
May urea 8.3 AS 4.2
PCU
June urea 8.3 AS 4.2
PCU
July urea 8.3 AS 4.2
PCU
August urea 8.3 AS 4.2 16.5 12.5 8.5
PCU 33.5 25.0 16.5
September urea 8.3 AS 4.2
PCU
October urea 8.3 AS 4.2
PCU
November urea 8.3 AS 4.2
PCU

77
Table 3 P values for each measurement taken in the corresponding year and soil study. Statistically significant values are in bold-faced type.
Sand 2014 Loam 2014 Loam 2015
NDVI ordinal day <.0001 <.0001 <.0001 treatment <.0001 <.0001 0.0030
ordinal day*treatment <.0001 <.0001 <.0001
verdure ordinal day 0.0005 0.0025 0.0081 treatment <.0001 <.0001 <.0001
ordinal day*treatment 0.0004 0.0012 <.0001
shoot biomass ordinal day 0.4343 0.0101 0.5687 treatment <.0001 0.0003 <.0001
ordinal day*treatment 0.0016 0.0004 <.0001
height ordinal day <.0001 <.0001 <.0001 treatment <.0001 <.0001 <.0001
ordinal day*treatment <.0001 <.0001 <.0001
shoot N ordinal day 0.0007 0.0003 <.0001 treatment <.0001 <.0001 <.0001
ordinal day*treatment <.0001 <.0001 <.0001
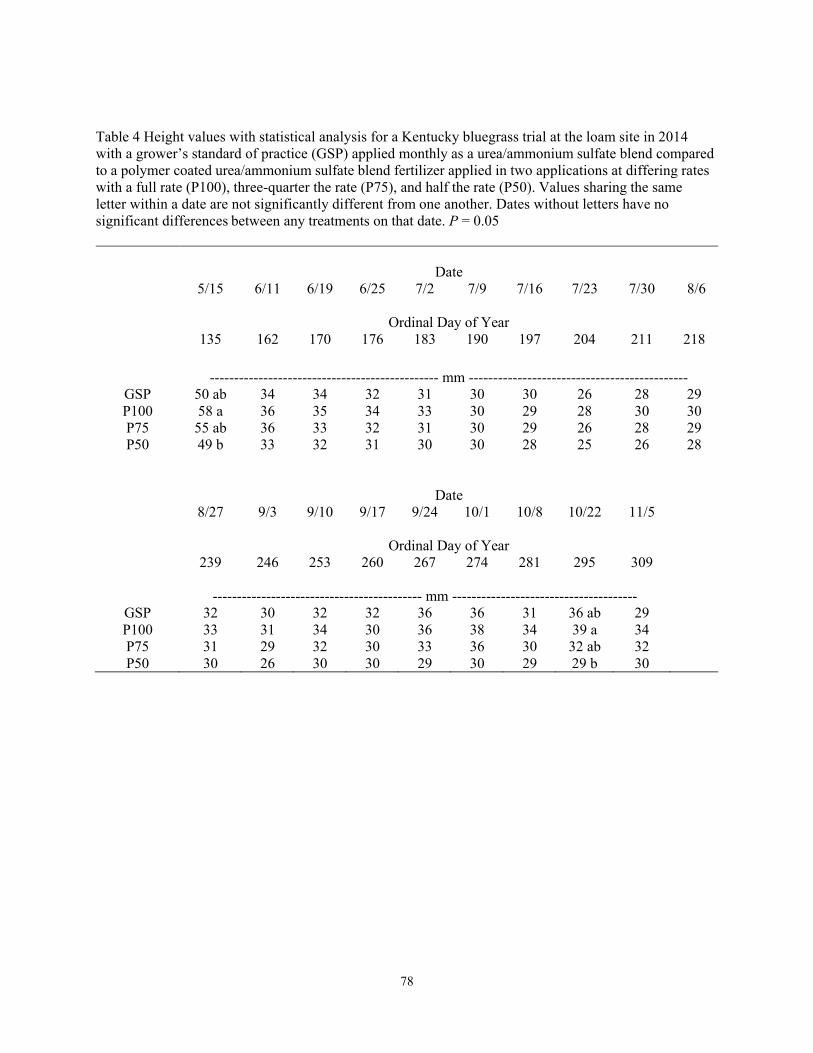
78
Table 4 Height values with statistical analysis for a Kentucky bluegrass trial at the loam site in 2014 with a grower’s standard of practice (GSP) applied monthly as a urea/ammonium sulfate blend compared to a polymer coated urea/ammonium sulfate blend fertilizer applied in two applications at differing rates with a full rate (P100), three-quarter the rate (P75), and half the rate (P50). Values sharing the same letter within a date are not significantly different from one another. Dates without letters have no significant differences between any treatments on that date. P = 0.05
Date 5/15 6/11 6/19 6/25 7/2 7/9 7/16 7/23 7/30 8/6
Ordinal Day of Year 135 162 170 176 183 190 197 204 211 218
----------------------------------------------- mm --------------------------------------------- GSP 50 ab 34 34 32 31 30 30 26 28 29 P100 58 a 36 35 34 33 30 29 28 30 30 P75 55 ab 36 33 32 31 30 29 26 28 29 P50 49 b 33 32 31 30 30 28 25 26 28
Date 8/27 9/3 9/10 9/17 9/24 10/1 10/8 10/22 11/5
Ordinal Day of Year 239 246 253 260 267 274 281 295 309
------------------------------------------- mm -------------------------------------- GSP 32 30 32 32 36 36 31 36 ab 29 P100 33 31 34 30 36 38 34 39 a 34 P75 31 29 32 30 33 36 30 32 ab 32 P50 30 26 30 30 29 30 29 29 b 30
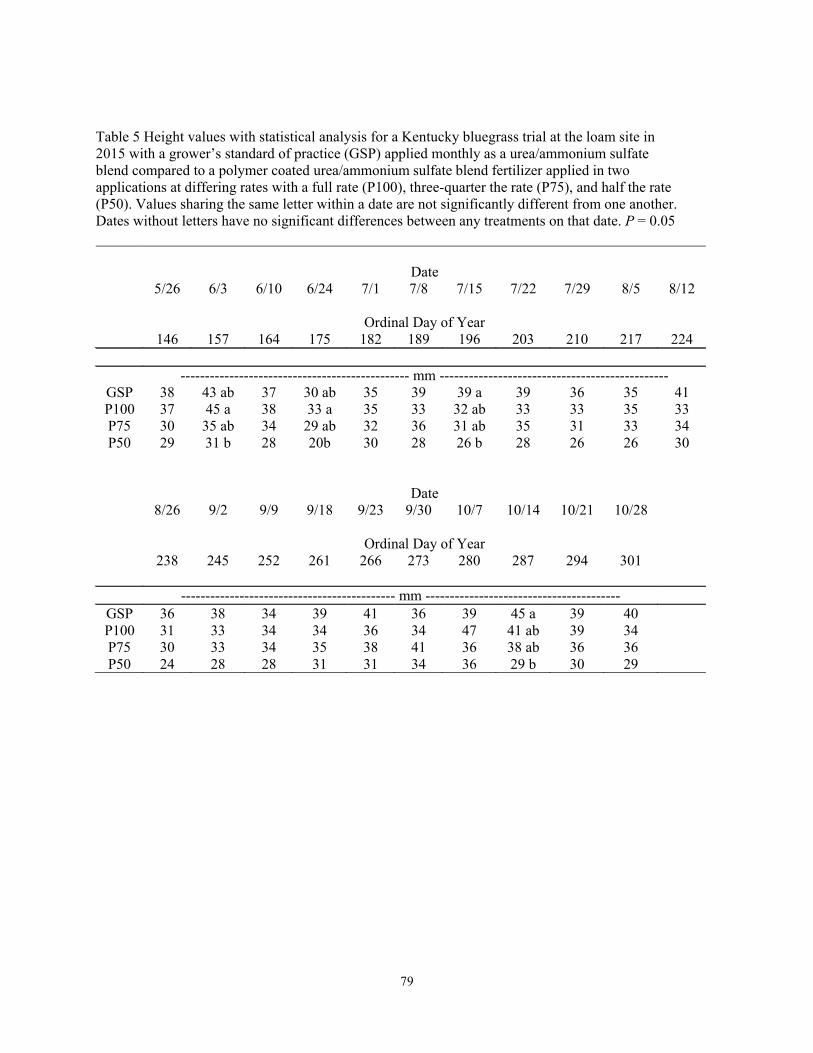
79
Table 5 Height values with statistical analysis for a Kentucky bluegrass trial at the loam site in 2015 with a grower’s standard of practice (GSP) applied monthly as a urea/ammonium sulfate blend compared to a polymer coated urea/ammonium sulfate blend fertilizer applied in two applications at differing rates with a full rate (P100), three-quarter the rate (P75), and half the rate (P50). Values sharing the same letter within a date are not significantly different from one another. Dates without letters have no significant differences between any treatments on that date. P = 0.05
Date 5/26 6/3 6/10 6/24 7/1 7/8 7/15 7/22 7/29 8/5 8/12
Ordinal Day of Year 146 157 164 175 182 189 196 203 210 217 224
----------------------------------------------- mm ----------------------------------------------- GSP 38 43 ab 37 30 ab 35 39 39 a 39 36 35 41 P100 37 45 a 38 33 a 35 33 32 ab 33 33 35 33 P75 30 35 ab 34 29 ab 32 36 31 ab 35 31 33 34 P50 29 31 b 28 20b 30 28 26 b 28 26 26 30
Date 8/26 9/2 9/9 9/18 9/23 9/30 10/7 10/14 10/21 10/28
Ordinal Day of Year 238 245 252 261 266 273 280 287 294 301
-------------------------------------------- mm ---------------------------------------- GSP 36 38 34 39 41 36 39 45 a 39 40 P100 31 33 34 34 36 34 47 41 ab 39 34 P75 30 33 34 35 38 41 36 38 ab 36 36 P50 24 28 28 31 31 34 36 29 b 30 29
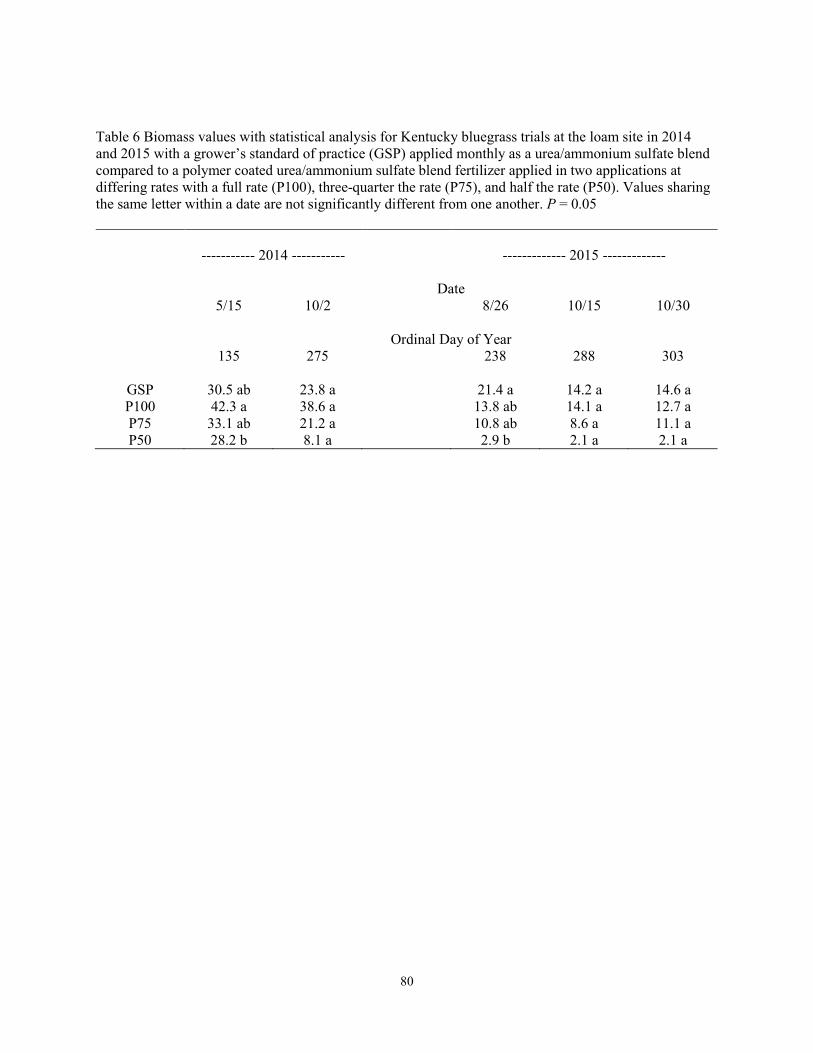
80
Table 6 Biomass values with statistical analysis for Kentucky bluegrass trials at the loam site in 2014 and 2015 with a grower’s standard of practice (GSP) applied monthly as a urea/ammonium sulfate blend compared to a polymer coated urea/ammonium sulfate blend fertilizer applied in two applications at differing rates with a full rate (P100), three-quarter the rate (P75), and half the rate (P50). Values sharing the same letter within a date are not significantly different from one another. P = 0.05
----------- 2014 ----------- ------------- 2015 -------------
Date 5/15 10/2 8/26 10/15 10/30
Ordinal Day of Year 135 275 238 288 303
GSP 30.5 ab 23.8 a 21.4 a 14.2 a 14.6 a P100 42.3 a 38.6 a 13.8 ab 14.1 a 12.7 a P75 33.1 ab 21.2 a 10.8 ab 8.6 a 11.1 a P50 28.2 b 8.1 a 2.9 b 2.1 a 2.1 a
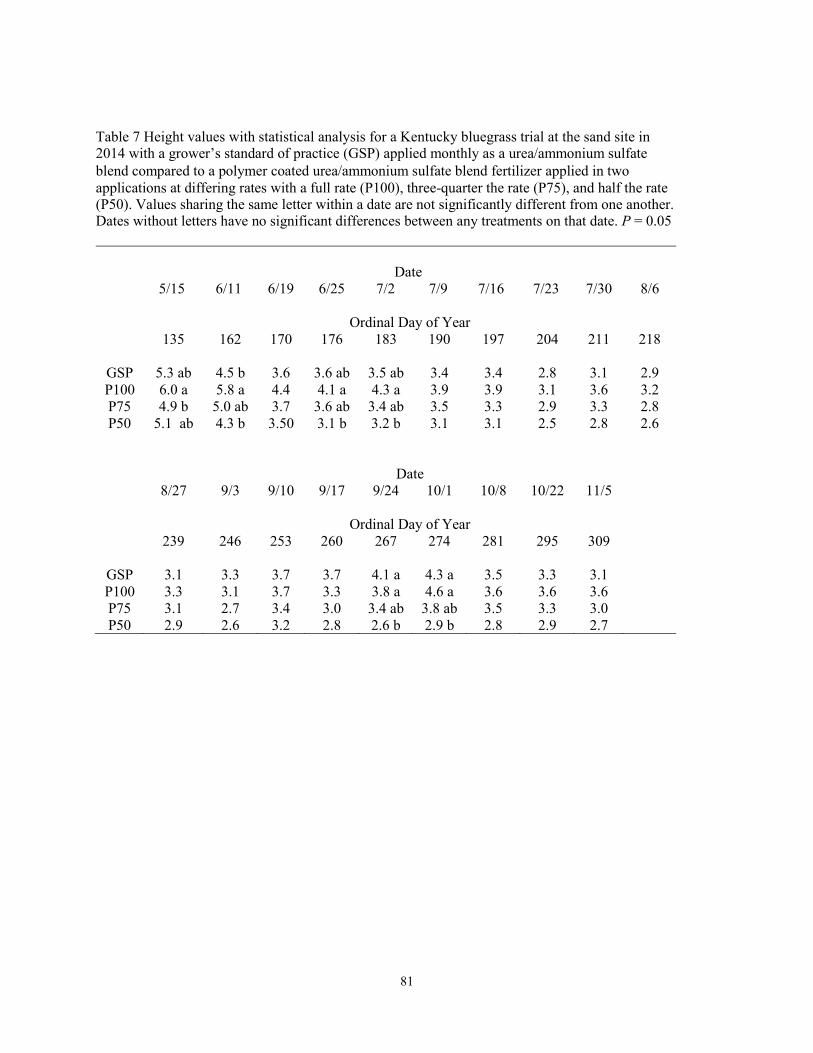
81
Table 7 Height values with statistical analysis for a Kentucky bluegrass trial at the sand site in 2014 with a grower’s standard of practice (GSP) applied monthly as a urea/ammonium sulfate blend compared to a polymer coated urea/ammonium sulfate blend fertilizer applied in two applications at differing rates with a full rate (P100), three-quarter the rate (P75), and half the rate (P50). Values sharing the same letter within a date are not significantly different from one another. Dates without letters have no significant differences between any treatments on that date. P = 0.05
Date 5/15 6/11 6/19 6/25 7/2 7/9 7/16 7/23 7/30 8/6
Ordinal Day of Year 135 162 170 176 183 190 197 204 211 218
GSP 5.3 ab 4.5 b 3.6 3.6 ab 3.5 ab 3.4 3.4 2.8 3.1 2.9 P100 6.0 a 5.8 a 4.4 4.1 a 4.3 a 3.9 3.9 3.1 3.6 3.2 P75 4.9 b 5.0 ab 3.7 3.6 ab 3.4 ab 3.5 3.3 2.9 3.3 2.8 P50 5.1 ab 4.3 b 3.50 3.1 b 3.2 b 3.1 3.1 2.5 2.8 2.6
Date 8/27 9/3 9/10 9/17 9/24 10/1 10/8 10/22 11/5
Ordinal Day of Year 239 246 253 260 267 274 281 295 309
GSP 3.1 3.3 3.7 3.7 4.1 a 4.3 a 3.5 3.3 3.1 P100 3.3 3.1 3.7 3.3 3.8 a 4.6 a 3.6 3.6 3.6 P75 3.1 2.7 3.4 3.0 3.4 ab 3.8 ab 3.5 3.3 3.0 P50 2.9 2.6 3.2 2.8 2.6 b 2.9 b 2.8 2.9 2.7
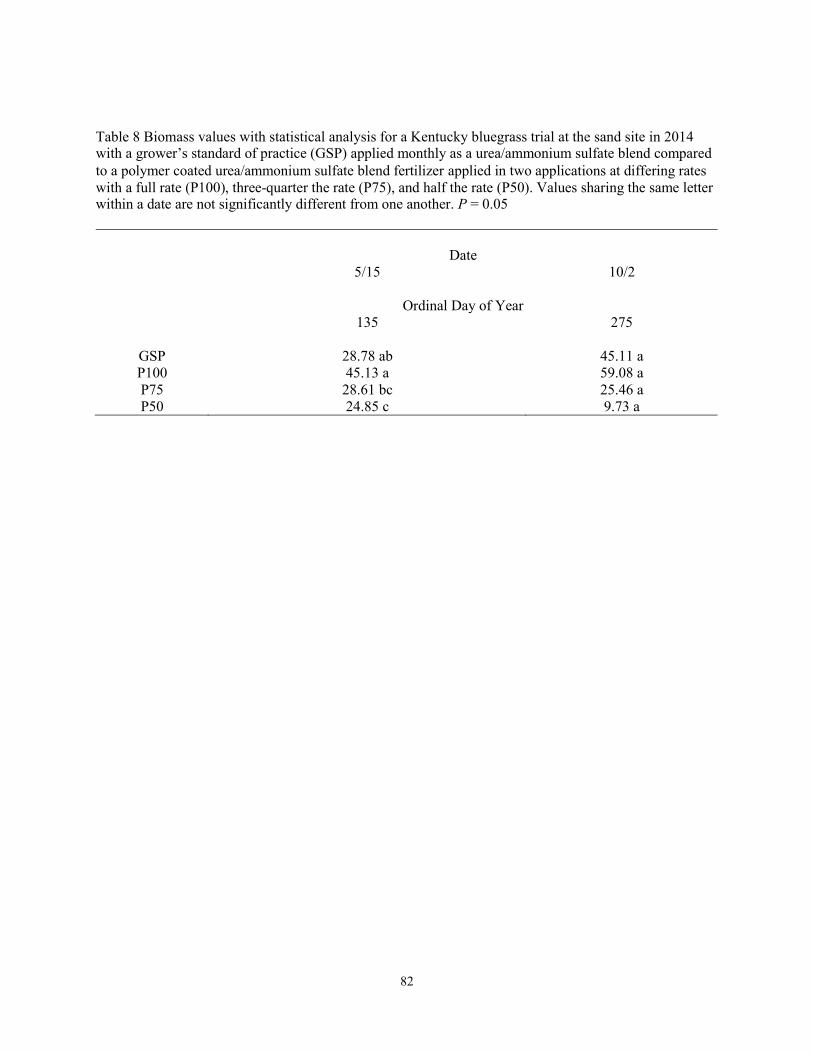
82
Table 8 Biomass values with statistical analysis for a Kentucky bluegrass trial at the sand site in 2014 with a grower’s standard of practice (GSP) applied monthly as a urea/ammonium sulfate blend compared to a polymer coated urea/ammonium sulfate blend fertilizer applied in two applications at differing rates with a full rate (P100), three-quarter the rate (P75), and half the rate (P50). Values sharing the same letter within a date are not significantly different from one another. P = 0.05
Date 5/15 10/2
Ordinal Day of Year 135 275
GSP 28.78 ab 45.11 a P100 45.13 a 59.08 a P75 28.61 bc 25.46 a P50 24.85 c 9.73 a
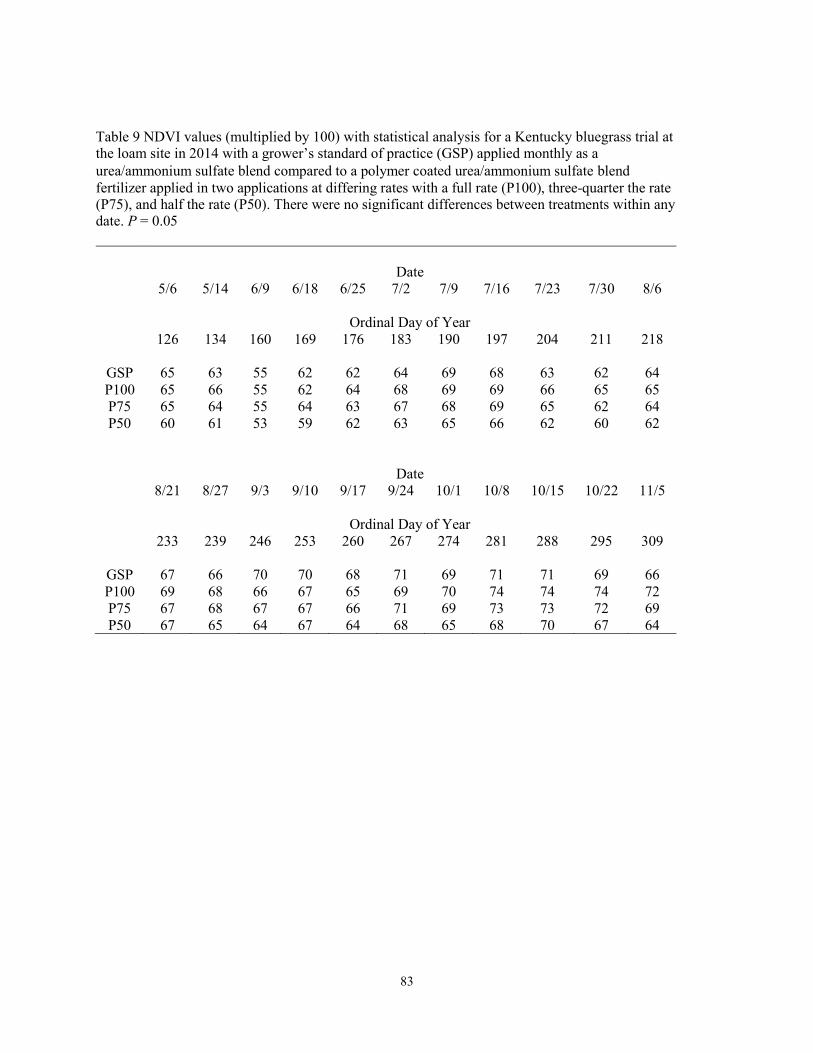
83
Table 9 NDVI values (multiplied by 100) with statistical analysis for a Kentucky bluegrass trial at the loam site in 2014 with a grower’s standard of practice (GSP) applied monthly as a urea/ammonium sulfate blend compared to a polymer coated urea/ammonium sulfate blend fertilizer applied in two applications at differing rates with a full rate (P100), three-quarter the rate (P75), and half the rate (P50). There were no significant differences between treatments within any date. P = 0.05
Date 5/6 5/14 6/9 6/18 6/25 7/2 7/9 7/16 7/23 7/30 8/6
Ordinal Day of Year 126 134 160 169 176 183 190 197 204 211 218
GSP 65 63 55 62 62 64 69 68 63 62 64 P100 65 66 55 62 64 68 69 69 66 65 65 P75 65 64 55 64 63 67 68 69 65 62 64 P50 60 61 53 59 62 63 65 66 62 60 62
Date 8/21 8/27 9/3 9/10 9/17 9/24 10/1 10/8 10/15 10/22 11/5
Ordinal Day of Year 233 239 246 253 260 267 274 281 288 295 309
GSP 67 66 70 70 68 71 69 71 71 69 66 P100 69 68 66 67 65 69 70 74 74 74 72 P75 67 68 67 67 66 71 69 73 73 72 69 P50 67 65 64 67 64 68 65 68 70 67 64
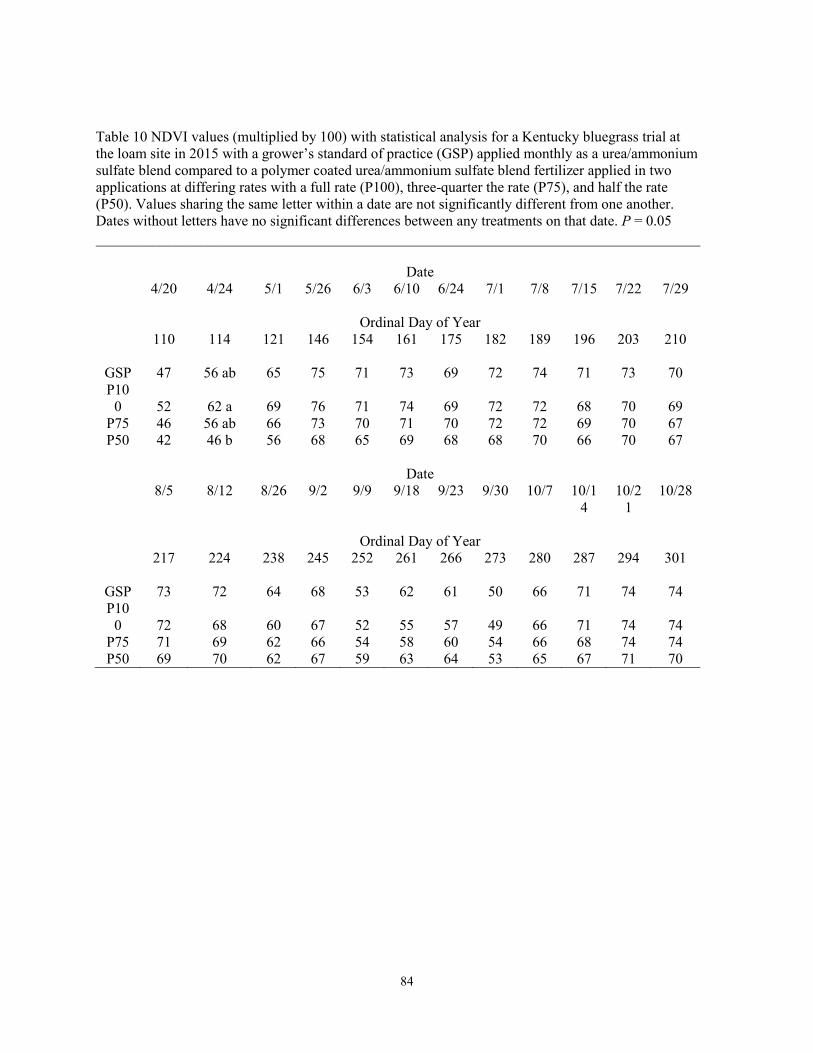
84
Table 10 NDVI values (multiplied by 100) with statistical analysis for a Kentucky bluegrass trial at the loam site in 2015 with a grower’s standard of practice (GSP) applied monthly as a urea/ammonium sulfate blend compared to a polymer coated urea/ammonium sulfate blend fertilizer applied in two applications at differing rates with a full rate (P100), three-quarter the rate (P75), and half the rate (P50). Values sharing the same letter within a date are not significantly different from one another. Dates without letters have no significant differences between any treatments on that date. P = 0.05
Date 4/20 4/24 5/1 5/26 6/3 6/10 6/24 7/1 7/8 7/15 7/22 7/29
Ordinal Day of Year 110 114 121 146 154 161 175 182 189 196 203 210
GSP 47 56 ab 65 75 71 73 69 72 74 71 73 70 P10
0 52 62 a 69 76 71 74 69 72 72 68 70 69 P75 46 56 ab 66 73 70 71 70 72 72 69 70 67 P50 42 46 b 56 68 65 69 68 68 70 66 70 67
Date 8/5 8/12 8/26 9/2 9/9 9/18 9/23 9/30 10/7 10/1
4 10/2
1 10/28
Ordinal Day of Year 217 224 238 245 252 261 266 273 280 287 294 301
GSP 73 72 64 68 53 62 61 50 66 71 74 74 P10
0 72 68 60 67 52 55 57 49 66 71 74 74 P75 71 69 62 66 54 58 60 54 66 68 74 74 P50 69 70 62 67 59 63 64 53 65 67 71 70
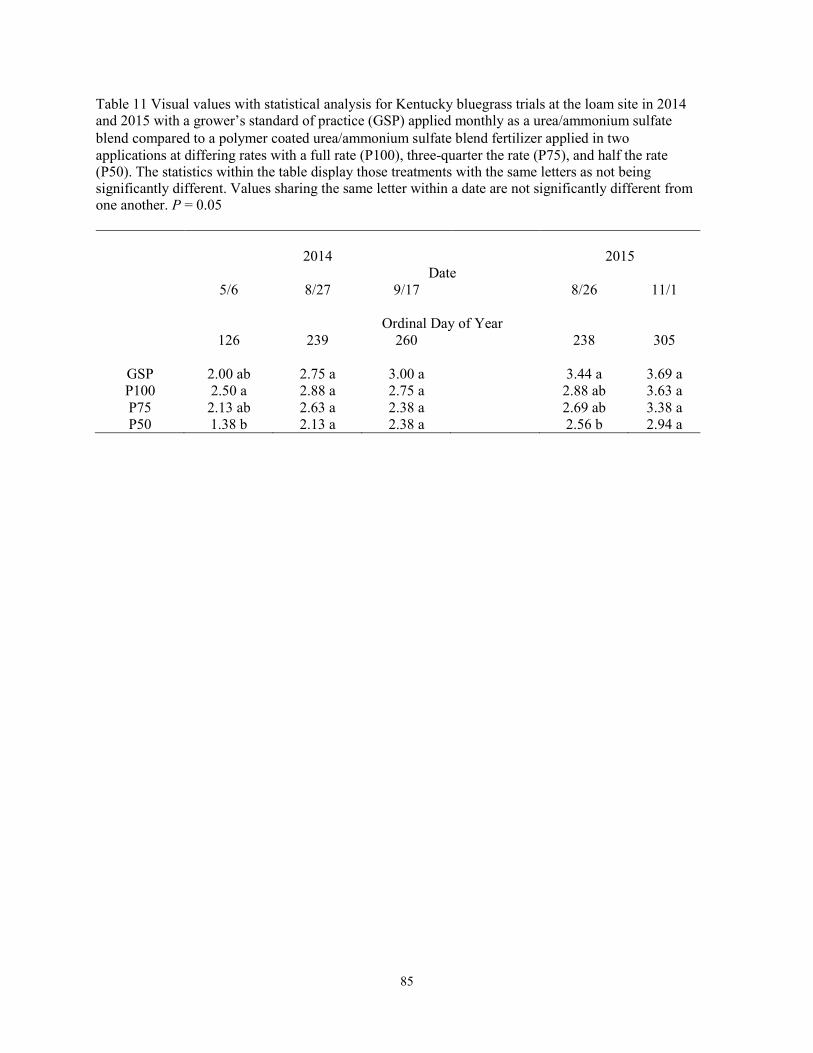
85
Table 11 Visual values with statistical analysis for Kentucky bluegrass trials at the loam site in 2014 and 2015 with a grower’s standard of practice (GSP) applied monthly as a urea/ammonium sulfate blend compared to a polymer coated urea/ammonium sulfate blend fertilizer applied in two applications at differing rates with a full rate (P100), three-quarter the rate (P75), and half the rate (P50). The statistics within the table display those treatments with the same letters as not being significantly different. Values sharing the same letter within a date are not significantly different from one another. P = 0.05
2014 2015 Date
5/6 8/27 9/17 8/26 11/1
Ordinal Day of Year 126 239 260 238 305
GSP 2.00 ab 2.75 a 3.00 a 3.44 a 3.69 a P100 2.50 a 2.88 a 2.75 a 2.88 ab 3.63 a P75 2.13 ab 2.63 a 2.38 a 2.69 ab 3.38 a P50 1.38 b 2.13 a 2.38 a 2.56 b 2.94 a
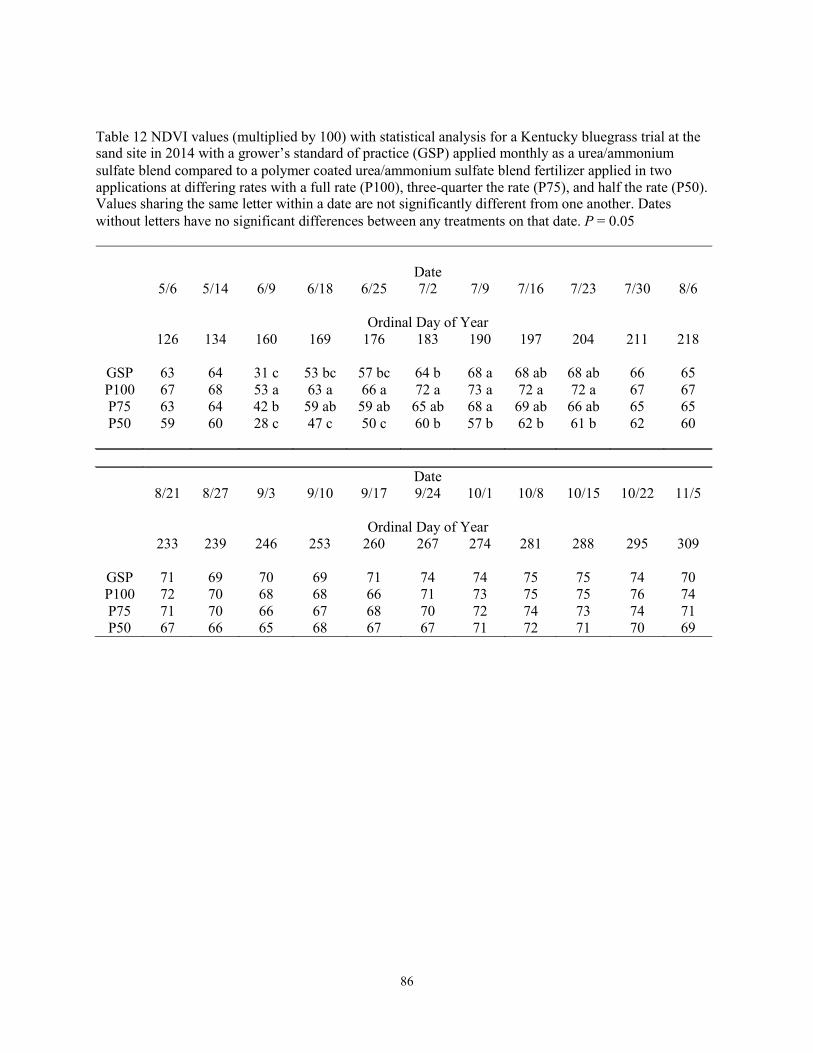
86
Table 12 NDVI values (multiplied by 100) with statistical analysis for a Kentucky bluegrass trial at the sand site in 2014 with a grower’s standard of practice (GSP) applied monthly as a urea/ammonium sulfate blend compared to a polymer coated urea/ammonium sulfate blend fertilizer applied in two applications at differing rates with a full rate (P100), three-quarter the rate (P75), and half the rate (P50). Values sharing the same letter within a date are not significantly different from one another. Dates without letters have no significant differences between any treatments on that date. P = 0.05
Date 5/6 5/14 6/9 6/18 6/25 7/2 7/9 7/16 7/23 7/30 8/6
Ordinal Day of Year 126 134 160 169 176 183 190 197 204 211 218
GSP 63 64 31 c 53 bc 57 bc 64 b 68 a 68 ab 68 ab 66 65 P100 67 68 53 a 63 a 66 a 72 a 73 a 72 a 72 a 67 67 P75 63 64 42 b 59 ab 59 ab 65 ab 68 a 69 ab 66 ab 65 65 P50 59 60 28 c 47 c 50 c 60 b 57 b 62 b 61 b 62 60
Date 8/21 8/27 9/3 9/10 9/17 9/24 10/1 10/8 10/15 10/22 11/5
Ordinal Day of Year 233 239 246 253 260 267 274 281 288 295 309
GSP 71 69 70 69 71 74 74 75 75 74 70 P100 72 70 68 68 66 71 73 75 75 76 74 P75 71 70 66 67 68 70 72 74 73 74 71 P50 67 66 65 68 67 67 71 72 71 70 69

87
Table 13 Visual values with statistical analysis for a Kentucky bluegrass trial at the sand site in 2014 with a grower’s standard of practice (GSP) applied monthly as a urea/ammonium sulfate blend compared to a polymer coated urea/ammonium sulfate blend fertilizer applied in two applications at differing rates with a full rate (P100), three-quarter the rate (P75), and half the rate (P50). Values sharing the same letter within a date are not significantly different from one another. P = 0.05
Date 5/6 8/27 9/17
Ordinal Day of Year 126 239 260
GSP 2.25 ab 3.25 a 3.50 a P100 2.75 a 3.88 a 3.38 a P75 2.25 ab 3.00 a 3.00 a P50 1.38 b 2.88 a 2.88 a

88
Table 14 Total N values with statistical analysis for Kentucky bluegrass trials at the loam site in 2014 and 2015 on the top and the sand site in 2014 with a grower’s standard of practice (GSP) applied monthly as a urea/ammonium sulfate blend compared to polymer coated urea/ammonium sulfate bled fertilizer applied in two applications at differing rates with a full rate (P100), three-quarter the rate (P75), and half the rate (P50). Values sharing the same letter within a date are not significantly different from one another. P= 0.05.
Loam 2014 2015
Date 5/15 10/2 10/15 10/30
Ordinal Day of Year 135 275 288 303
GSP 2.24 ab 3.09 a 4.44 a 3.36 a P100 2.69 b 3.81 b 4.26 a 3.53 a P75 2.31 b 3.21 ab 3.73 a 3.13 a P50 1.87 a 2.67 a 3.00 a 2.53 a
Sand
Date 5/15 10/2
Ordinal Day of Year 135 275
GSP 2.39 a 3.91 b P100 3.19 b 4.55 c P75 2.58 a 3.77 b P50 2.07 a 3.03 a

89
Table 15 Shoot density with statistical analysis for a Kentucky bluegrass trial at the loam site in 2015 with a grower’s standard of practice (GSP) applied monthly as a urea/ammonium sulfate blend compared to a polymer coated urea/ammonium sulfate blend fertilizer applied in two applications at differing rates with a full rate (P100), three-quarter the rate (P75), and half the rate (P50). Values sharing the same letter within a date are not significantly different from one another. P = 0.05
Date
10/30
Ordinal Day of Year
303
GSP 61.5 P100 68.5 P75 69.5 P50 90.7

90
Appendix A
The following is supplementary data collected for the Timing Study (Chapter 1), but not included in the main paper.
Root Density: Loam Soil Trial
Appendix Table 1 Root density (g) with statistical analysis for a Kentucky bluegrass trial at the loam site in 2015 with a grower’s standard of practice (GSP) applied monthly as a urea/ammonium sulfate blend compared to a polymer coated urea/ammonium sulfate blend fertilizer applied in one application in spring (1Ap-S) or fall (1Ap-F) or in two applications (2Ap). Fertilizer was applied at a full rate 100%. Values sharing the same letter within a date are not significantly different from one another. P = 0.05
Date
10/30
Ordinal Day of Year
303
GSP 3.91 a 2Ap 3.19 a
1Ap-S 3.01 a 1Ap-F 5.10 a
91
Loam Biomass
Shoot biomass at the first sampling date in 2014 showed a significant difference between 1Ap-S
and the GSP with 1Ap-S having a larger biomass which corresponds directly with the significant
height difference for 1Ap-S over the GSP on the same date (Fig. 1). There were no significant
biomass differences on the second date in 2014 which also corresponds with the height
measurements on the same date. There were no differences for the first date in 2015 for biomass
or height. The second date in 2015 had significant differences in the biomass of 1Ap-F having
significantly greater biomass than 1Ap-S. The height for the same date is different from the
biomass with the 1Ap-F being significantly greater than the GSP, 1Ap-S, and 2Ap. There was a
significant difference in biomass on the third date of 2015 with 1Ap-F having significantly
greater biomass than the GSP, 1Ap-S, and 2Ap. The height results slightly differ from the
biomass for the same date in that the height of 1Ap-F was not significantly greater than the GSP.
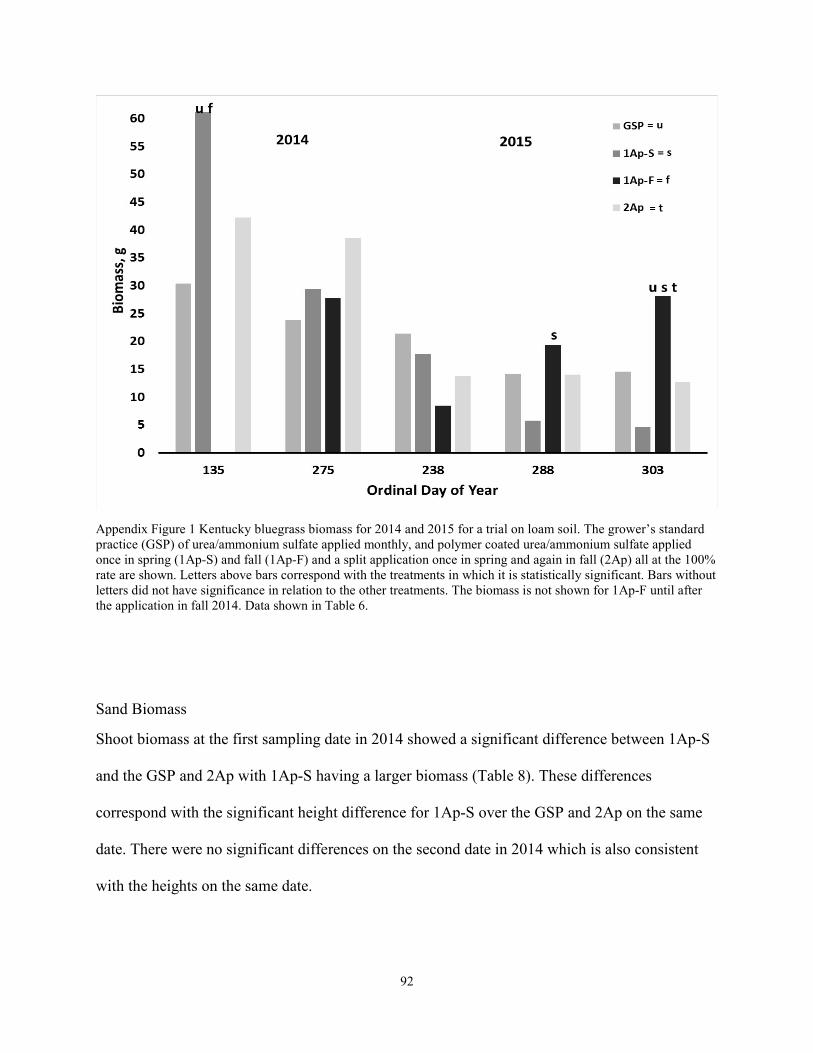
92
Appendix Figure 1 Kentucky bluegrass biomass for 2014 and 2015 for a trial on loam soil. The grower’s standard practice (GSP) of urea/ammonium sulfate applied monthly, and polymer coated urea/ammonium sulfate applied once in spring (1Ap-S) and fall (1Ap-F) and a split application once in spring and again in fall (2Ap) all at the 100% rate are shown. Letters above bars correspond with the treatments in which it is statistically significant. Bars without letters did not have significance in relation to the other treatments. The biomass is not shown for 1Ap-F until after the application in fall 2014. Data shown in Table 6.
Sand Biomass
Shoot biomass at the first sampling date in 2014 showed a significant difference between 1Ap-S
and the GSP and 2Ap with 1Ap-S having a larger biomass (Table 8). These differences
correspond with the significant height difference for 1Ap-S over the GSP and 2Ap on the same
date. There were no significant differences on the second date in 2014 which is also consistent
with the heights on the same date.
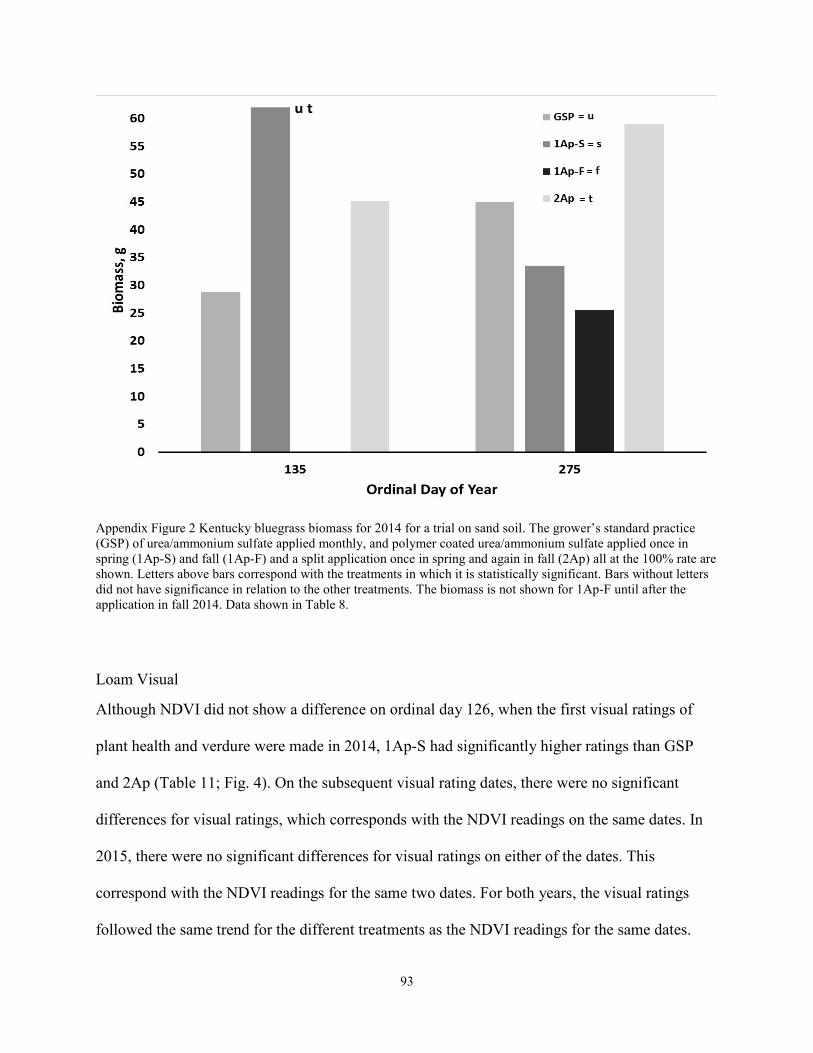
93
Appendix Figure 2 Kentucky bluegrass biomass for 2014 for a trial on sand soil. The grower’s standard practice (GSP) of urea/ammonium sulfate applied monthly, and polymer coated urea/ammonium sulfate applied once in spring (1Ap-S) and fall (1Ap-F) and a split application once in spring and again in fall (2Ap) all at the 100% rate are shown. Letters above bars correspond with the treatments in which it is statistically significant. Bars without letters did not have significance in relation to the other treatments. The biomass is not shown for 1Ap-F until after the application in fall 2014. Data shown in Table 8.
Loam Visual
Although NDVI did not show a difference on ordinal day 126, when the first visual ratings of
plant health and verdure were made in 2014, 1Ap-S had significantly higher ratings than GSP
and 2Ap (Table 11; Fig. 4). On the subsequent visual rating dates, there were no significant
differences for visual ratings, which corresponds with the NDVI readings on the same dates. In
2015, there were no significant differences for visual ratings on either of the dates. This
correspond with the NDVI readings for the same two dates. For both years, the visual ratings
followed the same trend for the different treatments as the NDVI readings for the same dates.
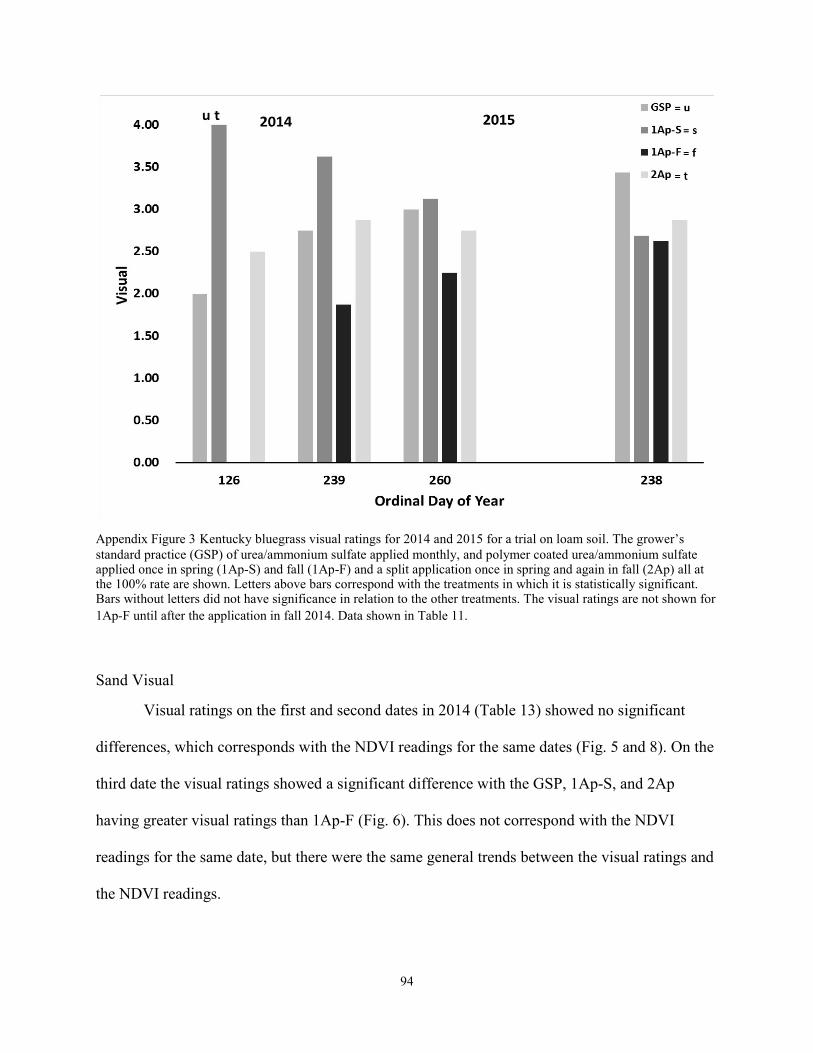
94
Appendix Figure 3 Kentucky bluegrass visual ratings for 2014 and 2015 for a trial on loam soil. The grower’s standard practice (GSP) of urea/ammonium sulfate applied monthly, and polymer coated urea/ammonium sulfate applied once in spring (1Ap-S) and fall (1Ap-F) and a split application once in spring and again in fall (2Ap) all at the 100% rate are shown. Letters above bars correspond with the treatments in which it is statistically significant. Bars without letters did not have significance in relation to the other treatments. The visual ratings are not shown for 1Ap-F until after the application in fall 2014. Data shown in Table 11.
Sand Visual
Visual ratings on the first and second dates in 2014 (Table 13) showed no significant
differences, which corresponds with the NDVI readings for the same dates (Fig. 5 and 8). On the
third date the visual ratings showed a significant difference with the GSP, 1Ap-S, and 2Ap
having greater visual ratings than 1Ap-F (Fig. 6). This does not correspond with the NDVI
readings for the same date, but there were the same general trends between the visual ratings and
the NDVI readings.
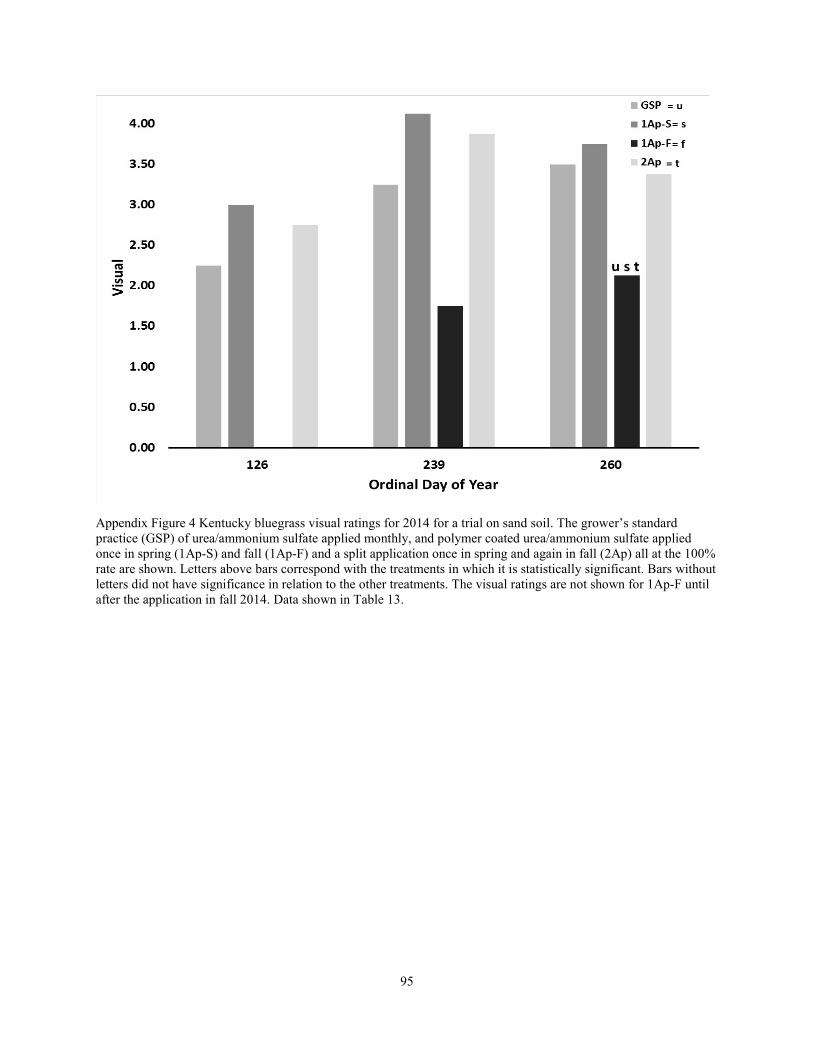
95
Appendix Figure 4 Kentucky bluegrass visual ratings for 2014 for a trial on sand soil. The grower’s standard practice (GSP) of urea/ammonium sulfate applied monthly, and polymer coated urea/ammonium sulfate applied once in spring (1Ap-S) and fall (1Ap-F) and a split application once in spring and again in fall (2Ap) all at the 100% rate are shown. Letters above bars correspond with the treatments in which it is statistically significant. Bars without letters did not have significance in relation to the other treatments. The visual ratings are not shown for 1Ap-F until after the application in fall 2014. Data shown in Table 13.
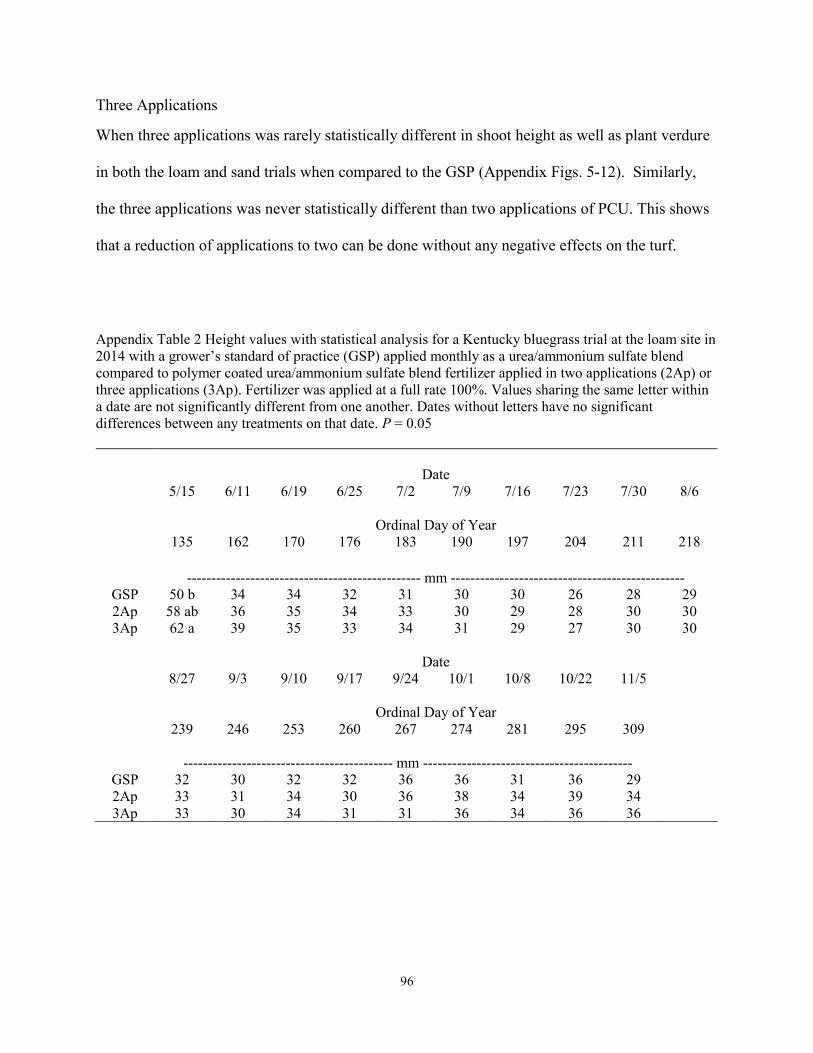
96
Three Applications
When three applications was rarely statistically different in shoot height as well as plant verdure
in both the loam and sand trials when compared to the GSP (Appendix Figs. 5-12). Similarly,
the three applications was never statistically different than two applications of PCU. This shows
that a reduction of applications to two can be done without any negative effects on the turf.
Appendix Table 2 Height values with statistical analysis for a Kentucky bluegrass trial at the loam site in 2014 with a grower’s standard of practice (GSP) applied monthly as a urea/ammonium sulfate blend compared to polymer coated urea/ammonium sulfate blend fertilizer applied in two applications (2Ap) or three applications (3Ap). Fertilizer was applied at a full rate 100%. Values sharing the same letter within a date are not significantly different from one another. Dates without letters have no significant differences between any treatments on that date. P = 0.05
Date 5/15 6/11 6/19 6/25 7/2 7/9 7/16 7/23 7/30 8/6
Ordinal Day of Year 135 162 170 176 183 190 197 204 211 218
------------------------------------------------ mm ------------------------------------------------ GSP 50 b 34 34 32 31 30 30 26 28 29 2Ap 58 ab 36 35 34 33 30 29 28 30 30 3Ap 62 a 39 35 33 34 31 29 27 30 30
Date 8/27 9/3 9/10 9/17 9/24 10/1 10/8 10/22 11/5
Ordinal Day of Year 239 246 253 260 267 274 281 295 309
------------------------------------------- mm ------------------------------------------- GSP 32 30 32 32 36 36 31 36 29 2Ap 33 31 34 30 36 38 34 39 34 3Ap 33 30 34 31 31 36 34 36 36
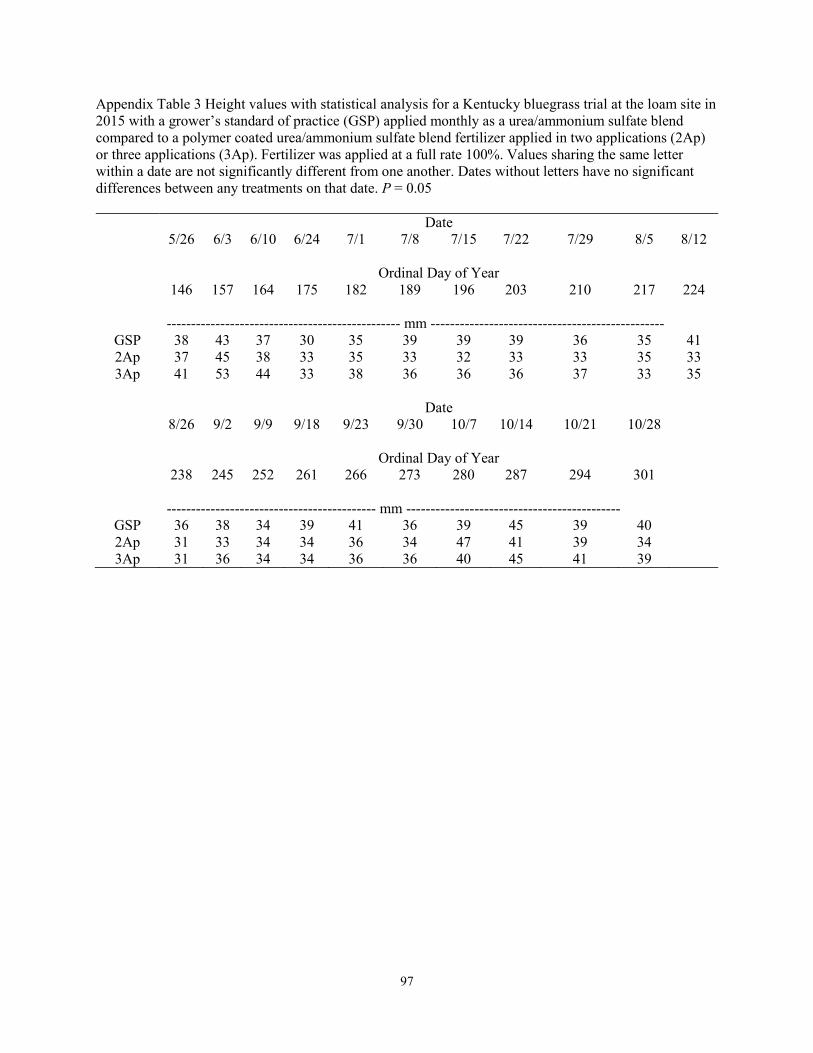
97
Appendix Table 3 Height values with statistical analysis for a Kentucky bluegrass trial at the loam site in 2015 with a grower’s standard of practice (GSP) applied monthly as a urea/ammonium sulfate blend compared to a polymer coated urea/ammonium sulfate blend fertilizer applied in two applications (2Ap) or three applications (3Ap). Fertilizer was applied at a full rate 100%. Values sharing the same letter within a date are not significantly different from one another. Dates without letters have no significant differences between any treatments on that date. P = 0.05
Date 5/26 6/3 6/10 6/24 7/1 7/8 7/15 7/22 7/29 8/5 8/12
Ordinal Day of Year 146 157 164 175 182 189 196 203 210 217 224
------------------------------------------------ mm ------------------------------------------------ GSP 38 43 37 30 35 39 39 39 36 35 41 2Ap 37 45 38 33 35 33 32 33 33 35 33 3Ap 41 53 44 33 38 36 36 36 37 33 35
Date 8/26 9/2 9/9 9/18 9/23 9/30 10/7 10/14 10/21 10/28
Ordinal Day of Year 238 245 252 261 266 273 280 287 294 301
------------------------------------------- mm -------------------------------------------- GSP 36 38 34 39 41 36 39 45 39 40 2Ap 31 33 34 34 36 34 47 41 39 34 3Ap 31 36 34 34 36 36 40 45 41 39
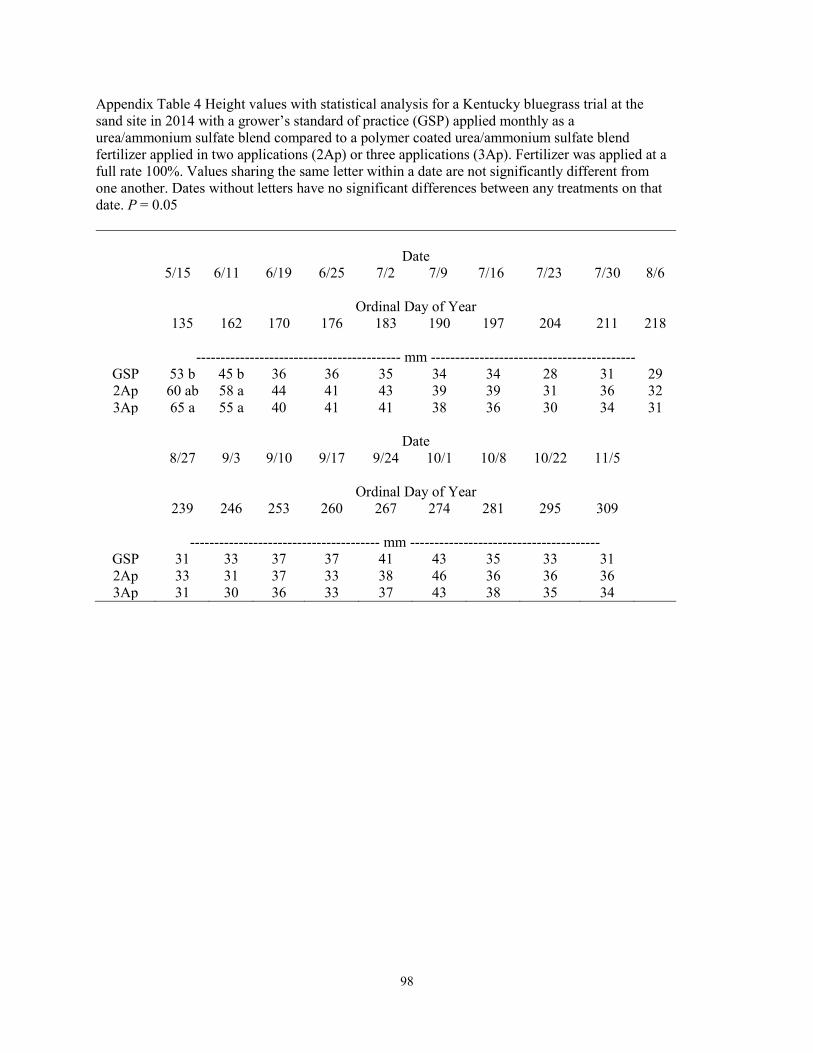
98
Appendix Table 4 Height values with statistical analysis for a Kentucky bluegrass trial at the sand site in 2014 with a grower’s standard of practice (GSP) applied monthly as a urea/ammonium sulfate blend compared to a polymer coated urea/ammonium sulfate blend fertilizer applied in two applications (2Ap) or three applications (3Ap). Fertilizer was applied at a full rate 100%. Values sharing the same letter within a date are not significantly different from one another. Dates without letters have no significant differences between any treatments on that date. P = 0.05
Date 5/15 6/11 6/19 6/25 7/2 7/9 7/16 7/23 7/30 8/6
Ordinal Day of Year 135 162 170 176 183 190 197 204 211 218
------------------------------------------ mm ------------------------------------------ GSP 53 b 45 b 36 36 35 34 34 28 31 29 2Ap 60 ab 58 a 44 41 43 39 39 31 36 32 3Ap 65 a 55 a 40 41 41 38 36 30 34 31
Date 8/27 9/3 9/10 9/17 9/24 10/1 10/8 10/22 11/5
Ordinal Day of Year 239 246 253 260 267 274 281 295 309
--------------------------------------- mm --------------------------------------- GSP 31 33 37 37 41 43 35 33 31 2Ap 33 31 37 33 38 46 36 36 36 3Ap 31 30 36 33 37 43 38 35 34
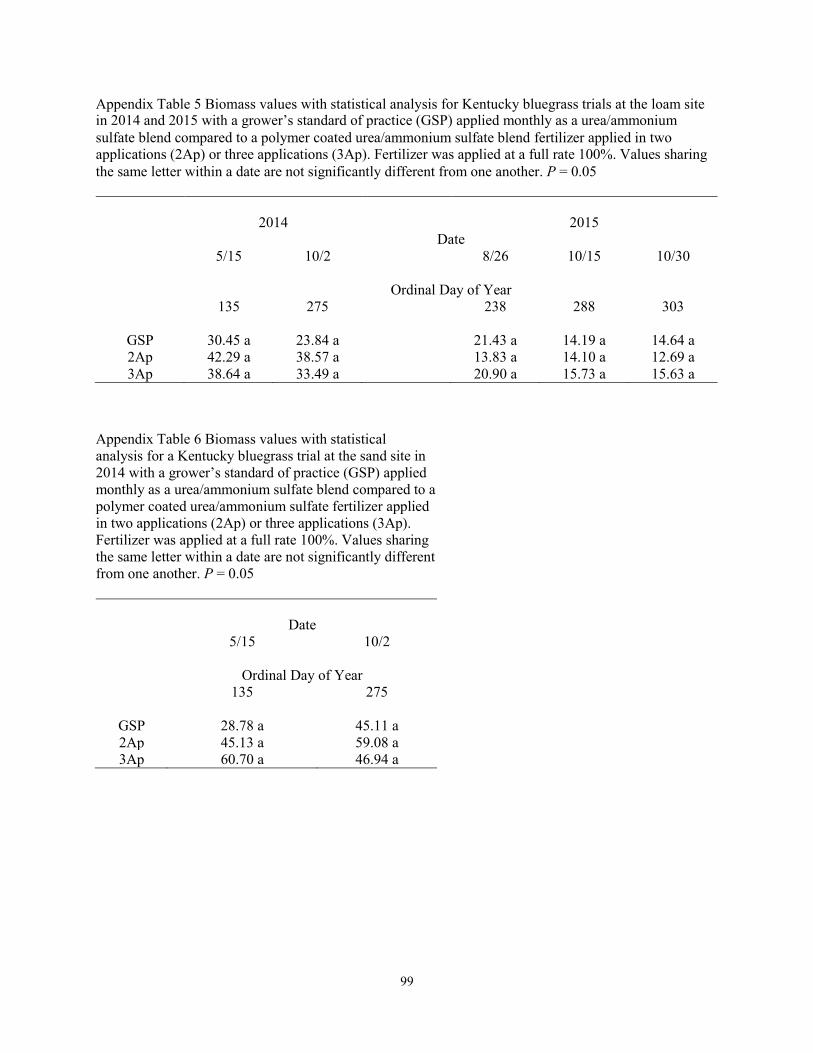
99
Appendix Table 5 Biomass values with statistical analysis for Kentucky bluegrass trials at the loam site in 2014 and 2015 with a grower’s standard of practice (GSP) applied monthly as a urea/ammonium sulfate blend compared to a polymer coated urea/ammonium sulfate blend fertilizer applied in two applications (2Ap) or three applications (3Ap). Fertilizer was applied at a full rate 100%. Values sharing the same letter within a date are not significantly different from one another. P = 0.05
2014 2015 Date
5/15 10/2 8/26 10/15 10/30
Ordinal Day of Year 135 275 238 288 303
GSP 30.45 a 23.84 a 21.43 a 14.19 a 14.64 a 2Ap 42.29 a 38.57 a 13.83 a 14.10 a 12.69 a 3Ap 38.64 a 33.49 a 20.90 a 15.73 a 15.63 a
Appendix Table 6 Biomass values with statistical analysis for a Kentucky bluegrass trial at the sand site in 2014 with a grower’s standard of practice (GSP) applied monthly as a urea/ammonium sulfate blend compared to a polymer coated urea/ammonium sulfate fertilizer applied in two applications (2Ap) or three applications (3Ap). Fertilizer was applied at a full rate 100%. Values sharing the same letter within a date are not significantly different from one another. P = 0.05
Date 5/15 10/2
Ordinal Day of Year 135 275
GSP 28.78 a 45.11 a 2Ap 45.13 a 59.08 a 3Ap 60.70 a 46.94 a
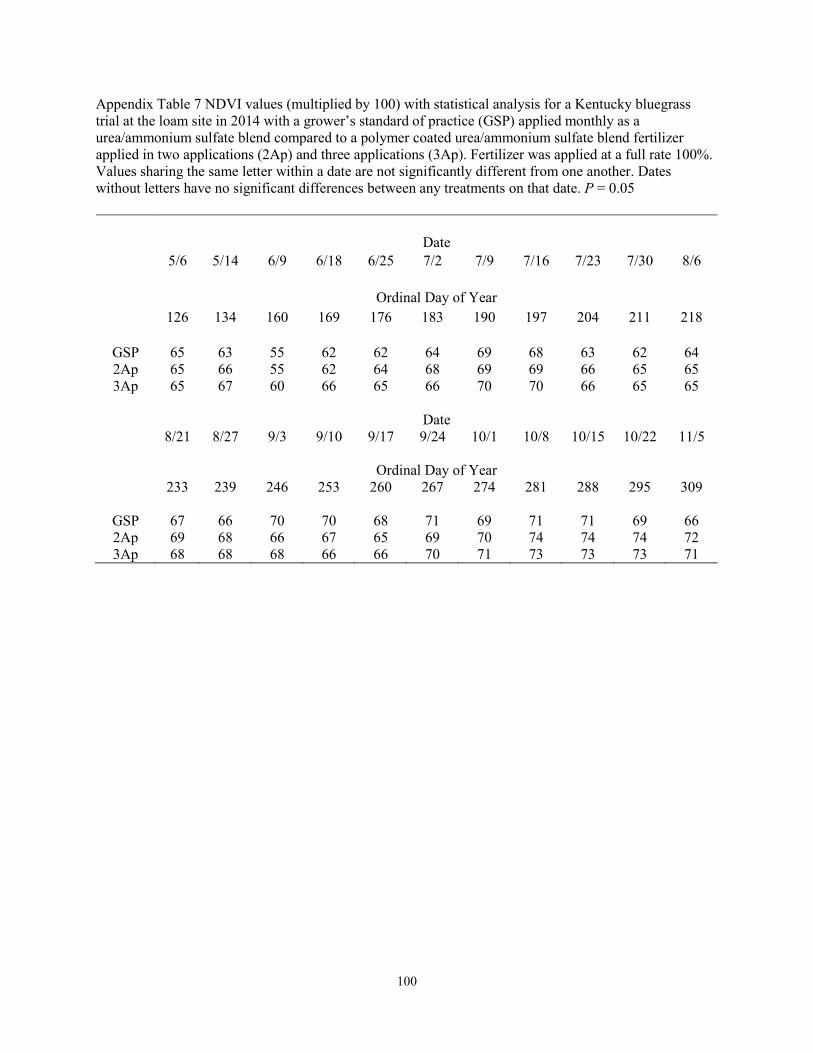
100
Appendix Table 7 NDVI values (multiplied by 100) with statistical analysis for a Kentucky bluegrass trial at the loam site in 2014 with a grower’s standard of practice (GSP) applied monthly as a urea/ammonium sulfate blend compared to a polymer coated urea/ammonium sulfate blend fertilizer applied in two applications (2Ap) and three applications (3Ap). Fertilizer was applied at a full rate 100%. Values sharing the same letter within a date are not significantly different from one another. Dates without letters have no significant differences between any treatments on that date. P = 0.05
Date 5/6 5/14 6/9 6/18 6/25 7/2 7/9 7/16 7/23 7/30 8/6
Ordinal Day of Year 126 134 160 169 176 183 190 197 204 211 218
GSP 65 63 55 62 62 64 69 68 63 62 64 2Ap 65 66 55 62 64 68 69 69 66 65 65 3Ap 65 67 60 66 65 66 70 70 66 65 65
Date 8/21 8/27 9/3 9/10 9/17 9/24 10/1 10/8 10/15 10/22 11/5
Ordinal Day of Year 233 239 246 253 260 267 274 281 288 295 309
GSP 67 66 70 70 68 71 69 71 71 69 66 2Ap 69 68 66 67 65 69 70 74 74 74 72 3Ap 68 68 68 66 66 70 71 73 73 73 71

101
Appendix Table 8 NDVI values (multiplied by 100) with statistical analysis for a Kentucky bluegrass trial at the loam site in 2015 with a grower’s standard of practice (GSP) applied monthly as a urea/ammonium sulfate blend compared to a polymer coated urea/ammonium sulfate blend fertilizer applied in two applications (2Ap) or three applications (3Ap). Fertilizer was applied at a full rate 100%. Values sharing the same letter within a date are not significantly different from one another. Dates without letters have no significant differences between any treatments on that date. P = 0.05
Date 4/20 4/24 5/1 5/26 6/3 6/10 6/24 7/1 7/8 7/15 7/22 7/29
Ordinal Day of Year 110 114 121 146 154 161 175 182 189 196 203 210
GSP 47 56 65 75 71 73 69 72 74 71 73 70 2Ap 52 62 69 76 71 74 69 72 72 68 70 69 3Ap 57 66 70 77 74 75 70 73 74 70 70 69
Date 8/5 8/12 8/26 9/2 9/9 9/18 9/23 9/30 10/7 10/14 10/21 10/28
Ordinal Day of Year 217 224 238 245 252 261 266 273 280 287 294 301
GSP 73 72 64 68 53 62 61 50 66 71 74 74 2Ap 72 68 60 67 52 55 57 49 66 71 74 74 3Ap 72 69 63 66 48 58 60 49 67 71 74 75
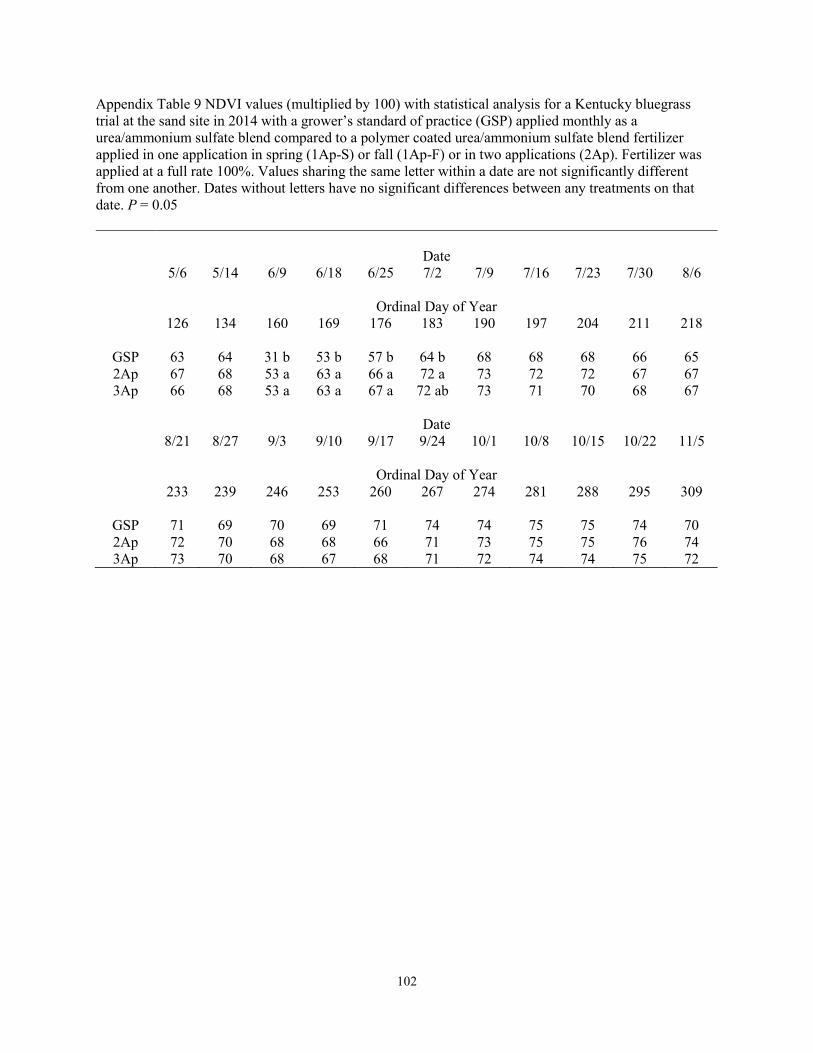
102
Appendix Table 9 NDVI values (multiplied by 100) with statistical analysis for a Kentucky bluegrass trial at the sand site in 2014 with a grower’s standard of practice (GSP) applied monthly as a urea/ammonium sulfate blend compared to a polymer coated urea/ammonium sulfate blend fertilizer applied in one application in spring (1Ap-S) or fall (1Ap-F) or in two applications (2Ap). Fertilizer was applied at a full rate 100%. Values sharing the same letter within a date are not significantly different from one another. Dates without letters have no significant differences between any treatments on that date. P = 0.05
Date 5/6 5/14 6/9 6/18 6/25 7/2 7/9 7/16 7/23 7/30 8/6
Ordinal Day of Year 126 134 160 169 176 183 190 197 204 211 218
GSP 63 64 31 b 53 b 57 b 64 b 68 68 68 66 65 2Ap 67 68 53 a 63 a 66 a 72 a 73 72 72 67 67 3Ap 66 68 53 a 63 a 67 a 72 ab 73 71 70 68 67
Date 8/21 8/27 9/3 9/10 9/17 9/24 10/1 10/8 10/15 10/22 11/5
Ordinal Day of Year 233 239 246 253 260 267 274 281 288 295 309
GSP 71 69 70 69 71 74 74 75 75 74 70 2Ap 72 70 68 68 66 71 73 75 75 76 74 3Ap 73 70 68 67 68 71 72 74 74 75 72
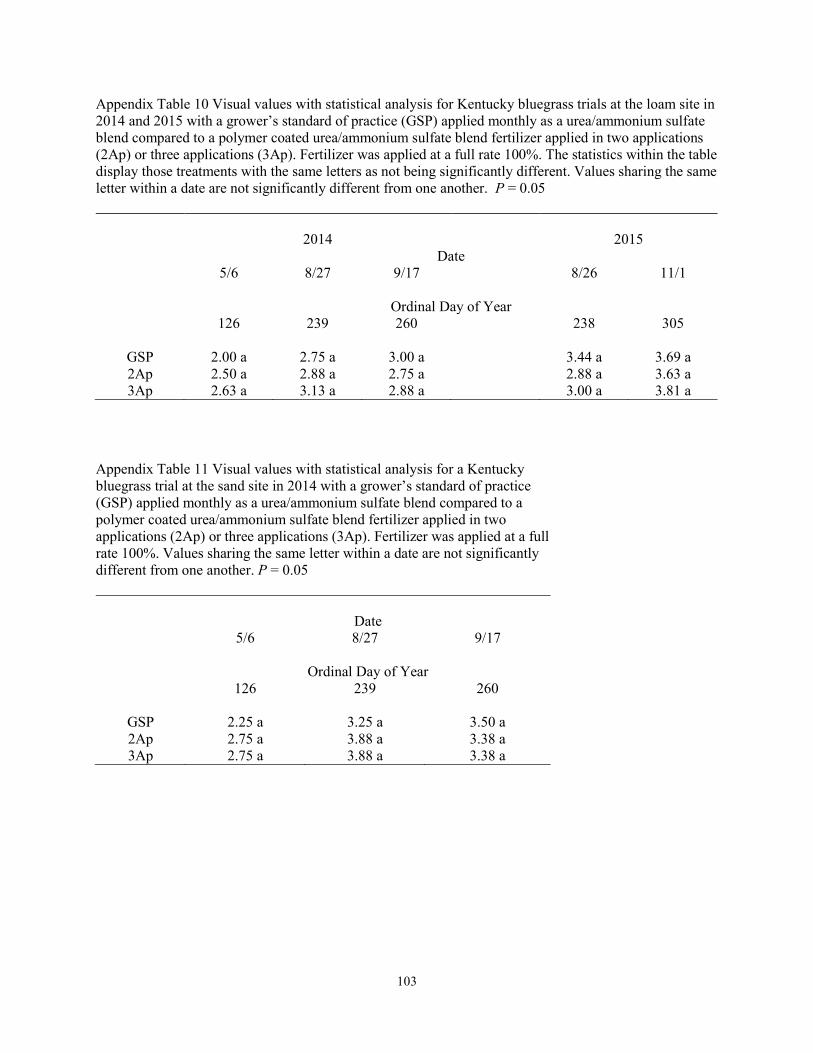
103
Appendix Table 10 Visual values with statistical analysis for Kentucky bluegrass trials at the loam site in 2014 and 2015 with a grower’s standard of practice (GSP) applied monthly as a urea/ammonium sulfate blend compared to a polymer coated urea/ammonium sulfate blend fertilizer applied in two applications (2Ap) or three applications (3Ap). Fertilizer was applied at a full rate 100%. The statistics within the table display those treatments with the same letters as not being significantly different. Values sharing the same letter within a date are not significantly different from one another. P = 0.05
2014 2015 Date
5/6 8/27 9/17 8/26 11/1
Ordinal Day of Year 126 239 260 238 305
GSP 2.00 a 2.75 a 3.00 a 3.44 a 3.69 a 2Ap 2.50 a 2.88 a 2.75 a 2.88 a 3.63 a 3Ap 2.63 a 3.13 a 2.88 a 3.00 a 3.81 a
Appendix Table 11 Visual values with statistical analysis for a Kentucky bluegrass trial at the sand site in 2014 with a grower’s standard of practice (GSP) applied monthly as a urea/ammonium sulfate blend compared to a polymer coated urea/ammonium sulfate blend fertilizer applied in two applications (2Ap) or three applications (3Ap). Fertilizer was applied at a full rate 100%. Values sharing the same letter within a date are not significantly different from one another. P = 0.05
Date 5/6 8/27 9/17
Ordinal Day of Year 126 239 260
GSP 2.25 a 3.25 a 3.50 a 2Ap 2.75 a 3.88 a 3.38 a 3Ap 2.75 a 3.88 a 3.38 a

104
Appendix Table 12 Total N values with statistical analysis for Kentucky bluegrass trials at the loam site in 2014 and 2015 on the top and the sand site in 2014 with a grower’s standard of practice (GSP) applied monthly as a urea/ammonium sulfate blend compared to polymer coated urea/ammonium sulfate blend urea fertilizer applied in two applications (2Ap) or three applications (3Ap). Fertilizer was applied at a full rate 100%. Values sharing the same letter within a date are not significantly different from one another. P = 0.05
2014 2015
Loam
Date 5/15 10/2 10/15 10/30
Ordinal Day of Year 135 275 288 303
GSP 2.24 a 3.09 a 4.44 a 3.36 a 2Ap 2.69 a 3.81 b 4.26 a 3.53 a 3Ap 2.69 a 3.60 b 4.19 a 3.45 a
Sand
Date 5/15 10/2
Ordinal Day of Year 135 275
GSP 2.39 a 3.91 b 2Ap 3.19 b 4.55 a 3Ap 3.12 b 4.21 ab
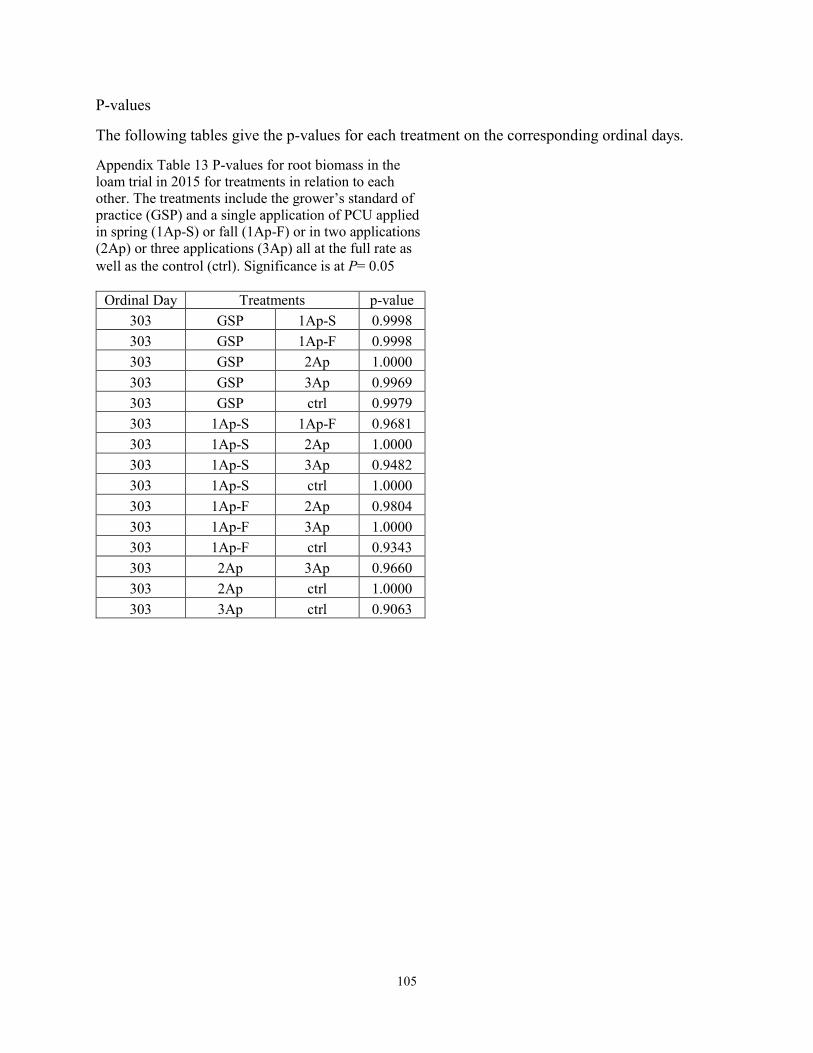
105
P-values
The following tables give the p-values for each treatment on the corresponding ordinal days.
Appendix Table 13 P-values for root biomass in the loam trial in 2015 for treatments in relation to each other. The treatments include the grower’s standard of practice (GSP) and a single application of PCU applied in spring (1Ap-S) or fall (1Ap-F) or in two applications (2Ap) or three applications (3Ap) all at the full rate as well as the control (ctrl). Significance is at P= 0.05
Ordinal Day Treatments p-value303 GSP 1Ap-S 0.9998 303 GSP 1Ap-F 0.9998 303 GSP 2Ap 1.0000 303 GSP 3Ap 0.9969 303 GSP ctrl 0.9979 303 1Ap-S 1Ap-F 0.9681 303 1Ap-S 2Ap 1.0000 303 1Ap-S 3Ap 0.9482 303 1Ap-S ctrl 1.0000 303 1Ap-F 2Ap 0.9804 303 1Ap-F 3Ap 1.0000 303 1Ap-F ctrl 0.9343 303 2Ap 3Ap 0.9660 303 2Ap ctrl 1.0000 303 3Ap ctrl 0.9063

106
Appendix Table 14 P-values for root biomass in the sand trial in 2015 for treatments in relation to each other. The treatments include the grower’s standard of practice (GSP) and a single application of PCU applied in spring (1Ap-S) or fall (1Ap-F) or in two applications (2Ap) or three applications (3Ap) all at the full rate as well as the control (ctrl). Significance is at P= 0.05
Ordinal Day Treatments p-value303 GSP 1Ap-S 1.0000 303 GSP 1Ap-F 1.0000 303 GSP 2Ap 0.8347 303 GSP 3Ap 0.9997 303 GSP ctrl 0.6806 303 1Ap-S 1Ap-F 0.9999 303 1Ap-S 2Ap 0.9181 303 1Ap-S 3Ap 1.0000 303 1Ap-S ctrl 0.7991 303 1Ap-F 2Ap 0.7374 303 1Ap-F 3Ap 0.9976 303 1Ap-F ctrl 0.5668 303 2Ap 3Ap 0.9740 303 2Ap ctrl 1.0000 303 3Ap ctrl 0.9057
Appendix Table 15 P-values height in the loam trial in 2014 for treatments in relation to each other. The treatments include the grower’s standard of practice (GSP) and a single application of PCU applied in spring (1Ap-S) or fall (1Ap-F) or in two applications (2Ap) or three applications (3Ap) all at the full rate as well as the control (ctrl). Only statistically significant p-values are shown. P = 0.05
Ordinal Day
Treatments p-value Ordinal Day Treatments p-value
135 GSP 1Ap-S <.0001 176 GSP 1Ap-S <.0001 135 GSP 3Ap <.0001 176 1Ap-S 1Ap-F <.0001 135 GSP ctrl <.0001 176 1Ap-S 3Ap 0.0005 135 1Ap-S 1Ap-F <.0001 176 1Ap-S ctrl <.0001 135 1Ap-S ctrl <.0001 218 GSP 1Ap-S 0.0027 135 1Ap-F 2Ap <.0001 218 1Ap-S 1Ap-F <.0001 135 1Ap-F 3Ap <.0001 218 1Ap-S ctrl <.0001 135 2Ap ctrl <.0001 246 1Ap-S 1Ap-F 0.0005 135 3Ap ctrl <.0001 281 GSP 1Ap-F 0.0128 162 GSP 1Ap-S <.0001 281 1Ap-S 1Ap-F 0.0128 162 1Ap-S 1Ap-F <.0001 309 GSP 1Ap-F <.0001 162 1Ap-S 2Ap 0.0005 309 1Ap-F ctrl 0.0059 162 1Ap-S ctrl <.0001
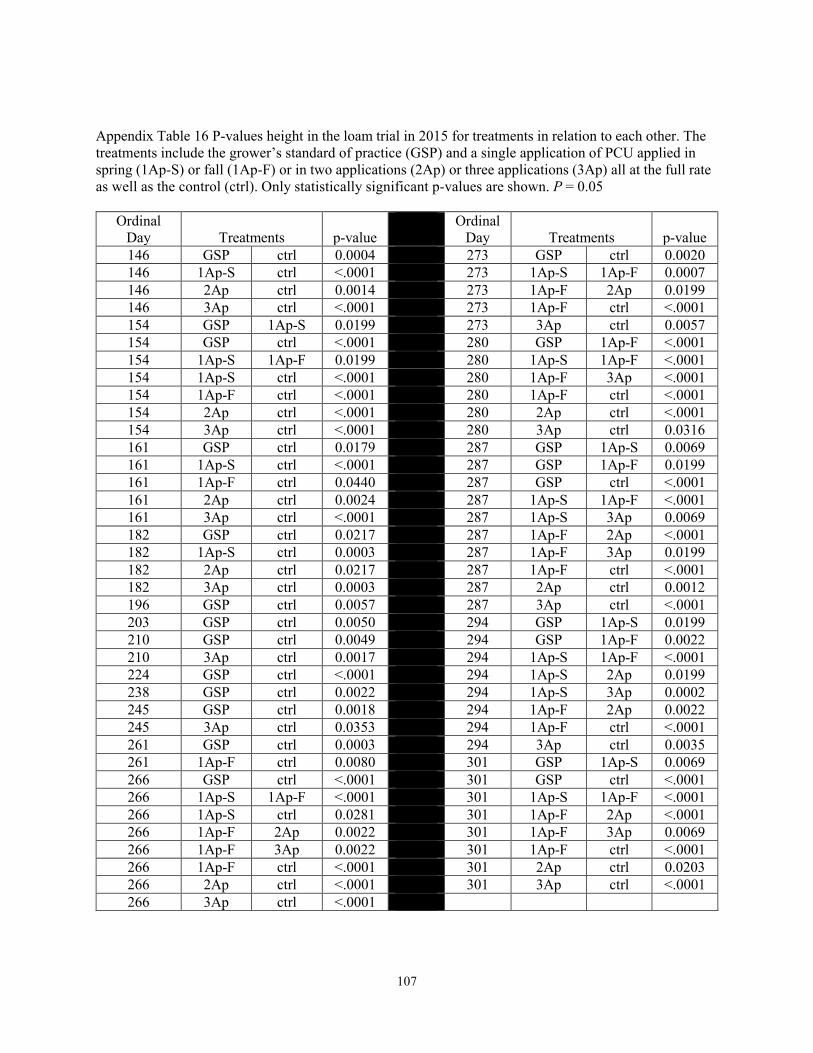
107
Appendix Table 16 P-values height in the loam trial in 2015 for treatments in relation to each other. The treatments include the grower’s standard of practice (GSP) and a single application of PCU applied in spring (1Ap-S) or fall (1Ap-F) or in two applications (2Ap) or three applications (3Ap) all at the full rate as well as the control (ctrl). Only statistically significant p-values are shown. P = 0.05
Ordinal Day Treatments p-value
Ordinal Day Treatments p-value
146 GSP ctrl 0.0004 273 GSP ctrl 0.0020 146 1Ap-S ctrl <.0001 273 1Ap-S 1Ap-F 0.0007 146 2Ap ctrl 0.0014 273 1Ap-F 2Ap 0.0199 146 3Ap ctrl <.0001 273 1Ap-F ctrl <.0001 154 GSP 1Ap-S 0.0199 273 3Ap ctrl 0.0057 154 GSP ctrl <.0001 280 GSP 1Ap-F <.0001 154 1Ap-S 1Ap-F 0.0199 280 1Ap-S 1Ap-F <.0001 154 1Ap-S ctrl <.0001 280 1Ap-F 3Ap <.0001 154 1Ap-F ctrl <.0001 280 1Ap-F ctrl <.0001 154 2Ap ctrl <.0001 280 2Ap ctrl <.0001 154 3Ap ctrl <.0001 280 3Ap ctrl 0.0316 161 GSP ctrl 0.0179 287 GSP 1Ap-S 0.0069 161 1Ap-S ctrl <.0001 287 GSP 1Ap-F 0.0199 161 1Ap-F ctrl 0.0440 287 GSP ctrl <.0001 161 2Ap ctrl 0.0024 287 1Ap-S 1Ap-F <.0001 161 3Ap ctrl <.0001 287 1Ap-S 3Ap 0.0069 182 GSP ctrl 0.0217 287 1Ap-F 2Ap <.0001 182 1Ap-S ctrl 0.0003 287 1Ap-F 3Ap 0.0199 182 2Ap ctrl 0.0217 287 1Ap-F ctrl <.0001 182 3Ap ctrl 0.0003 287 2Ap ctrl 0.0012 196 GSP ctrl 0.0057 287 3Ap ctrl <.0001 203 GSP ctrl 0.0050 294 GSP 1Ap-S 0.0199 210 GSP ctrl 0.0049 294 GSP 1Ap-F 0.0022 210 3Ap ctrl 0.0017 294 1Ap-S 1Ap-F <.0001 224 GSP ctrl <.0001 294 1Ap-S 2Ap 0.0199 238 GSP ctrl 0.0022 294 1Ap-S 3Ap 0.0002 245 GSP ctrl 0.0018 294 1Ap-F 2Ap 0.0022 245 3Ap ctrl 0.0353 294 1Ap-F ctrl <.0001 261 GSP ctrl 0.0003 294 3Ap ctrl 0.0035 261 1Ap-F ctrl 0.0080 301 GSP 1Ap-S 0.0069 266 GSP ctrl <.0001 301 GSP ctrl <.0001 266 1Ap-S 1Ap-F <.0001 301 1Ap-S 1Ap-F <.0001 266 1Ap-S ctrl 0.0281 301 1Ap-F 2Ap <.0001 266 1Ap-F 2Ap 0.0022 301 1Ap-F 3Ap 0.0069 266 1Ap-F 3Ap 0.0022 301 1Ap-F ctrl <.0001 266 1Ap-F ctrl <.0001 301 2Ap ctrl 0.0203 266 2Ap ctrl <.0001 301 3Ap ctrl <.0001 266 3Ap ctrl <.0001

108
Appendix Table 17a P-values height in the sand trial in 2014 for treatments in relation to each other. The treatments include the grower’s standard of practice (GSP) and a single application of PCU applied in spring (1Ap-S) or fall (1Ap-F) or in two applications (2Ap) or three applications (3Ap) all at the full rate as well as the control (ctrl). Only statistically significant p-values are shown. P = 0.05
Ordinal Day
Treatments p-value Ordinal Day
Treatments p-value Ordinal Day
Treatments p-value
135 GSP 1Ap-
S <.0001 176 2Ap ctrl 0.0005 246 1Ap-
S ctrl <.0001
135 GSP 3Ap 0.0005 176 3Ap ctrl 0.0005 253 GSP 1Ap-F 0.0269
135 GSP ctrl <.0001 183 GSP 1Ap-
S <.0001 253 GSP ctrl 0.0020
135 1Ap-
S 1Ap-
F <.0001 183 1Ap-
S 1Ap-
F <.0001 253 1Ap-
S 1Ap-F 0.0005
135 1Ap-
S ctrl <.0001 183 1Ap-
S 2Ap <.0001 253 1Ap-
S ctrl <.0001
135 1Ap-
F 2Ap <.0001 183 1Ap-
S 3Ap <.0001 253 1Ap-
F 2Ap 0.0269
135 1Ap-
F 3Ap <.0001 183 1Ap-
S ctrl <.0001 253 2Ap ctrl 0.0020
135 1Ap-
F ctrl 0.0075 183 1Ap-
F 2Ap 0.0001 253 3Ap ctrl 0.0269
135 2Ap ctrl <.0001 183 1Ap-
F 3Ap 0.0020 260 GSP 1Ap-F 0.0079
135 3Ap ctrl <.0001 183 2Ap ctrl 0.0001 267 GSP 1Ap-F <.0001
162 GSP 1Ap-
S <.0001 183 3Ap ctrl 0.0020 267 GSP ctrl <.0001
162 GSP 2Ap 0.0001 190 GSP 1Ap-
S <.0001 267 1Ap-
F 2Ap 0.0269
162 GSP 3Ap 0.0269 190 1Ap-
S 1Ap-
F <.0001 267 2Ap ctrl 0.0001
162 1Ap-
S 1Ap-
F <.0001 190 1Ap-
S 2Ap 0.0269 267 3Ap ctrl 0.0005
162 1Ap-
S ctrl <.0001 190 1Ap-
S 3Ap 0.0020 274 GSP ctrl <.0001
162 1Ap-
F 2Ap <.0001 190 1Ap-
S ctrl <.0001 274 1Ap-
S ctrl 0.0079
162 1Ap-
F 3Ap <.0001 197 GSP 1Ap-
S 0.0001 274 1Ap-
F ctrl <.0001
162 2Ap ctrl <.0001 197 1Ap-
S 1Ap-
F <.0001 274 2Ap ctrl <.0001
162 3Ap ctrl <.0001 197 1Ap-
S 3Ap 0.0269 274 3Ap ctrl <.0001
170 GSP 1Ap-
S <.0001 197 1Ap-
S ctrl <.0001 281 1Ap-
S 1Ap-F 0.0020

109
Appendix Table 17b P-values height in the sand trial in 2014 for treatments in relation to each other. The treatments include the grower’s standard of practice (GSP) and a single application of PCU applied in spring (1Ap-S) or fall (1Ap-F) or in two applications (2Ap) or three applications (3Ap) all at the full rate as well as the control (ctrl). Only statistically significant p-values are shown. P = 0.05
170 1Ap-
S 1Ap-
F <.0001 204 1Ap-
S 1Ap-
F 0.0269 281 1Ap-
F ctrl <.0001
170 1Ap-
S 3Ap 0.0079 204 1Ap-
S ctrl 0.0269 281 3Ap ctrl 0.0020
170 1Ap-
S ctrl <.0001 211 1Ap-
S 1Ap-
F <.0001 295 1Ap-
S 1Ap-F 0.0079
170 1Ap-
F 2Ap 0.0020 211 1Ap-
S ctrl <.0001 295 1Ap-
F ctrl <.0001
170 2Ap ctrl 0.0269 211 1Ap-
F 2Ap 0.0079 295 2Ap ctrl 0.0079
176 GSP 1Ap-
S <.0001 211 2Ap ctrl 0.0079 295 3Ap ctrl 0.0269
176 1Ap-
S 1Ap-
F <.0001 218 1Ap-
S 1Ap-
F 0.0001 309 GSP 1Ap-F 0.0269
176 1Ap-
S 2Ap 0.0020 218 1Ap-
S ctrl 0.0269 309 1Ap-
S 1Ap-F 0.0020
176 1Ap-
S 3Ap 0.0020 239 1Ap-
S 1Ap-
F <.0001 309 1Ap-
F ctrl <.0001
176 1Ap-
S ctrl <.0001 239 1Ap-
S ctrl <.0001 309 2Ap ctrl <.0001
176 1Ap-
F 2Ap 0.0020 246 GSP 1Ap-
F 0.0269 309 3Ap ctrl <.0001
176 1Ap-
F 3Ap 0.0020 246 1Ap-
S 1Ap-
F <.0001
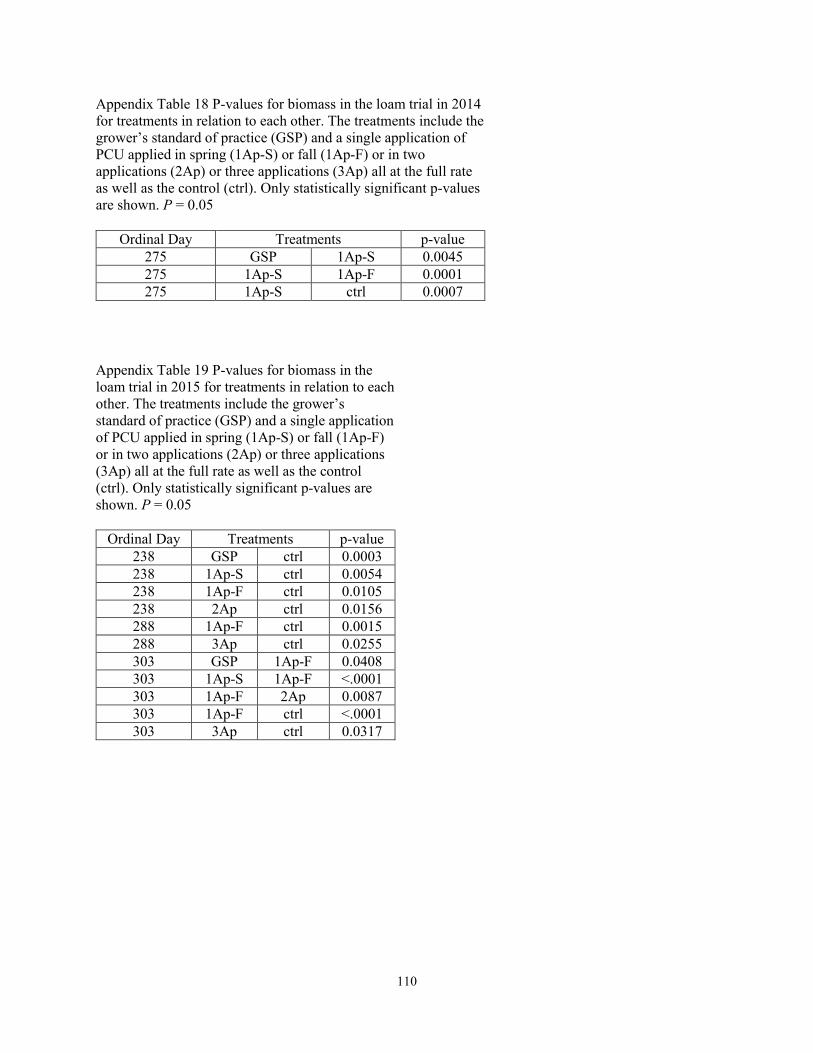
110
Appendix Table 18 P-values for biomass in the loam trial in 2014 for treatments in relation to each other. The treatments include the grower’s standard of practice (GSP) and a single application of PCU applied in spring (1Ap-S) or fall (1Ap-F) or in two applications (2Ap) or three applications (3Ap) all at the full rate as well as the control (ctrl). Only statistically significant p-values are shown. P = 0.05
Ordinal Day Treatments p-value275 GSP 1Ap-S 0.0045 275 1Ap-S 1Ap-F 0.0001 275 1Ap-S ctrl 0.0007
Appendix Table 19 P-values for biomass in the loam trial in 2015 for treatments in relation to each other. The treatments include the grower’s standard of practice (GSP) and a single application of PCU applied in spring (1Ap-S) or fall (1Ap-F) or in two applications (2Ap) or three applications (3Ap) all at the full rate as well as the control (ctrl). Only statistically significant p-values are shown. P = 0.05
Ordinal Day Treatments p-value238 GSP ctrl 0.0003 238 1Ap-S ctrl 0.0054 238 1Ap-F ctrl 0.0105 238 2Ap ctrl 0.0156 288 1Ap-F ctrl 0.0015 288 3Ap ctrl 0.0255 303 GSP 1Ap-F 0.0408 303 1Ap-S 1Ap-F <.0001 303 1Ap-F 2Ap 0.0087 303 1Ap-F ctrl <.0001 303 3Ap ctrl 0.0317
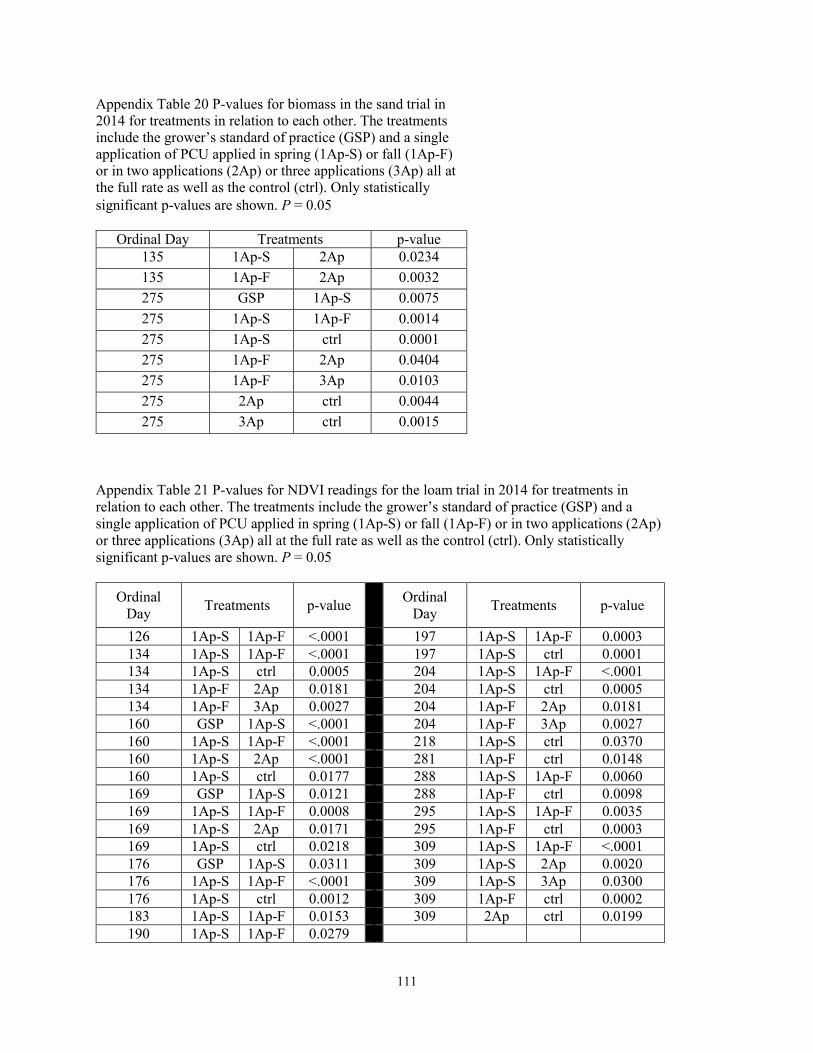
111
Appendix Table 20 P-values for biomass in the sand trial in 2014 for treatments in relation to each other. The treatments include the grower’s standard of practice (GSP) and a single application of PCU applied in spring (1Ap-S) or fall (1Ap-F) or in two applications (2Ap) or three applications (3Ap) all at the full rate as well as the control (ctrl). Only statistically significant p-values are shown. P = 0.05
Ordinal Day Treatments p-value135 1Ap-S 2Ap 0.0234 135 1Ap-F 2Ap 0.0032 275 GSP 1Ap-S 0.0075 275 1Ap-S 1Ap-F 0.0014 275 1Ap-S ctrl 0.0001 275 1Ap-F 2Ap 0.0404 275 1Ap-F 3Ap 0.0103 275 2Ap ctrl 0.0044 275 3Ap ctrl 0.0015
Appendix Table 21 P-values for NDVI readings for the loam trial in 2014 for treatments in relation to each other. The treatments include the grower’s standard of practice (GSP) and a single application of PCU applied in spring (1Ap-S) or fall (1Ap-F) or in two applications (2Ap) or three applications (3Ap) all at the full rate as well as the control (ctrl). Only statistically significant p-values are shown. P = 0.05
Ordinal Day Treatments p-value Ordinal
Day Treatments p-value
126 1Ap-S 1Ap-F <.0001 197 1Ap-S 1Ap-F 0.0003 134 1Ap-S 1Ap-F <.0001 197 1Ap-S ctrl 0.0001 134 1Ap-S ctrl 0.0005 204 1Ap-S 1Ap-F <.0001 134 1Ap-F 2Ap 0.0181 204 1Ap-S ctrl 0.0005 134 1Ap-F 3Ap 0.0027 204 1Ap-F 2Ap 0.0181 160 GSP 1Ap-S <.0001 204 1Ap-F 3Ap 0.0027 160 1Ap-S 1Ap-F <.0001 218 1Ap-S ctrl 0.0370 160 1Ap-S 2Ap <.0001 281 1Ap-F ctrl 0.0148 160 1Ap-S ctrl 0.0177 288 1Ap-S 1Ap-F 0.0060 169 GSP 1Ap-S 0.0121 288 1Ap-F ctrl 0.0098 169 1Ap-S 1Ap-F 0.0008 295 1Ap-S 1Ap-F 0.0035 169 1Ap-S 2Ap 0.0171 295 1Ap-F ctrl 0.0003 169 1Ap-S ctrl 0.0218 309 1Ap-S 1Ap-F <.0001 176 GSP 1Ap-S 0.0311 309 1Ap-S 2Ap 0.0020 176 1Ap-S 1Ap-F <.0001 309 1Ap-S 3Ap 0.0300 176 1Ap-S ctrl 0.0012 309 1Ap-F ctrl 0.0002 183 1Ap-S 1Ap-F 0.0153 309 2Ap ctrl 0.0199 190 1Ap-S 1Ap-F 0.0279

112
Appendix Table 22 P-values for NDVI readings for the loam trial in 2015 for treatments in relation to each other. The treatments include the grower’s standard of practice (GSP) and a single application of PCU applied in spring (1Ap-S) or fall (1Ap-F) or in two applications (2Ap) or three applications (3Ap) all at the full rate as well as the control (ctrl). Only statistically significant p-values are shown. P = 0.05
Ordinal Day Treatments p-value114 GSP ctrl <.0001 114 1Ap-S ctrl <.0001 114 1Ap-F ctrl <.0001 114 2Ap ctrl <.0001 114 3Ap ctrl <.0001 154 GSP ctrl 0.0079 154 1Ap-S ctrl <.0001 154 2Ap ctrl 0.0060 154 3Ap ctrl <.0001 266 1Ap-S 1Ap-F 0.0002 266 1Ap-F 2Ap 0.0295 273 1Ap-S 1Ap-F <.0001 273 1Ap-F 2Ap 0.0002 273 1Ap-F 3Ap 0.0001 280 1Ap-S 1Ap-F 0.0306

113
Appendix Table 23a P-values for NDVI readings for the sand trial in 2014 for treatments in relation to each other. The treatments include the grower’s standard of practice (GSP) and a single application of PCU applied in spring (1Ap-S) or fall (1Ap-F) or in two applications (2Ap) or three applications (3Ap) all at the full rate as well as the control (ctrl). Only statistically significant p-values are shown. P = 0.05
Ordinal Day Treatments p-
value Ordinal
Day Treatments p-value
Ordinal Day Treatments p-
value
126 1Ap-S
1Ap-F <.0001 176 1Ap-
F 2Ap <.0001 211 GSP ctrl 0.0027
126 1Ap-F 2Ap <.0001 176 1Ap-
F 3Ap <.0001 211 1Ap-S
1Ap-F <.0001
126 2Ap 3Ap 0.0002 176 2Ap ctrl <.0001 211 1Ap-S ctrl <.0001
134 GSP 1Ap-F 0.0001 176 3Ap ctrl <.0001 211 1Ap-
F 2Ap 0.0003
134 GSP ctrl 0.0024 183 GSP 1Ap-S 0.0007 211 1Ap-
F 3Ap <.0001
134 1Ap-S
1Ap-F <.0001 183 GSP 1Ap-
F <.0001 211 2Ap ctrl <.0001
134 1Ap-S ctrl <.0001 183 GSP 2Ap 0.0469 211 3Ap ctrl <.0001
134 1Ap-F 2Ap <.0001 183 GSP ctrl 0.0029 218 GSP 1Ap-
F <.0001
134 1Ap-F 3Ap <.0001 183 1Ap-
S 1Ap-
F <.0001 218 1Ap-S
1Ap-F <.0001
134 2Ap ctrl <.0001 183 1Ap-S ctrl <.0001 218 1Ap-
S ctrl 0.0004
134 3Ap ctrl <.0001 183 1Ap-F 2Ap <.0001 218 1Ap-
F 2Ap <.0001
160 GSP 1Ap-S <.0001 183 1Ap-
F 3Ap <.0001 218 1Ap-F 3Ap <.0001
160 GSP 1Ap-F 0.0098 183 2Ap ctrl <.0001 218 2Ap ctrl 0.022
160 GSP 2Ap <.0001 183 3Ap ctrl <.0001 218 3Ap ctrl 0.0241
160 GSP 3Ap <.0001 190 GSP 1Ap-F <.0001 233 1Ap-
F 3Ap 0.0356
160 1Ap-S
1Ap-F <.0001 190 GSP ctrl <.0001 239 1Ap-
S 1Ap-
F 0.0173
160 1Ap-S ctrl <.0001 190 1Ap-
S 1Ap-
F <.0001 274 GSP ctrl 0.0126
160 1Ap-F 2Ap <.0001 190 1Ap-
S ctrl <.0001 274 1Ap-F ctrl 0.0035
160 1Ap-F 3Ap <.0001 190 1Ap-
F 2Ap <.0001 281 GSP ctrl 0.0445
160 2Ap ctrl <.0001 190 1Ap-F 3Ap <.0001 281 1Ap-
F ctrl <.0001
160 3Ap ctrl <.0001 190 2Ap ctrl <.0001 281 2Ap ctrl 0.0149
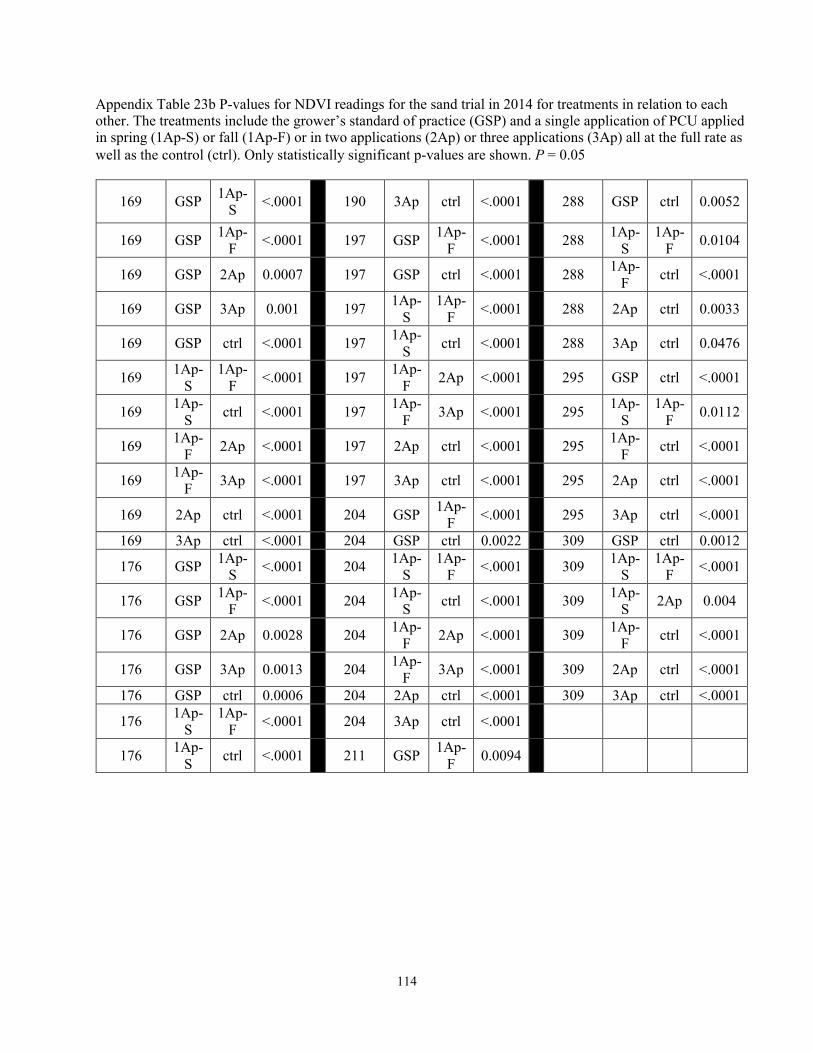
114
Appendix Table 23b P-values for NDVI readings for the sand trial in 2014 for treatments in relation to each other. The treatments include the grower’s standard of practice (GSP) and a single application of PCU applied in spring (1Ap-S) or fall (1Ap-F) or in two applications (2Ap) or three applications (3Ap) all at the full rate as well as the control (ctrl). Only statistically significant p-values are shown. P = 0.05
169 GSP 1Ap-S <.0001 190 3Ap ctrl <.0001 288 GSP ctrl 0.0052
169 GSP 1Ap-F <.0001 197 GSP 1Ap-
F <.0001 288 1Ap-S
1Ap-F 0.0104
169 GSP 2Ap 0.0007 197 GSP ctrl <.0001 288 1Ap-F ctrl <.0001
169 GSP 3Ap 0.001 197 1Ap-S
1Ap-F <.0001 288 2Ap ctrl 0.0033
169 GSP ctrl <.0001 197 1Ap-S ctrl <.0001 288 3Ap ctrl 0.0476
169 1Ap-S
1Ap-F <.0001 197 1Ap-
F 2Ap <.0001 295 GSP ctrl <.0001
169 1Ap-S ctrl <.0001 197 1Ap-
F 3Ap <.0001 295 1Ap-S
1Ap-F 0.0112
169 1Ap-F 2Ap <.0001 197 2Ap ctrl <.0001 295 1Ap-
F ctrl <.0001
169 1Ap-F 3Ap <.0001 197 3Ap ctrl <.0001 295 2Ap ctrl <.0001
169 2Ap ctrl <.0001 204 GSP 1Ap-F <.0001 295 3Ap ctrl <.0001
169 3Ap ctrl <.0001 204 GSP ctrl 0.0022 309 GSP ctrl 0.0012
176 GSP 1Ap-S <.0001 204 1Ap-
S 1Ap-
F <.0001 309 1Ap-S
1Ap-F <.0001
176 GSP 1Ap-F <.0001 204 1Ap-
S ctrl <.0001 309 1Ap-S 2Ap 0.004
176 GSP 2Ap 0.0028 204 1Ap-F 2Ap <.0001 309 1Ap-
F ctrl <.0001
176 GSP 3Ap 0.0013 204 1Ap-F 3Ap <.0001 309 2Ap ctrl <.0001
176 GSP ctrl 0.0006 204 2Ap ctrl <.0001 309 3Ap ctrl <.0001
176 1Ap-S
1Ap-F <.0001 204 3Ap ctrl <.0001
176 1Ap-S ctrl <.0001 211 GSP 1Ap-
F 0.0094

115
Appendix Table 24 P-values for visual ratings for the loam trial in 2014 for treatments in relation to each other. The treatments include the grower’s standard of practice (GSP) and a single application of PCU applied in spring (1Ap-S) or fall (1Ap-F) or in two applications (2Ap) or three applications (3Ap) all at the full rate as well as the control (ctrl). Only statistically significant p-values are shown. P = 0.05
Ordinal Day Treatments p-value126 GSP 1Ap-S <.0001 126 1Ap-S 1Ap-F <.0001 126 1Ap-S 2Ap 0.0008 126 1Ap-S 3Ap 0.0030 126 1Ap-S ctrl <.0001 126 1Ap-F 2Ap 0.0110 126 1Ap-F 3Ap 0.0030 239 1Ap-S 1Ap-F <.0001 239 1Ap-F 3Ap 0.0110
Appendix Table 25 P-values for visual ratings for the loam trial in 2015 for treatments in relation to each other. The treatments include the grower’s standard of practice (GSP) and a single application of PCU applied in spring (1Ap-S) or fall (1Ap-F) or in two applications (2Ap) or three applications (3Ap) all at the full rate as well as the control (ctrl). Only statistically significant p-values are shown. P = 0.05
Ordinal Day Treatments p-value238 GSP 1Ap-F 0.0393 303 GSP 1Ap-S 0.0393 303 GSP ctrl <.0001 303 1Ap-S 1Ap-F 0.0004 303 1Ap-S 3Ap 0.0109 303 1Ap-S ctrl 0.0090 303 1Ap-F ctrl <.0001 303 2Ap ctrl <.0001 303 3Ap ctrl <.0001

116
Appendix Table 26 P-values for visual ratings for the sand trial in 2014 for treatments in relation to each other. The treatments include the grower’s standard of practice (GSP) and a single application of PCU applied in spring (1Ap-S) or fall (1Ap-F) or in two applications (2Ap) or three applications (3Ap) all at the full rate as well as the control (ctrl). Only statistically significant p-values are shown. P = 0.05
Ordinal Day Treatments p-value
126 GSP 1Ap-F 0.012 126 GSP ctrl 0.012 126 1Ap-S 1Ap-F <.0001 126 1Ap-S ctrl <.0001 126 1Ap-F 2Ap <.0001 126 1Ap-F 3Ap <.0001 126 2Ap ctrl <.0001 126 3Ap ctrl <.0001 239 GSP 1Ap-F 0.0008 239 GSP ctrl <.0001 239 1Ap-S 1Ap-F <.0001 239 1Ap-S ctrl <.0001 239 1Ap-F 2Ap <.0001 239 1Ap-F 3Ap <.0001 239 2Ap ctrl <.0001 239 3Ap ctrl <.0001 260 GSP 1Ap-F 0.0033 260 1Ap-S 1Ap-F 0.0002 260 1Ap-F 2Ap 0.012 260 1Ap-F 3Ap 0.012

117
Appendix Table 27 P-values for nitrogen concentration for the loam trial in 2014 for treatments in relation to each other. The treatments include the grower’s standard of practice (GSP) and a single application of PCU applied in spring (1Ap-S) or fall (1Ap-F) or in two applications (2Ap) or three applications (3Ap) all at the full rate as well as the control (ctrl). Only statistically significant p-values are shown. P = 0.05
Ordinal Day Treatments p-value135 GSP 1Ap-S 0.0001 135 1Ap-S 1Ap-F <.0001 135 1Ap-S 2Ap 0.0207 135 1Ap-S 3Ap 0.0216 135 1Ap-S ctrl <.0001 135 1Ap-F 2Ap 0.0023 135 1Ap-F 3Ap 0.0022 135 2Ap ctrl 0.0039 135 3Ap ctrl 0.0037 275 GSP 1Ap-F <.0001 275 GSP 2Ap 0.0309 275 1Ap-S 1Ap-F <.0001 275 1Ap-S 2Ap 0.0073 275 1Ap-F 2Ap 0.0108 275 1Ap-F 3Ap 0.0009
Appendix Table 28 P-values for nitrogen concentration for the loam trial in 2015 for treatments in relation to each other. The treatments include the grower’s standard of practice (GSP) and a single application of PCU applied in spring (1Ap-S) or fall (1Ap-F) or in two applications (2Ap) or three applications (3Ap) all at the full rate as well as the control (ctrl). Only statistically significant p-values are shown. P = 0.05
Ordinal Day Treatments p-value238 GSP ctrl 0.0003 238 1Ap-S ctrl 0.0054 238 3Ap ctrl 0.0004 288 1Ap-S 1Ap-F 0.0397 288 1Ap-F ctrl 0.0015 288 3Ap ctrl 0.0255 303 GSP 1Ap-F 0.0408 303 1Ap-S 1Ap-F <.0001 303 1Ap-F 2Ap 0.0087 303 1Ap-F ctrl <.0001 303 3Ap ctrl 0.0317

118
Appendix Table 29 P-values for nitrogen concentration for the sand trial in 2014 for treatments in relation to each other. The treatments include the grower’s standard of practice (GSP) and a single application of PCU applied in spring (1Ap-S) or fall (1Ap-F) or in two applications (2Ap) or three applications (3Ap) all at the full rate as well as the control (ctrl). Only statistically significant p-values are shown. P = 0.05
Ordinal Day
Treatments p-value
135 GSP 1Ap-S <.0001 135 GSP 1Ap-F 0.0079 135 GSP 2Ap 0.0019 135 GSP 3Ap 0.0052 135 GSP ctrl 0.0052 135 1Ap-S 1Ap-F <.0001 135 1Ap-S 2Ap <.0001 135 1Ap-S 3Ap <.0001 135 1Ap-S ctrl <.0001 135 1Ap-F 2Ap <.0001 135 1Ap-F 3Ap <.0001 135 2Ap ctrl <.0001 135 3Ap ctrl <.0001 275 GSP 1Ap-S 0.0191 275 GSP 1Ap-F <.0001 275 GSP 2Ap 0.0191 275 1Ap-S 1Ap-F <.0001 275 1Ap-S 2Ap <.0001 275 1Ap-S 3Ap 0.0003 275 1Ap-F 2Ap 0.001 275 1Ap-F 3Ap <.0001

119
Appendix Table 30 P-values for shoot density in the loam trial in 2015 for treatments in relation to each other. The treatments include the grower’s standard of practice (GSP) and a single application of PCU applied in spring (1Ap-S) or fall (1Ap-F) or in two applications (2Ap) or three applications (3Ap) all at the full rate as well as the control (ctrl). Significance is at P= 0.05
Ordinal Day Treatments p-value303 GSP 1Ap-S 0.5986 303 GSP 1Ap-F 0.9380 303 GSP 2Ap 0.9835 303 GSP 3Ap 0.9914 303 GSP ctrl 0.0681 303 1Ap-S 1Ap-F 0.1053 303 1Ap-S 2Ap 0.1678 303 1Ap-S 3Ap 0.1980 303 1Ap-S ctrl 0.7937 303 1Ap-F 2Ap 1.0000 303 1Ap-F 3Ap 1.0000 303 1Ap-F ctrl 0.0072 303 2Ap 3Ap 1.0000 303 2Ap ctrl 0.0121 303 3Ap ctrl 0.0146
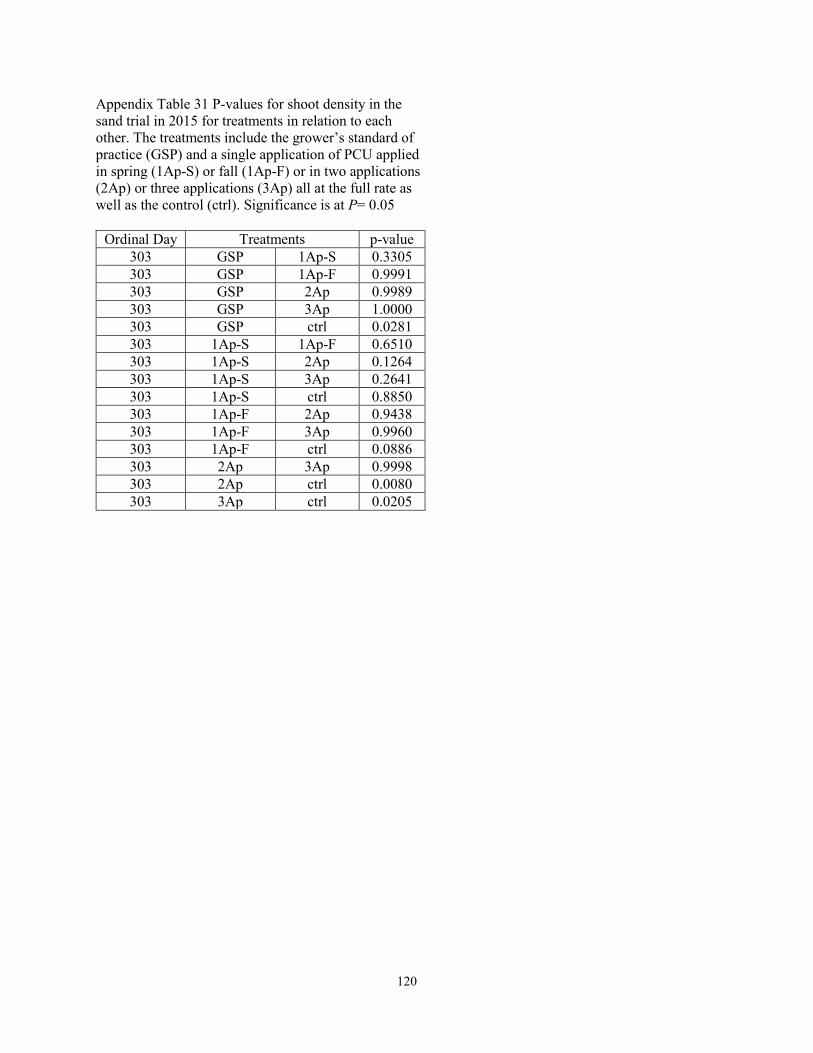
120
Appendix Table 31 P-values for shoot density in the sand trial in 2015 for treatments in relation to each other. The treatments include the grower’s standard of practice (GSP) and a single application of PCU applied in spring (1Ap-S) or fall (1Ap-F) or in two applications (2Ap) or three applications (3Ap) all at the full rate as well as the control (ctrl). Significance is at P= 0.05
Ordinal Day Treatments p-value303 GSP 1Ap-S 0.3305 303 GSP 1Ap-F 0.9991 303 GSP 2Ap 0.9989 303 GSP 3Ap 1.0000 303 GSP ctrl 0.0281 303 1Ap-S 1Ap-F 0.6510 303 1Ap-S 2Ap 0.1264 303 1Ap-S 3Ap 0.2641 303 1Ap-S ctrl 0.8850 303 1Ap-F 2Ap 0.9438 303 1Ap-F 3Ap 0.9960 303 1Ap-F ctrl 0.0886 303 2Ap 3Ap 0.9998 303 2Ap ctrl 0.0080 303 3Ap ctrl 0.0205
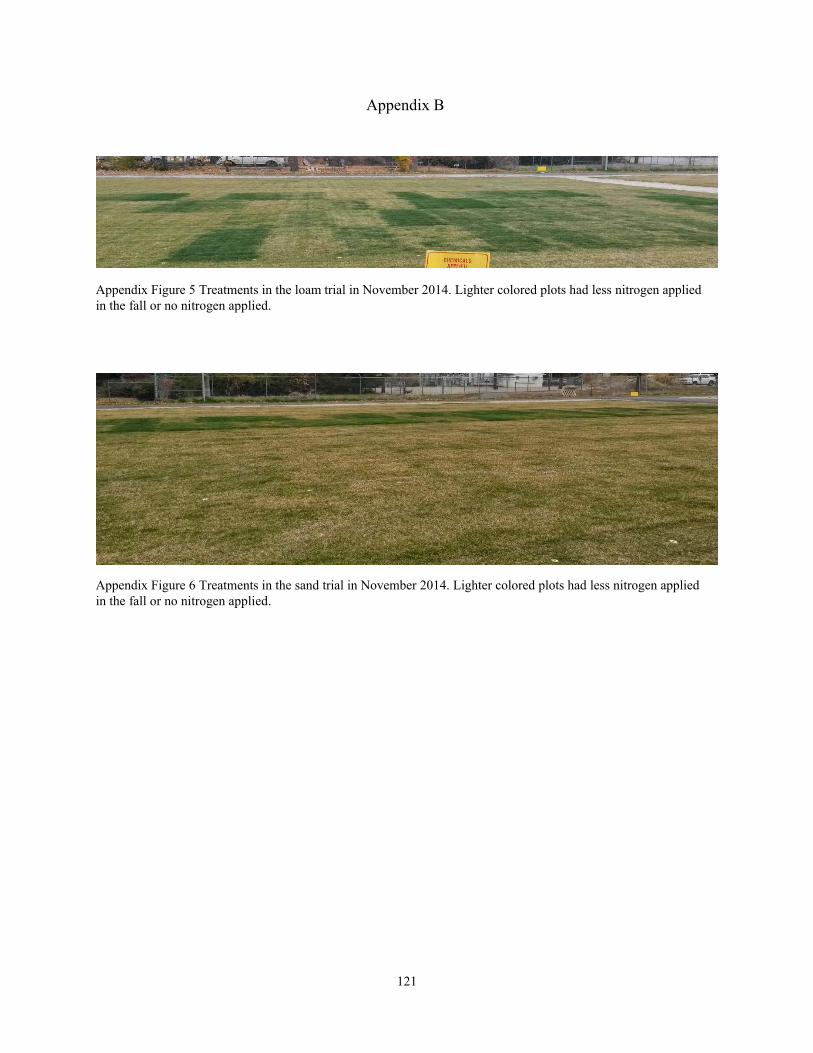
121
Appendix B
Appendix Figure 5 Treatments in the loam trial in November 2014. Lighter colored plots had less nitrogen applied in the fall or no nitrogen applied.
Appendix Figure 6 Treatments in the sand trial in November 2014. Lighter colored plots had less nitrogen applied in the fall or no nitrogen applied.
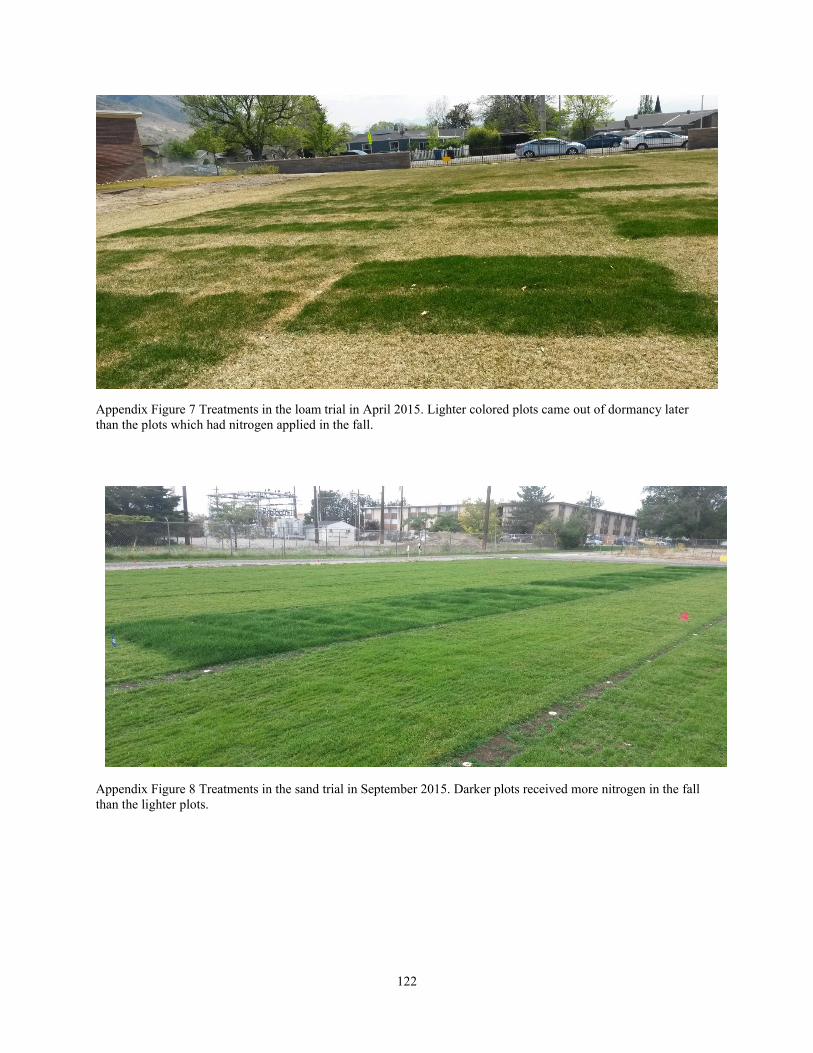
122
Appendix Figure 7 Treatments in the loam trial in April 2015. Lighter colored plots came out of dormancy later than the plots which had nitrogen applied in the fall.
Appendix Figure 8 Treatments in the sand trial in September 2015. Darker plots received more nitrogen in the fall than the lighter plots.
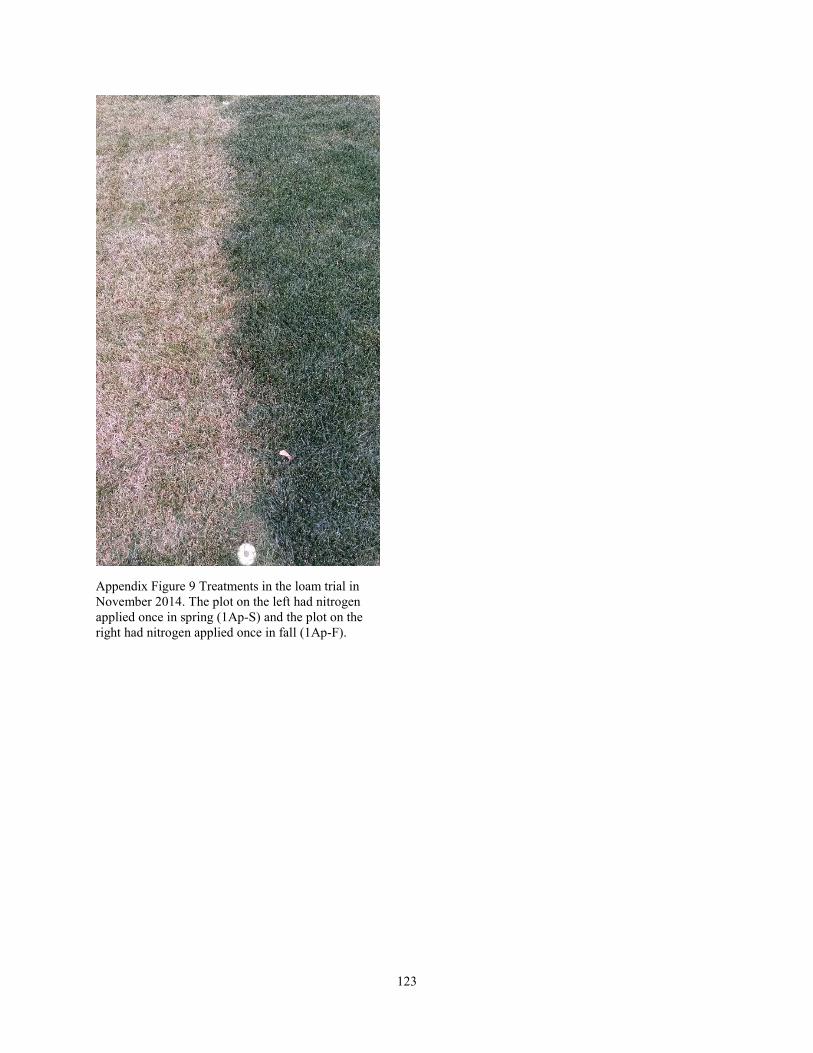
123
Appendix Figure 9 Treatments in the loam trial in November 2014. The plot on the left had nitrogen applied once in spring (1Ap-S) and the plot on the right had nitrogen applied once in fall (1Ap-F).
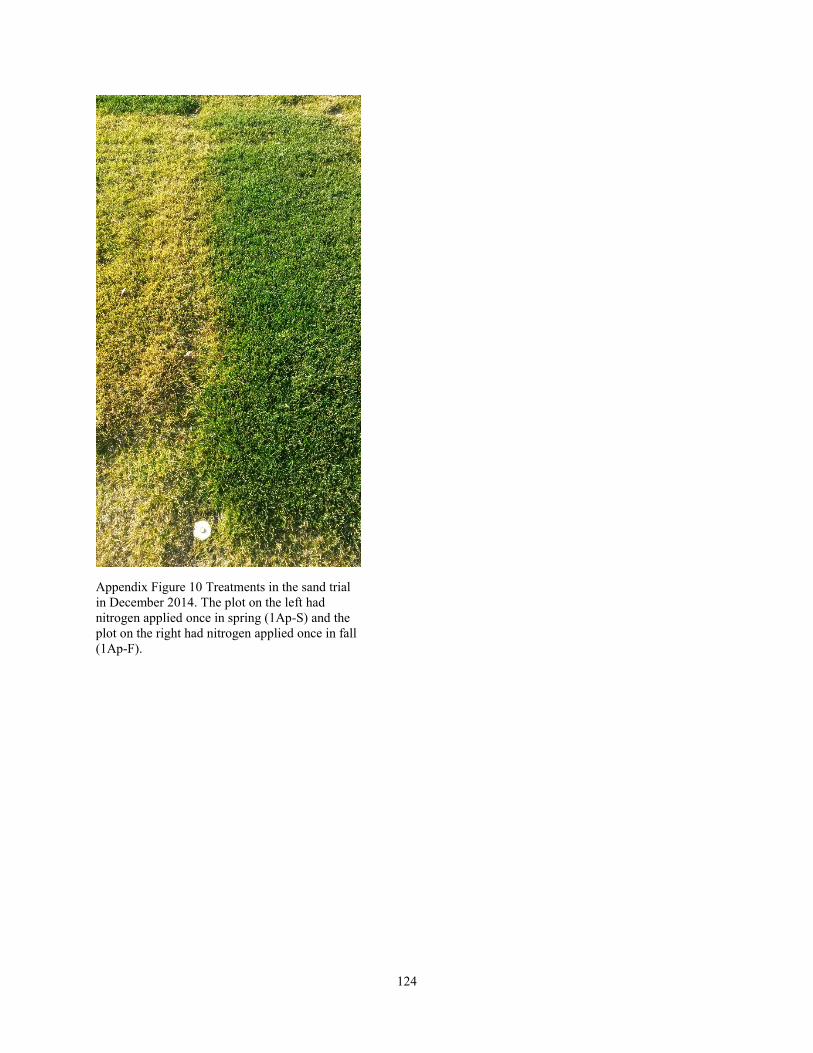
124
Appendix Figure 10 Treatments in the sand trial in December 2014. The plot on the left had nitrogen applied once in spring (1Ap-S) and the plot on the right had nitrogen applied once in fall (1Ap-F).
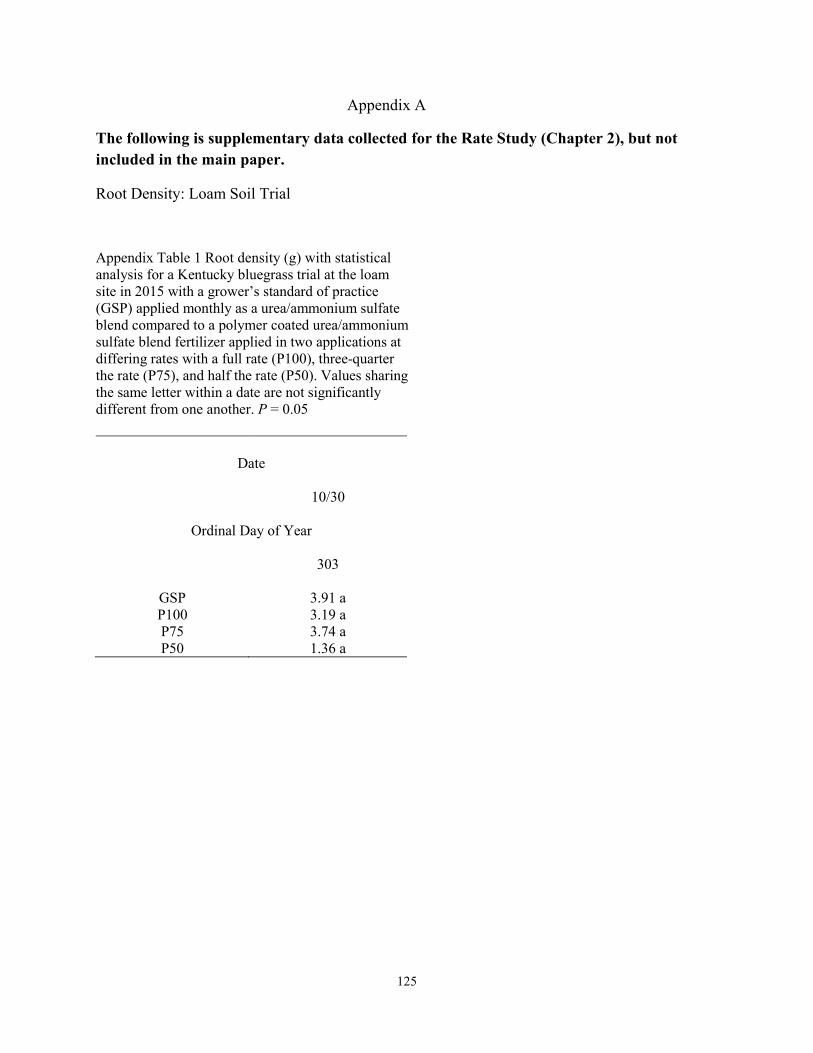
125
Appendix A
The following is supplementary data collected for the Rate Study (Chapter 2), but not included in the main paper.
Root Density: Loam Soil Trial
Appendix Table 1 Root density (g) with statistical analysis for a Kentucky bluegrass trial at the loam site in 2015 with a grower’s standard of practice (GSP) applied monthly as a urea/ammonium sulfate blend compared to a polymer coated urea/ammonium sulfate blend fertilizer applied in two applications at differing rates with a full rate (P100), three-quarter the rate (P75), and half the rate (P50). Values sharing the same letter within a date are not significantly different from one another. P = 0.05
Date
10/30
Ordinal Day of Year
303
GSP 3.91 a P100 3.19 a P75 3.74 a P50 1.36 a

126
Loam Growth
Shoot biomass was significant on the second sampling date in 2014 with the P100 being
significantly greater than P50 (Appendix Fig. 1; Table 6). All other sampling dates for the
biomass were not significant. On the same date, the height difference was not significant
although there was still a greater amount of shoot growth for the P100 over P50 (Figs. 1 and 2;
Tables 4 and 5).
Appendix Figure 1 Kentucky bluegrass biomass for 2014 and 2015 for a trial on loam soil. The grower’s standard practice (GSP) of urea/ammonium sulfate applied monthly at the 100% rate, and polymer coated urea/ammonium sulfate split applied once in spring and again in fall at the 100% (P100), 75% (P75), and 50% (P50) rate are shown. Statistical significance is shown within the figure. Data shown in Table 6.

127
Sand Growth
Shoot biomass at the first sampling date in 2014 showed no significant difference, but the heights
for the same date had a significant difference between P100 and P50 (Appendix Fig. 2; Fig. 2;
Tables 7 and 8). On the second sampling date for biomass, there was a significant difference with
P100 having significantly greater biomass than P75 and P50. On the same date, P50 had
significantly less biomass than the GSP. There was the same trend in the heights for the same
date, but the only ones with significance were the GSP and P100 having greater heights than
P50.
Appendix Figure 2 Kentucky bluegrass biomass for 2014 for a trial on sand soil. The grower’s standard practice (GSP) of urea/ammonium sulfate applied monthly at the 100% rate, and polymer coated urea/ ammonium sulfate split applied once in spring and again in fall at the 100% (P100), 75% (P75), and 50% (P50) rates are shown. Statistical significance is shown within the figure. Data shown in Table 8.
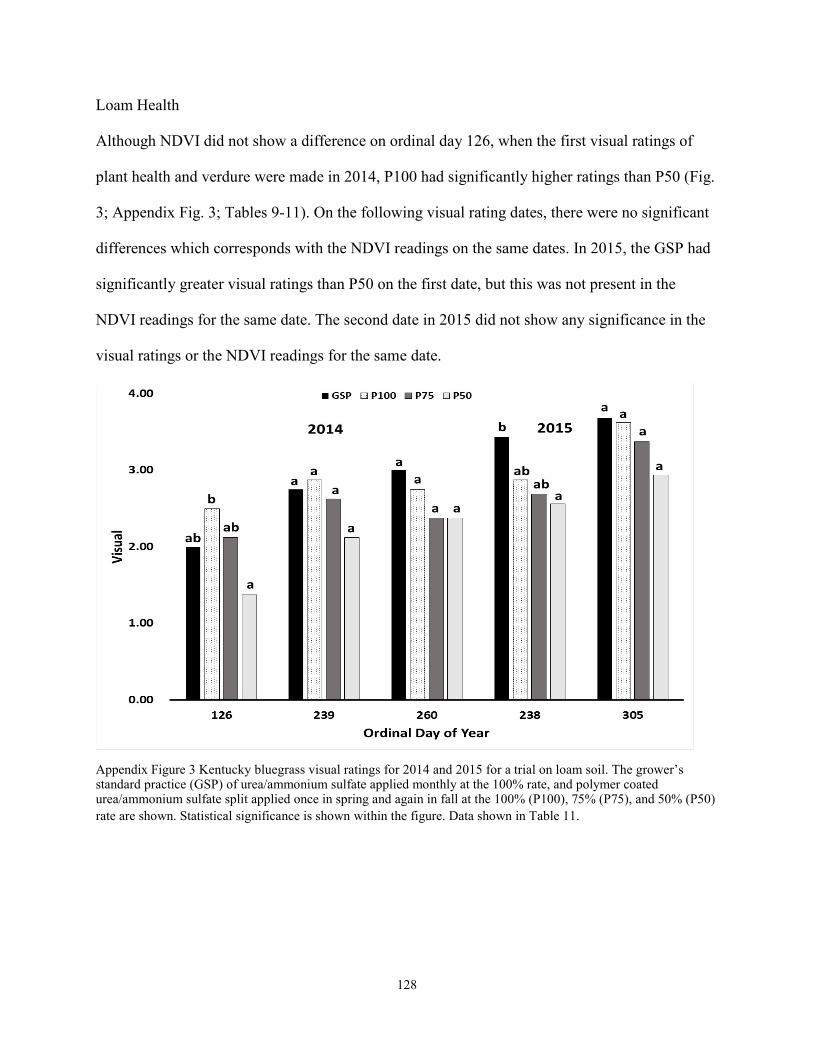
128
Loam Health
Although NDVI did not show a difference on ordinal day 126, when the first visual ratings of
plant health and verdure were made in 2014, P100 had significantly higher ratings than P50 (Fig.
3; Appendix Fig. 3; Tables 9-11). On the following visual rating dates, there were no significant
differences which corresponds with the NDVI readings on the same dates. In 2015, the GSP had
significantly greater visual ratings than P50 on the first date, but this was not present in the
NDVI readings for the same date. The second date in 2015 did not show any significance in the
visual ratings or the NDVI readings for the same date.
Appendix Figure 3 Kentucky bluegrass visual ratings for 2014 and 2015 for a trial on loam soil. The grower’s standard practice (GSP) of urea/ammonium sulfate applied monthly at the 100% rate, and polymer coated urea/ammonium sulfate split applied once in spring and again in fall at the 100% (P100), 75% (P75), and 50% (P50) rate are shown. Statistical significance is shown within the figure. Data shown in Table 11.

129
Sand Health
Visual ratings on the first dates showed a significant difference between P100 and P50 which did
not correspond with the NDVI readings for the same date (Fig. 4; Appendix Fig. 4; Tables 12
and 13). On both the second and third dates, the visual ratings showed no significant differences
between the treatments which corresponds with the NDVI readings for the same dates.
Appendix Figure 4 Kentucky bluegrass visual ratings for 2014 for a trial on sand soil. The grower’s standard practice (GSP) of urea/ammonium sulfate applied monthly at the 100% rate, and polymer coated urea/ammonium sulfate split applied once in spring and again in fall at the 100% (P100), 75% (P75), and 50% (P50) rate are shown. Statistical significance is shown within the figure. Data shown in Table 13.
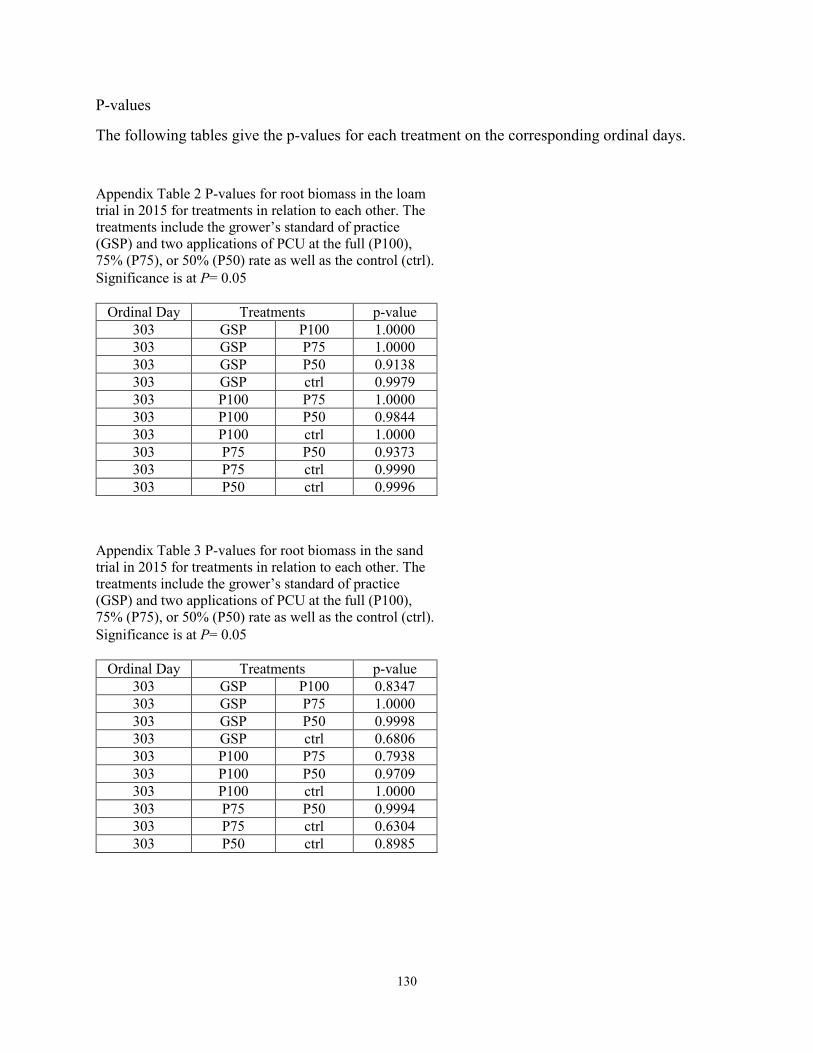
130
P-values
The following tables give the p-values for each treatment on the corresponding ordinal days.
Appendix Table 2 P-values for root biomass in the loam trial in 2015 for treatments in relation to each other. The treatments include the grower’s standard of practice (GSP) and two applications of PCU at the full (P100), 75% (P75), or 50% (P50) rate as well as the control (ctrl). Significance is at P= 0.05
Ordinal Day Treatments p-value303 GSP P100 1.0000 303 GSP P75 1.0000 303 GSP P50 0.9138 303 GSP ctrl 0.9979 303 P100 P75 1.0000 303 P100 P50 0.9844 303 P100 ctrl 1.0000 303 P75 P50 0.9373 303 P75 ctrl 0.9990 303 P50 ctrl 0.9996
Appendix Table 3 P-values for root biomass in the sand trial in 2015 for treatments in relation to each other. The treatments include the grower’s standard of practice (GSP) and two applications of PCU at the full (P100), 75% (P75), or 50% (P50) rate as well as the control (ctrl). Significance is at P= 0.05
Ordinal Day Treatments p-value303 GSP P100 0.8347 303 GSP P75 1.0000 303 GSP P50 0.9998 303 GSP ctrl 0.6806 303 P100 P75 0.7938 303 P100 P50 0.9709 303 P100 ctrl 1.0000 303 P75 P50 0.9994 303 P75 ctrl 0.6304 303 P50 ctrl 0.8985
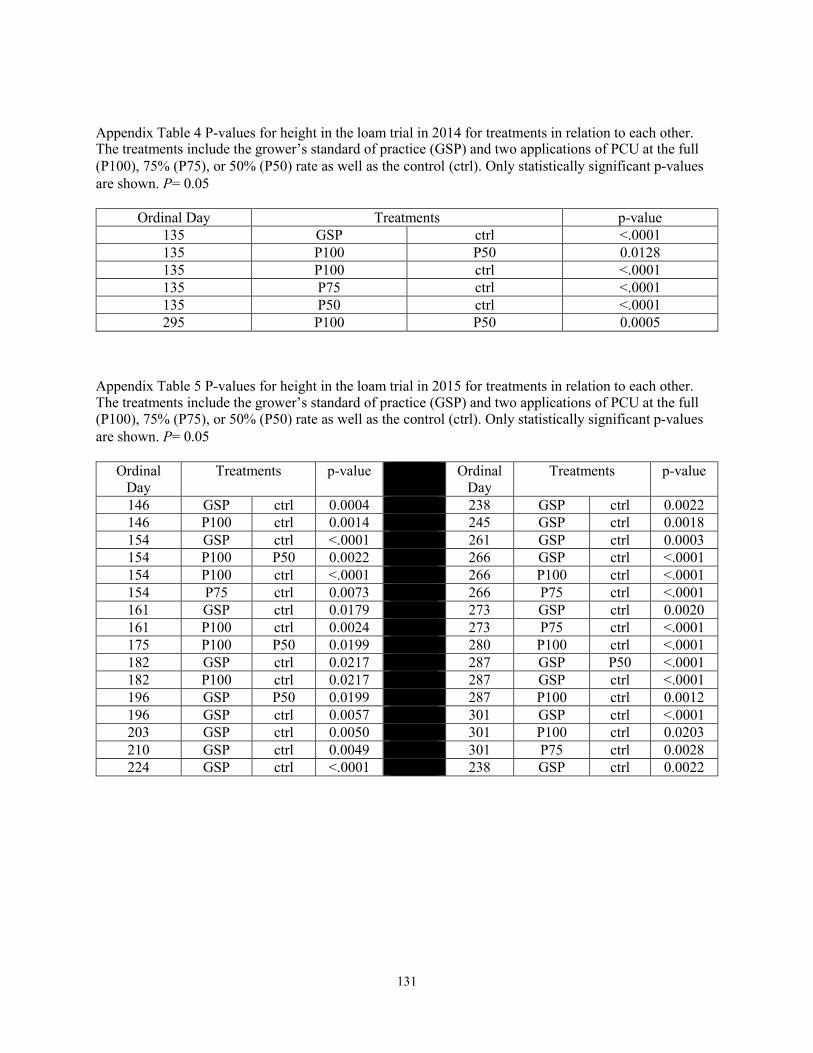
131
Appendix Table 4 P-values for height in the loam trial in 2014 for treatments in relation to each other. The treatments include the grower’s standard of practice (GSP) and two applications of PCU at the full (P100), 75% (P75), or 50% (P50) rate as well as the control (ctrl). Only statistically significant p-values are shown. P= 0.05
Ordinal Day Treatments p-value135 GSP ctrl <.0001 135 P100 P50 0.0128 135 P100 ctrl <.0001 135 P75 ctrl <.0001 135 P50 ctrl <.0001 295 P100 P50 0.0005
Appendix Table 5 P-values for height in the loam trial in 2015 for treatments in relation to each other. The treatments include the grower’s standard of practice (GSP) and two applications of PCU at the full (P100), 75% (P75), or 50% (P50) rate as well as the control (ctrl). Only statistically significant p-values are shown. P= 0.05
Ordinal Day
Treatments p-value Ordinal Day
Treatments p-value
146 GSP ctrl 0.0004 238 GSP ctrl 0.0022 146 P100 ctrl 0.0014 245 GSP ctrl 0.0018 154 GSP ctrl <.0001 261 GSP ctrl 0.0003 154 P100 P50 0.0022 266 GSP ctrl <.0001 154 P100 ctrl <.0001 266 P100 ctrl <.0001 154 P75 ctrl 0.0073 266 P75 ctrl <.0001 161 GSP ctrl 0.0179 273 GSP ctrl 0.0020 161 P100 ctrl 0.0024 273 P75 ctrl <.0001 175 P100 P50 0.0199 280 P100 ctrl <.0001 182 GSP ctrl 0.0217 287 GSP P50 <.0001 182 P100 ctrl 0.0217 287 GSP ctrl <.0001 196 GSP P50 0.0199 287 P100 ctrl 0.0012 196 GSP ctrl 0.0057 301 GSP ctrl <.0001 203 GSP ctrl 0.0050 301 P100 ctrl 0.0203 210 GSP ctrl 0.0049 301 P75 ctrl 0.0028 224 GSP ctrl <.0001 238 GSP ctrl 0.0022
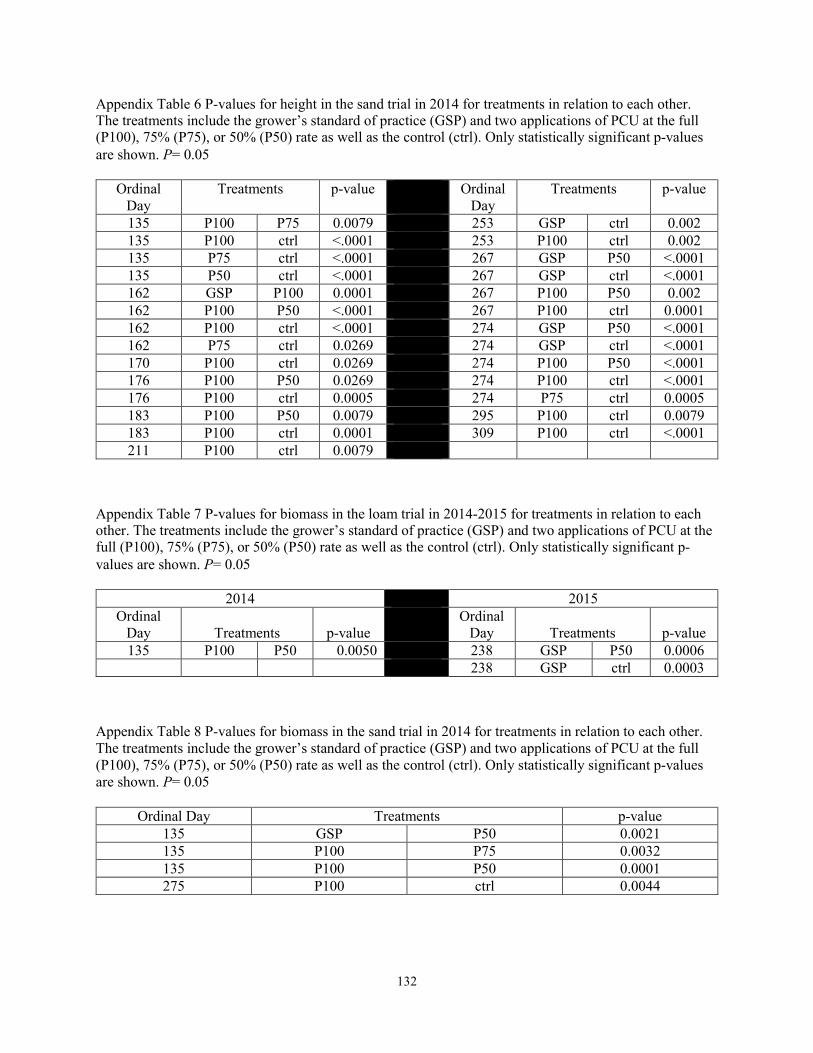
132
Appendix Table 6 P-values for height in the sand trial in 2014 for treatments in relation to each other. The treatments include the grower’s standard of practice (GSP) and two applications of PCU at the full (P100), 75% (P75), or 50% (P50) rate as well as the control (ctrl). Only statistically significant p-values are shown. P= 0.05
Ordinal Day
Treatments p-value Ordinal Day
Treatments p-value
135 P100 P75 0.0079 253 GSP ctrl 0.002 135 P100 ctrl <.0001 253 P100 ctrl 0.002 135 P75 ctrl <.0001 267 GSP P50 <.0001 135 P50 ctrl <.0001 267 GSP ctrl <.0001 162 GSP P100 0.0001 267 P100 P50 0.002 162 P100 P50 <.0001 267 P100 ctrl 0.0001 162 P100 ctrl <.0001 274 GSP P50 <.0001 162 P75 ctrl 0.0269 274 GSP ctrl <.0001 170 P100 ctrl 0.0269 274 P100 P50 <.0001 176 P100 P50 0.0269 274 P100 ctrl <.0001 176 P100 ctrl 0.0005 274 P75 ctrl 0.0005 183 P100 P50 0.0079 295 P100 ctrl 0.0079 183 P100 ctrl 0.0001 309 P100 ctrl <.0001 211 P100 ctrl 0.0079
Appendix Table 7 P-values for biomass in the loam trial in 2014-2015 for treatments in relation to each other. The treatments include the grower’s standard of practice (GSP) and two applications of PCU at the full (P100), 75% (P75), or 50% (P50) rate as well as the control (ctrl). Only statistically significant p-values are shown. P= 0.05
2014 2015 Ordinal
Day Treatments p-valueOrdinal
Day Treatments p-value135 P100 P50 0.0050 238 GSP P50 0.0006
238 GSP ctrl 0.0003
Appendix Table 8 P-values for biomass in the sand trial in 2014 for treatments in relation to each other. The treatments include the grower’s standard of practice (GSP) and two applications of PCU at the full (P100), 75% (P75), or 50% (P50) rate as well as the control (ctrl). Only statistically significant p-values are shown. P= 0.05
Ordinal Day Treatments p-value135 GSP P50 0.0021 135 P100 P75 0.0032 135 P100 P50 0.0001 275 P100 ctrl 0.0044

133
Appendix Table 9 P-values for NDVI readings in the loam trial in 2014 for treatments in relation to each other. The treatments include the grower’s standard of practice (GSP) and two applications of PCU at the full (P100), 75% (P75), or 50% (P50) rate as well as the control (ctrl). Only statistically significant p-values are shown. P= 0.05
Ordinal Day Treatments p-value309 P100 ctrl 0.0199
Appendix Table 10 P-values for NDVI readings in the loam trial in 2015 for treatments in relation to each other. The treatments include the grower’s standard of practice (GSP) and two applications of PCU at the full (P100), 75% (P75), or 50% (P50) rate as well as the control (ctrl). Only statistically significant p-values are shown. P= 0.05
Ordinal Day Treatments p-value114 GSP ctrl <.0001 114 P100 P50 0.0008 114 P100 ctrl <.0001 114 P75 ctrl 0.0002 154 GSP ctrl 0.0079 154 P100 ctrl 0.0060
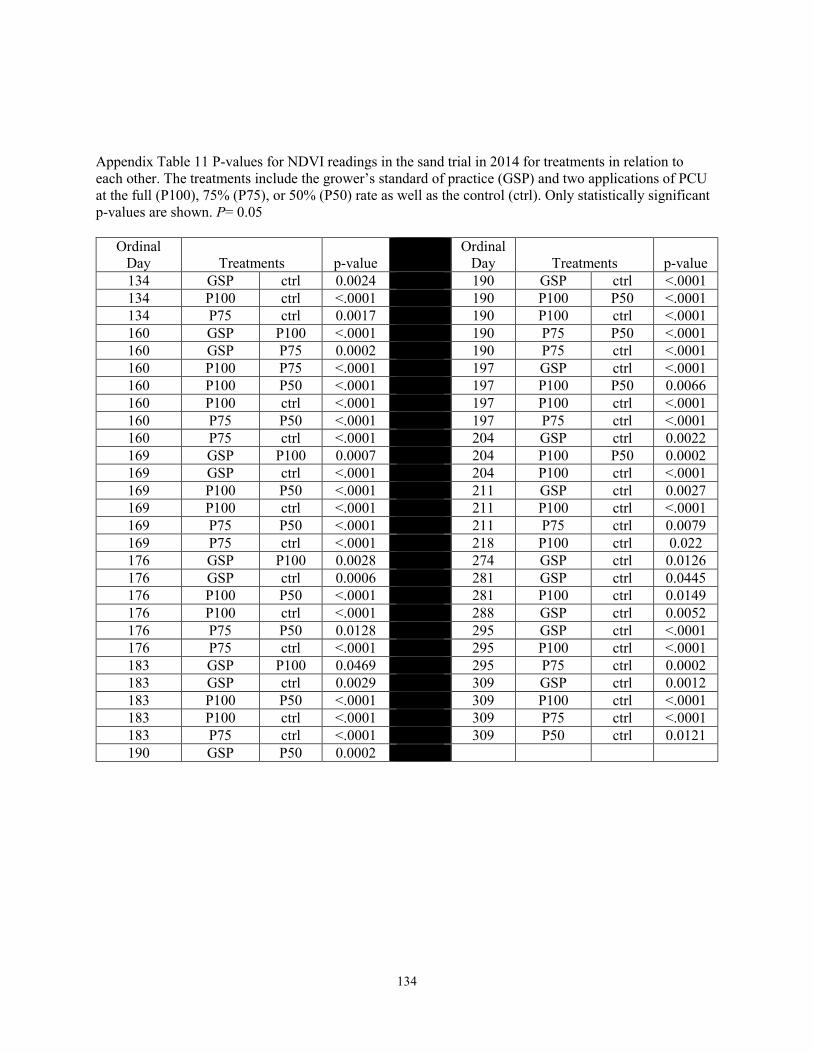
134
Appendix Table 11 P-values for NDVI readings in the sand trial in 2014 for treatments in relation to each other. The treatments include the grower’s standard of practice (GSP) and two applications of PCU at the full (P100), 75% (P75), or 50% (P50) rate as well as the control (ctrl). Only statistically significant p-values are shown. P= 0.05
Ordinal Day Treatments p-value
Ordinal Day Treatments p-value
134 GSP ctrl 0.0024 190 GSP ctrl <.0001 134 P100 ctrl <.0001 190 P100 P50 <.0001 134 P75 ctrl 0.0017 190 P100 ctrl <.0001 160 GSP P100 <.0001 190 P75 P50 <.0001 160 GSP P75 0.0002 190 P75 ctrl <.0001 160 P100 P75 <.0001 197 GSP ctrl <.0001 160 P100 P50 <.0001 197 P100 P50 0.0066 160 P100 ctrl <.0001 197 P100 ctrl <.0001 160 P75 P50 <.0001 197 P75 ctrl <.0001 160 P75 ctrl <.0001 204 GSP ctrl 0.0022 169 GSP P100 0.0007 204 P100 P50 0.0002 169 GSP ctrl <.0001 204 P100 ctrl <.0001 169 P100 P50 <.0001 211 GSP ctrl 0.0027 169 P100 ctrl <.0001 211 P100 ctrl <.0001 169 P75 P50 <.0001 211 P75 ctrl 0.0079 169 P75 ctrl <.0001 218 P100 ctrl 0.022 176 GSP P100 0.0028 274 GSP ctrl 0.0126 176 GSP ctrl 0.0006 281 GSP ctrl 0.0445 176 P100 P50 <.0001 281 P100 ctrl 0.0149 176 P100 ctrl <.0001 288 GSP ctrl 0.0052 176 P75 P50 0.0128 295 GSP ctrl <.0001 176 P75 ctrl <.0001 295 P100 ctrl <.0001 183 GSP P100 0.0469 295 P75 ctrl 0.0002 183 GSP ctrl 0.0029 309 GSP ctrl 0.0012 183 P100 P50 <.0001 309 P100 ctrl <.0001 183 P100 ctrl <.0001 309 P75 ctrl <.0001 183 P75 ctrl <.0001 309 P50 ctrl 0.0121 190 GSP P50 0.0002
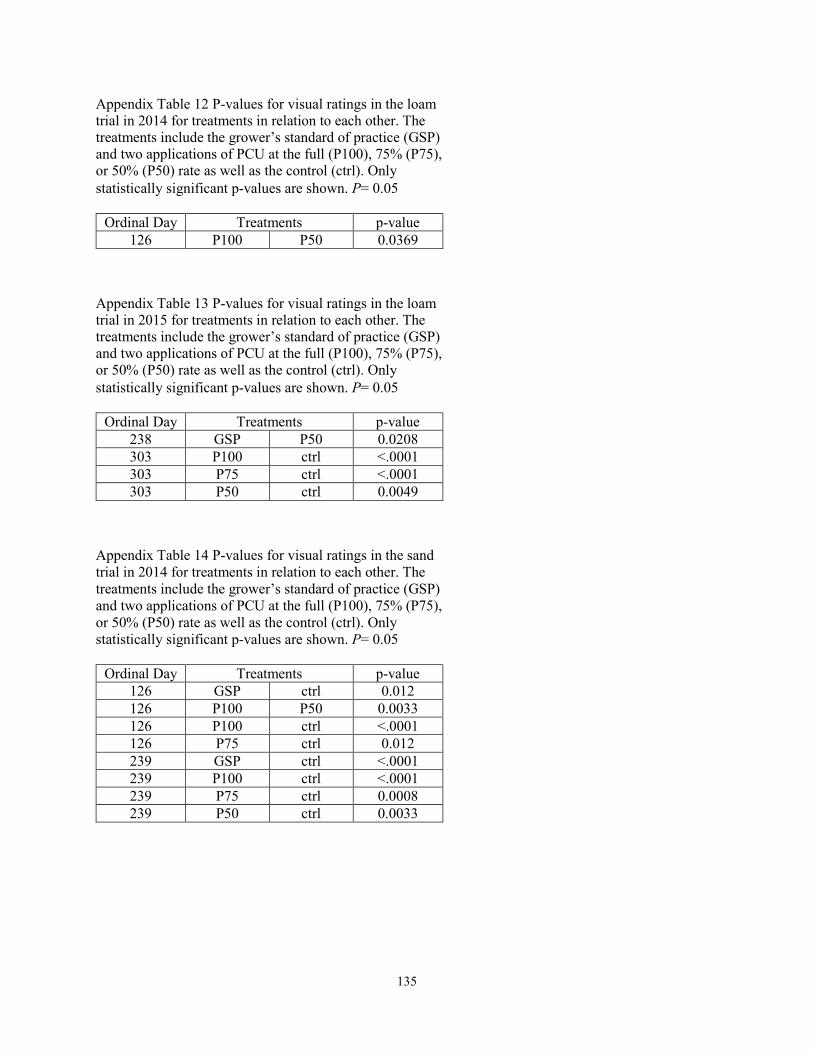
135
Appendix Table 12 P-values for visual ratings in the loam trial in 2014 for treatments in relation to each other. The treatments include the grower’s standard of practice (GSP) and two applications of PCU at the full (P100), 75% (P75), or 50% (P50) rate as well as the control (ctrl). Only statistically significant p-values are shown. P= 0.05
Ordinal Day Treatments p-value126 P100 P50 0.0369
Appendix Table 13 P-values for visual ratings in the loam trial in 2015 for treatments in relation to each other. The treatments include the grower’s standard of practice (GSP) and two applications of PCU at the full (P100), 75% (P75), or 50% (P50) rate as well as the control (ctrl). Only statistically significant p-values are shown. P= 0.05
Ordinal Day Treatments p-value238 GSP P50 0.0208 303 P100 ctrl <.0001 303 P75 ctrl <.0001 303 P50 ctrl 0.0049
Appendix Table 14 P-values for visual ratings in the sand trial in 2014 for treatments in relation to each other. The treatments include the grower’s standard of practice (GSP) and two applications of PCU at the full (P100), 75% (P75), or 50% (P50) rate as well as the control (ctrl). Only statistically significant p-values are shown. P= 0.05
Ordinal Day Treatments p-value126 GSP ctrl 0.012 126 P100 P50 0.0033 126 P100 ctrl <.0001 126 P75 ctrl 0.012 239 GSP ctrl <.0001 239 P100 ctrl <.0001 239 P75 ctrl 0.0008 239 P50 ctrl 0.0033
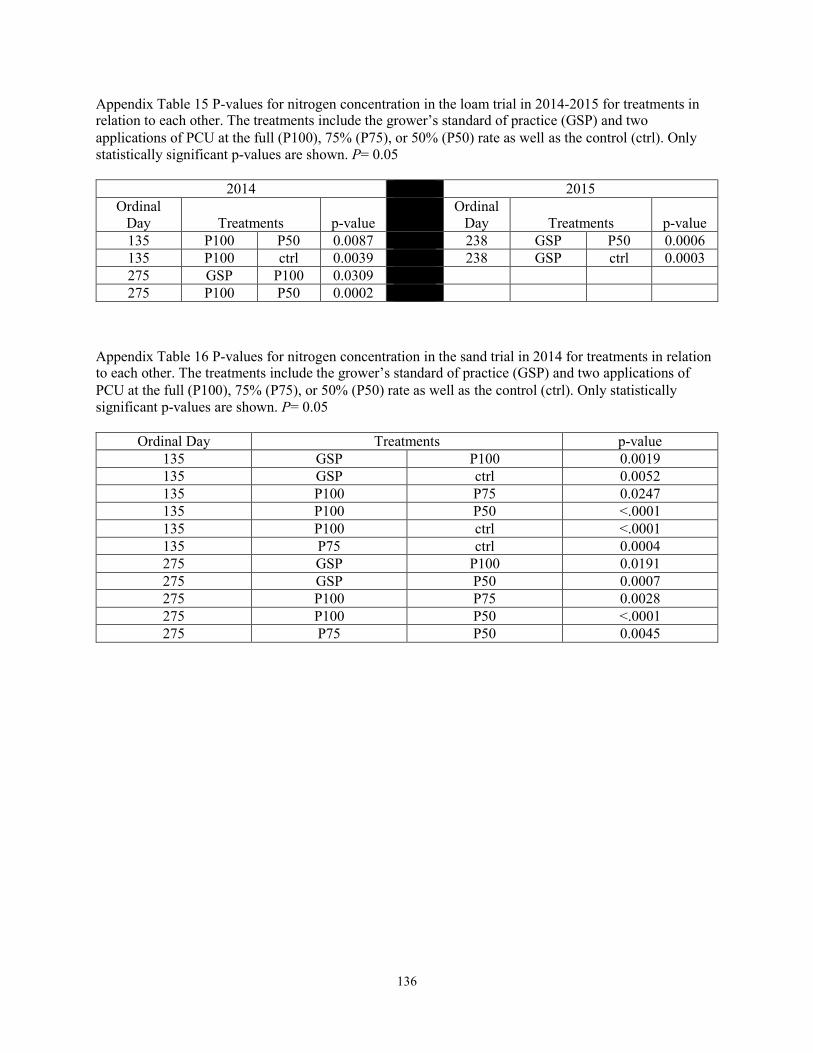
136
Appendix Table 15 P-values for nitrogen concentration in the loam trial in 2014-2015 for treatments in relation to each other. The treatments include the grower’s standard of practice (GSP) and two applications of PCU at the full (P100), 75% (P75), or 50% (P50) rate as well as the control (ctrl). Only statistically significant p-values are shown. P= 0.05
2014 2015 Ordinal
Day Treatments p-valueOrdinal
Day Treatments p-value135 P100 P50 0.0087 238 GSP P50 0.0006 135 P100 ctrl 0.0039 238 GSP ctrl 0.0003 275 GSP P100 0.0309 275 P100 P50 0.0002
Appendix Table 16 P-values for nitrogen concentration in the sand trial in 2014 for treatments in relation to each other. The treatments include the grower’s standard of practice (GSP) and two applications of PCU at the full (P100), 75% (P75), or 50% (P50) rate as well as the control (ctrl). Only statistically significant p-values are shown. P= 0.05
Ordinal Day Treatments p-value135 GSP P100 0.0019 135 GSP ctrl 0.0052 135 P100 P75 0.0247 135 P100 P50 <.0001 135 P100 ctrl <.0001 135 P75 ctrl 0.0004 275 GSP P100 0.0191 275 GSP P50 0.0007 275 P100 P75 0.0028 275 P100 P50 <.0001 275 P75 P50 0.0045

137
Appendix Table 17 P-values for crown density in the loam trial in 2015 for treatments in relation to each other. The treatments include the grower’s standard of practice (GSP) and two applications of PCU at the full (P100), 75% (P75), or 50% (P50) rate as well as the control (ctrl). Only statistically significant p-values are shown. P= 0.05
Ordinal Day Treatments p-value303 GSP P100 0.9835 303 GSP P75 0.9659 303 GSP P50 0.9892 303 GSP ctrl 0.0681 303 P100 P75 1.0000 303 P100 P50 1.0000 303 P100 ctrl 0.0121 303 P75 P50 1.0000 303 P75 ctrl 0.0093 303 P50 ctrl 0.0137
Appendix Table 18 P-values for crown density in the sand trial in 2015 for treatments in relation to each other. The treatments include the grower’s standard of practice (GSP) and two applications of PCU at the full (P100), 75% (P75), or 50% (P50) rate as well as the control (ctrl). Only statistically significant p-values are shown. P= 0.05
Ordinal Day Treatments p-value303 GSP P100 0.9989 303 GSP P75 0.9781 303 GSP P50 0.9470 303 GSP ctrl 0.0281 303 P100 P75 0.7946 303 P100 P50 0.6986 303 P100 ctrl 0.0080 303 P75 P50 1.0000 303 P75 ctrl 0.1811 303 P50 ctrl 0.2424
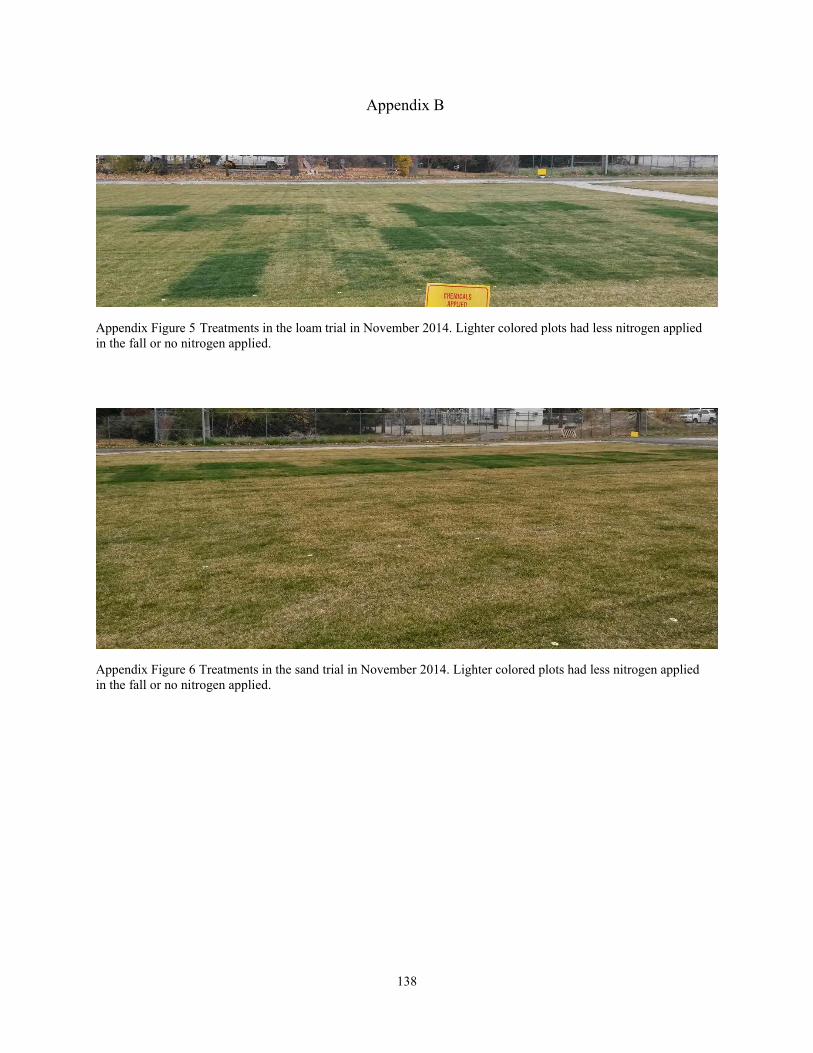
138
Appendix B
Appendix Figure 5 Treatments in the loam trial in November 2014. Lighter colored plots had less nitrogen applied in the fall or no nitrogen applied.
Appendix Figure 6 Treatments in the sand trial in November 2014. Lighter colored plots had less nitrogen applied in the fall or no nitrogen applied.

139
Appendix Figure 7 Treatments in the loam trial in April 2015. Lighter colored plots came out of dormancy later than the plots which had nitrogen applied in the fall.
Appendix Figure 8 Treatments in the sand trial in September 2015. Darker plots received more nitrogen in the fall than the lighter plots.