Embed Size (px)
Citation preview
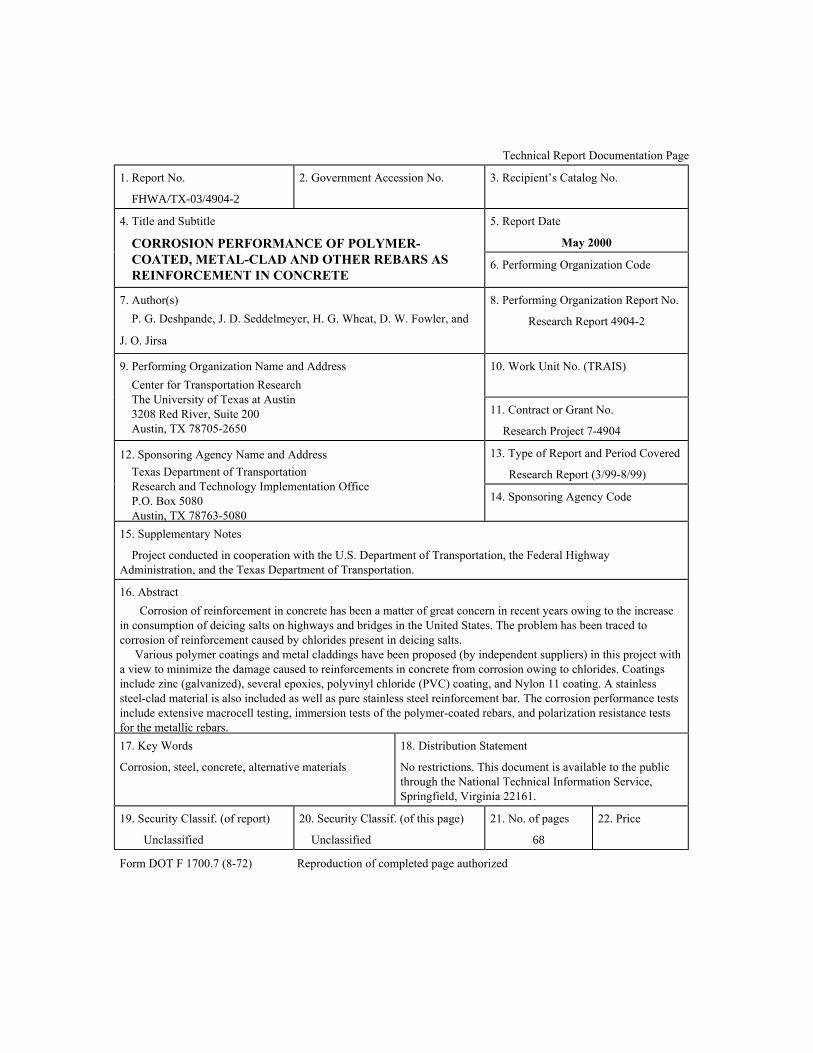
Technical Report Documentation Page
1. Report No.
FHWA/TX-03/4904-2
2. Government Accession No. 3. Recipient’s Catalog No.
5. Report Date
May 2000
4. Title and Subtitle
CORROSION PERFORMANCE OF POLYMER-COATED, METAL-CLAD AND OTHER REBARS AS REINFORCEMENT IN CONCRETE
6. Performing Organization Code
7. Author(s) P. G. Deshpande, J. D. Seddelmeyer, H. G. Wheat, D. W. Fowler, and
J. O. Jirsa
8. Performing Organization Report No.
Research Report 4904-2
10. Work Unit No. (TRAIS)
9. Performing Organization Name and Address Center for Transportation Research The University of Texas at Austin 3208 Red River, Suite 200 Austin, TX 78705-2650
11. Contract or Grant No.
Research Project 7-4904
13. Type of Report and Period Covered
Research Report (3/99-8/99)
12. Sponsoring Agency Name and Address Texas Department of Transportation Research and Technology Implementation Office P.O. Box 5080 Austin, TX 78763-5080
14. Sponsoring Agency Code
15. Supplementary Notes
Project conducted in cooperation with the U.S. Department of Transportation, the Federal Highway Administration, and the Texas Department of Transportation.
16. Abstract Corrosion of reinforcement in concrete has been a matter of great concern in recent years owing to the increase in consumption of deicing salts on highways and bridges in the United States. The problem has been traced to corrosion of reinforcement caused by chlorides present in deicing salts. Various polymer coatings and metal claddings have been proposed (by independent suppliers) in this project with a view to minimize the damage caused to reinforcements in concrete from corrosion owing to chlorides. Coatings include zinc (galvanized), several epoxies, polyvinyl chloride (PVC) coating, and Nylon 11 coating. A stainless steel-clad material is also included as well as pure stainless steel reinforcement bar. The corrosion performance tests include extensive macrocell testing, immersion tests of the polymer-coated rebars, and polarization resistance tests for the metallic rebars. 17. Key Words
Corrosion, steel, concrete, alternative materials
18. Distribution Statement
No restrictions. This document is available to the public through the National Technical Information Service, Springfield, Virginia 22161.
19. Security Classif. (of report)
Unclassified
20. Security Classif. (of this page)
Unclassified
21. No. of pages
68
22. Price
Form DOT F 1700.7 (8-72) Reproduction of completed page authorized

CORROSION PERFORMANCE OF POLYMER-COATED,
METAL-CLAD AND OTHER REBARS AS
REINFORCEMENTS IN CONCRETE by
P. G. Deshpande
J. D. Seddelmeyer
H. G. Wheat
D. W. Fowler
J. O. Jirsa
Research Report 4904-2
Research Project 7-4904 “Feasibility of Hot Dipped (Zinc) Galvanizing and Other Coatings for the Protection of
Reinforcing Steel”
Conducted for the Texas Department of Transportation
in cooperation with U.S. Department of Transportation Federal Highway Administration
by the Center for Transportation Research
Bureau of Engineering Research The University of Texas at Austin
May 2000

DISCLAIMERS The contents of this report reflect the views of the authors, who are responsible for the facts and the accuracy of the data presented herein. The contents do not necessarily reflect the official views or policies of the Federal Highway Administration or the Texas Department of Transportation (TxDOT). This report does not constitute a standard, specification, or regulation. There was no invention or discovery conceived or first actually reduced to practice in the course of or under this contract, including any art, method, process, machine, manufacture, design or composition of matter, or any new and useful improvement thereof, or any variety of plant, which is or may be patentable under the patent laws of the United States of America or any foreign country. NOT INTENDED FOR CONSTRUCTION, BIDDING, OR PERMIT PURPOSES
Harovel Wheat, P.E (Texas No. 78364) James O. Jirsa, P.E (Texas No. 31360) David Fowler, P.E (Texas No. 27859)
Research Supervisors
ACKNOWLEDGMENTS
The researchers are grateful for the support of TxDOT and the efforts of Robert Sarcinella and Lloyd Wolf.
Prepared in cooperation with the Texas Department of Transportation and the U.S. Department
of Transportation, Federal Highway Administration.

vii
TABLE OF CONTENTS
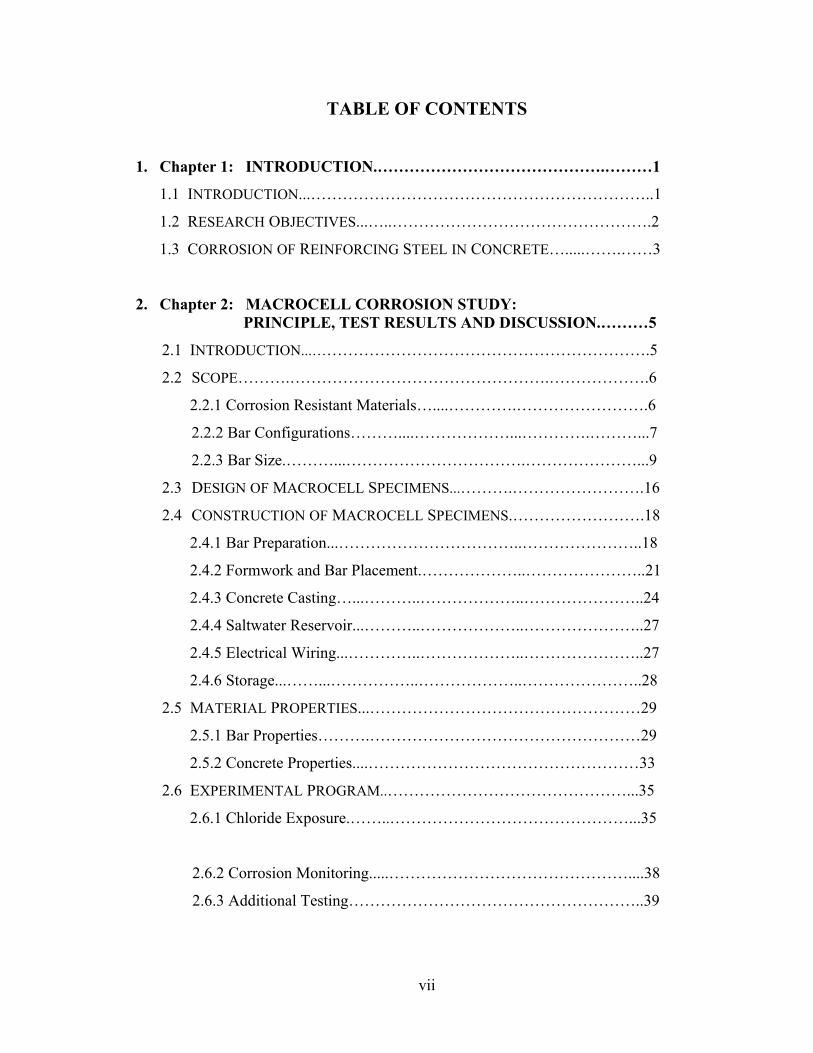
1. Chapter 1: INTRODUCTION.…………………………………….………1
1.1 INTRODUCTION...………………………………………………………..1
1.2 RESEARCH OBJECTIVES...…..………………………………………….2
1.3 CORROSION OF REINFORCING STEEL IN CONCRETE….....…….……3
2. Chapter 2: MACROCELL CORROSION STUDY: PRINCIPLE, TEST RESULTS AND DISCUSSION.………5
2.1 INTRODUCTION...……………………………………………………….5
2.2 SCOPE……….………………………………………….……………….6
2.2.1 Corrosion Resistant Materials…....………….…………………….6
2.2.2 Bar Configurations………....………………...………….………...7
2.2.3 Bar Size.………...…………………………….…………………...9
2.3 DESIGN OF MACROCELL SPECIMENS...……….…………………….16
2.4 CONSTRUCTION OF MACROCELL SPECIMENS.…………………….18
2.4.1 Bar Preparation...……………………………..…………………..18
2.4.2 Formwork and Bar Placement.………………..…………………..21
2.4.3 Concrete Casting…...………..………………..…………………..24
2.4.4 Saltwater Reservoir...………..………………..…………………..27
2.4.5 Electrical Wiring...…………..………………..…………………..27
2.4.6 Storage...……...……………..………………..…………………..28
2.5 MATERIAL PROPERTIES...……………………………………………29
2.5.1 Bar Properties……….……………………………………………29
2.5.2 Concrete Properties....……………………………………………33
2.6 EXPERIMENTAL PROGRAM..………………………………………...35
2.6.1 Chloride Exposure.……..………………………………………...35
2.6.2 Corrosion Monitoring.....………………………………………....38
2.6.3 Additional Testing………………………………………………..39
viii
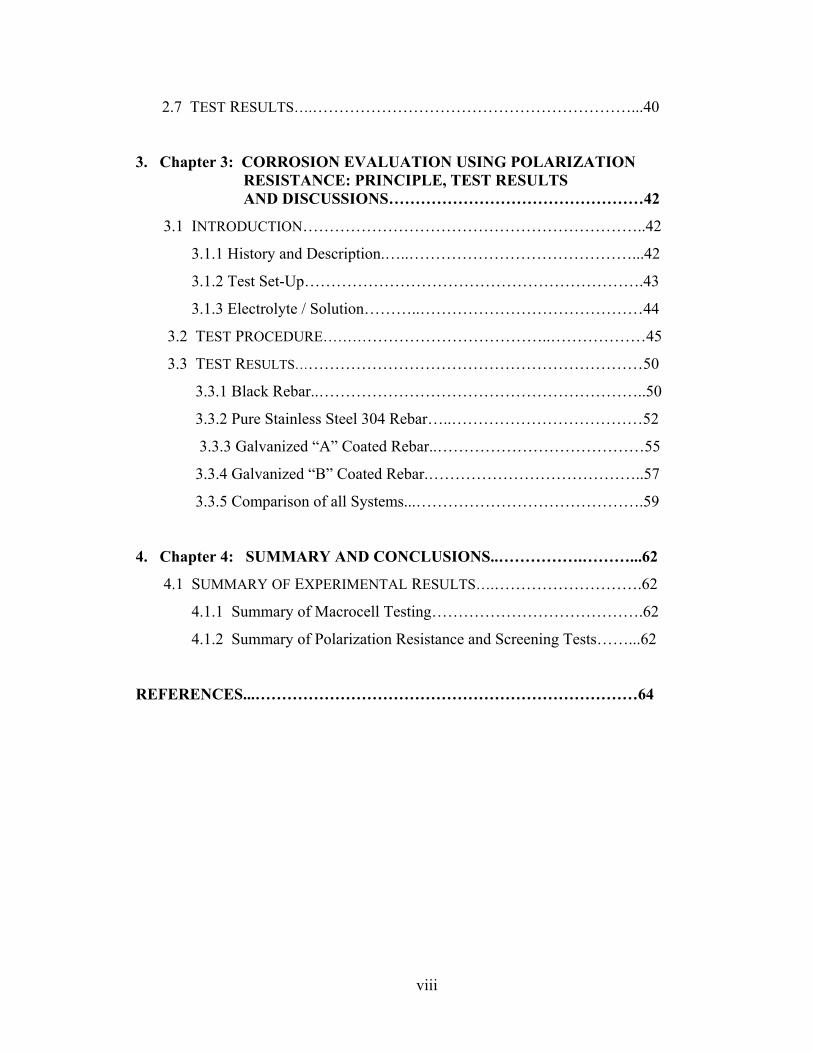
2.7 TEST RESULTS….……………………………………………………...40
3. Chapter 3: CORROSION EVALUATION USING POLARIZATION RESISTANCE: PRINCIPLE, TEST RESULTS AND DISCUSSIONS…………………………………………42
3.1 INTRODUCTION………………………………………………………..42
3.1.1 History and Description.…..……………………………………...42
3.1.2 Test Set-Up……………………………………………………….43
3.1.3 Electrolyte / Solution………..……………………………………44
3.2 TEST PROCEDURE……………………………………..………………45
3.3 TEST RESULTS…………………………………………………………50
3.3.1 Black Rebar..……………………………………………………..50
3.3.2 Pure Stainless Steel 304 Rebar…..………………………………52
3.3.3 Galvanized “A” Coated Rebar..…………………………………55
3.3.4 Galvanized “B” Coated Rebar.…………………………………..57
3.3.5 Comparison of all Systems...…………………………………….59
4. Chapter 4: SUMMARY AND CONCLUSIONS..…………….………...62
4.1 SUMMARY OF EXPERIMENTAL RESULTS….……………………….62
4.1.1 Summary of Macrocell Testing………………………………….62
4.1.2 Summary of Polarization Resistance and Screening Tests……...62
REFERENCES...………………………………………………………………64
ix
LIST OF FIGURES Figure 1.1: The Energy Cycle of Iron indicating It Is Extractive Metallurgy in Reverse..………………………………..3
Figure 2.1: Black Steel Reinforcement Bar..………………………………...11
Figure 2.2: Epoxy-Coated Reinforcement Bar A..…………………………..11
Figure 2.3: Epoxy-Coated Reinforcement Bar B..…………….…………….12
Figure 2.4: Nonbendable Epoxy-Coated Reinforcement Bar...……………..12
Figure 2.5: Nylon 11 Coated Reinforcement Bar..………………………….13
Figure 2.6: PVC-Coated Reinforcement Bar….…………………………….13
Figure 2.7: Galvanized-Coated Reinforcement Bar A...…………………….14
Figure 2.8: Galvanized-Coated Reinforcement Bar B...…………………….14
Figure 2.9: Galvanized-Coated Reinforcement Bar B...…………………….15
Figure 2.10: Galvanized-Coated Reinforcement Bar B...…………………….15
Figure 2.11: Typical Project 1265 Macrocell Specimen....…………………...17
Figure 2.12: Separation of Stainless Steel Cladding from Shearing.………....20
Figure 2.13: Typical Formwork for Macrocells with #4 Bars……...………...22
Figure 2.14: Typical Formwork for Macrocells with #6 Bars……...………...23
Figure 2.15: Macrocell Concrete Placement………………...……...………...25
Figure 2.16: Curing of Macrocell Specimen………………...……...………...26
Figure 2.17: Completed Macrocell Specimen...…………......……...………...28
Figure 2.18: Macrocell Storage Racks...…...……………......……...………...29
Figure 2.19: Digital Calipers and Coating Thickness Gage....……...………...31
Figure 2.20: Researcher Making 3.5% NaCl Solution at the Beginning of the “Wetting Cycle”…...…………………......……...………..35
Figure 2.21: Researcher Pouring 3.5% NaCl Solution in Dikes at Beginning of “Wetting Cycle”………………......……...……….36
Figure 2.22: Student Placing Plywood Sheet over Macrocell-Filled Dikes to Minimize Evaporation...……………………………….36
Figure 2.23: Macrocells with One Bent Black Rebar as Top-Reinforcing Layer and None in the Bottom-Reinforcing Layer….…………..37
x
Figure 2.24: Macrocells with Two Straight Black Rebars as Bottom- Reinforcing Layer and None in the Top-Reinforcing Layer.....….38
Figure 2.25: Multimeter..……………………………………………………...39
Figure 3.1: Schematic Diagram of Polarization Resistance Test Cell.………………………………………………..………...44
Figure 3.2: Polymer-Coated Rebars with Their Tips Polished to Ensure Good Electrical Contact during Polarization Resistance Test..…………45
Figure 3.3: Polarization Resistance Test Cells without Connections..……….46
Figure 3.4: Polarization Resistance Test Cells with Connections……..……..46
Figure 3.5: Lid of Polarization Resistance Test Cell with Holes to Accommodate the Rebar, the Reference Electrode and the Lugin Probe..……………………………………………………...48
Figure 3.6: Corr. Rate and PR versus Salt Concentration for Black Steel.…...50
Figure 3.7: Corr. Rate versus No. of Days for Black Steel.….……….………52
Figure 3.8: Corr. Rate and PR versus Salt Concentration for SS304 Rebar.....53
Figure 3.9: Corr. Rate versus No. of Days for SS304 Rebar.…..…………….55
Figure 3.10: Corr. Rate and PR versus Salt Concentration for Galvanized A Rebar………………………………………..…………………….56
Figure 3.11: Corr. Rate versus No. of Days for Galvanized A Rebar.…..…….57
Figure 3.12: Corr. Rate and PR versus Salt Concentration for Galvanized B Rebar……………………………………………………………...58
Figure 3.13: Corr. Rate versus No. of Days for Galvanized B Rebar...……......59
Figure 3.14: Comparison of Corrosion Rates of Various Rebars……………...60
xi
LIST OF TABLES
Table 2.1: Schedule of Macrocell Test Specimens..…………. ………………10
Table 2.2: ASTM A615 and A775 Requirements…...…………. ……………30
Table 2.3: Measured Bar Deformation and Coating Properties………………32
Table 2.4: Concrete Batch Data….…………………………....………………33
Table 2.5: Conditions during Macrocell Casting……..……....……………….34
Table 2.6: Macrocell Concrete Compressive Strength…..…....………………34
Table 2.7: Macrocell Ponding Test……………………………………………40
Table 3.1: Density and Equivalent Weight of Various Materials.…………….47
Table 3.2: PR Sample Test Sheet (for Black Steel)…..……………………….49
Table 3.3: Corrosion Rate and PR versus Salt Concentration…….…………..50
Table 3.4: Corrosion Rate versus No. of Days for Black Steel……………….51
Table 3.5: Corrosion Rate and PR versus Salt Concentration for SS304.….....53
Table 3.6: Corrosion Rate versus No. of Days for SS304....………………….54
Table 3.7: Corrosion Rate and PR versus Salt Concentration for Galv. A Rebar…………………...…………………………………55
Table 3.8: Corrosion Rate versus No. of Day for Galv. A Rebar.……………………………………………………………....56
Table 3.9: Corrosion Rate and PR versus Salt Concentration for Galv. B Rebar…………………………………………………..57
Table 3.10: Corrosion Rate versus No. of Days for Galv. B Rebar.……………………………………………………………....58
Table 3.11: Corrosion Rate versus Salt Concentration (of All Systems).…………………………………………………………..59

1
Chapter 1:
Introduction
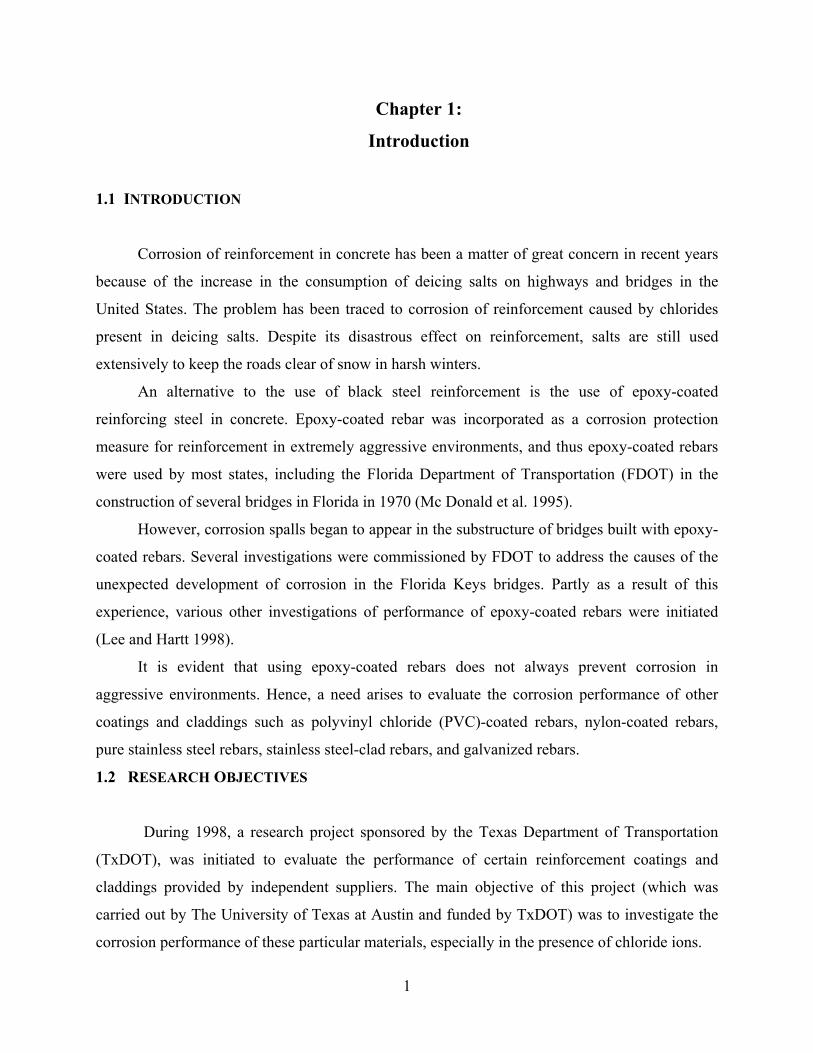
1.1 INTRODUCTION
Corrosion of reinforcement in concrete has been a matter of great concern in recent years
because of the increase in the consumption of deicing salts on highways and bridges in the
United States. The problem has been traced to corrosion of reinforcement caused by chlorides
present in deicing salts. Despite its disastrous effect on reinforcement, salts are still used
extensively to keep the roads clear of snow in harsh winters.
An alternative to the use of black steel reinforcement is the use of epoxy-coated
reinforcing steel in concrete. Epoxy-coated rebar was incorporated as a corrosion protection
measure for reinforcement in extremely aggressive environments, and thus epoxy-coated rebars
were used by most states, including the Florida Department of Transportation (FDOT) in the
construction of several bridges in Florida in 1970 (Mc Donald et al. 1995).
However, corrosion spalls began to appear in the substructure of bridges built with epoxy-
coated rebars. Several investigations were commissioned by FDOT to address the causes of the
unexpected development of corrosion in the Florida Keys bridges. Partly as a result of this
experience, various other investigations of performance of epoxy-coated rebars were initiated
(Lee and Hartt 1998).
It is evident that using epoxy-coated rebars does not always prevent corrosion in
aggressive environments. Hence, a need arises to evaluate the corrosion performance of other
coatings and claddings such as polyvinyl chloride (PVC)-coated rebars, nylon-coated rebars,
pure stainless steel rebars, stainless steel-clad rebars, and galvanized rebars.
1.2 RESEARCH OBJECTIVES
During 1998, a research project sponsored by the Texas Department of Transportation
(TxDOT), was initiated to evaluate the performance of certain reinforcement coatings and
claddings provided by independent suppliers. The main objective of this project (which was
carried out by The University of Texas at Austin and funded by TxDOT) was to investigate the
corrosion performance of these particular materials, especially in the presence of chloride ions.
2
It was decided to carry out three types of tests: macrocell testing, polarization resistance
(PR) testing, and pull-out testing.
• The macrocell testing was used to evaluate the current flow as a function of time and
presumably chloride concentration. Thus, it performs almost real-time analysis of the
corrosion behavior of these materials in concrete when exposed to chloride ions.
• For immersion testing, bars were evaluated based on their behavior in salt-free and salt-
contaminated solutions, which simulate concrete (e.g., calcium hydroxide) for various
times.
• In the case of the metallic materials, another type of test, PR was carried out. As a result
of this test, the corrosion rate (which is inversely related to PR) of the metallic materials
in various electrolytes or environments can be estimated.
• A rebar with a coating, which has an excellent performance against corrosion in a
chloride environment, would have little use if it fails to have adequate bond with the
surrounding concrete. Hence, a third type of test, the pull-out, was carried out in a
companion study to determine the bond between the different rebar systems and concrete.
1.3 CORROSION OF REINFORCING STEEL IN CONCRETE
At present, the greatest extent of natural damage to reinforced concrete structures can be
attributed to chloride ions. Transportation structures and parking garages in cold climates are
damaged because of deicing salts. Coastal structures and bridge substructures in marine
environments are damaged by seawater and salt spray. In addition, structures are often
constructed with a built-in destructive agent: a chloride-based accelerating admixture. Moreover,
self-contaminated aggregates and brackish water set the stage for advanced corrosion and
premature durability problems.
3
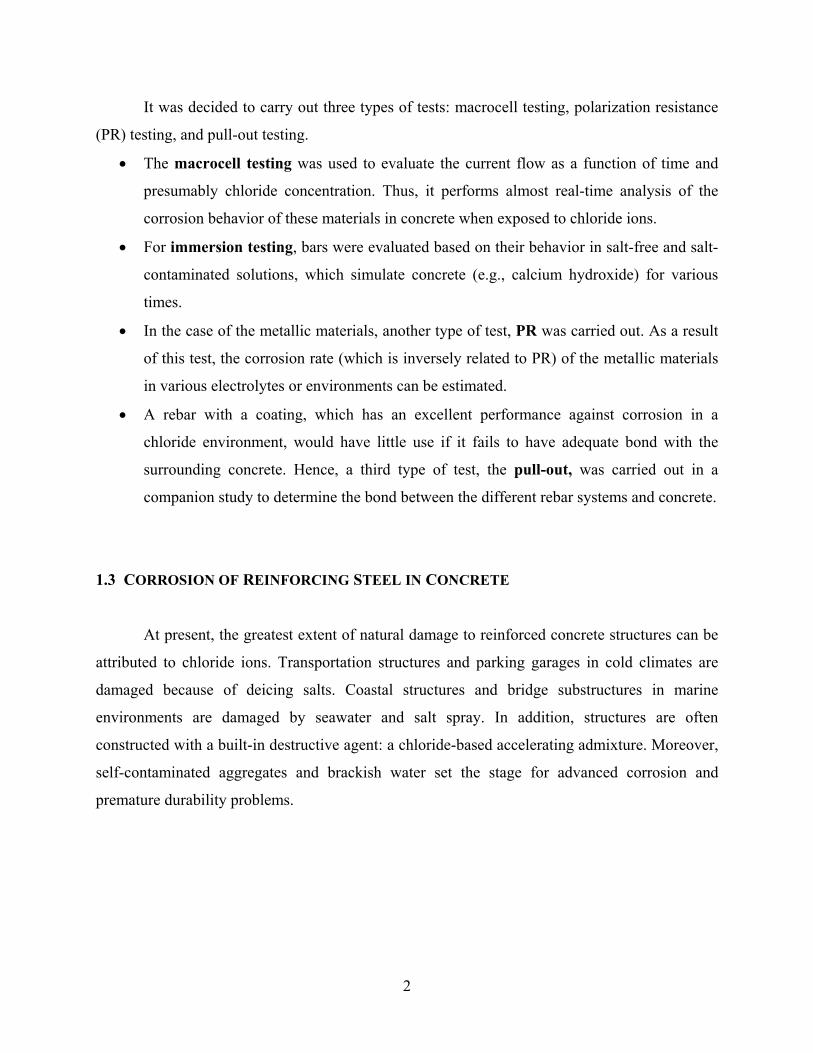
Corrosion of metals may be considered as extractive metallurgy in reverse (Fontana
1986). The process is described in Figure 1.1. Hence, the solution to corrosion problems may not
always be in their total elimination (as this may be a difficult task). Rather, the answer may lie in
a goal to find the most efficient way of living with them so as to cause minimal damage.
Figure 1.1: The Energy Cycle of Iron Indicating It Is Extractive Metallurgy in Reverse (Kahhaleh et al. 1994)

4
5
Chapter 2:
Macrocell Corrosion Study:
Principle, Test Result and Discussions
2.1 INTRODUCTION
Concrete and bridge structures are exposed to large amounts and varying concentrations
of deicing salts in regions with snowfall. This leads to exposure of concrete and its reinforcement
to chlorides. It has been known that chlorides accelerate corrosion (or the onset of corrosion) on
the reinforcement surface. As a result, there is rust formation, which has a greater volume than
the original steel. Hence, there is stress induced, causing cracking of concrete, in turn making it
an even more open structure for the penetration of chlorides.
Therefore, it is necessary to design an experiment that will simulate optimum real-life
conditions. One such experiment is the macrocell test, which is described in ASTM G109
(ASTM 1999). This test makes use of two layers of steel, one close to a chloride source and the
other much farther from the chloride source. This test has become a very popular test for
studying the behavior of steel in concrete.
There have been numerous research projects to study the corrosion resistance of an
individual coating or metal for concrete reinforcement protection, but relatively few projects
have tested numerous materials of different types to make comparisons and determine which
ones offer better corrosion performance. This long-term corrosion study involves the testing of
176 macrocell specimens to compare the corrosion resistance of different metallic coatings,
organic coatings, and corrosion resistant steels.
2.2 SCOPE
The objective of the macrocell test program was to compare the resistance of different
coatings and metals to corrosion when embedded in concrete. The purpose was to identify
which materials provide better protection for concrete-reinforcing steel.
6
Care was taken in the design and construction of the macrocell specimens so that each
specimen was as identical as possible. The only variable being tested was the type of corrosion
resistant bar. The macrocell specimens were grouped according to the type of corrosion resistant
bar. Sixteen macrocells were constructed for each type of corrosion resistant bar. Within each
of these groups of macrocells are different bar-coupling configurations. The control group
consisted of uncoated bars with normal mill scale. Eight macrocells were constructed for each of
the control groups.
2.2.1 Corrosion Resistant Materials
Early in the project, reinforcing bar coatings and metals marketed for purposes of
corrosion protection were identified. Letters were sent to the manufacturers of these materials
that contained information about this research project and an invitation to submit materials for
testing. The manufacturers were asked to submit a minimum amount of material required to
construct both the macrocell specimens and the pull-out specimens.
Three metal-coating systems were received. Two different manufacturing facilities
submitted hot-dipped galvanized bars. Type 304 stainless steel-clad bars were also received.
Five organic-coating systems were received. Two of the organic coatings were fusion-
bonded epoxies manufactured by two different companies. Nonbendable epoxy-coated bars
were received. This type of epoxy is harder and more brittle than typical epoxy coatings. To
prevent cracking in the nonbendable epoxy, bars must be bent to the desired shape prior to
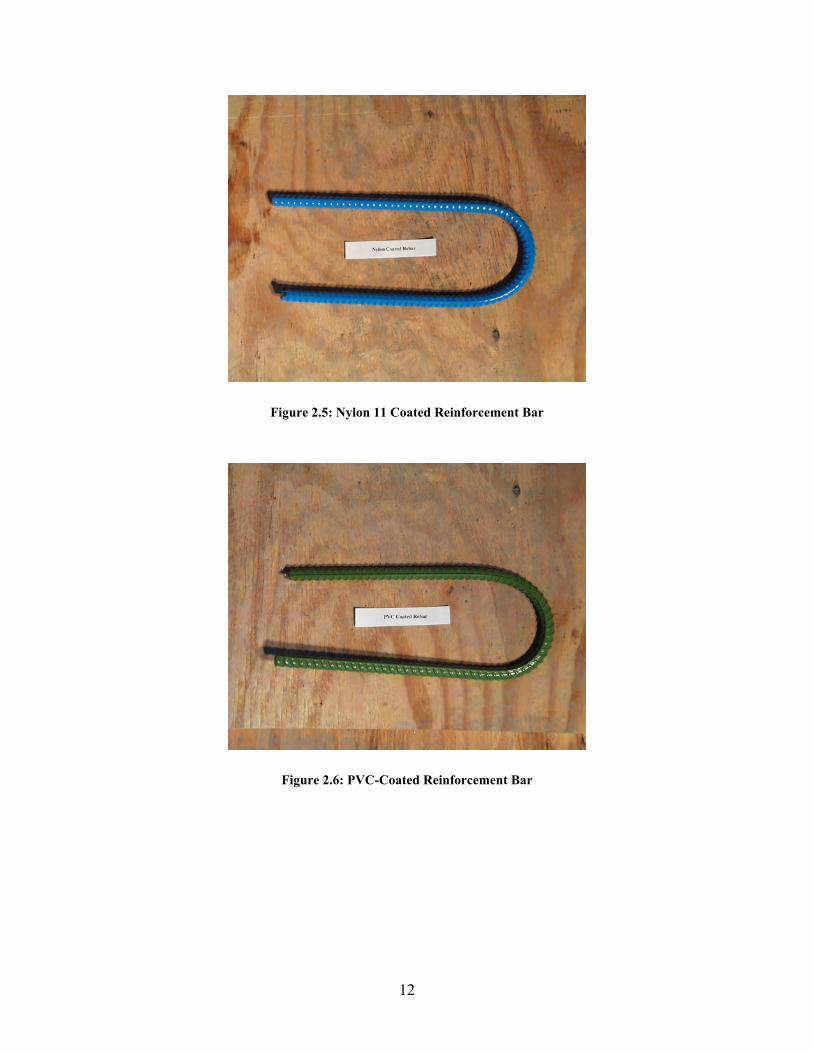
coating. Polyvinyl chloride (PVC) and nylon-coated bars were also received.
One type of corrosion resistant metal, type 304 stainless steel, was received and included
in the study as well as a stainless steel-clad rebar.
A second corrosion resistant metal, ferritic steel, was received. However, the ferritic
steel bars were received after the concrete had been cast for the macrocell specimens, and
therefore were not included in this project.
7
2.2.2 Bar Configurations
Within each group of macrocells, except the control group, there were different
configurations of electrically coupled bars. All of the macrocell specimens had corrosion
resistant bars for the top layer of steel. However, different configurations of bars were used for
the bottom layer of steel. The purpose was to determine if the corrosion of reinforcement was
affected by different bar configurations typically found in practice and, if so, to determine which
configurations experience the least corrosion.
Fifty percent of the macrocell specimens for each group of corrosion resistant bars were
constructed with uncoated mild steel bars for the bottom layer of steel. These specimens were
intended to simulate concrete members, such as bridge decks, that might have corrosion resistant
bars for the top layer of reinforcement but uncoated mild steel bars for the bottom layer. This
situation might occur because corrosion resistant bars cost more and using typical mild steel bars
for the bottom layer of reinforcement results in a cost savings.
Twenty-five percent of the specimens were constructed with corrosion resistant bars for
the bottom layer. These specimens were intended to simulate concrete members for which all of
the reinforcement was specified to be corrosion resistant.
The remaining 25 percent of specimens were built without a bottom layer of steel. These
specimens will be coupled to another macrocell that has not been exposed to chlorides or has
only uncoated mild steel bars on the bottom layer. Coupling these two macrocells simulates
deeper members, such as beams, that have chloride-contaminated concrete near the top surface
and uncontaminated concrete at greater depths. In addition, the ability to couple different
macrocells, such as epoxy and galvanized, offers much more flexibility.
Macrocell configurations for each of the corrosion resistant and control groups can be
seen in Table 2.1. Photographs of various reinforcement bars used in this research project are
shown in Figures 2.1 through 2.10.
2.2.3 Bar Size
The results of the macrocell study in TxDOT Project 1265 indicated that the corrosion
rate is influenced by the diameter of the bar (Gowripalan 1998). Therefore, a single bar size is

8
needed for direct comparisons of different corrosion resistant materials. The galvanized coating,
organic coatings, and solid 304 stainless steel were tested using #4 bars (1/2-inch diameter). The
bar size of the uncoated mild steel bars used for the control group was also #4.
9
Table 2.1: Schedule of Macrocell Test Specimens
* Black steel on top and bottom ** Black steel on top
Bar Type Bar Size Top: Resistant Steel Bottom: Black Steel
Top: Resistant Steel Bottom: Resistant Steel
Top: Resistant Steel Bottom: No Steel
Top: No Steel Bottom: Black Steel
Control A (Black Steel) 4 4* 0 2** 2
Galvanized A 4 8 4 4 0
Galvanized B 4 8 4 4 0
Epoxy A 4 8 4 4 0
Epoxy B 4 8 4 4 0
Nonbendable Epoxy 4 8 4 4 0
Nylon 4 8 4 4 0
PVC 4 8 4 4 0
304 Stainless Steel 4 8 4 4 0
Control B (Black Steel) 6 4* 0 2** 2
Epoxy A 6 8 4 4 0
304 Stainless Steel-Clad 6 8 4 4 0
10
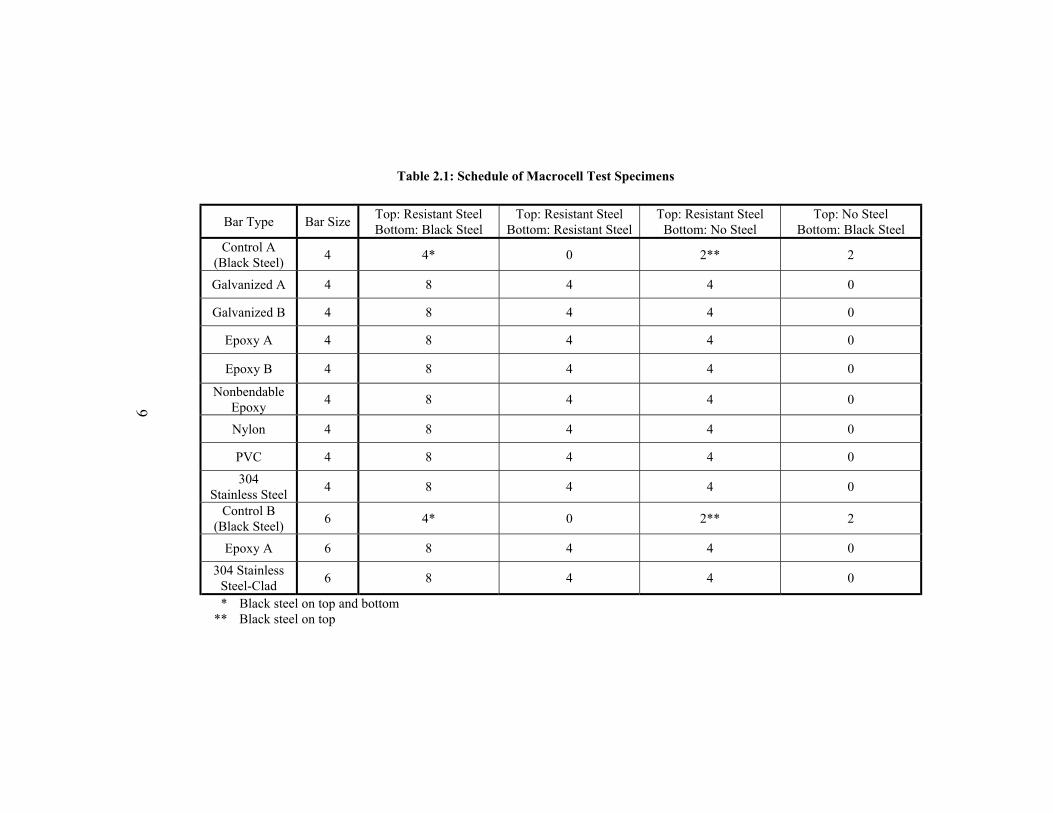
Figure 2.1: Black Steel Reinforcement Bar
Figure 2.2: Epoxy-Coated Reinforcement Bar A
11
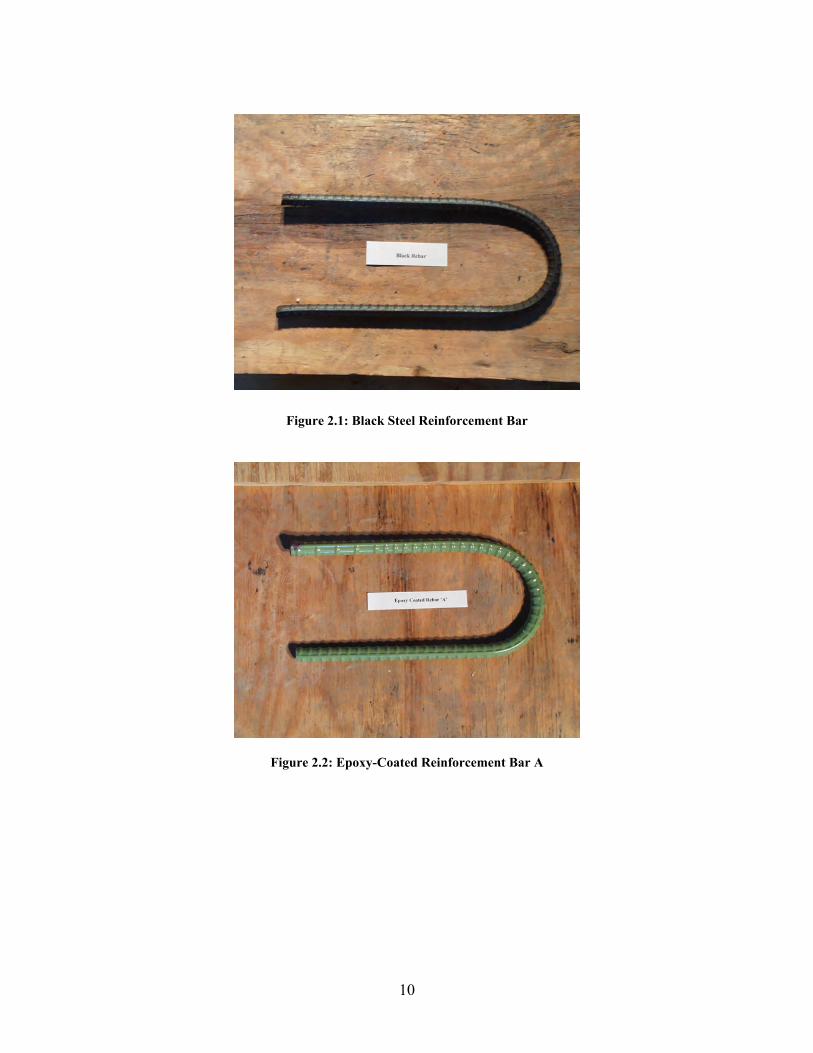
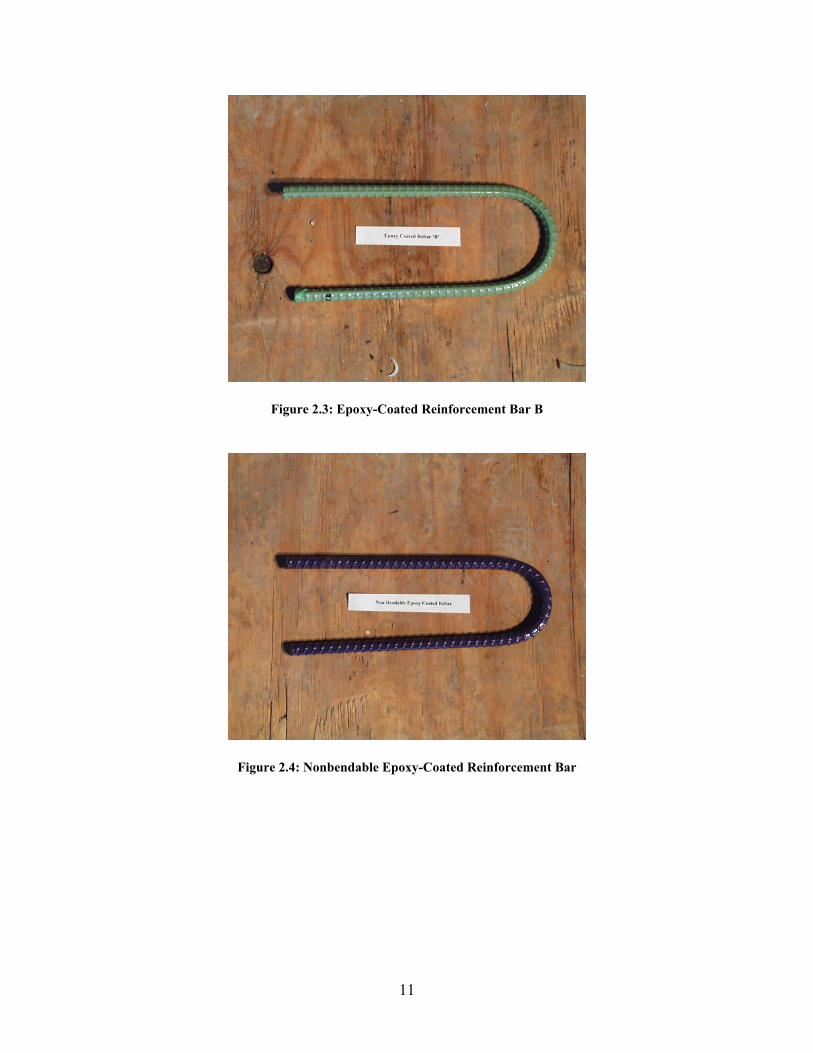
Figure 2.3: Epoxy-Coated Reinforcement Bar B
Figure 2.4: Nonbendable Epoxy-Coated Reinforcement Bar
12
Figure 2.5: Nylon 11 Coated Reinforcement Bar
Figure 2.6: PVC-Coated Reinforcement Bar
13
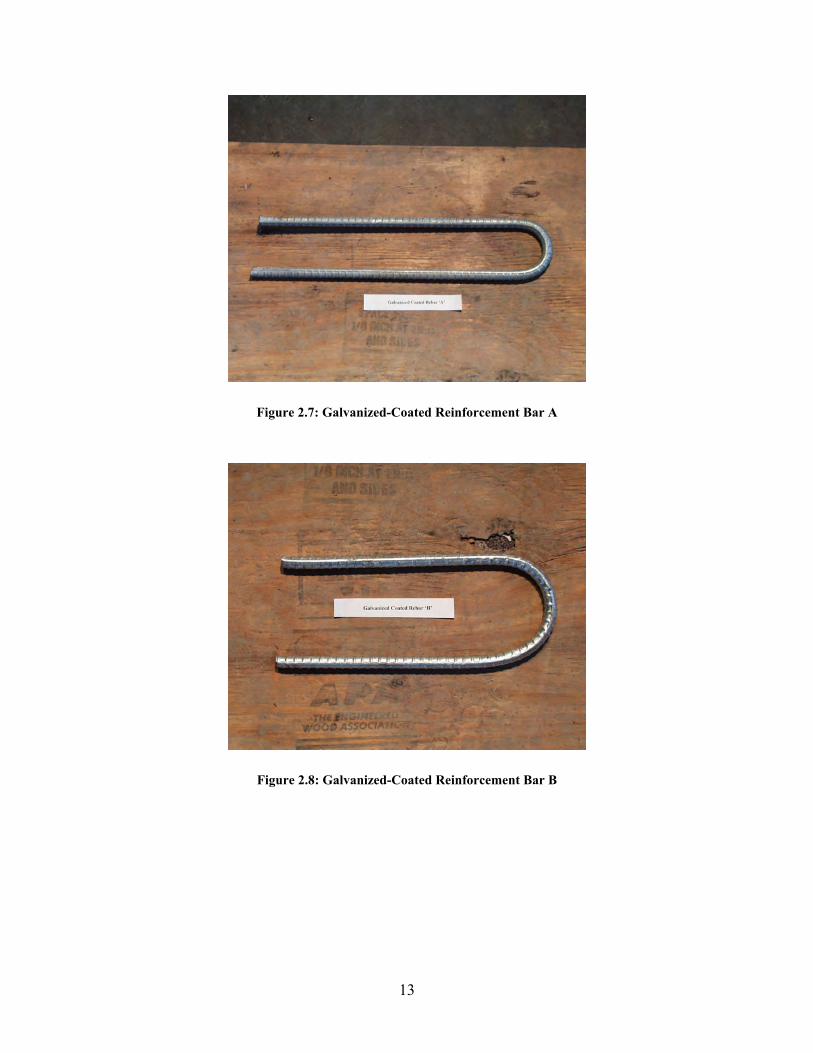
Figure 2.7: Galvanized-Coated Reinforcement Bar A
Figure 2.8: Galvanized-Coated Reinforcement Bar B
14
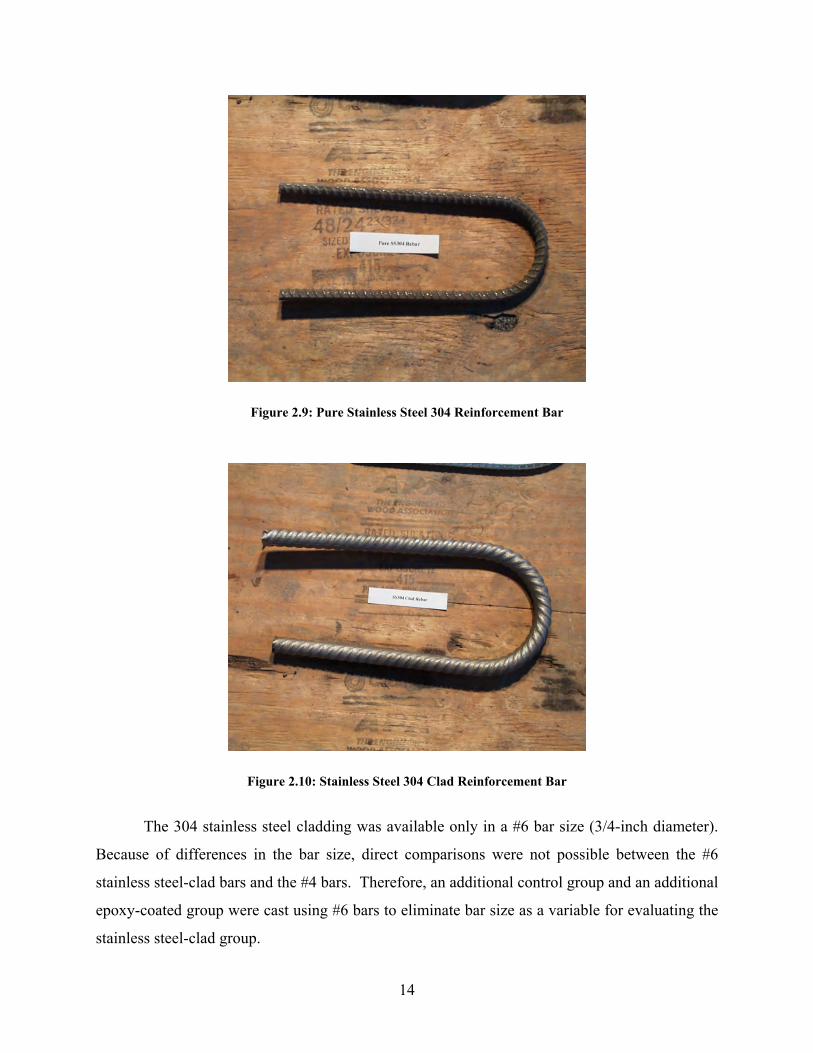
Figure 2.9: Pure Stainless Steel 304 Reinforcement Bar
Figure 2.10: Stainless Steel 304 Clad Reinforcement Bar
The 304 stainless steel cladding was available only in a #6 bar size (3/4-inch diameter).
Because of differences in the bar size, direct comparisons were not possible between the #6
stainless steel-clad bars and the #4 bars. Therefore, an additional control group and an additional
epoxy-coated group were cast using #6 bars to eliminate bar size as a variable for evaluating the
stainless steel-clad group.
15
2.3 DESIGN OF MACROCELL SPECIMENS
The design of the macrocell specimens in this project was based on the macrocell
specimens tested in Project 1265, “Structural Integrity of Epoxy-Coated Bars,” at the University
of Texas at Austin (Vaca-Cortes 1999). In this project, macrocell specimens were successfully
used to determine the effects of damage, different bar sizes, and different bar deformations on
the corrosion resistance of epoxy-coated bars.
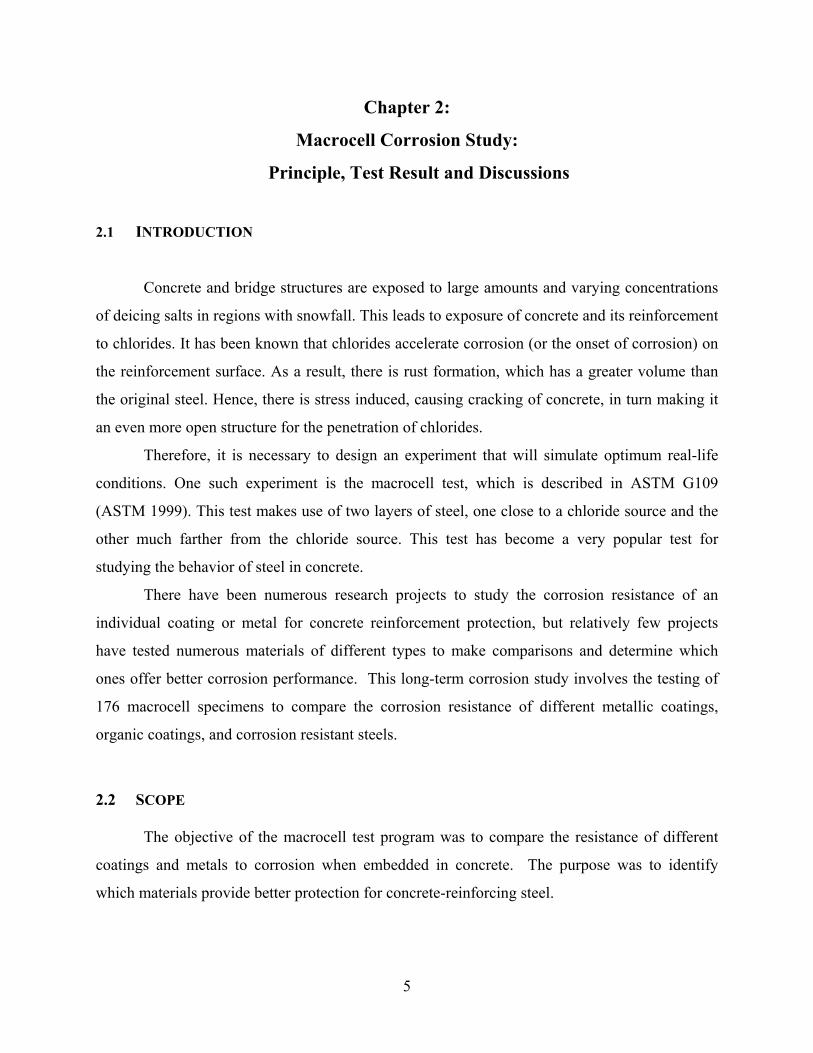
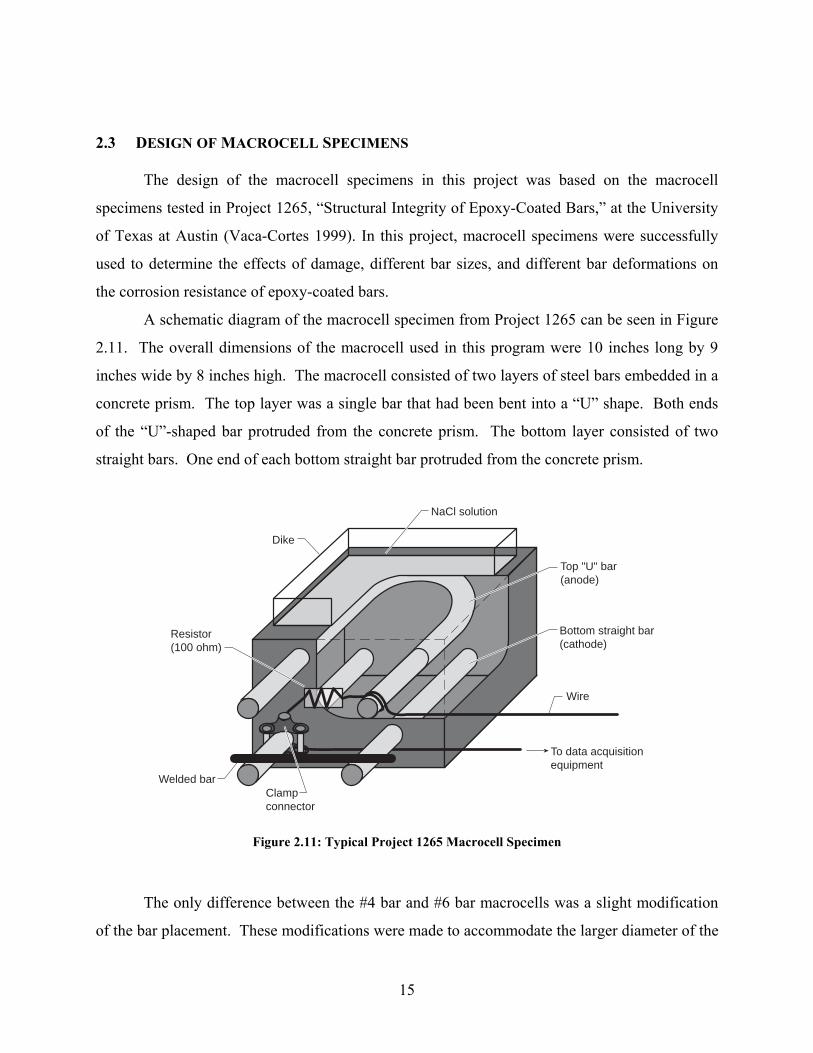
A schematic diagram of the macrocell specimen from Project 1265 can be seen in Figure
2.11. The overall dimensions of the macrocell used in this program were 10 inches long by 9
inches wide by 8 inches high. The macrocell consisted of two layers of steel bars embedded in a
concrete prism. The top layer was a single bar that had been bent into a “U” shape. Both ends
of the “U”-shaped bar protruded from the concrete prism. The bottom layer consisted of two
straight bars. One end of each bottom straight bar protruded from the concrete prism.
Dike
NaCl solution
Top "U" bar(anode)
Bottom straight bar(cathode)
Wire
To data acquisitionequipment
Welded barClampconnector
Resistor(100 ohm)
Figure 2.11: Typical Project 1265 Macrocell Specimen
The only difference between the #4 bar and #6 bar macrocells was a slight modification
of the bar placement. These modifications were made to accommodate the larger diameter of the
16
#6 bar so that the depth of concrete cover was 1 inch and the clear spacing between the top layer
and bottom layer of steel was 4 inches for both sets of macrocells.
2.4 CONSTRUCTION OF MACROCELL SPECIMENS
2.4.1 Bar Preparation
All of the bars received, except for the galvanized A and nonbendable epoxy-coated bars,
were not the required length and were straight. The cutting and bending of the bars was
performed offsite at an epoxy-coating bar manufacturing facility. The bars were first sheared to
the required length. Then several of the bars were bent into a “U” shape for the top layer of
steel. Plastic mandrels were used in the bending process to minimize any damage to the
coatings.
The shearing process exposed the cross section of the bars, which was left unprotected
and was susceptible to corrosion during testing. Care was taken to exclude as many of the
sheared bar ends from being embedded within the macrocell; however, this was not entirely
possible. Epoxy was used to patch any of the sheared ends that were embedded within the
macrocells.
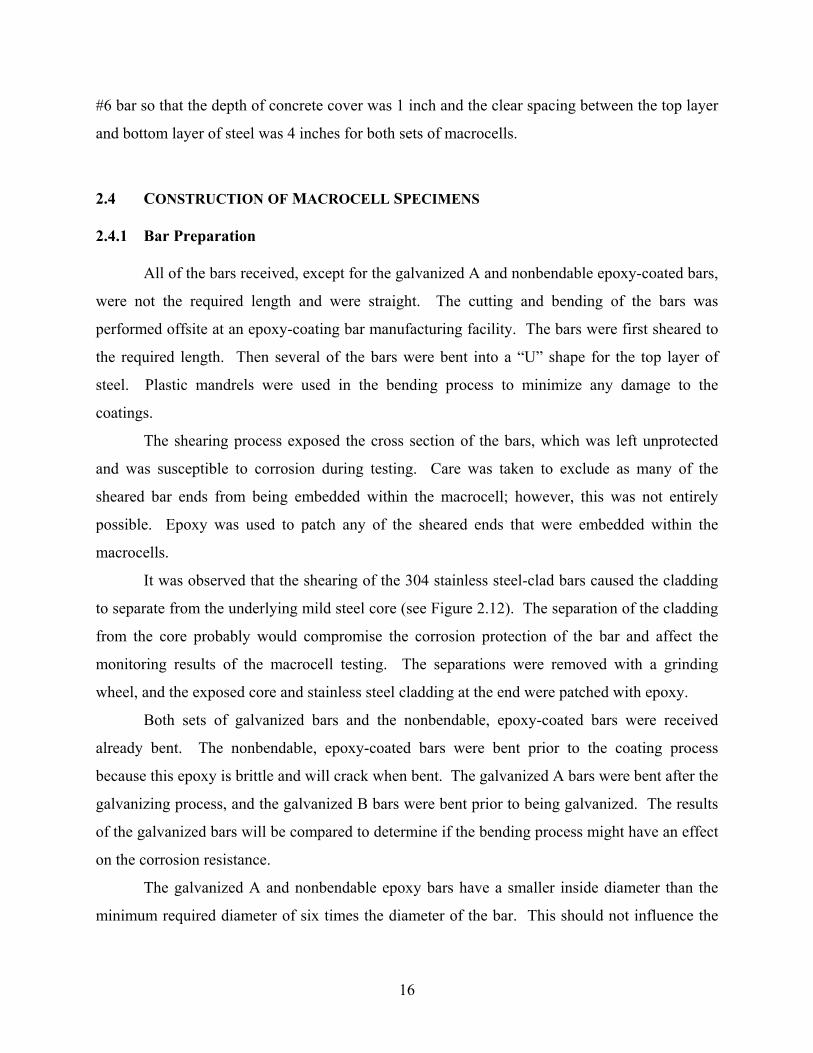
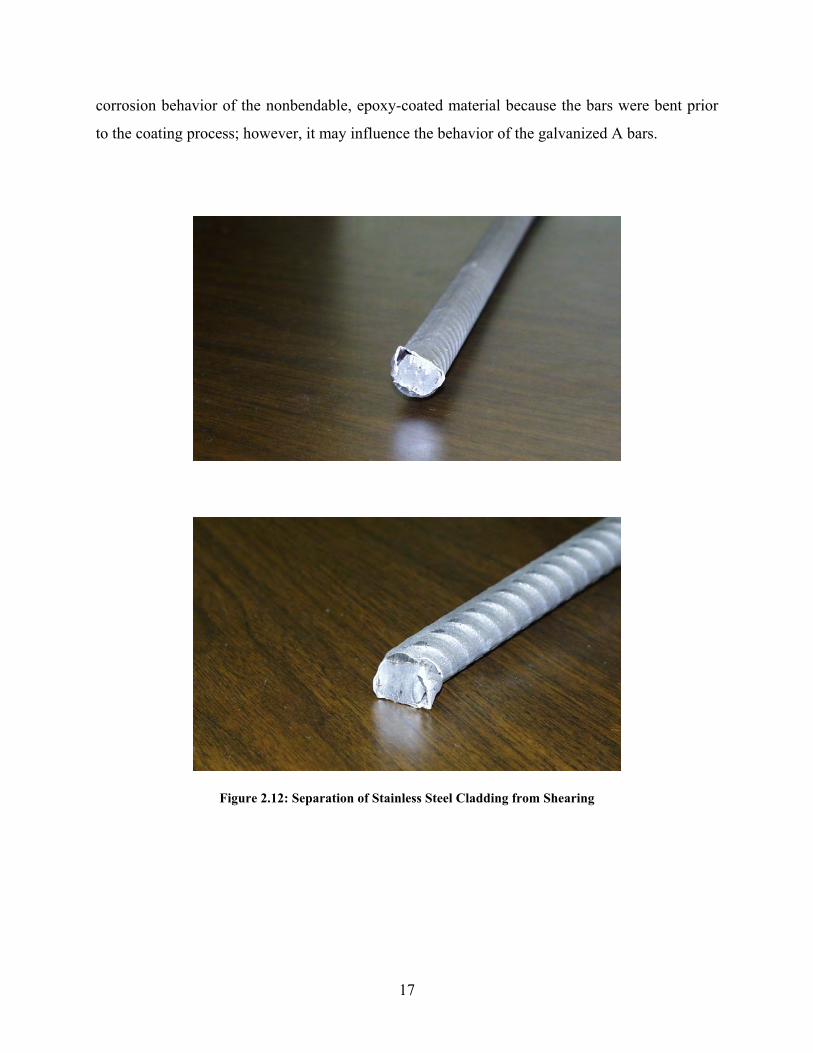
It was observed that the shearing of the 304 stainless steel-clad bars caused the cladding
to separate from the underlying mild steel core (see Figure 2.12). The separation of the cladding
from the core probably would compromise the corrosion protection of the bar and affect the
monitoring results of the macrocell testing. The separations were removed with a grinding
wheel, and the exposed core and stainless steel cladding at the end were patched with epoxy.
Both sets of galvanized bars and the nonbendable, epoxy-coated bars were received
already bent. The nonbendable, epoxy-coated bars were bent prior to the coating process
because this epoxy is brittle and will crack when bent. The galvanized A bars were bent after the
galvanizing process, and the galvanized B bars were bent prior to being galvanized. The results
of the galvanized bars will be compared to determine if the bending process might have an effect
on the corrosion resistance.
The galvanized A and nonbendable epoxy bars have a smaller inside diameter than the
minimum required diameter of six times the diameter of the bar. This should not influence the
17
corrosion behavior of the nonbendable, epoxy-coated material because the bars were bent prior
to the coating process; however, it may influence the behavior of the galvanized A bars.
Figure 2.12: Separation of Stainless Steel Cladding from Shearing
18
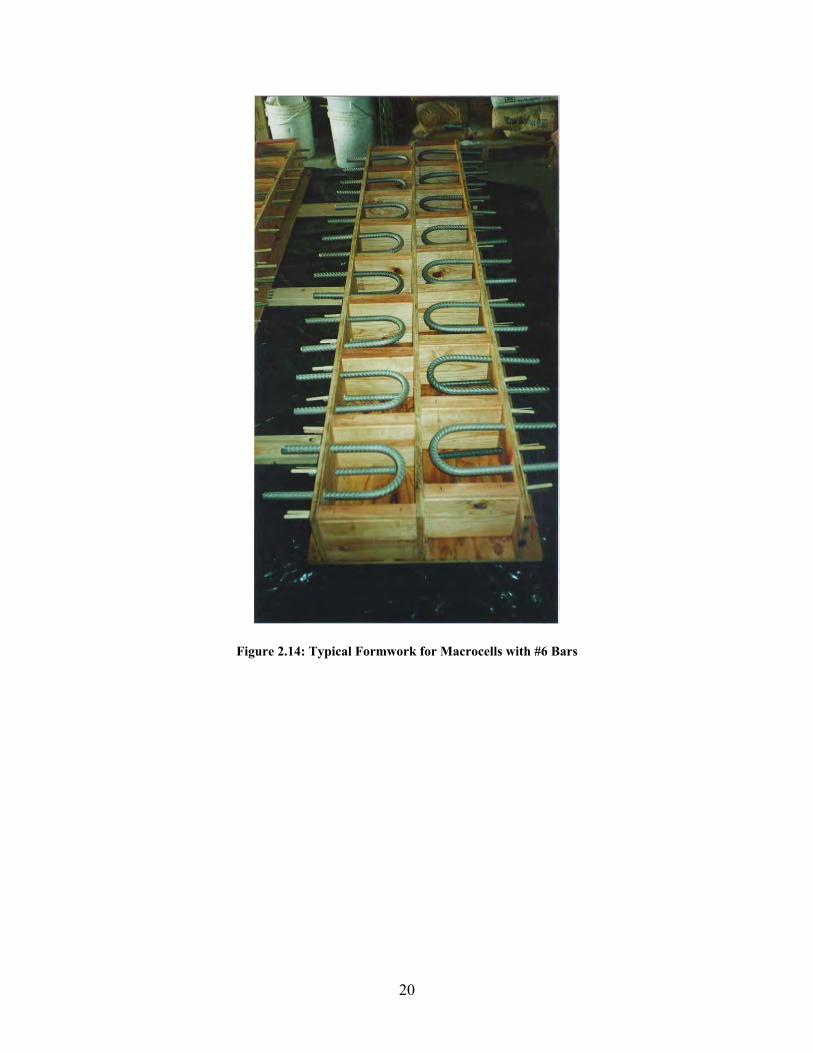
2.4.2 Formwork and Bar Placement
The formwork was designed to hold sixteen macrocell specimens, and all of the
macrocells for a particular test material could be cast in one set of formwork. Eleven sets of
forms were constructed so that all 176 macrocells could be cast simultaneously. Screws were
used to assemble the pieces of the formwork. The two rows of macrocells within the forms were
slightly offset for access to fasten the transverse dividers to the longitudinal center divider.
Holes were drilled in the two longitudinal perimeter pieces to allow the ends of the “U”-shaped
and straight bars to protrude from the concrete prism. The drilled holes were centered within the
macrocell and provided the proper concrete cover and bar spacing.
The macrocell bars were only supported by the formwork. The bars were secured by
inserting wedges between the formwork and the protruding bars. No chairs or other types of
reinforcing bar supports were used within the macrocell. Chairs create discontinuities in the
concrete prism, which might affect the penetration of chloride ions into the concrete.
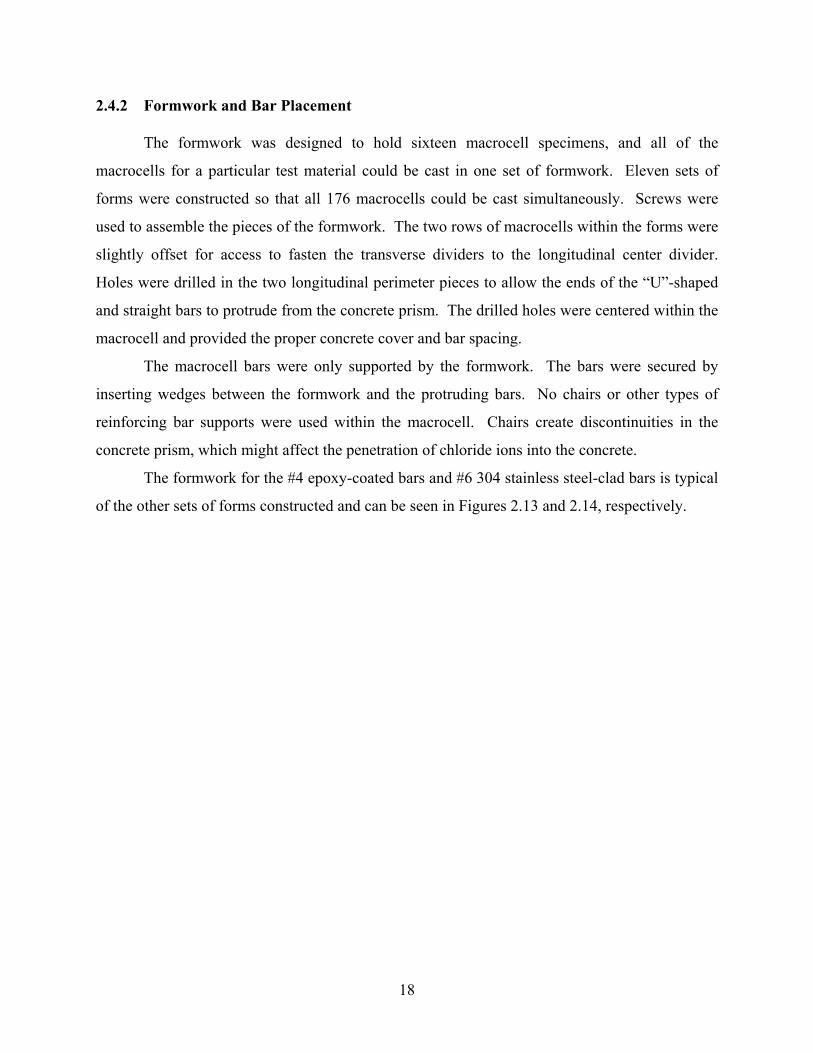
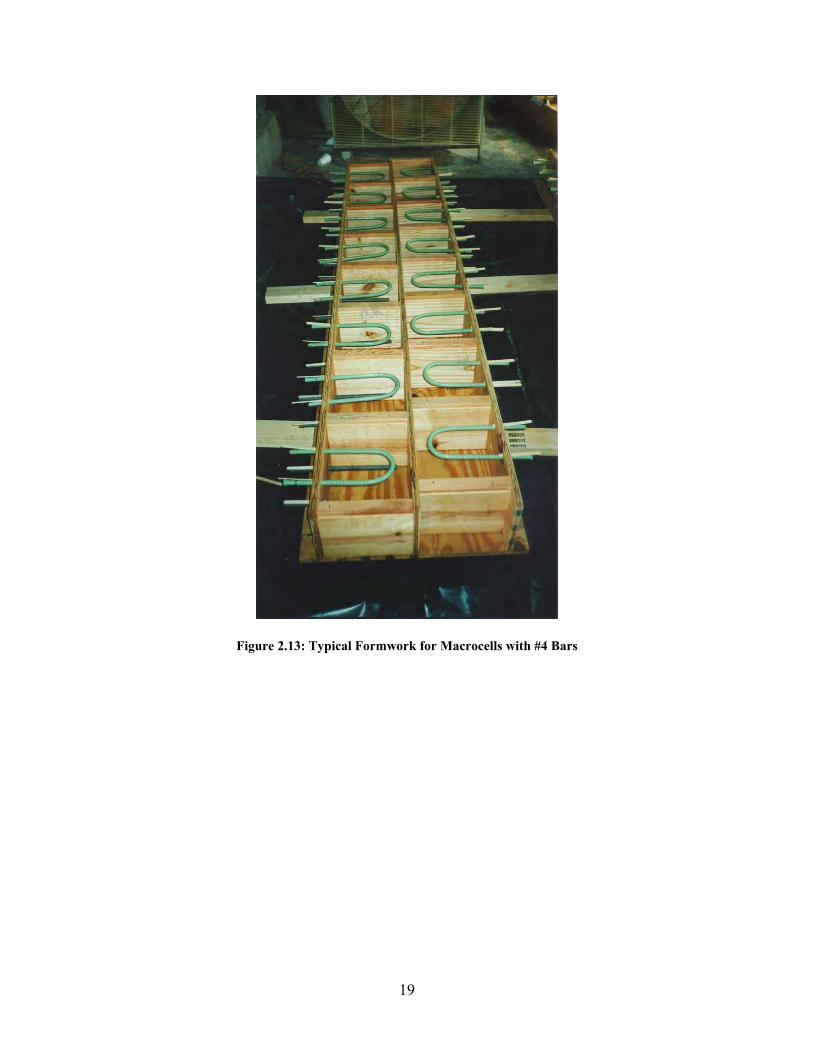
The formwork for the #4 epoxy-coated bars and #6 304 stainless steel-clad bars is typical
of the other sets of forms constructed and can be seen in Figures 2.13 and 2.14, respectively.
19
Figure 2.13: Typical Formwork for Macrocells with #4 Bars
20
Figure 2.14: Typical Formwork for Macrocells with #6 Bars
21
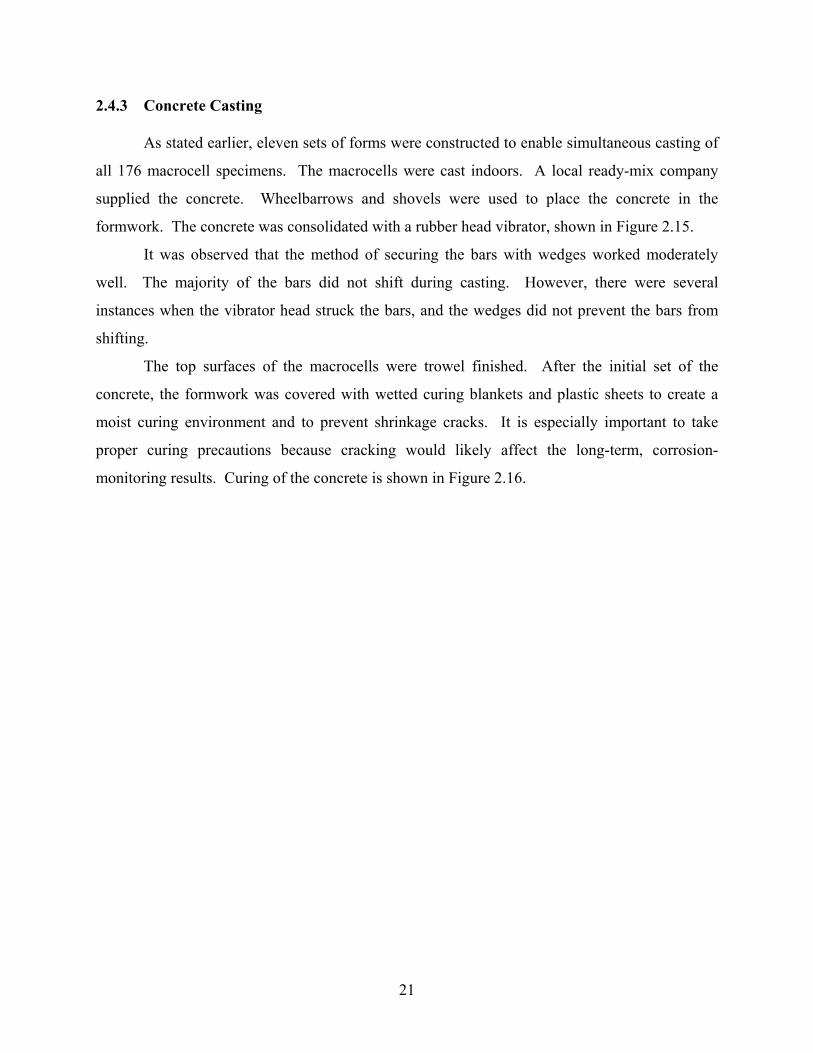
2.4.3 Concrete Casting
As stated earlier, eleven sets of forms were constructed to enable simultaneous casting of
all 176 macrocell specimens. The macrocells were cast indoors. A local ready-mix company
supplied the concrete. Wheelbarrows and shovels were used to place the concrete in the
formwork. The concrete was consolidated with a rubber head vibrator, shown in Figure 2.15.
It was observed that the method of securing the bars with wedges worked moderately
well. The majority of the bars did not shift during casting. However, there were several
instances when the vibrator head struck the bars, and the wedges did not prevent the bars from
shifting.
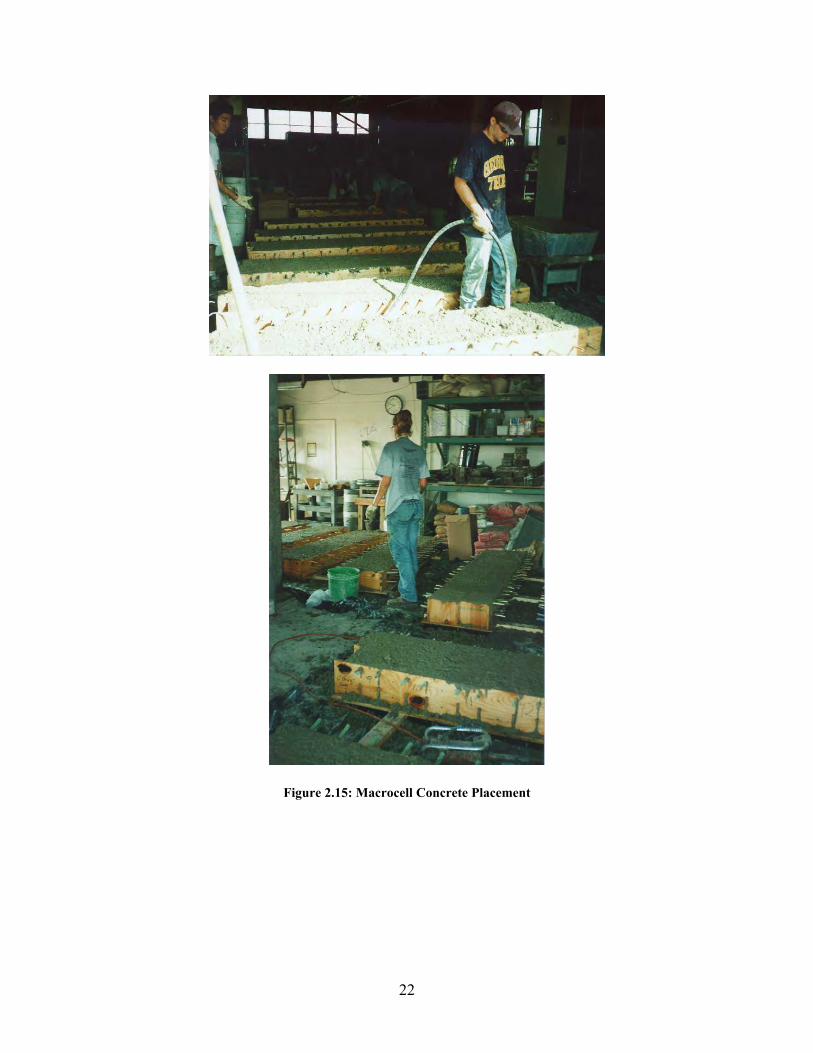
The top surfaces of the macrocells were trowel finished. After the initial set of the
concrete, the formwork was covered with wetted curing blankets and plastic sheets to create a
moist curing environment and to prevent shrinkage cracks. It is especially important to take
proper curing precautions because cracking would likely affect the long-term, corrosion-
monitoring results. Curing of the concrete is shown in Figure 2.16.
22
Figure 2.15: Macrocell Concrete Placement
23
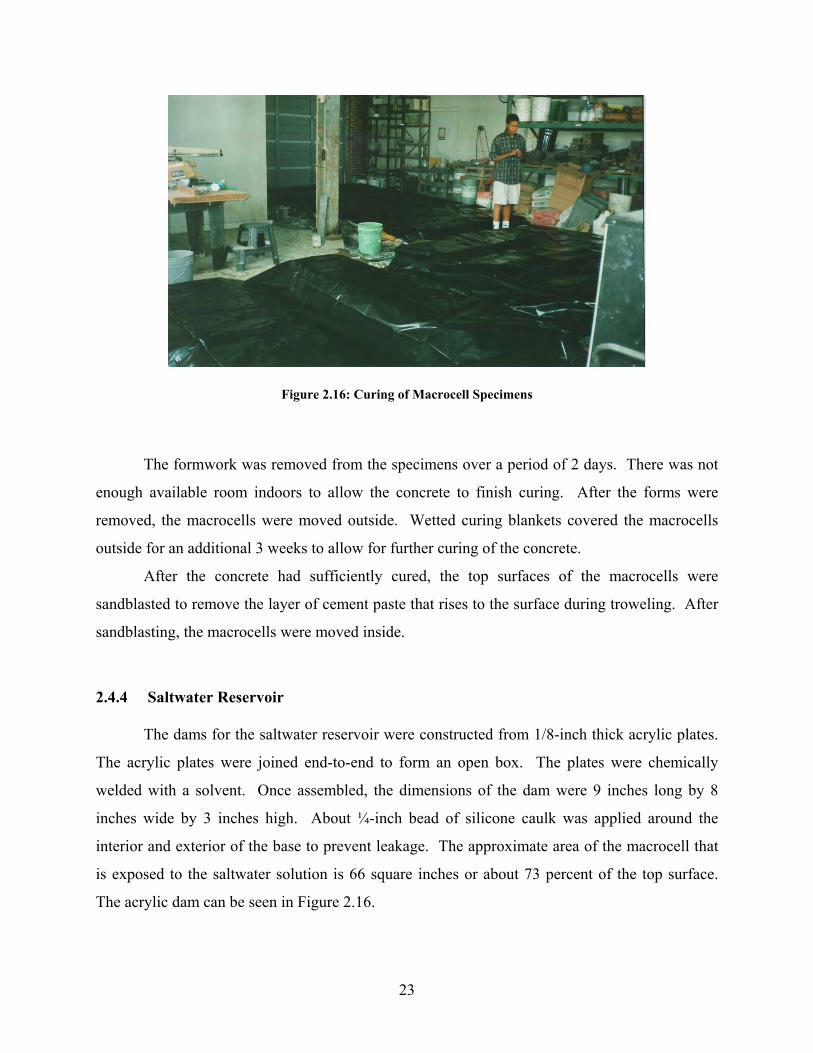
Figure 2.16: Curing of Macrocell Specimens
The formwork was removed from the specimens over a period of 2 days. There was not
enough available room indoors to allow the concrete to finish curing. After the forms were
removed, the macrocells were moved outside. Wetted curing blankets covered the macrocells
outside for an additional 3 weeks to allow for further curing of the concrete.
After the concrete had sufficiently cured, the top surfaces of the macrocells were
sandblasted to remove the layer of cement paste that rises to the surface during troweling. After
sandblasting, the macrocells were moved inside.
2.4.4 Saltwater Reservoir
The dams for the saltwater reservoir were constructed from 1/8-inch thick acrylic plates.
The acrylic plates were joined end-to-end to form an open box. The plates were chemically
welded with a solvent. Once assembled, the dimensions of the dam were 9 inches long by 8
inches wide by 3 inches high. About ¼-inch bead of silicone caulk was applied around the
interior and exterior of the base to prevent leakage. The approximate area of the macrocell that
is exposed to the saltwater solution is 66 square inches or about 73 percent of the top surface.
The acrylic dam can be seen in Figure 2.16.
24
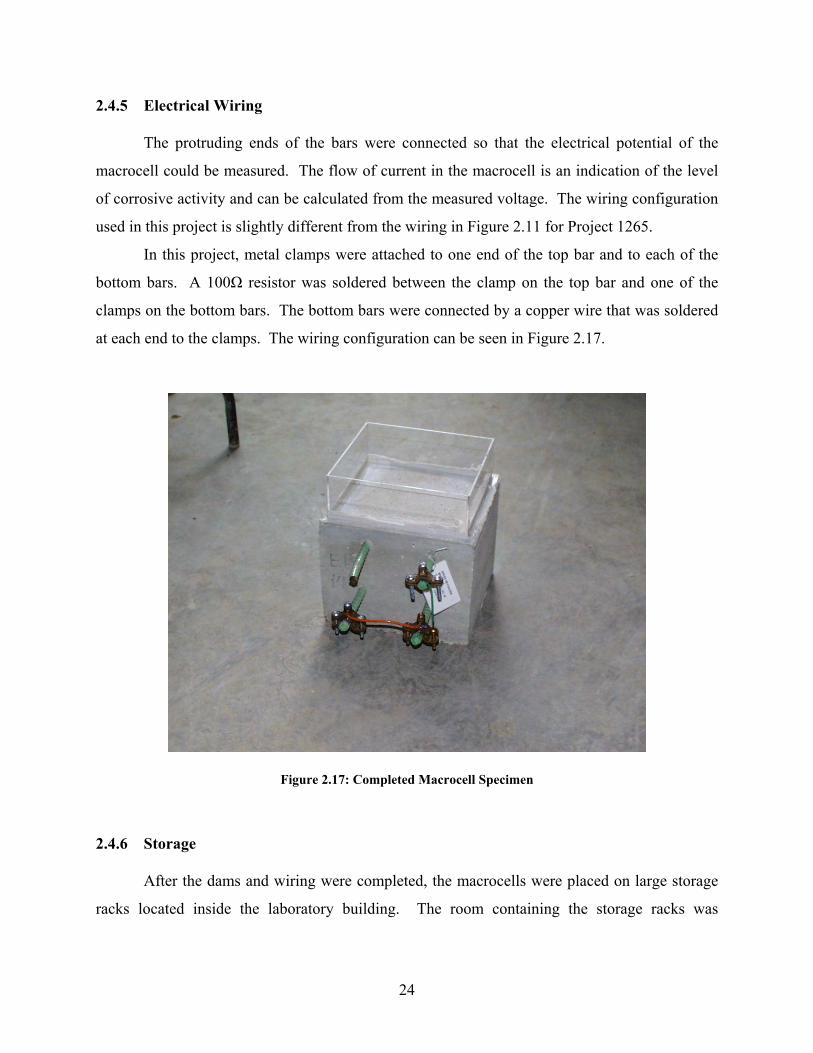
2.4.5 Electrical Wiring
The protruding ends of the bars were connected so that the electrical potential of the
macrocell could be measured. The flow of current in the macrocell is an indication of the level
of corrosive activity and can be calculated from the measured voltage. The wiring configuration
used in this project is slightly different from the wiring in Figure 2.11 for Project 1265.
In this project, metal clamps were attached to one end of the top bar and to each of the
bottom bars. A 100Ω resistor was soldered between the clamp on the top bar and one of the
clamps on the bottom bars. The bottom bars were connected by a copper wire that was soldered
at each end to the clamps. The wiring configuration can be seen in Figure 2.17.
Figure 2.17: Completed Macrocell Specimen
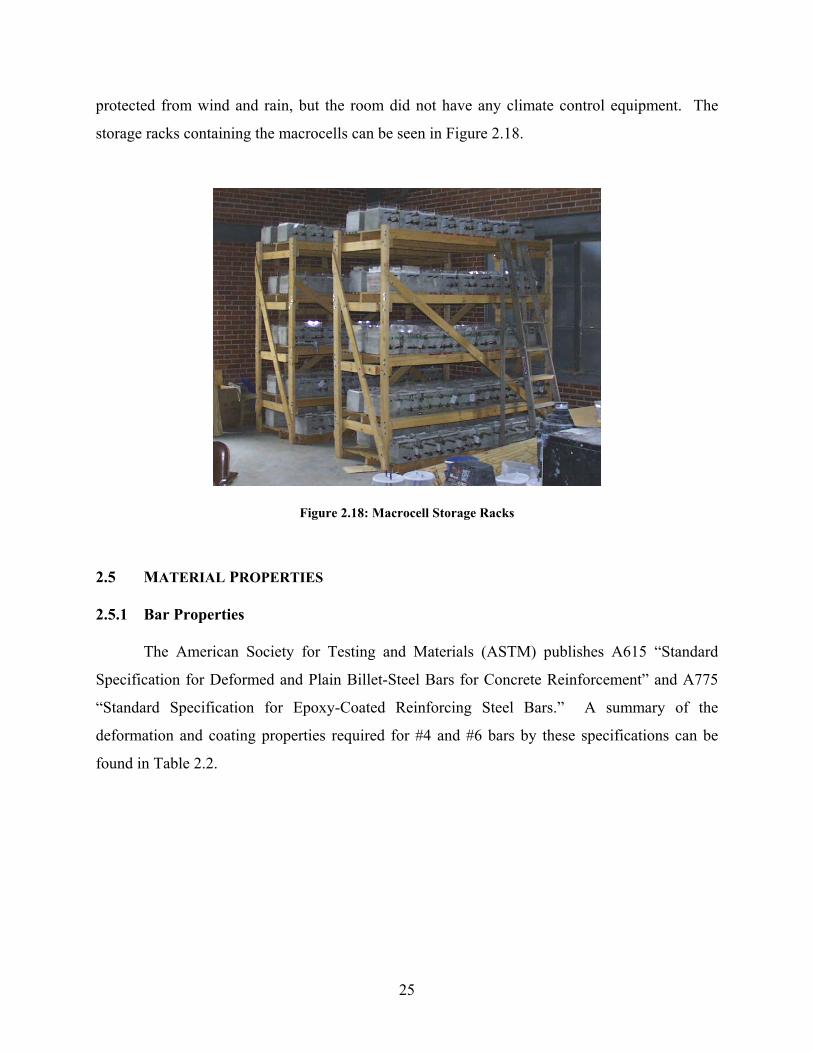
2.4.6 Storage
After the dams and wiring were completed, the macrocells were placed on large storage
racks located inside the laboratory building. The room containing the storage racks was
25
protected from wind and rain, but the room did not have any climate control equipment. The
storage racks containing the macrocells can be seen in Figure 2.18.
Figure 2.18: Macrocell Storage Racks
2.5 MATERIAL PROPERTIES
2.5.1 Bar Properties
The American Society for Testing and Materials (ASTM) publishes A615 “Standard
Specification for Deformed and Plain Billet-Steel Bars for Concrete Reinforcement” and A775
“Standard Specification for Epoxy-Coated Reinforcing Steel Bars.” A summary of the
deformation and coating properties required for #4 and #6 bars by these specifications can be
found in Table 2.2.
26
Table 2.2: ASTM A615 and A775 Requirements
Deformation Requirements (inches)
Epoxy-Coating Requirements
Bar Size Nominal Diameter
(in.)
Minimum Average Spacing
Minimum Average Height
Maximum Gap
Thickness (0.001 in.)
4 0.5 0.350 0.020 0.191 7-12 6 0.75 0.525 0.038 0.286 7-12
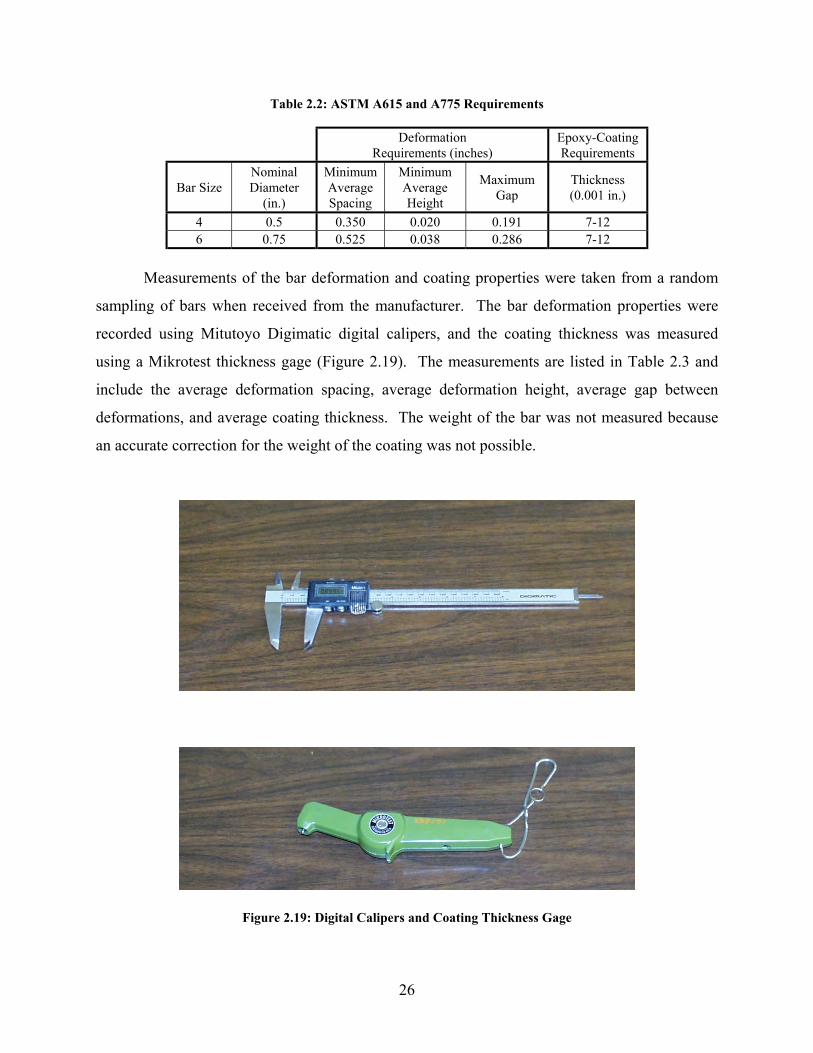
Measurements of the bar deformation and coating properties were taken from a random
sampling of bars when received from the manufacturer. The bar deformation properties were
recorded using Mitutoyo Digimatic digital calipers, and the coating thickness was measured
using a Mikrotest thickness gage (Figure 2.19). The measurements are listed in Table 2.3 and
include the average deformation spacing, average deformation height, average gap between
deformations, and average coating thickness. The weight of the bar was not measured because
an accurate correction for the weight of the coating was not possible.
Figure 2.19: Digital Calipers and Coating Thickness Gage
27
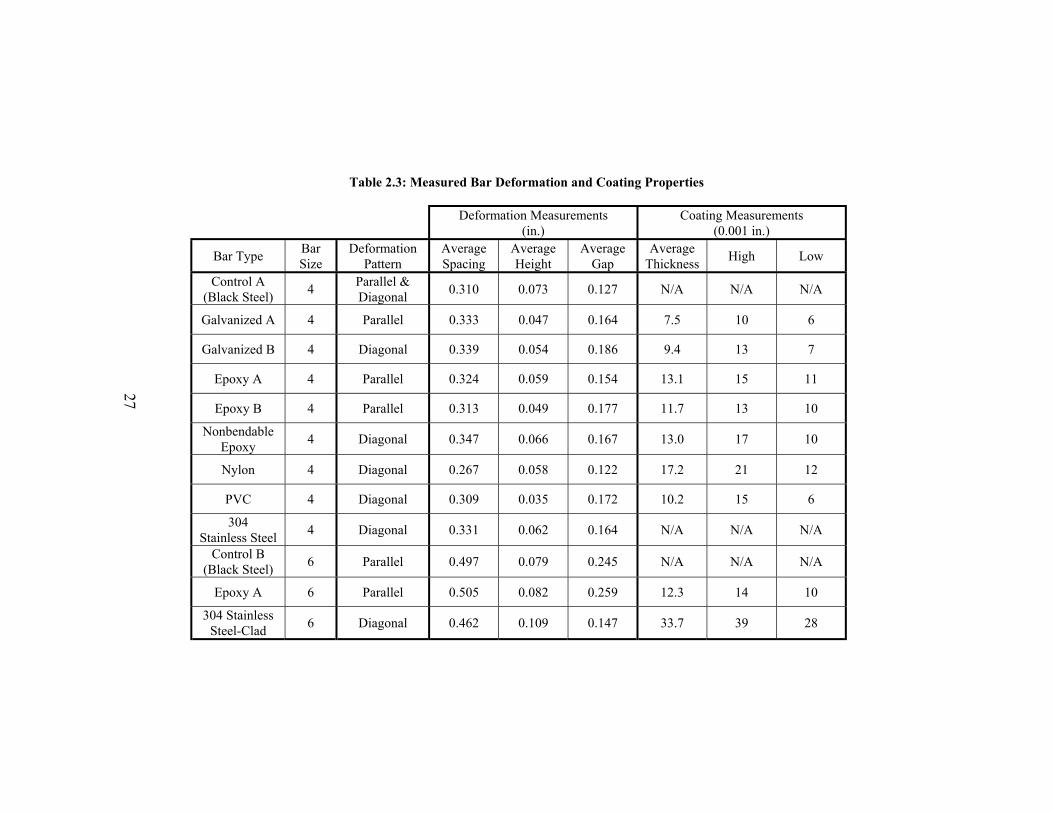
Table 2.3: Measured Bar Deformation and Coating Properties
Deformation Measurements (in.)
Coating Measurements (0.001 in.)
Bar Type Bar Size
Deformation Pattern
Average Spacing
Average Height
Average Gap
Average Thickness High Low
Control A (Black Steel) 4 Parallel &
Diagonal 0.310 0.073 0.127 N/A N/A N/A
Galvanized A 4 Parallel 0.333 0.047 0.164 7.5 10 6
Galvanized B 4 Diagonal 0.339 0.054 0.186 9.4 13 7
Epoxy A 4 Parallel 0.324 0.059 0.154 13.1 15 11
Epoxy B 4 Parallel 0.313 0.049 0.177 11.7 13 10
Nonbendable Epoxy 4 Diagonal 0.347 0.066 0.167 13.0 17 10
Nylon 4 Diagonal 0.267 0.058 0.122 17.2 21 12
PVC 4 Diagonal 0.309 0.035 0.172 10.2 15 6
304 Stainless Steel 4 Diagonal 0.331 0.062 0.164 N/A N/A N/A
Control B (Black Steel) 6 Parallel 0.497 0.079 0.245 N/A N/A N/A
Epoxy A 6 Parallel 0.505 0.082 0.259 12.3 14 10
304 Stainless Steel-Clad 6 Diagonal 0.462 0.109 0.147 33.7 39 28
28
2.5.2 Concrete Properties
As stated above, the concrete for the macrocells was ordered from a local ready-
mix company. A four-sack mix without fly ash and with a water-to-cement ratio of about
0.6 was ordered. There were a few unanticipated modifications to the concrete mix by
the ready-mix company. Fly ash was added to the mix, and the actual water-to-cement
ratio of the concrete was only 0.4. These modifications will increase the durability of the
concrete by decreasing its permeability. No water was added onsite. The concrete batch
data and tested compressive strength are listed in Table 2.4.
Table 2.4: Concrete Batch Data
Maximum Aggregate 3/4 inch Cement 423 lb/cy Water 166 lb/cy
Course Aggregate 1822 lb/cy Fine Aggregate 1340 lb/cy
Fly Ash 99 lb/cy Compressive Strength 7170 psi
Casting of the macrocell specimens took place on July 6, 1999. The weather and
concrete conditions at the time of casting are listed in Table 2.5.
Table 2.5: Conditions during Macrocell Casting
Air Temperature 81º F Relative Humidity 57%
Concrete Temperature 91º F Air Content 8%
Slump 3-4 inches
29
The concrete compressive strength was tested after 28 days. Cylinders of the
concrete were taken before casting, during casting, and after casting. The purpose of
taking these cylinders was to determine if there were significant changes in the concrete
throughout the casting operation. The tested compressive strengths of the concrete are
listed in Table 2.6. The concrete strength was greatest at the beginning of casting with a
compressive strength of approximately 8,000 psi. The concrete strength decreased
during casting and stabilized around 6,700 psi.
Table 2.6: Macrocell Concrete Compressive Strength
Cylinders Compressive Strength (psi) Before Casting 8,030 During Casting 6,620 After Casting 6,860
2.6 EXPERIMENTAL PROGRAM
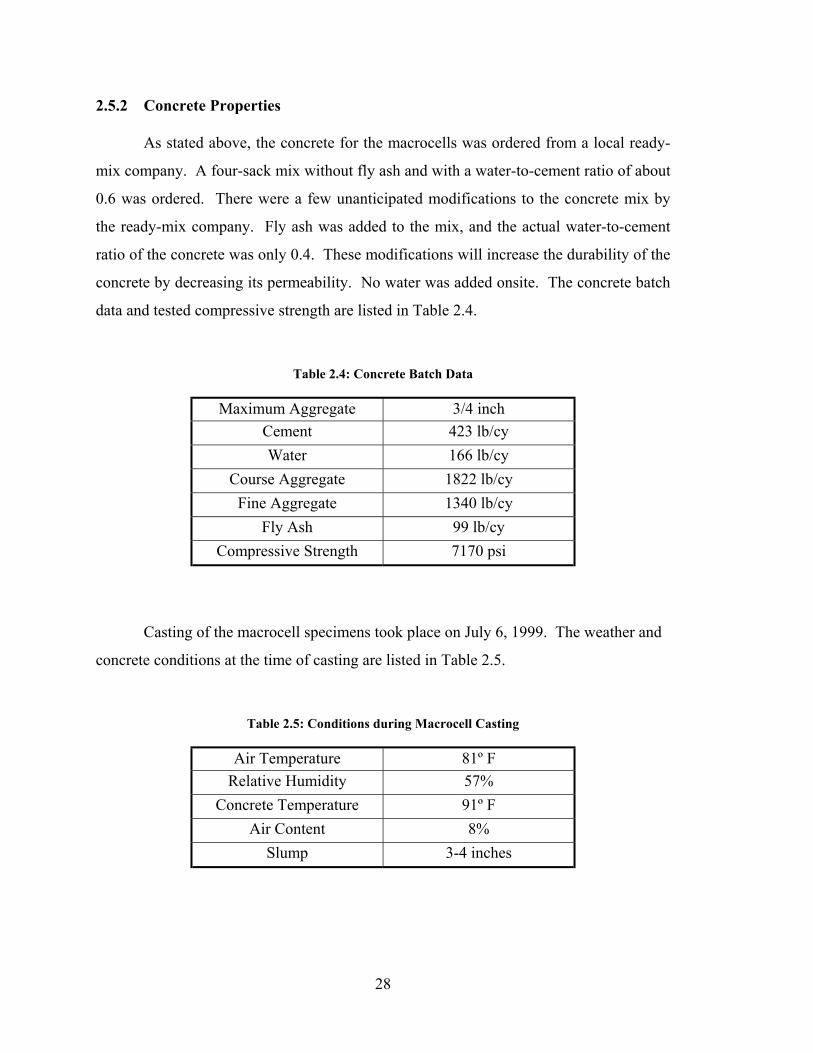
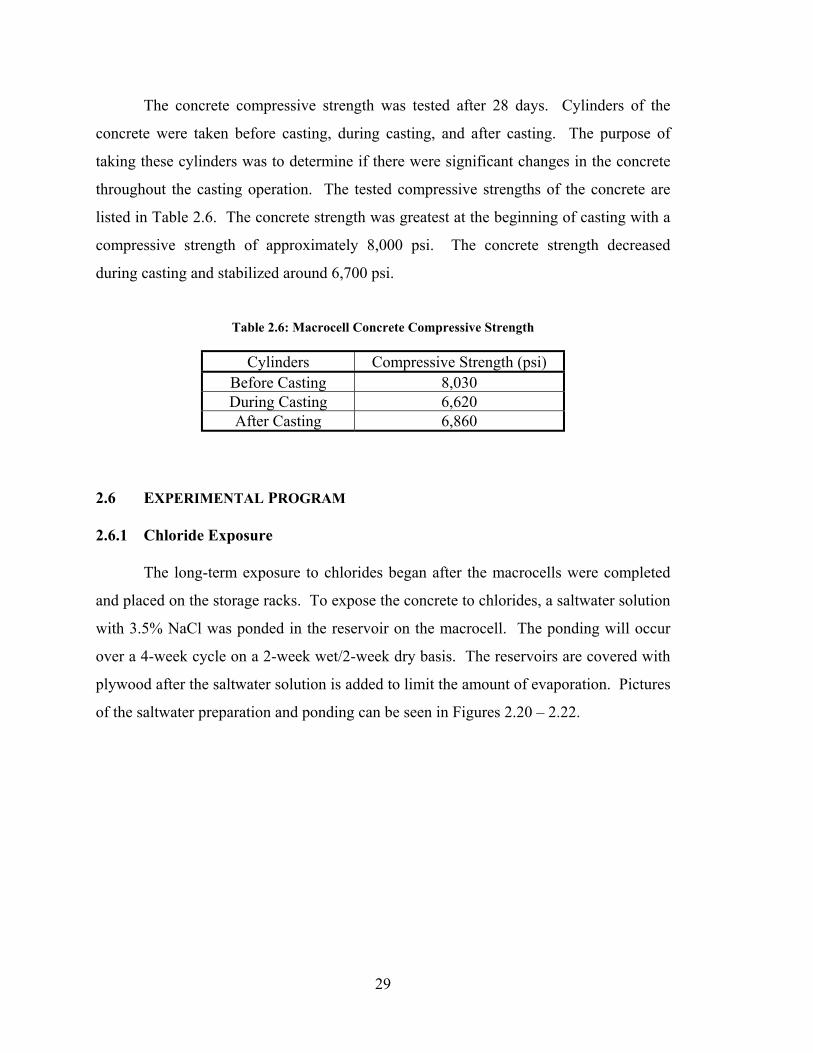
2.6.1 Chloride Exposure
The long-term exposure to chlorides began after the macrocells were completed
and placed on the storage racks. To expose the concrete to chlorides, a saltwater solution
with 3.5% NaCl was ponded in the reservoir on the macrocell. The ponding will occur
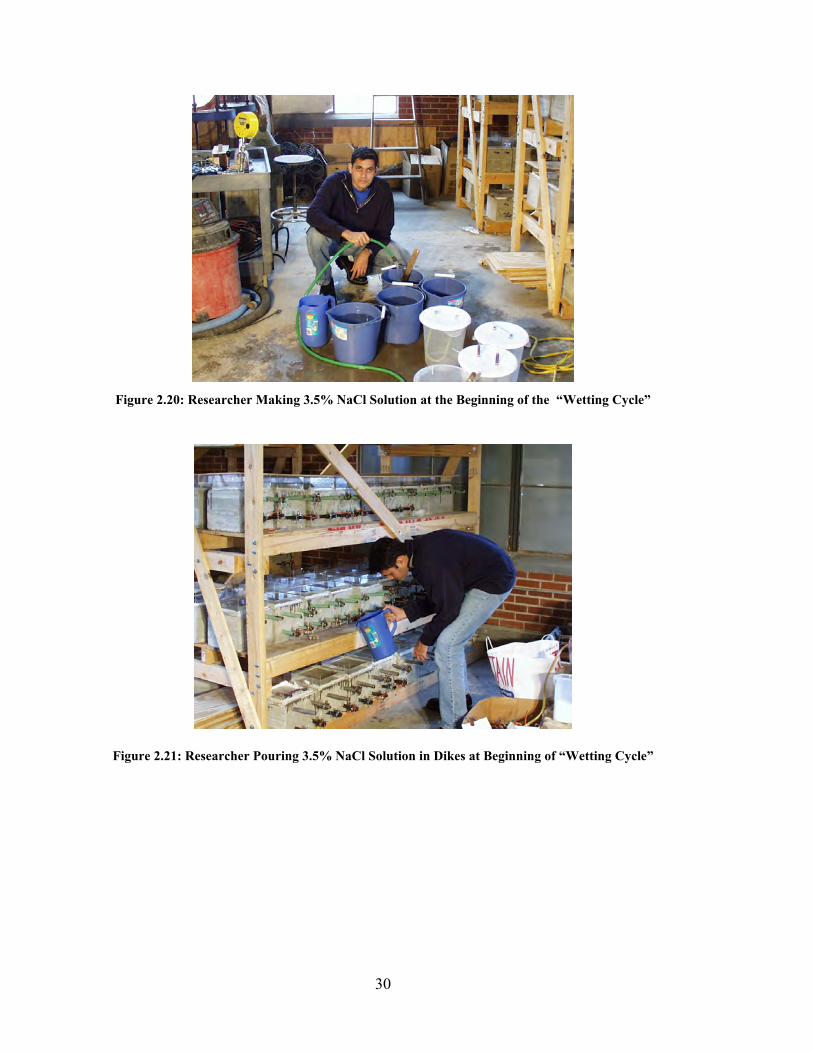
over a 4-week cycle on a 2-week wet/2-week dry basis. The reservoirs are covered with
plywood after the saltwater solution is added to limit the amount of evaporation. Pictures
of the saltwater preparation and ponding can be seen in Figures 2.20 – 2.22.
30
Figure 2.20: Researcher Making 3.5% NaCl Solution at the Beginning of the “Wetting Cycle”
Figure 2.21: Researcher Pouring 3.5% NaCl Solution in Dikes at Beginning of “Wetting Cycle”
31
Figure 2.22: Student Placing Plywood Sheet over Macrocell-Filled Dikes to Minimize Evaporation
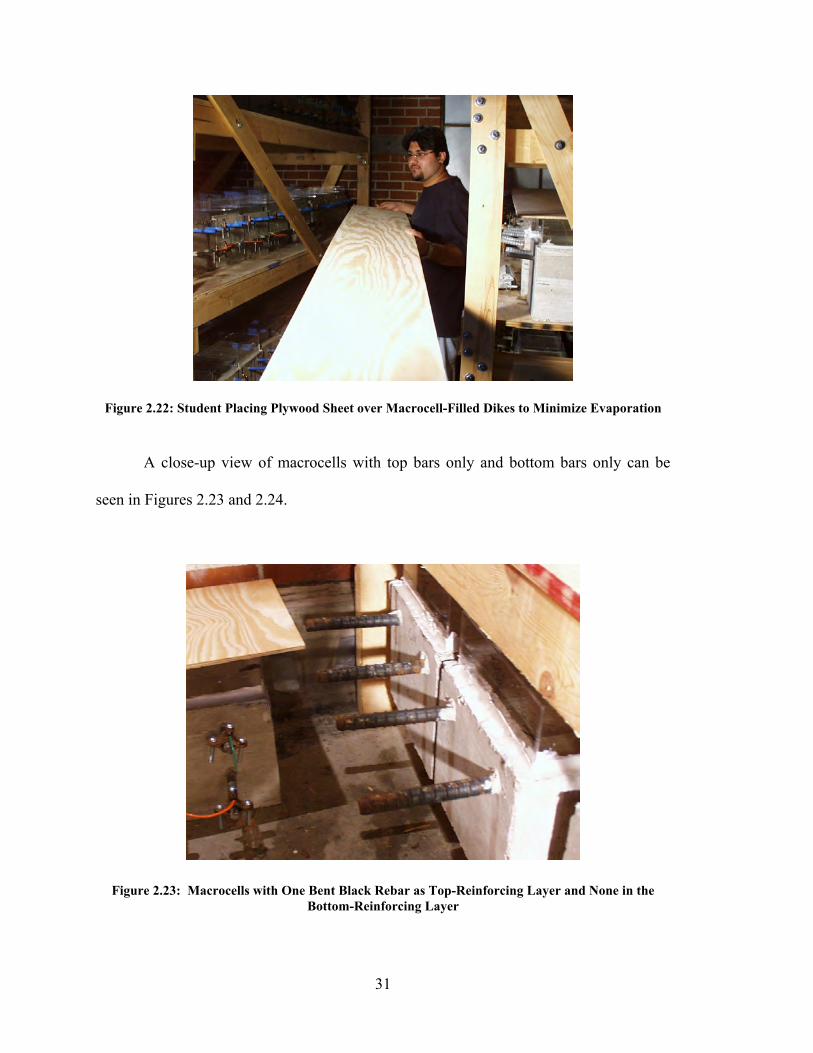
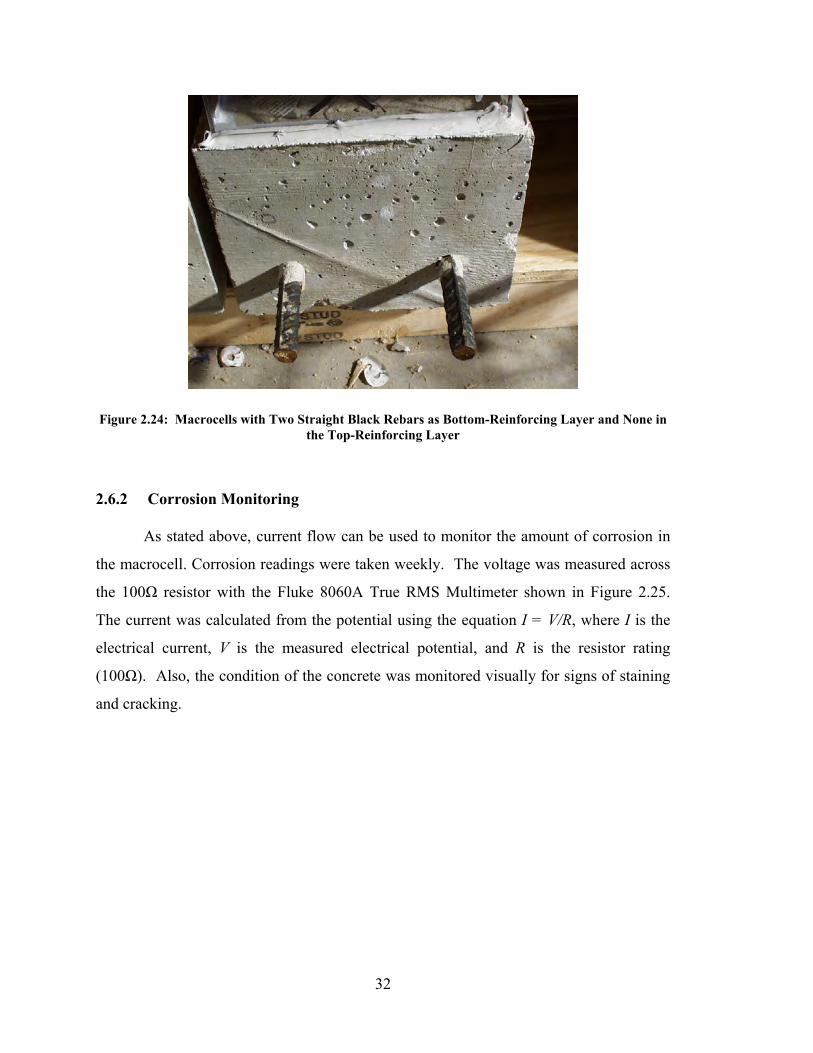
A close-up view of macrocells with top bars only and bottom bars only can be
seen in Figures 2.23 and 2.24.
Figure 2.23: Macrocells with One Bent Black Rebar as Top-Reinforcing Layer and None in the Bottom-Reinforcing Layer
32
Figure 2.24: Macrocells with Two Straight Black Rebars as Bottom-Reinforcing Layer and None in the Top-Reinforcing Layer
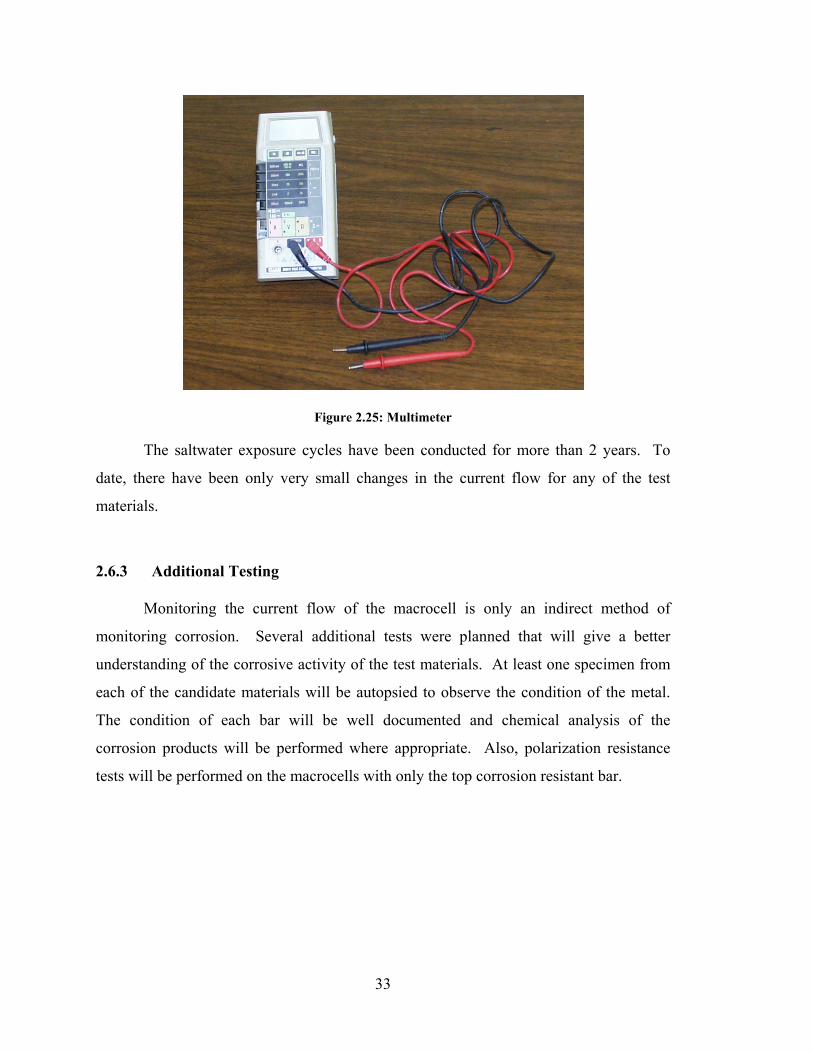
2.6.2 Corrosion Monitoring
As stated above, current flow can be used to monitor the amount of corrosion in
the macrocell. Corrosion readings were taken weekly. The voltage was measured across
the 100Ω resistor with the Fluke 8060A True RMS Multimeter shown in Figure 2.25.
The current was calculated from the potential using the equation I = V/R, where I is the
electrical current, V is the measured electrical potential, and R is the resistor rating
(100Ω). Also, the condition of the concrete was monitored visually for signs of staining
and cracking.
33
Figure 2.25: Multimeter
The saltwater exposure cycles have been conducted for more than 2 years. To
date, there have been only very small changes in the current flow for any of the test
materials.
2.6.3 Additional Testing
Monitoring the current flow of the macrocell is only an indirect method of
monitoring corrosion. Several additional tests were planned that will give a better
understanding of the corrosive activity of the test materials. At least one specimen from
each of the candidate materials will be autopsied to observe the condition of the metal.
The condition of each bar will be well documented and chemical analysis of the
corrosion products will be performed where appropriate. Also, polarization resistance
tests will be performed on the macrocells with only the top corrosion resistant bar.
34
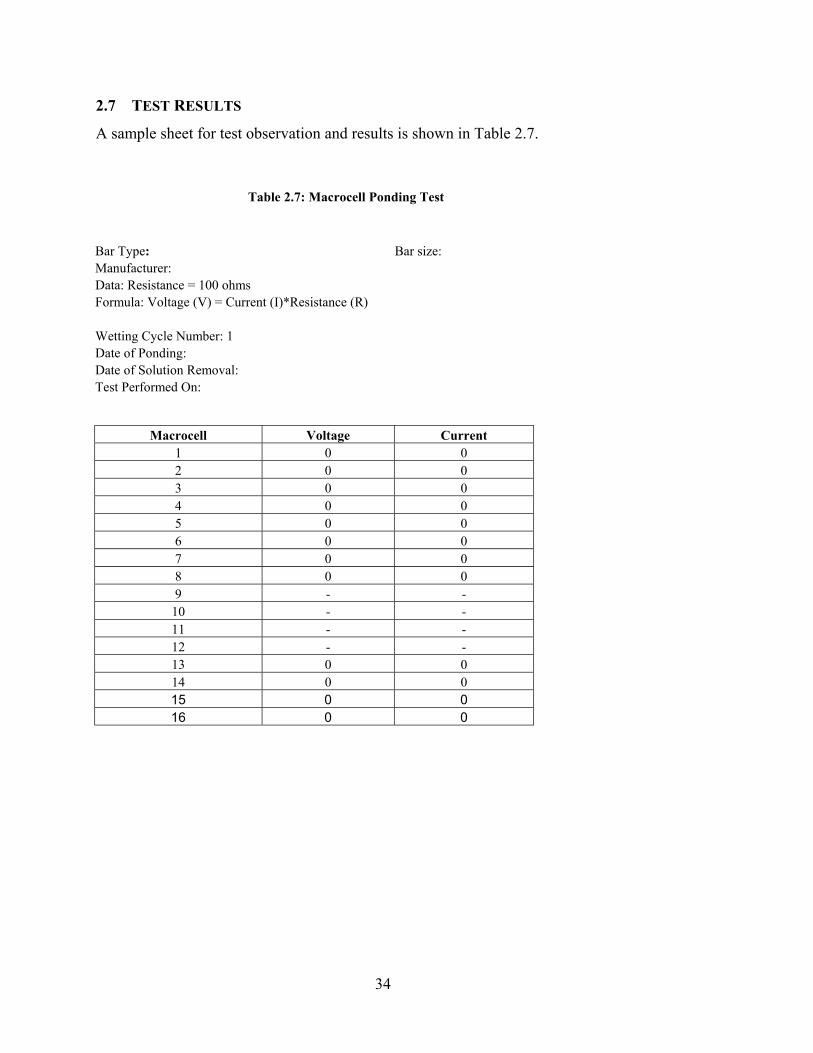
2.7 TEST RESULTS
A sample sheet for test observation and results is shown in Table 2.7.
Table 2.7: Macrocell Ponding Test Bar Type: Bar size: Manufacturer: Data: Resistance = 100 ohms Formula: Voltage (V) = Current (I)*Resistance (R) Wetting Cycle Number: 1 Date of Ponding: Date of Solution Removal: Test Performed On:
Macrocell Voltage Current 1 0 0 2 0 0 3 0 0 4 0 0 5 0 0 6 0 0 7 0 0 8 0 0 9 - -
10 - - 11 - - 12 - - 13 0 0 14 0 0 15 0 0 16 0 0
35
Comments:
• At the time of the initial writing of this report, five wetting-drying cycles were
completed.
• Voltage readings were still zero on all of the rebars.
• According to previous studies (Kahhaleh et al. 1994, Kahhaleh et al. 1994), it
took almost 6 to 7 months to observe some corrosion values for black steel.
Therefore, the onset of corrosion should occur in 6 months or more, because the
quality of the concrete is better.

36
37
Chapter 3:
Corrosion Evaluation Using Polarization Resistance:
Test Principle, Test Results and Discussions
3.1 INTRODUCTION
The polarization resistance (PR) method is useful in both research and engineering
applications. It has some advantages over the other methods, as usually only a few minutes are
required to determine the corrosion rate. The conventional weight-loss methods require several
days or more. PR methods are nondestructive and may be used many times to measure corrosion
rates as a function of time on the same electrode.
3.1.1 History and Description
Early researchers (Davison 1987) observed experimentally that the degree of polarization
at a given applied current was greater for a lower corrosion rate. An apparent linearity was
observed at the origin of the polarization curve for overvoltages up to a few millivolts. Thus, the
slope of this linear curve is inversely proportional to the corrosion rate. The method is sometimes
referred to as the linear polarization method.
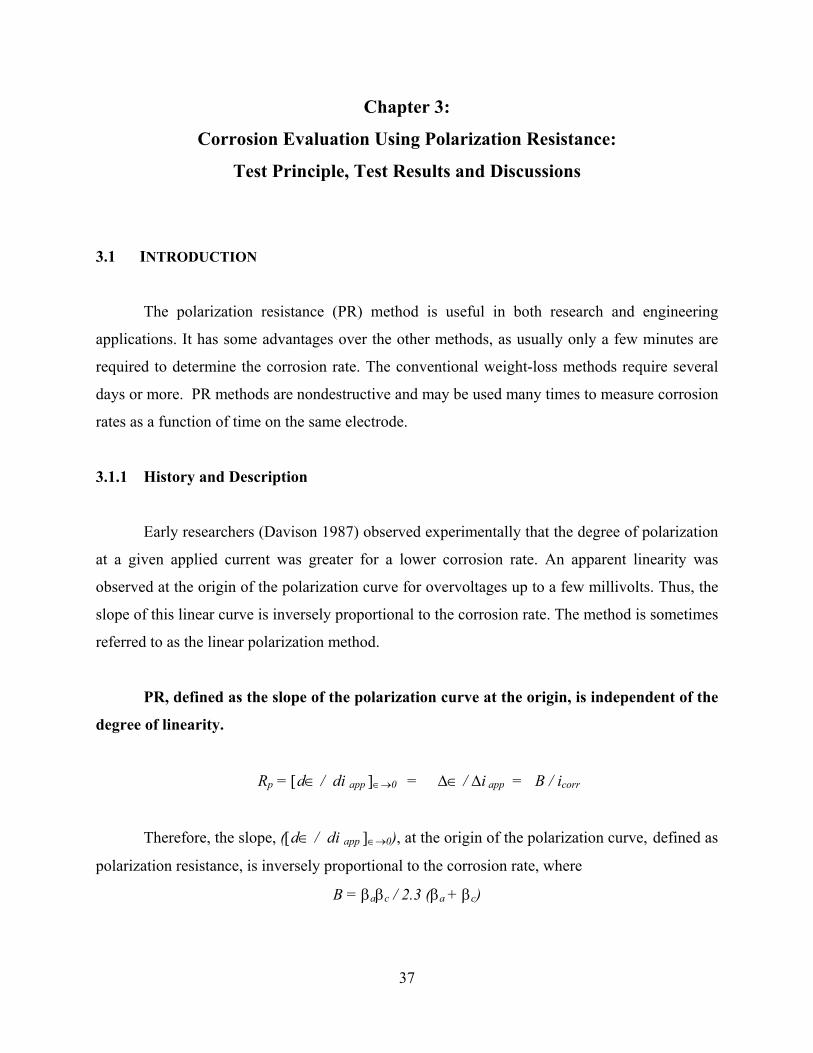
PR, defined as the slope of the polarization curve at the origin, is independent of the
degree of linearity.
Rp = [d∈ / di app ]∈→0 = ∆∈ / ∆i app = B / icorr
Therefore, the slope, ([d∈ / di app ]∈→0), at the origin of the polarization curve, defined as
polarization resistance, is inversely proportional to the corrosion rate, where
B = βaβc / 2.3 (βa + βc)
38
is the proportionality constant. The Tafel constants, βa, the anodic Tafel constant and βc, the
cathodic Tafel constant, can be determined experimentally.
3.1.2 Test Set-Up
Normally, the working electrode (specimen to be tested) is a small button prepared,
cleaned, and polished just 1 hour prior to experimentation. The entire PR test assembly is
designed, keeping in mind the small button specimen (ASTM G5-94 (Reapproved 1999),
Standard Reference Test Method for Making Potentiostatic and Potentiodynamic Anodic
Polarization Measurements) (ASTM G5-94, 1999).
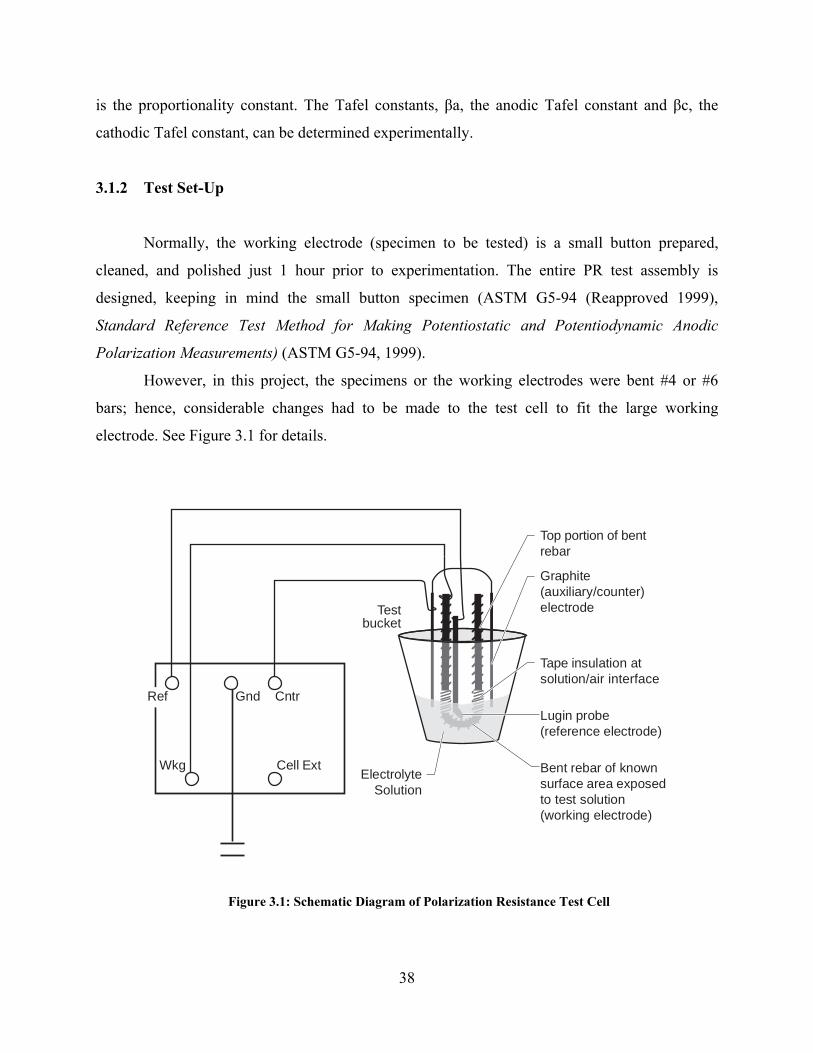
However, in this project, the specimens or the working electrodes were bent #4 or #6
bars; hence, considerable changes had to be made to the test cell to fit the large working
electrode. See Figure 3.1 for details.
Top portion of bentrebar
Graphite(auxiliary/counter)electrode
Lugin probe(reference electrode)
Bent rebar of knownsurface area exposedto test solution(working electrode)
Ref Gnd Cntr
Cell Ext
Testbucket
ElectrolyteSolution
Wkg
Tape insulation atsolution/air interface
Figure 3.1: Schematic Diagram of Polarization Resistance Test Cell
39
3.1.3 Electrolyte / Solution
The PR tests were conducted for a period of 6 days. Electrolytes were used for 2 days
each. For the first 2 days, saturated calcium hydroxide solution was used (1.85 g Ca(OH)2/liter of
water). For the third and fourth days, an additional threshold amount of NaCl was added (0.67 g
NaCl/liter of water). For the fifth and sixth days, more NaCl was added for a total amount of
NaCl present in the test cell of 3.5% (about 35 g NaCl/liter of water). Calcium hydroxide was
used as an electrolyte as it simulates the alkaline pore solution of concrete. A stable passivation
layer may be formed after 2 days of exposure to this electrolyte (Elsener 1991). Sodium chloride
solution was used to simulate the conditions of the real-life concrete structures exposed to
deicing salts.
3.2 TEST PROCEDURE
• A particular rebar specimen was selected to be the working electrode.
• The tip of the working electrode was ground off, if it was a coated rebar, to facilitate
proper electrical connections.
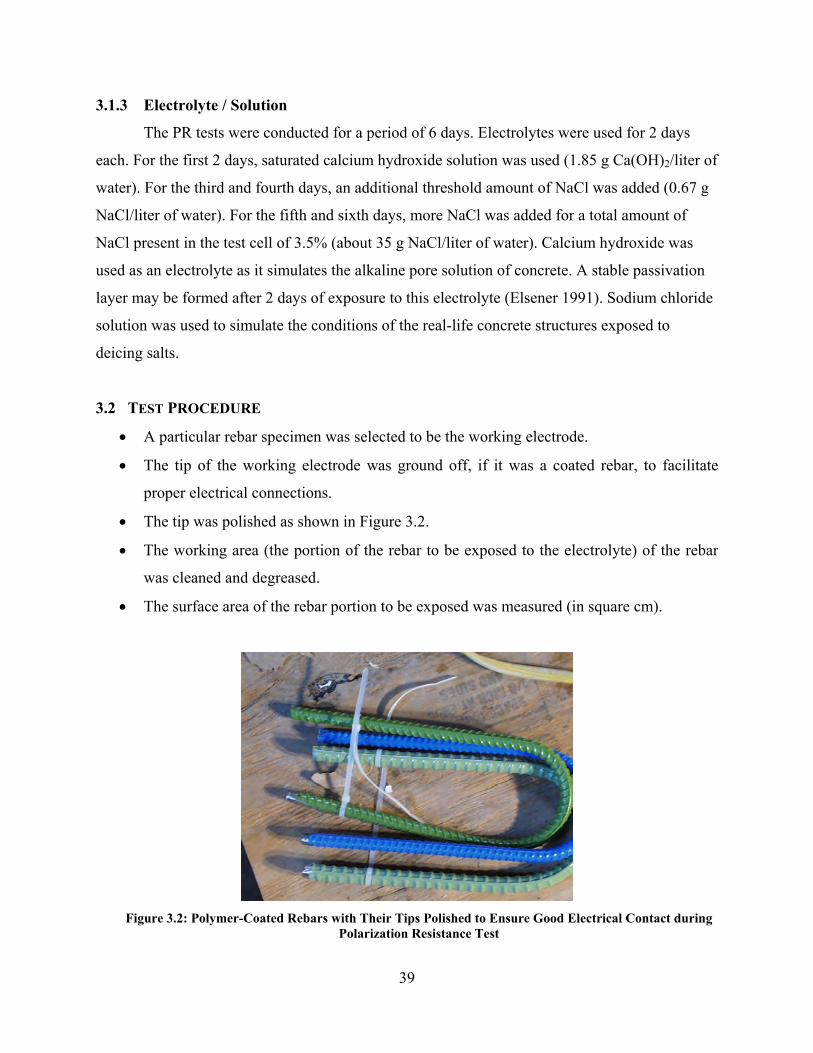
• The tip was polished as shown in Figure 3.2.
• The working area (the portion of the rebar to be exposed to the electrolyte) of the rebar
was cleaned and degreased.
• The surface area of the rebar portion to be exposed was measured (in square cm).
Figure 3.2: Polymer-Coated Rebars with Their Tips Polished to Ensure Good Electrical Contact during
Polarization Resistance Test
40
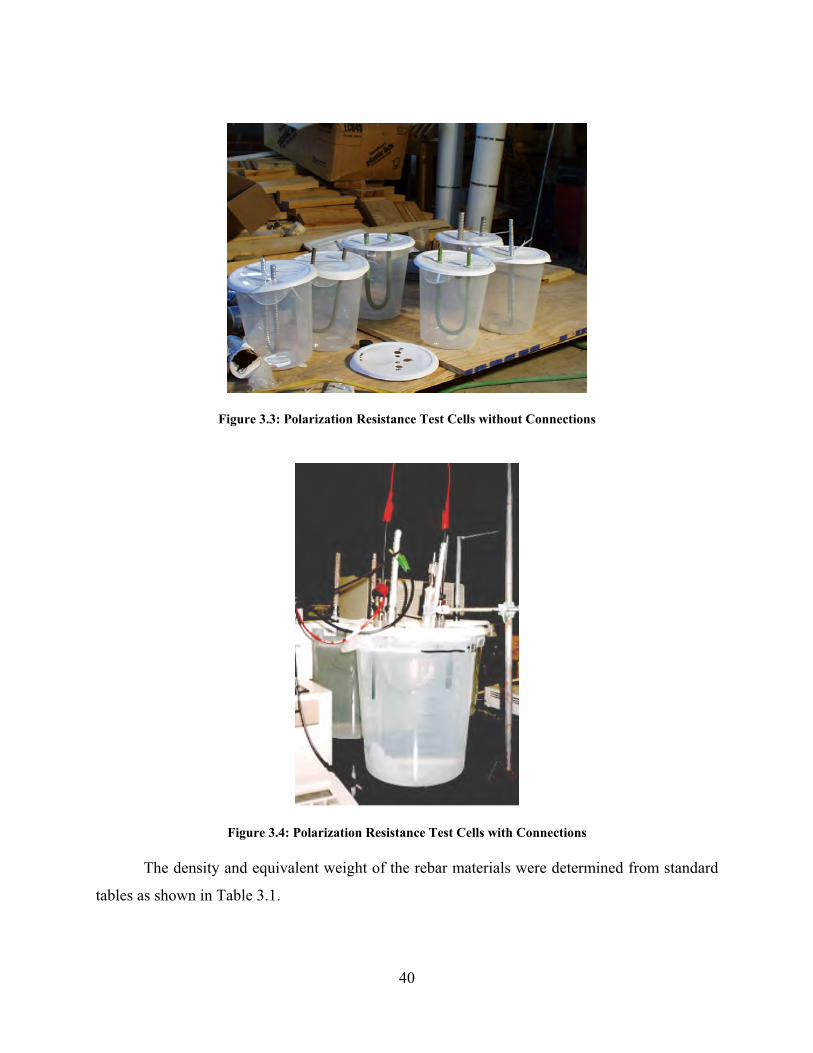
Figure 3.3: Polarization Resistance Test Cells without Connections
Figure 3.4: Polarization Resistance Test Cells with Connections
The density and equivalent weight of the rebar materials were determined from standard
tables as shown in Table 3.1.
41
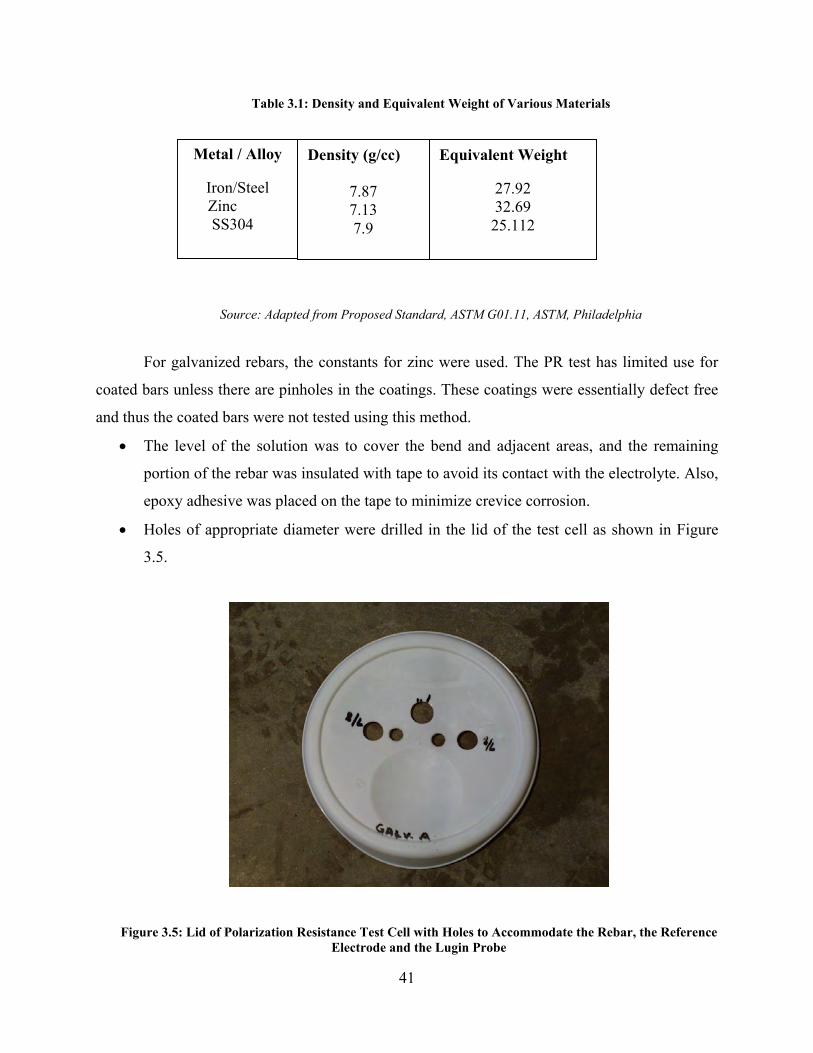
Table 3.1: Density and Equivalent Weight of Various Materials
Source: Adapted from Proposed Standard, ASTM G01.11, ASTM, Philadelphia
For galvanized rebars, the constants for zinc were used. The PR test has limited use for
coated bars unless there are pinholes in the coatings. These coatings were essentially defect free
and thus the coated bars were not tested using this method.
• The level of the solution was to cover the bend and adjacent areas, and the remaining
portion of the rebar was insulated with tape to avoid its contact with the electrolyte. Also,
epoxy adhesive was placed on the tape to minimize crevice corrosion.
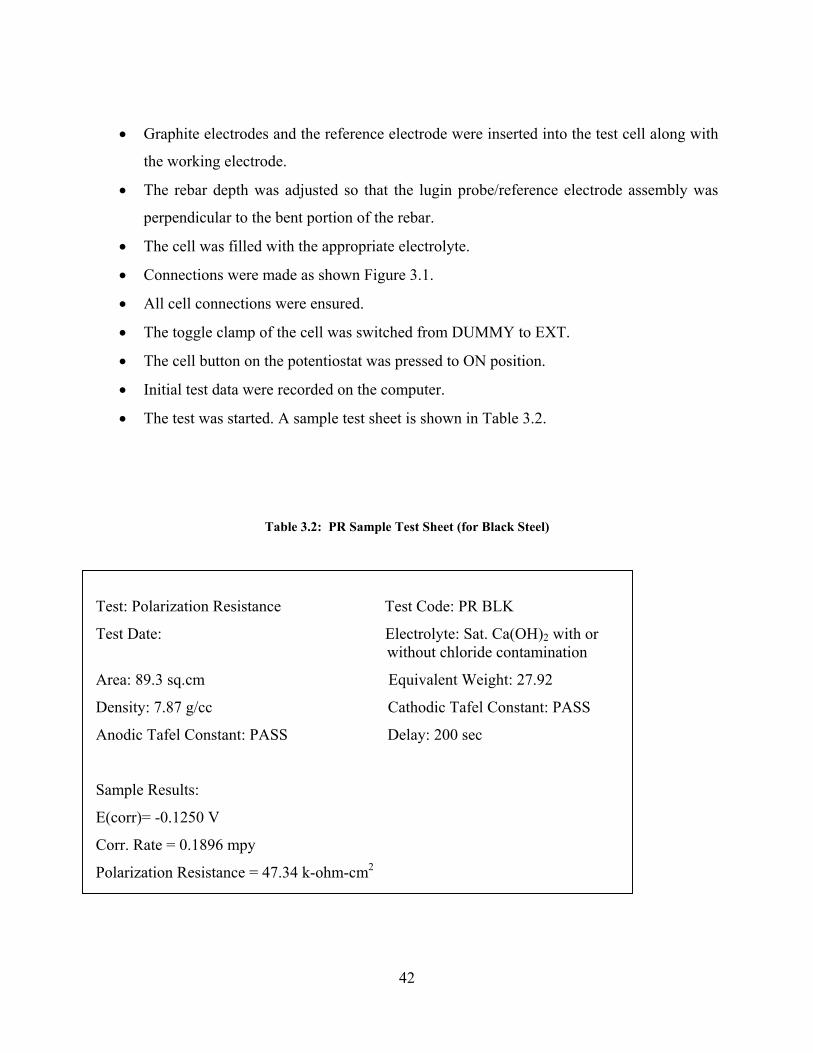
• Holes of appropriate diameter were drilled in the lid of the test cell as shown in Figure
3.5.
Figure 3.5: Lid of Polarization Resistance Test Cell with Holes to Accommodate the Rebar, the Reference Electrode and the Lugin Probe
Metal / Alloy
Iron/Steel Zinc SS304
Density (g/cc)
7.87 7.13 7.9
Equivalent Weight
27.92 32.69 25.112
42
• Graphite electrodes and the reference electrode were inserted into the test cell along with
the working electrode.
• The rebar depth was adjusted so that the lugin probe/reference electrode assembly was
perpendicular to the bent portion of the rebar.
• The cell was filled with the appropriate electrolyte.
• Connections were made as shown Figure 3.1.
• All cell connections were ensured.
• The toggle clamp of the cell was switched from DUMMY to EXT.
• The cell button on the potentiostat was pressed to ON position.
• Initial test data were recorded on the computer.
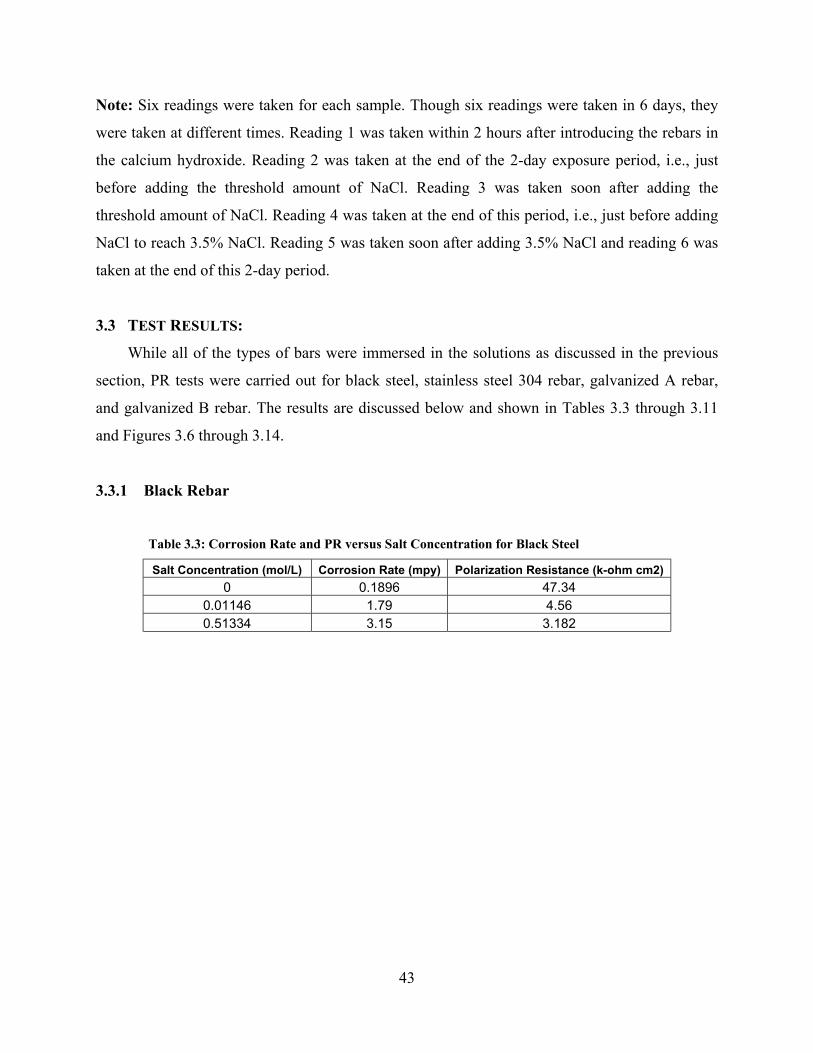
• The test was started. A sample test sheet is shown in Table 3.2.
Table 3.2: PR Sample Test Sheet (for Black Steel)
Test: Polarization Resistance Test Code: PR BLK
Test Date: Electrolyte: Sat. Ca(OH)2 with or without chloride contamination
Area: 89.3 sq.cm Equivalent Weight: 27.92
Density: 7.87 g/cc Cathodic Tafel Constant: PASS
Anodic Tafel Constant: PASS Delay: 200 sec
Sample Results:
E(corr)= -0.1250 V
Corr. Rate = 0.1896 mpy
Polarization Resistance = 47.34 k-ohm-cm2
43
Note: Six readings were taken for each sample. Though six readings were taken in 6 days, they
were taken at different times. Reading 1 was taken within 2 hours after introducing the rebars in
the calcium hydroxide. Reading 2 was taken at the end of the 2-day exposure period, i.e., just
before adding the threshold amount of NaCl. Reading 3 was taken soon after adding the
threshold amount of NaCl. Reading 4 was taken at the end of this period, i.e., just before adding
NaCl to reach 3.5% NaCl. Reading 5 was taken soon after adding 3.5% NaCl and reading 6 was
taken at the end of this 2-day period.
3.3 TEST RESULTS:
While all of the types of bars were immersed in the solutions as discussed in the previous
section, PR tests were carried out for black steel, stainless steel 304 rebar, galvanized A rebar,
and galvanized B rebar. The results are discussed below and shown in Tables 3.3 through 3.11
and Figures 3.6 through 3.14.
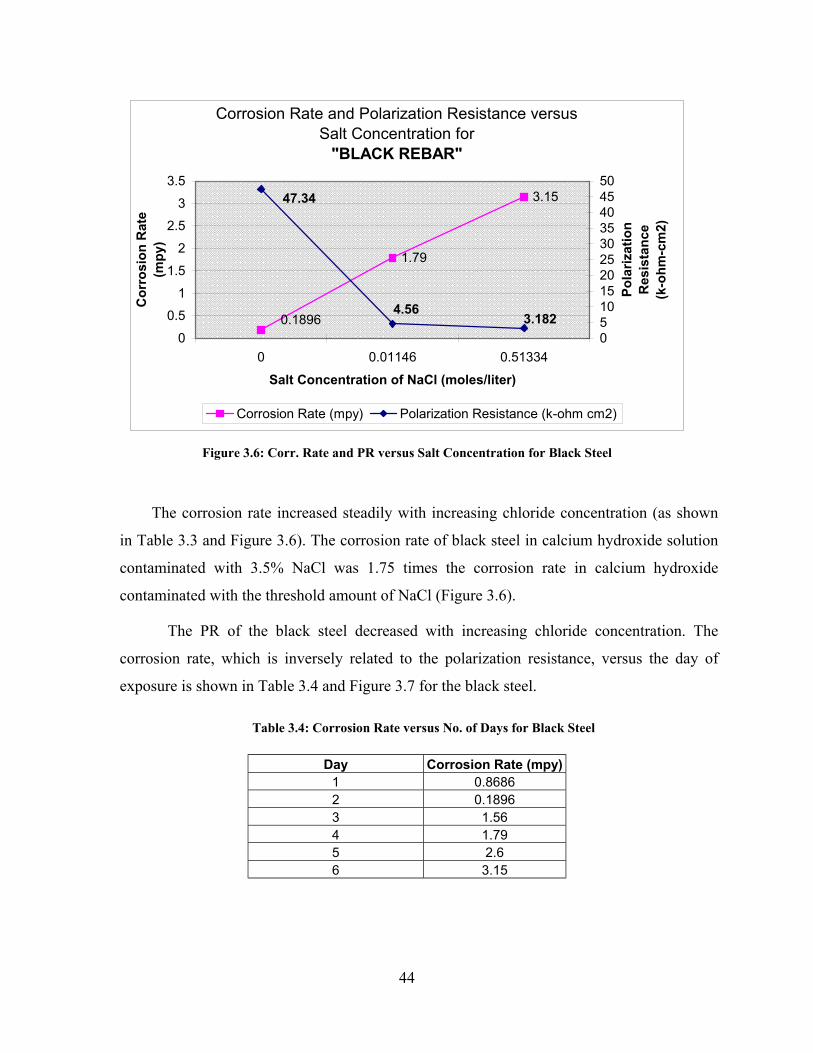
3.3.1 Black Rebar
Table 3.3: Corrosion Rate and PR versus Salt Concentration for Black Steel
Salt Concentration (mol/L) Corrosion Rate (mpy) Polarization Resistance (k-ohm cm2) 0 0.1896 47.34
0.01146 1.79 4.56 0.51334 3.15 3.182
44
Corrosion Rate and Polarization Resistance versus Salt Concentration for
"BLACK REBAR"
1.79
3.15
0.1896 3.1824.56
47.34
00.5
11.5
22.5
33.5
0 0.01146 0.51334
Salt Concentration of NaCl (moles/liter)
Cor
rosi
on R
ate
(mpy
)
05101520253035404550
Pola
rizat
ion
Res
ista
nce
(k-o
hm-c
m2)
Corrosion Rate (mpy) Polarization Resistance (k-ohm cm2)
Figure 3.6: Corr. Rate and PR versus Salt Concentration for Black Steel
The corrosion rate increased steadily with increasing chloride concentration (as shown
in Table 3.3 and Figure 3.6). The corrosion rate of black steel in calcium hydroxide solution
contaminated with 3.5% NaCl was 1.75 times the corrosion rate in calcium hydroxide
contaminated with the threshold amount of NaCl (Figure 3.6).
The PR of the black steel decreased with increasing chloride concentration. The
corrosion rate, which is inversely related to the polarization resistance, versus the day of
exposure is shown in Table 3.4 and Figure 3.7 for the black steel.
Table 3.4: Corrosion Rate versus No. of Days for Black Steel
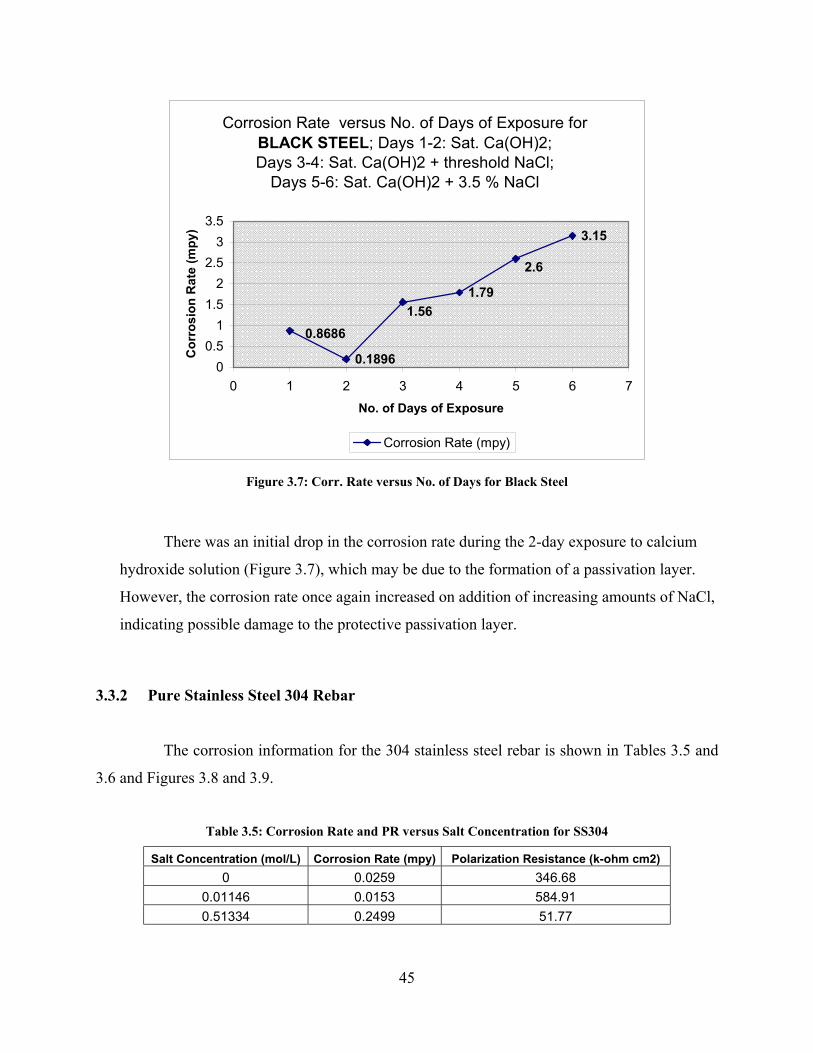
Day Corrosion Rate (mpy) 1 0.8686 2 0.1896 3 1.56 4 1.79 5 2.6 6 3.15
45
Corrosion Rate versus No. of Days of Exposure for BLACK STEEL; Days 1-2: Sat. Ca(OH)2; Days 3-4: Sat. Ca(OH)2 + threshold NaCl;
Days 5-6: Sat. Ca(OH)2 + 3.5 % NaCl
0.1896
1.79
3.15
0.8686
2.6
1.56
00.5
11.5
22.5
33.5
0 1 2 3 4 5 6 7No. of Days of Exposure
Cor
rosi
on R
ate
(mpy
)
Corrosion Rate (mpy)
Figure 3.7: Corr. Rate versus No. of Days for Black Steel
There was an initial drop in the corrosion rate during the 2-day exposure to calcium
hydroxide solution (Figure 3.7), which may be due to the formation of a passivation layer.
However, the corrosion rate once again increased on addition of increasing amounts of NaCl,
indicating possible damage to the protective passivation layer.
3.3.2 Pure Stainless Steel 304 Rebar
The corrosion information for the 304 stainless steel rebar is shown in Tables 3.5 and
3.6 and Figures 3.8 and 3.9.
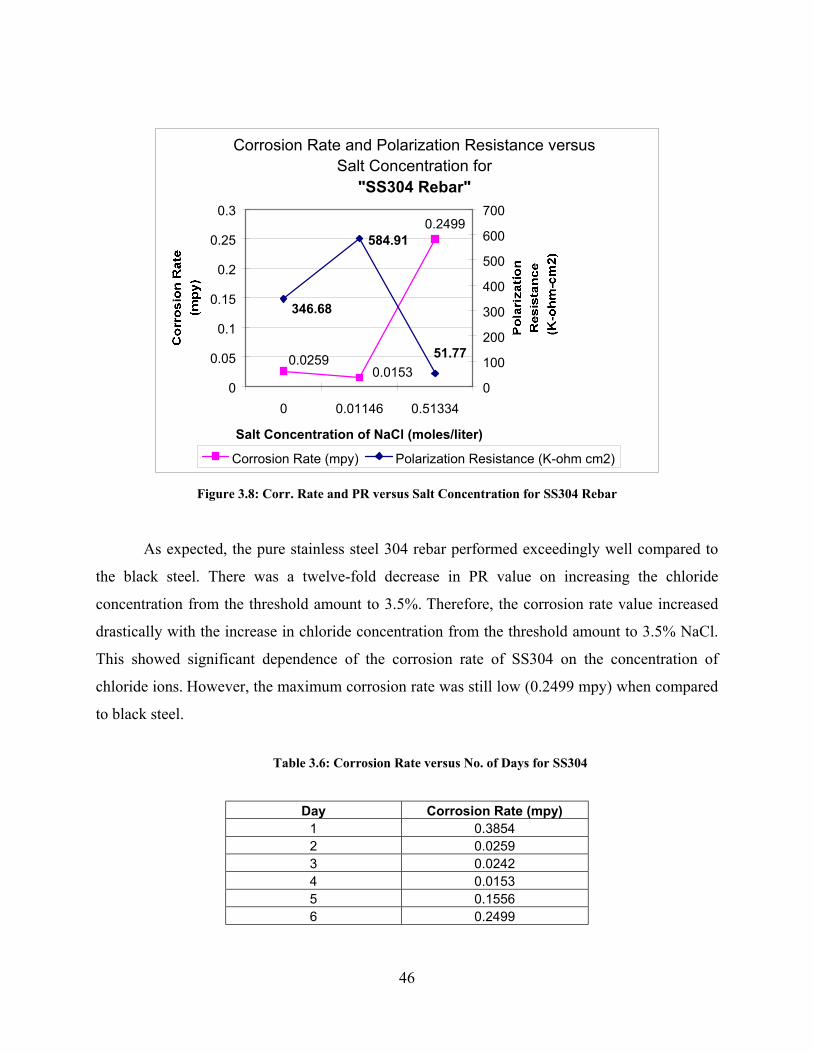
Table 3.5: Corrosion Rate and PR versus Salt Concentration for SS304
Salt Concentration (mol/L) Corrosion Rate (mpy) Polarization Resistance (k-ohm cm2) 0 0.0259 346.68
0.01146 0.0153 584.91 0.51334 0.2499 51.77
46
Corrosion Rate and Polarization Resistance versus Salt Concentration for
"SS304 Rebar"
0.2499
0.02590.0153
584.91
51.77
346.68
0
0.05
0.1
0.15
0.2
0.25
0.3
0 0.01146 0.51334
Salt Concentration of NaCl (moles/liter)
0
100
200
300
400
500
600
700
Corrosion Rate (mpy) Polarization Resistance (K-ohm cm2)
Figure 3.8: Corr. Rate and PR versus Salt Concentration for SS304 Rebar
As expected, the pure stainless steel 304 rebar performed exceedingly well compared to
the black steel. There was a twelve-fold decrease in PR value on increasing the chloride
concentration from the threshold amount to 3.5%. Therefore, the corrosion rate value increased
drastically with the increase in chloride concentration from the threshold amount to 3.5% NaCl.
This showed significant dependence of the corrosion rate of SS304 on the concentration of
chloride ions. However, the maximum corrosion rate was still low (0.2499 mpy) when compared
to black steel.
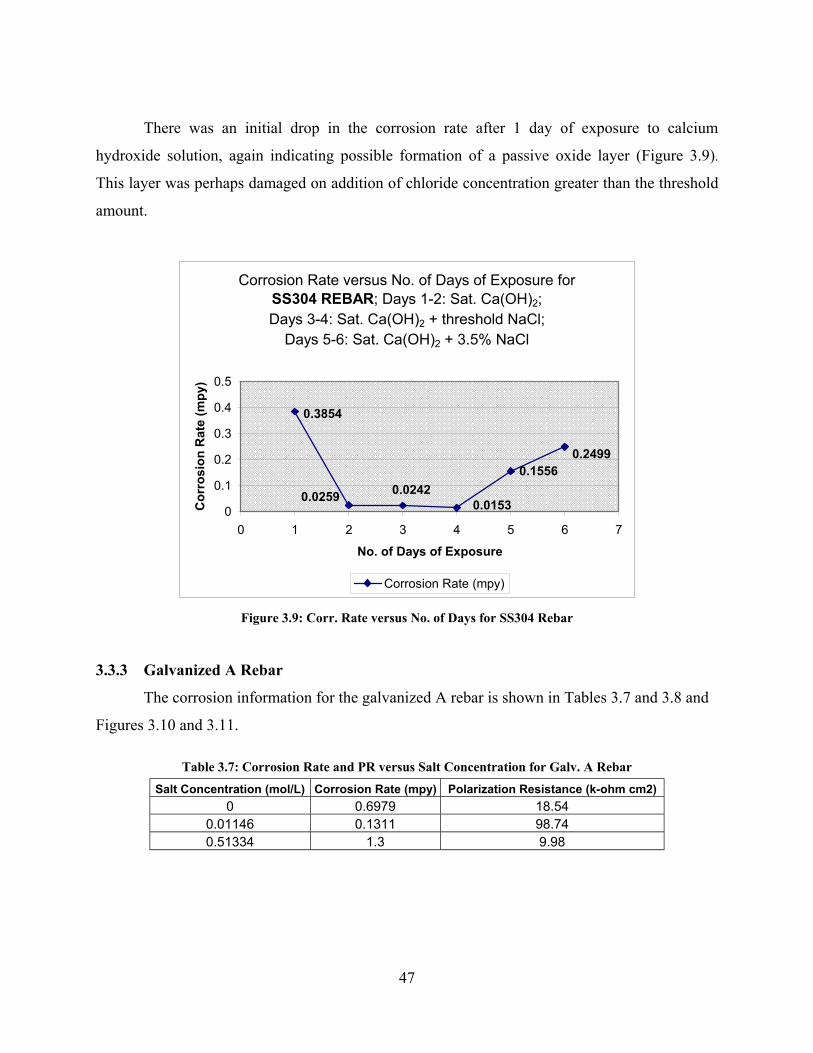
Table 3.6: Corrosion Rate versus No. of Days for SS304
Day Corrosion Rate (mpy) 1 0.3854 2 0.0259 3 0.0242 4 0.0153 5 0.1556 6 0.2499
47
There was an initial drop in the corrosion rate after 1 day of exposure to calcium
hydroxide solution, again indicating possible formation of a passive oxide layer (Figure 3.9).
This layer was perhaps damaged on addition of chloride concentration greater than the threshold
amount.
Corrosion Rate versus No. of Days of Exposure for SS304 REBAR; Days 1-2: Sat. Ca(OH)2; Days 3-4: Sat. Ca(OH)2 + threshold NaCl;
Days 5-6: Sat. Ca(OH)2 + 3.5% NaCl
0.1556
0.0259 0.02420.0153
0.3854
0.2499
0
0.1
0.2
0.3
0.4
0.5
0 1 2 3 4 5 6 7
No. of Days of Exposure
Cor
rosi
on R
ate
(mpy
)
Corrosion Rate (mpy)
Figure 3.9: Corr. Rate versus No. of Days for SS304 Rebar
3.3.3 Galvanized A Rebar
The corrosion information for the galvanized A rebar is shown in Tables 3.7 and 3.8 and
Figures 3.10 and 3.11.
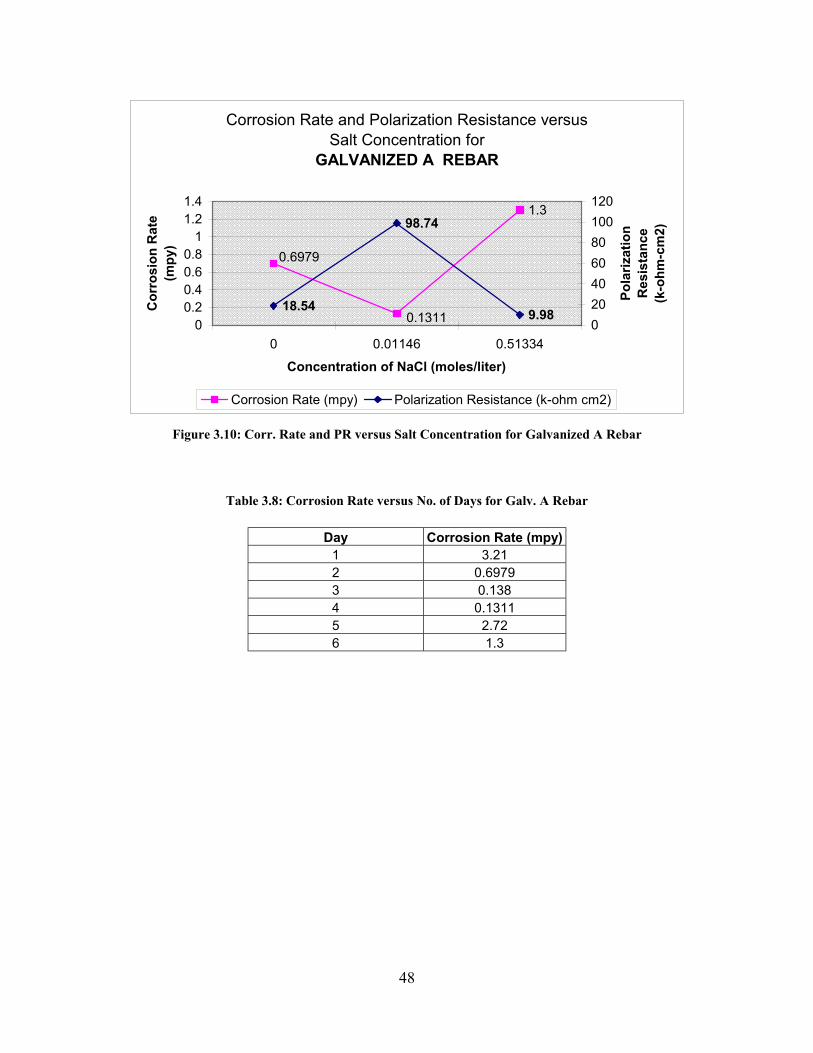
Table 3.7: Corrosion Rate and PR versus Salt Concentration for Galv. A Rebar
Salt Concentration (mol/L) Corrosion Rate (mpy) Polarization Resistance (k-ohm cm2) 0 0.6979 18.54
0.01146 0.1311 98.74 0.51334 1.3 9.98
48
Corrosion Rate and Polarization Resistance versus Salt Concentration for
GALVANIZED A REBAR
1.3
0.6979
0.131118.54
98.74
9.980
0.20.40.60.8
11.21.4
0 0.01146 0.51334
Concentration of NaCl (moles/liter)
Cor
rosi
on R
ate
(mpy
)
020406080100120
Pola
rizat
ion
Res
ista
nce
(k-o
hm-c
m2)
Corrosion Rate (mpy) Polarization Resistance (k-ohm cm2)
Figure 3.10: Corr. Rate and PR versus Salt Concentration for Galvanized A Rebar
Table 3.8: Corrosion Rate versus No. of Days for Galv. A Rebar
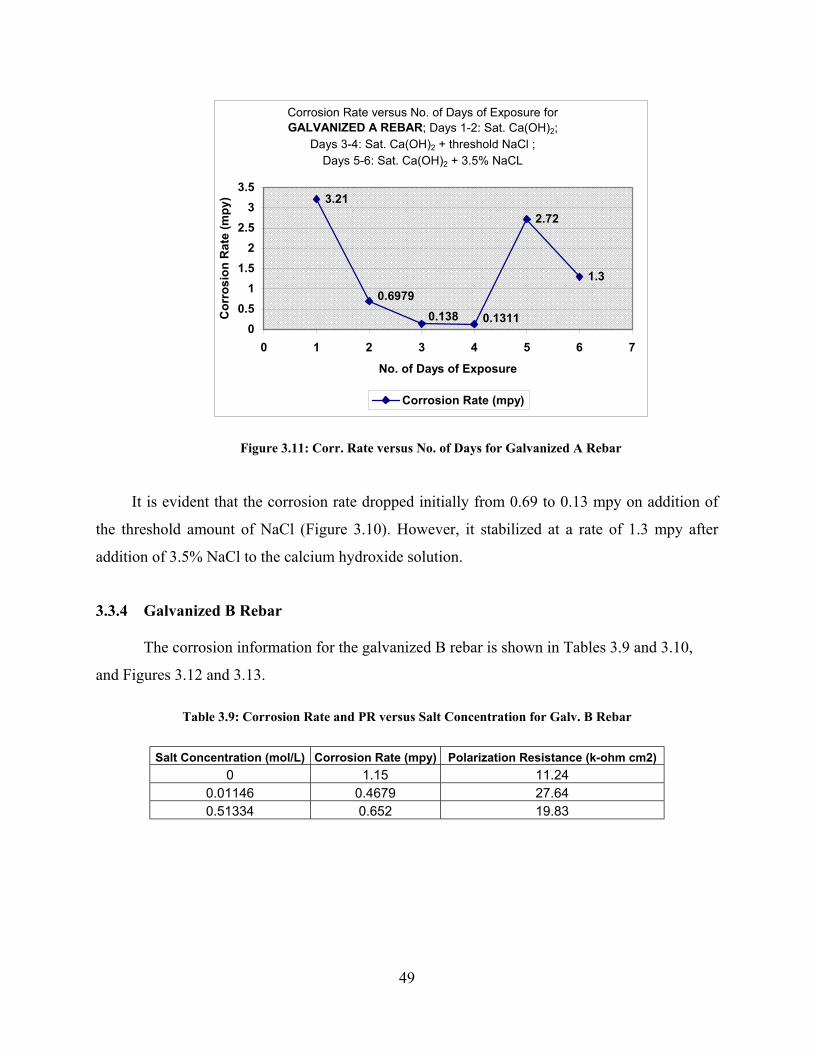
Day Corrosion Rate (mpy) 1 3.21 2 0.6979 3 0.138 4 0.1311 5 2.72 6 1.3
49
Corrosion Rate versus No. of Days of Exposure for GALVANIZED A REBAR; Days 1-2: Sat. Ca(OH)2;
Days 3-4: Sat. Ca(OH)2 + threshold NaCl ; Days 5-6: Sat. Ca(OH)2 + 3.5% NaCL
3.212.72
1.30.6979
0.138 0.13110
0.51
1.52
2.53
3.5
0 1 2 3 4 5 6 7
No. of Days of Exposure
Cor
rosi
on R
ate
(mpy
)
Corrosion Rate (mpy)
Figure 3.11: Corr. Rate versus No. of Days for Galvanized A Rebar
It is evident that the corrosion rate dropped initially from 0.69 to 0.13 mpy on addition of
the threshold amount of NaCl (Figure 3.10). However, it stabilized at a rate of 1.3 mpy after
addition of 3.5% NaCl to the calcium hydroxide solution.
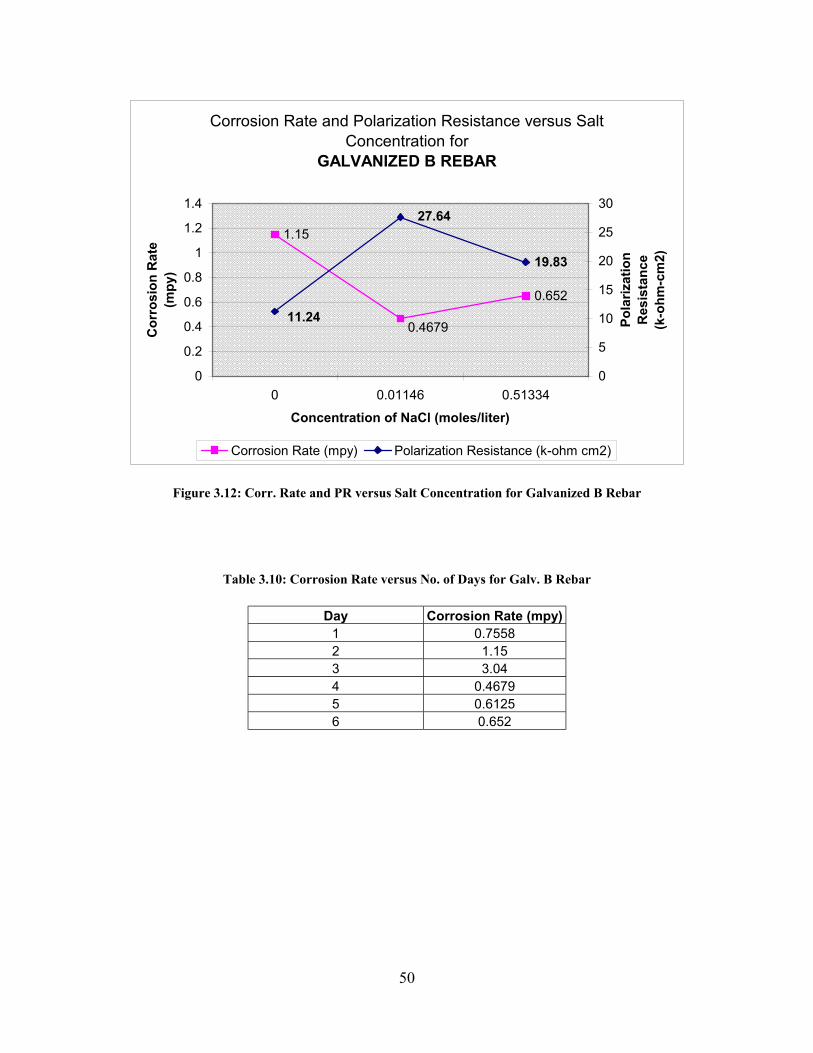
3.3.4 Galvanized B Rebar
The corrosion information for the galvanized B rebar is shown in Tables 3.9 and 3.10,
and Figures 3.12 and 3.13.
Table 3.9: Corrosion Rate and PR versus Salt Concentration for Galv. B Rebar
Salt Concentration (mol/L) Corrosion Rate (mpy) Polarization Resistance (k-ohm cm2) 0 1.15 11.24
0.01146 0.4679 27.64 0.51334 0.652 19.83
50
Corrosion Rate and Polarization Resistance versus Salt Concentration for
GALVANIZED B REBAR
1.15
0.652
0.4679
19.83
27.64
11.24
0
0.2
0.4
0.6
0.8
1
1.2
1.4
0 0.01146 0.51334
Concentration of NaCl (moles/liter)
Cor
rosi
on R
ate
(mpy
)
0
5
10
15
20
25
30
Pola
rizat
ion
Res
ista
nce
(k-o
hm-c
m2)
Corrosion Rate (mpy) Polarization Resistance (k-ohm cm2)
Figure 3.12: Corr. Rate and PR versus Salt Concentration for Galvanized B Rebar
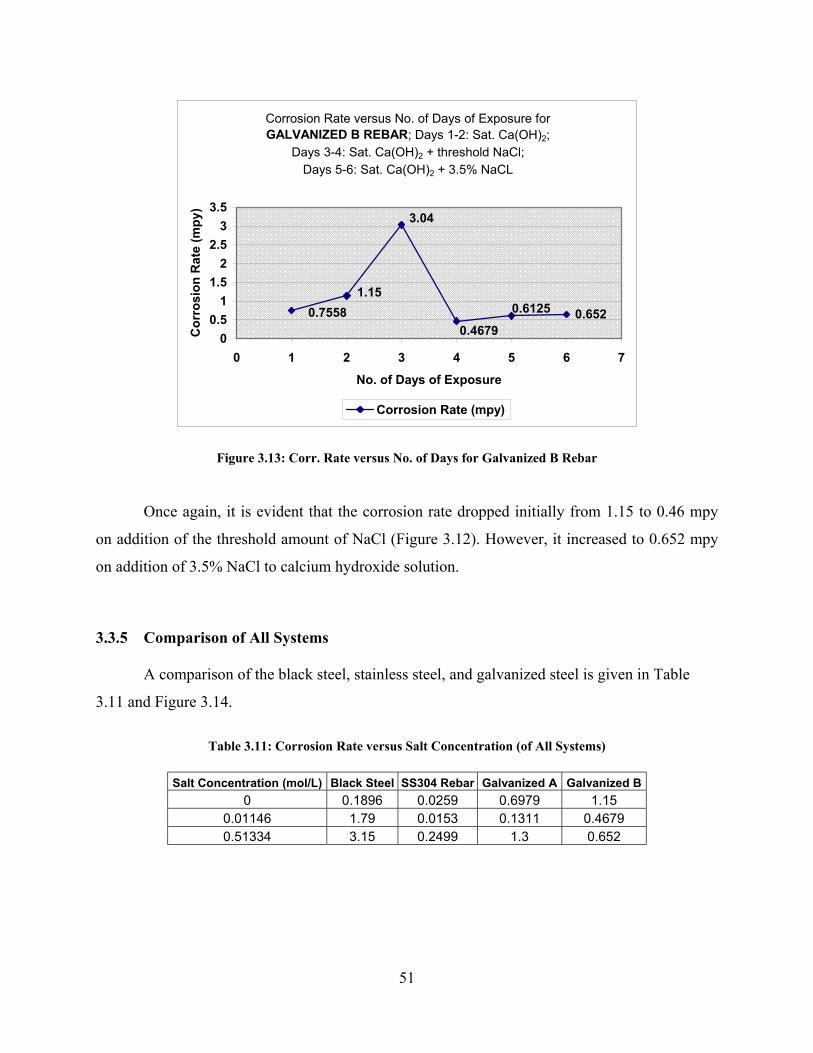
Table 3.10: Corrosion Rate versus No. of Days for Galv. B Rebar
Day Corrosion Rate (mpy) 1 0.7558 2 1.15 3 3.04 4 0.4679 5 0.6125 6 0.652
51
Corrosion Rate versus No. of Days of Exposure for GALVANIZED B REBAR; Days 1-2: Sat. Ca(OH)2;
Days 3-4: Sat. Ca(OH)2 + threshold NaCl; Days 5-6: Sat. Ca(OH)2 + 3.5% NaCL
0.6520.75581.15
3.04
0.46790.6125
00.5
11.5
22.5
33.5
0 1 2 3 4 5 6 7No. of Days of Exposure
Cor
rosi
on R
ate
(mpy
)
Corrosion Rate (mpy)
Figure 3.13: Corr. Rate versus No. of Days for Galvanized B Rebar
Once again, it is evident that the corrosion rate dropped initially from 1.15 to 0.46 mpy
on addition of the threshold amount of NaCl (Figure 3.12). However, it increased to 0.652 mpy
on addition of 3.5% NaCl to calcium hydroxide solution.
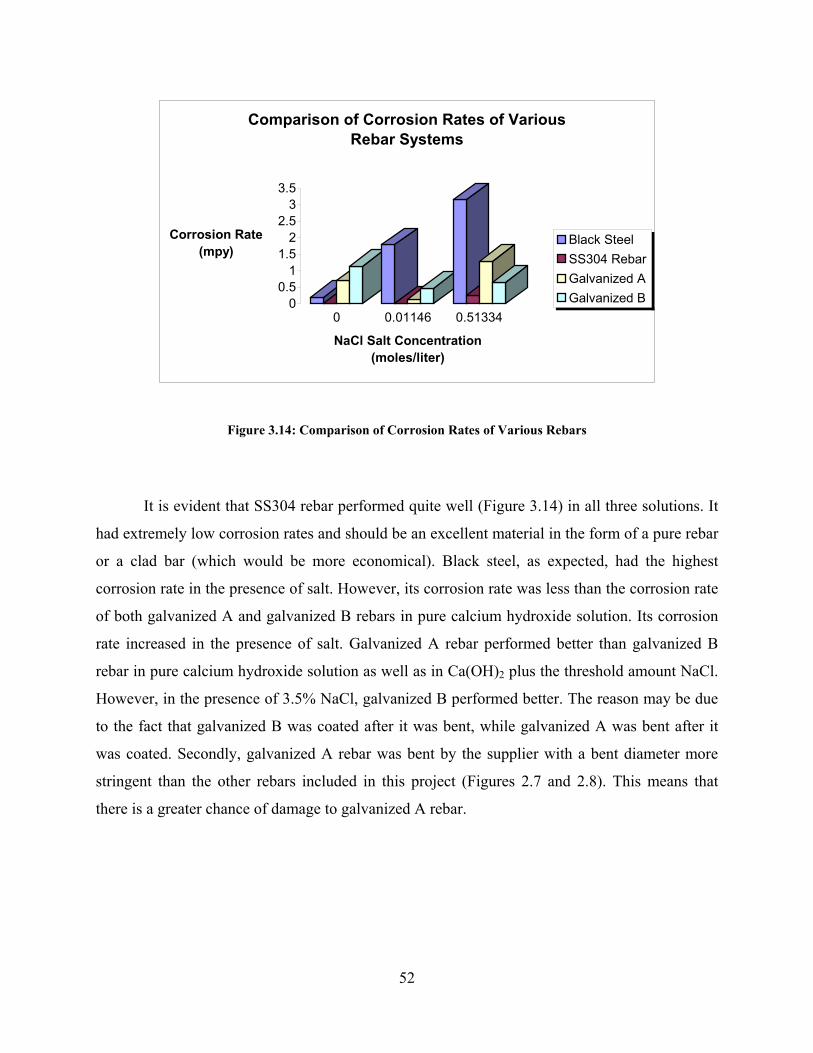
3.3.5 Comparison of All Systems
A comparison of the black steel, stainless steel, and galvanized steel is given in Table
3.11 and Figure 3.14.
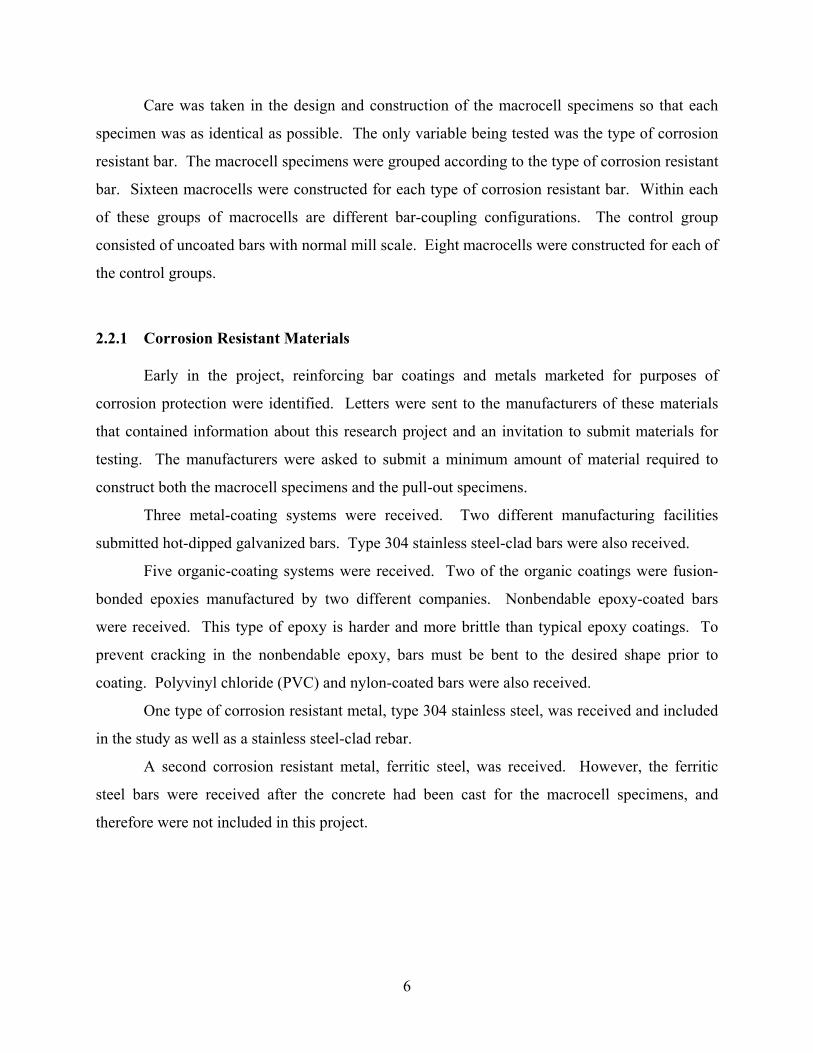
Table 3.11: Corrosion Rate versus Salt Concentration (of All Systems)
Salt Concentration (mol/L) Black Steel SS304 Rebar Galvanized A Galvanized B
0 0.1896 0.0259 0.6979 1.15 0.01146 1.79 0.0153 0.1311 0.4679 0.51334 3.15 0.2499 1.3 0.652
52
00.5
11.5
22.5
33.5
Corrosion Rate (mpy)
0 0.01146 0.51334
NaCl Salt Concentration (moles/liter)
Comparison of Corrosion Rates of Various Rebar Systems
Black SteelSS304 RebarGalvanized AGalvanized B
Figure 3.14: Comparison of Corrosion Rates of Various Rebars
It is evident that SS304 rebar performed quite well (Figure 3.14) in all three solutions. It
had extremely low corrosion rates and should be an excellent material in the form of a pure rebar
or a clad bar (which would be more economical). Black steel, as expected, had the highest
corrosion rate in the presence of salt. However, its corrosion rate was less than the corrosion rate
of both galvanized A and galvanized B rebars in pure calcium hydroxide solution. Its corrosion
rate increased in the presence of salt. Galvanized A rebar performed better than galvanized B
rebar in pure calcium hydroxide solution as well as in Ca(OH)2 plus the threshold amount NaCl.
However, in the presence of 3.5% NaCl, galvanized B performed better. The reason may be due
to the fact that galvanized B was coated after it was bent, while galvanized A was bent after it
was coated. Secondly, galvanized A rebar was bent by the supplier with a bent diameter more
stringent than the other rebars included in this project (Figures 2.7 and 2.8). This means that
there is a greater chance of damage to galvanized A rebar.
53
Chapter 4:
Summary and Conclusions
4.1 SUMMARY OF EXPERIMENTAL RESULTS
In this project, three types of tests have been carried out to determine the corrosion
evaluation of various reinforcement systems. These include macrocell tests, polarization
resistance (PR) and screening tests, and pull-out tests (in Report 4904-3). Section 4.1.1 deals
with the macrocell testing, while Section 4.1.2 addresses PR and screening tests. 4.1.1 Summary of Macrocell Tests
At the time of the initial writing of this report, five wetting-drying cycles had been
completed on the macrocell tests, and the following conclusions were drawn:
• Voltage readings were still zero on all of the rebars.
• Periodically raising the temperatures of the macrocells may be a possible
recommendation, as it would accelerate the tests.
4.1.2 Summary of Polarization Resistance and Screening Tests
Screening tests were carried out for all types of rebars in calcium hydroxide solution with
or without varying amounts of sodium chloride. The rebars were exposed to a repeated cycle of 2
days each of pure calcium hydroxide, calcium hydroxide with the threshold amount of NaCl, and
calcium hydroxide with 3.5% NaCl. These tests give valuable qualitative information on the
nature of corrosion on reinforcements. Three cycles were completed at the time of writing this
report. The following conclusions have been drawn:
• Black steel showed considerable corrosion product formation at the solution-rebar
interface. However, no other rebar showed corrosion product formation. As demonstrated
SS304 rebar performs excellently (Figure 3.14) in all three solutions. It has extremely
low corrosion rates and should be an excellent material in the form of a pure rebar or the
more economical clad rebar.
54
• Black steel, as expected, had the highest corrosion rate in the presence of salt. However,
its corrosion rate was less than the corrosion rate of both galvanized A and galvanized B
rebars in pure calcium hydroxide solution. Its corrosion rate drastically increased in the
presence of salt.
• Galvanized A rebar performed better than galvanized B rebar in pure calcium hydroxide
solution as well as in Ca(OH)2 + the threshold amount NaCl. However, in the presence of
3.5% NaCl, galvanized B performed better. The reason may have been due to the fact that
galvanized B was coated after it was bent, while galvanized A was bent after it was
coated. Secondly, galvanized A rebar was bent by the supplier with a bent diameter more
stringent than the other rebars included in this project, which resulted in greater chance of
damage to the coating of galvanized A rebar.
The results of the macrocell tests will give real-time analysis of the different rebar samples
tested in this project. They could then be coupled with the results of PR tests to arrive at
complete conclusions.
55
BIBLIOGRAPHY
ASTM G5-94 (Reapproved 1999). “Standard Reference Test Method for Making Potentiostatic and Potentiodynamic Anodic Polarization Measurements,” Annual Book of Standards, ASTM, West Conshohocken, PA.
ASTM G109 (1999). “Standard Test Method for Determining the Effects of Chemical
Admixtures on the Corrosion of Embedded Steel Reinforcement in Concrete Exposed to Chloride Environments,” Annual Book of ASTM Standards, ASTM, West Conshohocken, PA.
B. Elsener; M. Buchler; F. Stalder; and H. Bohni. Migrating Corrosion Inhibitor Blend for Reinforced Concrete: Part 1—Prevention of Corrosion, The Journal of Corrosion Science and Engineering, Vol. 55, No. 12, pp 1155 – 1163, 1991.
Fontana, M. G. “Corrosion Engineering,” 3rd ed. McGraw-Hill, New York, NY, 1986. Gowripalan, N. “Chloride-Ion Induced Corrosion of Galvanized and Black Steel Reinforcement
in High-Performance Concrete,” Source: Cement and Concrete Research v 28 n 8 Aug 1998 Elsevier Sci Ltd p 1119-1131.
Kahhaleh, Khaled; Jirsa, James; Carrasquillo, Ramon; Wheat, Harovel. “Macrocell
Corrosion Testing of bent Epoxy-Coated Bars in Chloride Solution,” Proceedings of the Materials Engineering Conference Infrastructure: New Materials and Methods of Repair Proceedings of the 3rd Materials Engineering Conference Nov 13-16 1994 n804 San Diego, CA, USA, p 8-15.
Kahhaleh, Khaled; Jirsa, James; Carrasquillo, Ramon; Wheat, Harovel. “Macrocell
Corrosion Study of Fabricated Epoxy-Coated Reinforcement,” Corrosion and Corrosion Protection of Steel in Concrete, Proceedings of International Conference held at The University of Sheffield, 24-28 July, 1994, Sheffield Academic, R.N. Swamy, Ed., Press, pp 1244 – 1253.
Lee, S. K. and Hartt, W. H. “Autopsy Results of Epoxy Coated Steels Embedded in Test
Slabs,” Paper no. 634, Corrosion 98, pp 1-3. McDonald, D. B.; Sherman, M. R.; Pfeifer, D. W.; Virmani, Y. P. “Stainless Steel
Reinforcing as Corrosion Protection,” Concrete International v17 n5 May 1995 American Concrete Inst Detroit Mi USA p 65-70.
R. M. Davison; T. Debold; and M. J. Johnson. Metals Handbook, Vol. 13, Corrosion, 9th ed.,
ASM International, Metals Park, Oh, p. 547, 1987.

56