Embed Size (px)
Citation preview
ArcelorMittal South Africa Stabilising operations
Dr. Hans Ludwig Rosenstock, COO 31 May 2013

Disclaimer
Forward-Looking Statements
This presentation may contain forward-looking information and statements about ArcelorMittal South Africa and its subsidiaries. These statements include financial projections and estimates and their underlying assumptions, statements regarding plans, objectives and expectations with respect to future operations, products and services, and statements regarding future performance. Forward-looking statements may be identified by the words “believe,” “expect,” “anticipate,” “target” or similar expressions. Although ArcelorMittal South Africa’s management believes that the expectations reflected in such forward-looking statements are reasonable, investors and holders of ArcelorMittal South Africa’s securities are cautioned that forward-looking information and statements are subject to numerous risks and uncertainties, many of which are difficult to predict and generally beyond the control of ArcelorMittal South Africa, that could cause actual results and developments to differ materially and adversely from those expressed in, or implied or projected by, the forward-looking information and statements. These risks and uncertainties include those discussed or identified in the filings with the JSE made or to be made by ArcelorMittal South Africa, including ArcelorMittal South Africa’s Annual Report for the year ended December 31, 2012 filed with the JSE. These forward looking statements have not been reviewed and reported on by ArcelorMittal South Africa’s auditors and apply only as of the date they are made. ArcelorMittal South Africa undertakes no obligation to publicly update its forward-looking statements, whether as a result of new information, future events, or otherwise.
1
Agenda
• Stabilize operations
• Asset reliability
• Quality improvements
• Energy savings
• Other cost reduction initiatives
2
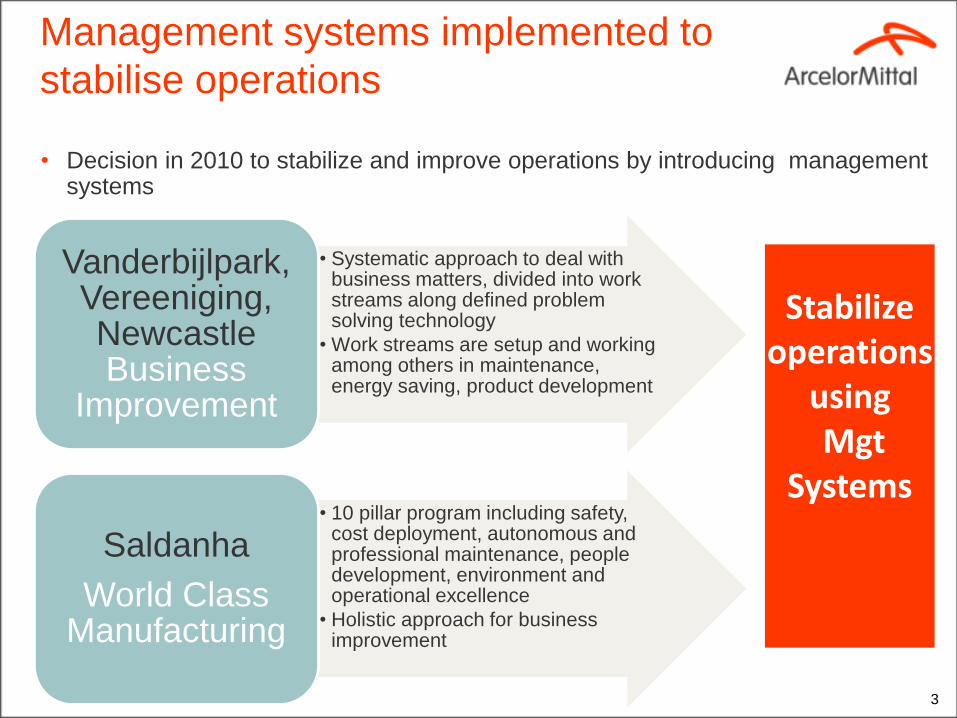
Management systems implemented to
stabilise operations
• Decision in 2010 to stabilize and improve operations by introducing management systems
3
• Systematic approach to deal with business matters, divided into work streams along defined problem solving technology
• Work streams are setup and working among others in maintenance, energy saving, product development
Vanderbijlpark, Vereeniging, Newcastle Business
Improvement
• 10 pillar program including safety, cost deployment, autonomous and professional maintenance, people development, environment and operational excellence
• Holistic approach for business improvement
Saldanha
World Class Manufacturing
Stabilize operations
using Mgt
Systems

4 SOURCE: BI Team
Vanderbijlpark Works master plan
2013 2014
Q1 Q2 Q3 Q4 Q1 Q2
Iron Making (Phased in full roll-out)
Steel Making (Planning & Scheduling)
Slab quality
Coil quality 6-σ black spots
Plate Quality
Caster segments
CMS (Full ARP implementation)
Refractories
Lubrication systems
Work roll mill bearings maintenance
Energy awareness
Plant energy audits
Plant benchmarking gap analysis
Best practice implementation
AREA
CMN (Full ARP implementation)
Roll & Shear (Full ARP implementation)
Hot Rolling (Selected roll-out)
Coke Making (M&B Analysis only)
Management of Abnormalities
Management Routines
Complete SOP audits & Visual Management
Op S
tand-
ard
isation
Mai
nte
nan
ce
Qu
alit
y O
uts
ou
rce
Ener
gy
1 – FTE: BI / Plant FTEs for team for 2013; 2 – P=Production/Productivity, Q=Quality, C=Cost, D=Delivery, S=Safety, M=Management, E=Environment
• Detailed work plan
• Best practise
implementation
• Leveraging from
ArcelorMittal Group
expertise
• Large Group internal
data base of
information
• Access to world class
R&D

World Class Manufacturing (WCM)
overview • Started program in 2010 with 5 WCM pillars
and 5S
• Focus on autonomous maintenance to
deliver improvement in reliability shifted
from achieving high reliability to focused
improvement to deliver the savings
Savings achieved by Dec 2012 (from baseline H1 2010)
• The program currently supported by teams: – 40 safety project teams; 28 autonomous
maintenance teams; 15 professional maintenance
teams; 20 focussed improvement teams
– Annual cost deployment to prioritise/focus efforts
6.3
15.9
9.4
17.317.5
5.27.7
17.0
2.2
PD AM & PM FI other FI Energy FI
Footprint
2.1
Target
Actual
5

Maintenance systems
6
Breakdown maintenance
• Equipment is repaired after a failure in operation
• advantage: Life time of the equipment is fully utilized
• problem: repair not planned, capital intensive (spares) & longer stops
Life cycle maintenance
• Repair is performed in fixed intervals, depending of the estimated life cycle of equipment
• advantage: planned repair stops, stable operations
• problem: life time of equipment is not always fully utilized
Condition based maintenance
• Repair is performed according the actual equipment status
• advantage: planned repair stops, stable operations, life time of equipment utilized to maximum, minimum spares
• precondition: highly skilled and reliable workforce required, good, adequate data base for support required
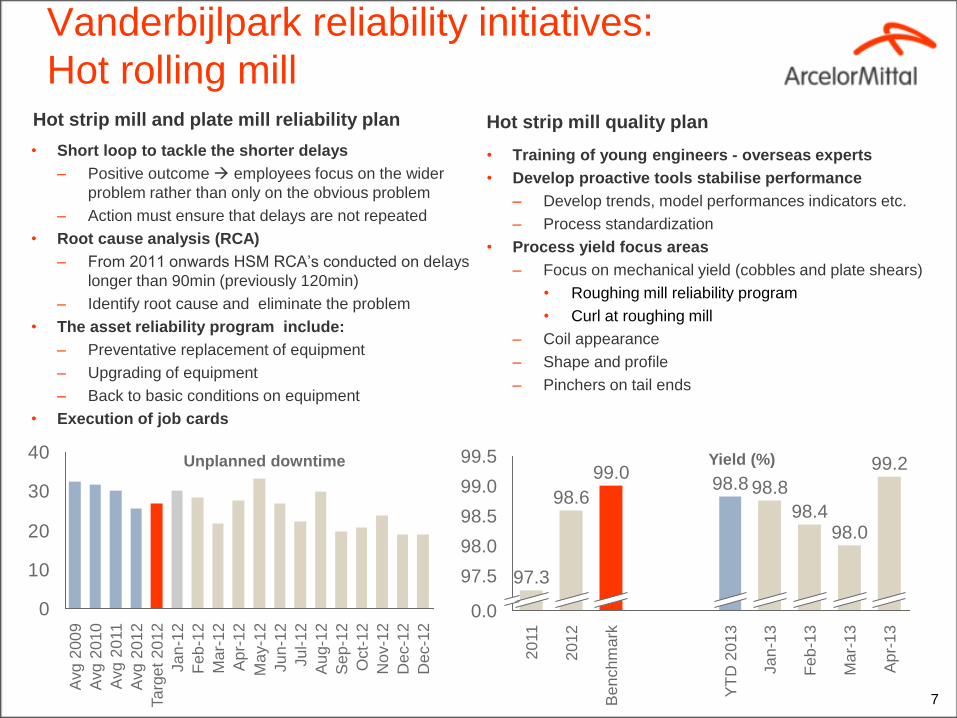
Hot strip mill and plate mill reliability plan
• Short loop to tackle the shorter delays
– Positive outcome employees focus on the wider
problem rather than only on the obvious problem
– Action must ensure that delays are not repeated
• Root cause analysis (RCA)
– From 2011 onwards HSM RCA’s conducted on delays
longer than 90min (previously 120min)
– Identify root cause and eliminate the problem
• The asset reliability program include:
– Preventative replacement of equipment
– Upgrading of equipment
– Back to basic conditions on equipment
• Execution of job cards
Hot strip mill quality plan
• Training of young engineers - overseas experts
• Develop proactive tools stabilise performance
– Develop trends, model performances indicators etc.
– Process standardization
• Process yield focus areas
– Focus on mechanical yield (cobbles and plate shears)
• Roughing mill reliability program
• Curl at roughing mill
– Coil appearance
– Shape and profile
– Pinchers on tail ends
Vanderbijlpark reliability initiatives:
Hot rolling mill
7
97.5
99.5
99.0
98.0
0.0
98.5 98.6
20
11
97.3
98.0
Ma
r-1
3
99.2
98.4
Ja
n-1
3
Ap
r-1
3
Fe
b-1
3
98.8
YT
D 2
01
3
98.8
Be
nch
mark
99.0
20
12
0
10
20
30
40
De
c-1
2
De
c-1
2
No
v-1
2
Oct-
12
Se
p-1
2
Au
g-1
2
Ju
l-1
2
Ju
n-1
2
Ma
y-1
2
Ap
r-1
2
Ma
r-1
2
Fe
b-1
2
Ja
n-1
2
Ta
rge
t 2
01
2
Avg 2
01
2
Avg 2
011
Avg 2
01
0
Avg 2
00
9
Unplanned downtime Yield (%)

Key drivers for blast furnace optimization
• Blast furnace C hearth wall and tuyere belt
replaced
• Blast furnace D tapholes repaired with
design improvements
• Modifications done to blast furnace D
through design
• Operational stability, improved availability
Ongoing efforts
• Continue with extensive operator training
• Roll-out of asset reliability program to
improve maintenance approach
• “Back-to-basics” on tapping equipment
• Raw material quality focus
Vanderbijlpark reliability initiatives:
Blast furnace area
Improvements exhibited
VDB blast furnace C
Zero Wind Equivalent Availability
(% of operating time)
8
9289
76
53
85
2011 2012 2009 2008 2010

Vanderbijlpark reliability initiatives:
Strip processing lines
17.6
20.8
14.6
18.9
Target 2013 YTD 2012 2011
2.27
1.89
1.291.24
2011 2012 2013 YTD Target
Pickling line
(hours between stoppages)
• Significant improvements made in unplanned stoppage rates
9
• Mean time between failure describes the time in hours between two unplanned stops of a processing line
Galvanizing line
(hours between stoppages)
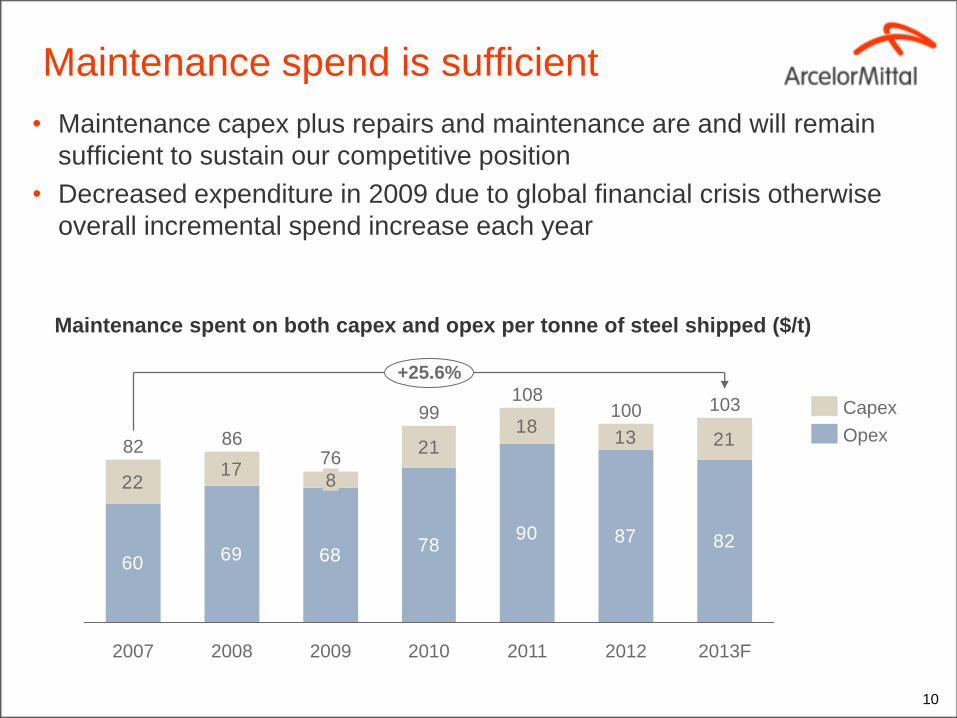
Maintenance spend is sufficient
• Maintenance capex plus repairs and maintenance are and will remain
sufficient to sustain our competitive position
• Decreased expenditure in 2009 due to global financial crisis otherwise
overall incremental spend increase each year
Maintenance spent on both capex and opex per tonne of steel shipped ($/t)
10
6078
90 82
2217
2118
13 21
6987
68
2011 2012 2013F
99 103
+25.6%
108 100
2009 2008 2007
8
82 86 76
2010
Capex
Opex

Quality improvements - Vanderbijlpark
• Ongoing quality improvement
efforts
• Customer complaint ratio of 1.08%
of total sales revenue in 2012
• Significant reduction achieved
• 2013 YTD at 0.52%
• 2012 scrapped tons (i.e. scrap &
secondary grade) was 2,500t
• 26% lower than the seven
year peak of 3,400t in 2011
• 2012 cost of quality R66m:
• 30% below 2011
• 35% below 2010
• Tin and HRC receive the majority
of complaints
Vanderbijlpark Works
(quality claims by volume for flat steel products)
11

Quality improvements – Saldanha works
• Customer complaint ratio of 0.102%
of total sales revenue in 2012
• 2013 YTD rate of 0.058%
• Scrapped tons (ie scrap &
secondary grade) in 2012 was
6,510t
• 51% lower than 2011 peak of
13,308t
• Surface defects make out 90% of
claims with shape the balance
• Cost of quality in 2012 was R16m
• 16% below the 2011 result
• 31% lower than the 2010
12
Prime ratio
96.5
97.0
97.5
98.0
98.5
99.0
99.5
2008 2009 2010 2011 2012
99.1%
98.6%
97.6%
97.8%
96.7%
Rejections based on quality
0.5
1.0
1.5
2.0
2.5
3.0
2008 2009 2010 2011 2012
0.6%
1.2%
1.7%
1.6%
2.6%

• In 2012 the bar mill was responsible for 56% of the relevant complaints by volume
and the rod mill for 44%
• 2013 YTD medium mill yield against target at 94%
• 2013 YTD cobble rate of 1.3% at bar mill
Yield improvements - Newcastle
13
Newcastle medium mill – yield % Newcastle bar mill – cobble rate %
93.2%
92.8%
93.6%
93.4%
93.8%
93.0%
0.0%
92.6% 92.5%
2010
93.2%
2011
93.4%
2012
93.8%
2013 YTD
0.00%
1.35%
1.40%
1.45%
1.30%
1.50%
1.55%
1.60%
1.25%
2013 YTD
1.28%
2012
1.24%
1.55%
2010
1.56%
2011

Energy – fuel rates Vanderbijlpark
Key drivers for the blast furnace
optimization at Vanderbijlpark
• Charging of DRI • Improve stability
• Fine sinter charging • Thabazimbi lump on mixing bed • Eliminate blast furnace D
charging delays (on-going) • Full operation of Stove 4 to improve
hot blast temperature in June
Ongoing efforts • Operator refresher training • Improved maintenance approach • Implementation of autonomous
maintenance • Focussing on raw material quality
14
VDB blast furnace C - Total fuel rate
(coke equivalent) Kg/tHM
VDB blast furnace D - Total fuel rate
(coke equivalent) Kg/tHM
560
580
0
520
540
2008 2009
565
2010 Feb-
13
2012 Jan-
13
2011 Mar-
13
2013
YTD
526 529
565 560
528
498
529
565
580
560
540
520
0 2012
504
2011
562
2010
516
2009
560
2008
561

Energy – electricity Saldanha works
2012 projects (total savings R127m)
• Technology
• Variable speed drives, waste heat
utilisation to replace diesel heater, lighting
replacement
• Operational efficiency
• RHF, WTP pump system & LPG savings
• Eskom tariff structure (winter peak tariff) -
utilise chemical energy
• ISO 50001 and improved reporting by
empowering area managers to set targets and
manage their energy consumption
2011 projects (total savings R64m)
• Switch off what is not required in low
production periods
• Compressed air- repair leaks / prevent misuse
15
1.191.271.31
1.51
1.31
2008 2009 2010 2012 2011
Saldanha works electricity consumption
Kwh/t HRC
Electricity consumption Kwh/t HRC

Energy – LPG Saldanha works
• Reduce LPG consumption by 30% by changing operating philosophy
• Use process gas for furnace reheating
• Reduce temperature losses by stabilizing the operations
16
13,072
22,112
18,81120,625
18,303
12
23
17
0
5,000
10,000
15,000
20,000
25,000
0
12
24
36
2009
28
2008
25
2011 2010 2012
LPG consumption 1000Kg LPG consumption Kg/t HRC
Saldanha works LPG consumption

Energy – Newcastle
17
1.782.30
2.76
2013 YTD 2011 2012
1.081.191.28
2013 YTD 2011 2012
1.211.231.25
2013 YTD 2011 2012
Newcastle medium mill gas consumption GJ/ton
Newcastle bar mill gas consumption GJ/ton
Newcastle rod mill gas consumption GJ/ton
• Process review for reheating
furnaces
• Improvement of measurement
technology
• Training of operators
• Stabilizing of operations

• Closure of electric arc furnace
– Vanderbijlpark has sufficient capacity to meet domestic and
AOL demand
– Allows the full utilization of the BF route
• Closure of caster 3
– Improve productivity of casters V1 and V2
• Closure of coke oven battery 3
– Reduced blast furnace consumption
– Import coke for Saldanha steel is more cost effective
– poor technical status of battery 3 required stop of production
• Improve productivity in cold rolling mills
– Run pickling line / cold rolling north at full capacity
– Restructure shift pattern in cold rolling south
Asset optimisation at Vanderbijlpark
19

Key messages
Zero fatalities with record LTIFRs
• Comprehensive cost savings
• Operational performance enhanced with new management
systems implemented
• Focus on improving asset reliability
• Our assets will continue to receive adequate repair and
maintenance to ensure our reliability
• Quality is focus area and we are showing positive results
• Asset optimization leading to improved utilization rates
• Energy efficiencies improved by reduced fuel rates, lower
electricity and gas consumption
20

www.arcelormittalsa.com
Thank you