Embed Size (px)
Citation preview
Annual Financial ResultsAnnual Financial Resultsfor the 12 months ended 31 December 2007
ArcelorMittal South Africa Limited
2
Introducing New CEO and member of the Board
Me. Nku Nyembezi-Heita
3
Introducing new President and member of the Board
Luc Bonte
Market and OperationsMarket and OperationsRick ReatoRick Reato
5
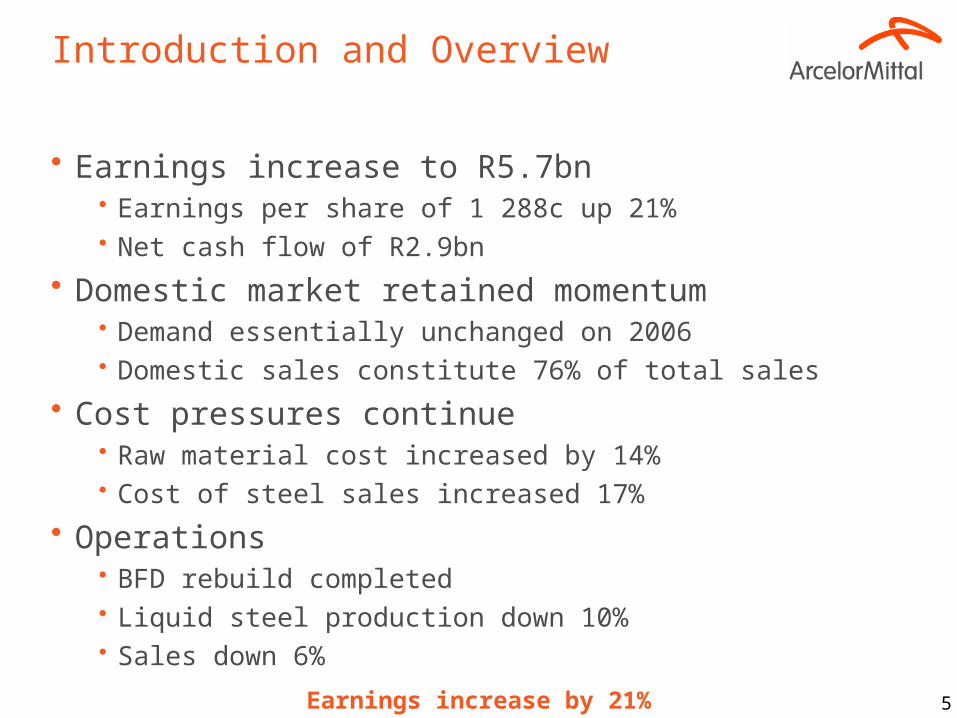
Introduction and Overview
Earnings increase to R5.7bn Earnings per share of 1 288c up 21% Net cash flow of R2.9bn
Domestic market retained momentum Demand essentially unchanged on 2006 Domestic sales constitute 76% of total sales
Cost pressures continue Raw material cost increased by 14% Cost of steel sales increased 17%
Operations BFD rebuild completed Liquid steel production down 10% Sales down 6%
Earnings increase by 21%
6
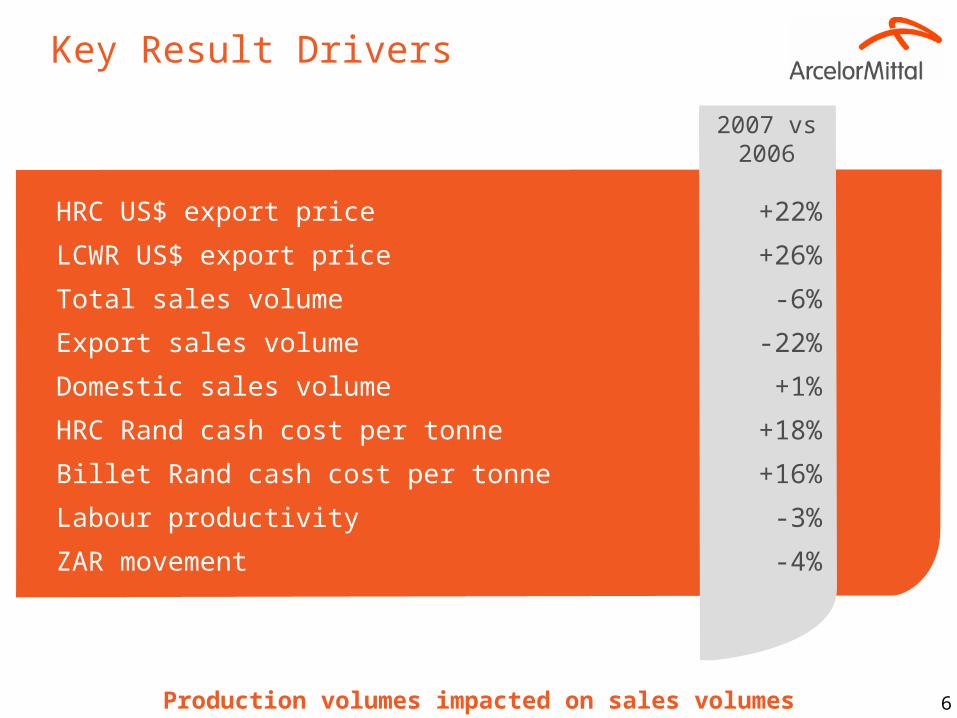
Key Result Drivers
Production volumes impacted on sales volumes
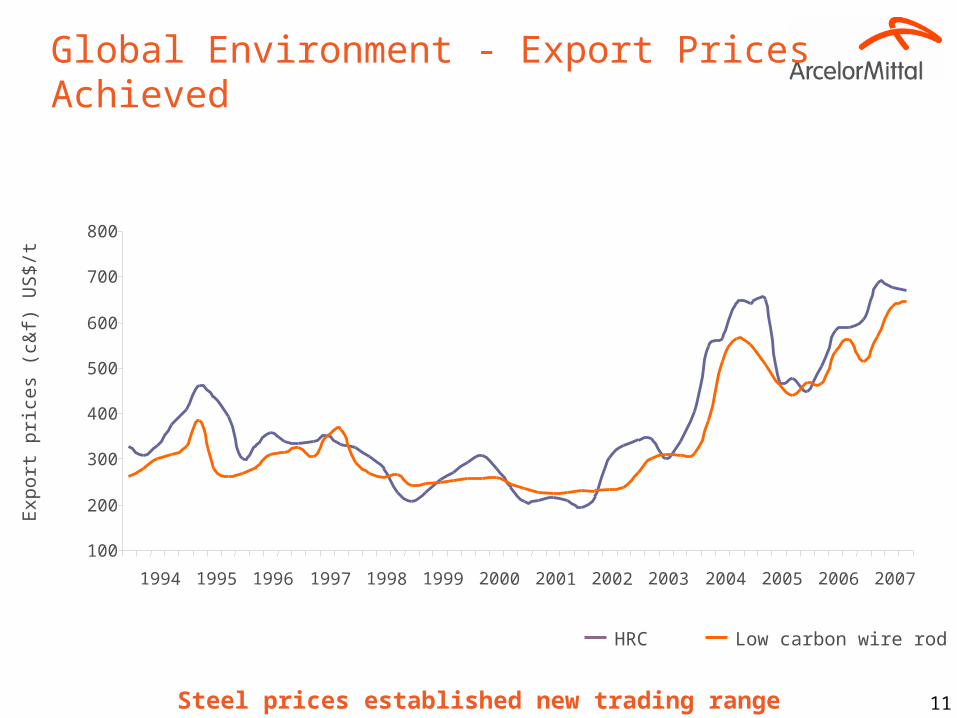
HRC US$ export price +22%
LCWR US$ export price +26%
Total sales volume -6%
Export sales volume -22%
Domestic sales volume +1%
HRC Rand cash cost per tonne +18%
Billet Rand cash cost per tonne +16%
Labour productivity -3%
ZAR movement -4%
2007 vs 2006
7
Global Environment – General Market Trends
World economic growth in 2007 decreased marginally from 3.9% to 3.6%
Chinese economy grew by 11% despite measures to cool it down
World consumption and production of steel increased by 7.5% in 2007
Global steel industry consolidation still priority
Input costs remain high & will continue to support prices
Lower price volatility expected to continue
Global steel consolidation supports a less volatile market environment
8
-30,000
-5,000
20,000
45,000
1993 1994 1995 1996 1997 1998 1999 2000 2001 2002 2003 2004 2005 2006 2007
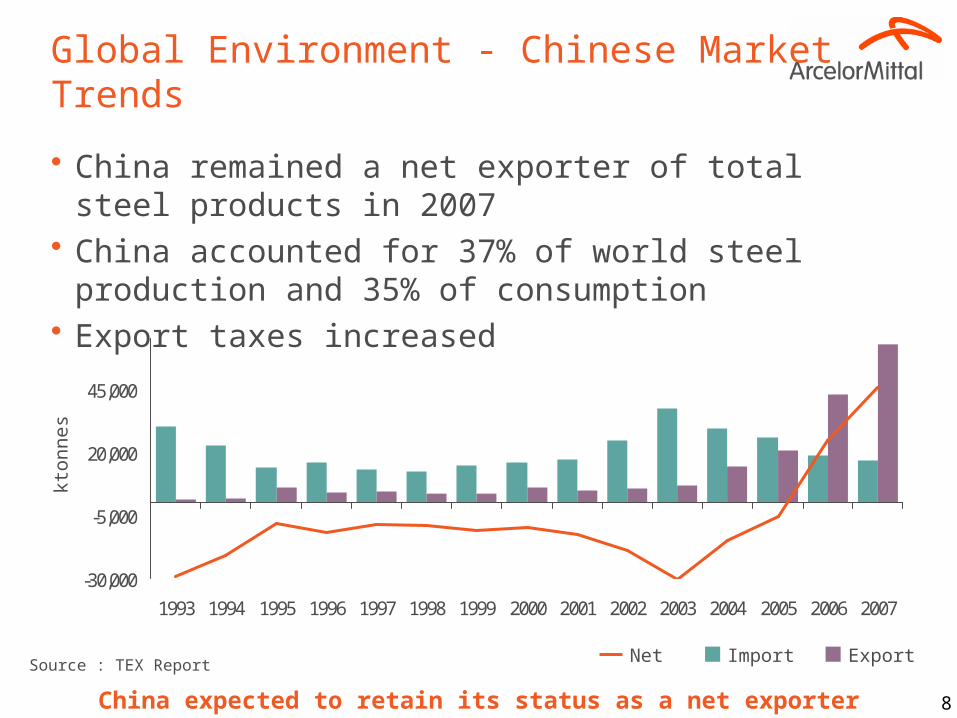
Global Environment - Chinese Market Trends
China remained a net exporter of total steel products in 2007 China accounted for 37% of world steel production and 35% of
consumption Export taxes increased
ExportImport
kton
nes
Net
China expected to retain its status as a net exporter
Source : TEX Report
9
Global Environment – Input Cost Trends
Iron ore price expected to increase substantially China iron ore spot @ premium of US$40/t
Coking Coal cost pressure expected in 2008 due to scarcity worldwide Coking coal spot prices have increase by 65%
Sharp increase in scrap prices in early 2008 Scrap prices increased by 30% during 2007 Reduction in supply from traditional markets due to local consumption
Port delays & changing trade patterns lead to rising freight rates Freight rates almost doubled during 2007
Prices of base metals and alloys increased substantially Tin (+66%); Nickel (+55%); Ferro Alloys (+60%); Zinc stable after +146% in 2006
Raw material prices exert pressure on steel prices
10
0
100
200
300
400
2003 2004 2005 2006 2007 2008
Coking Coal Iron Ore Scrap (Tex)
Spot coal prices
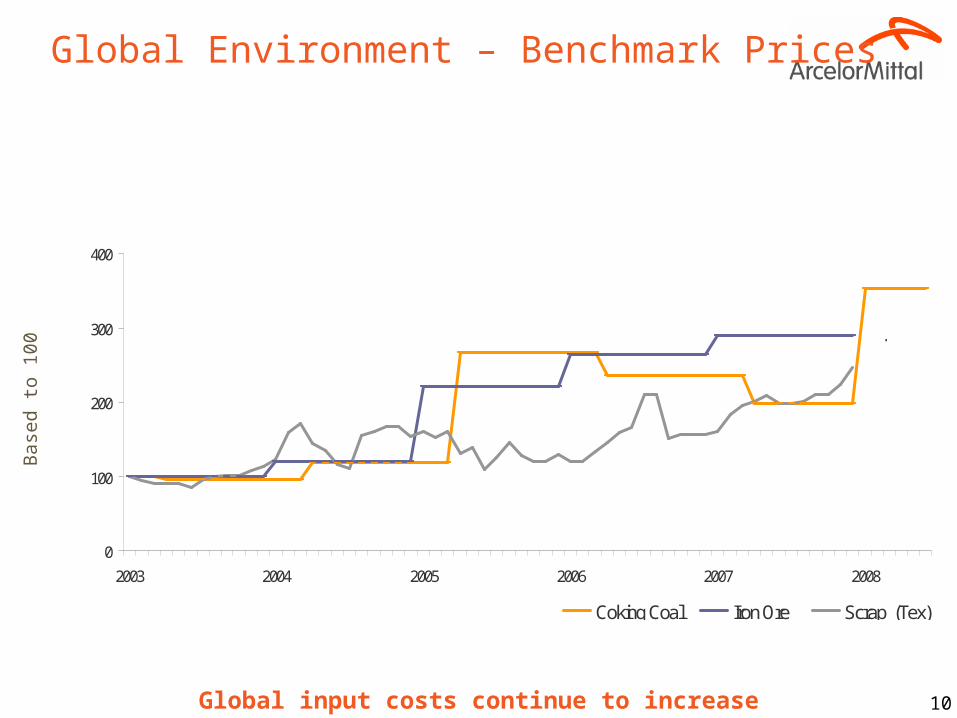
Global Environment – Benchmark Prices
Global input costs continue to increase
Base
d to
100
11
Global Environment - Export Prices Achieved
HRC Low carbon wire rod
Expo
rt pr
ices
(c&f
) US$
/t
Steel prices established new trading range
100
200
300
400
500
600
700
800
1994 1995 1996 1997 1998 1999 2000 2001 2002 2003 2004 2005 2006 2007
12
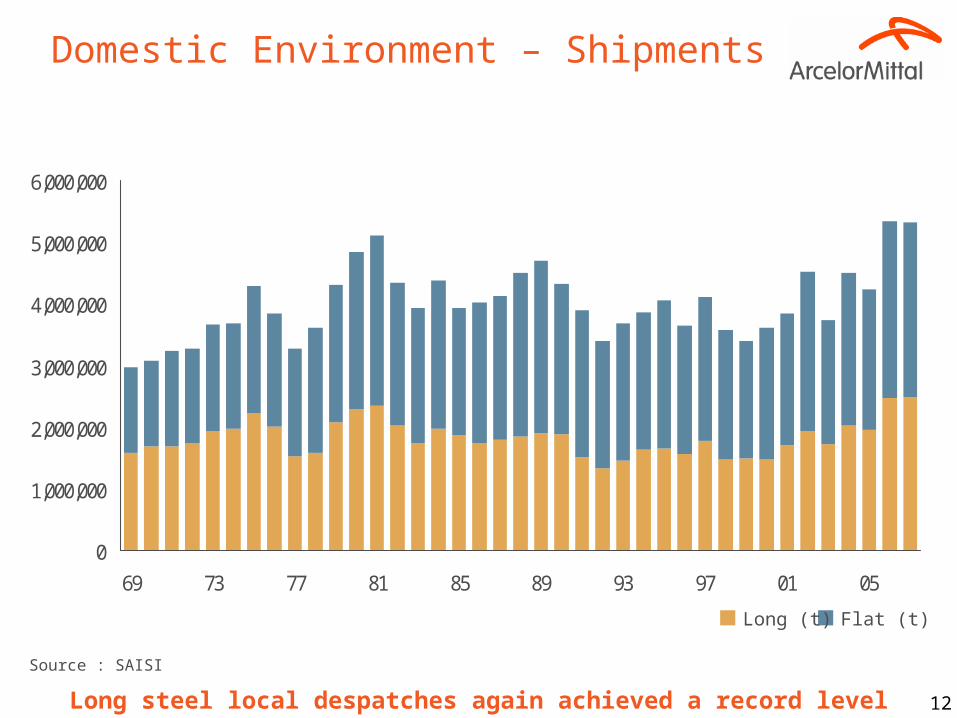
Domestic Environment – Shipments
0
1,000,000
2,000,000
3,000,000
4,000,000
5,000,000
6,000,000
69 73 77 81 85 89 93 97 01 05
Flat (t)Long (t)
Long steel local despatches again achieved a record level
Source : SAISI
13
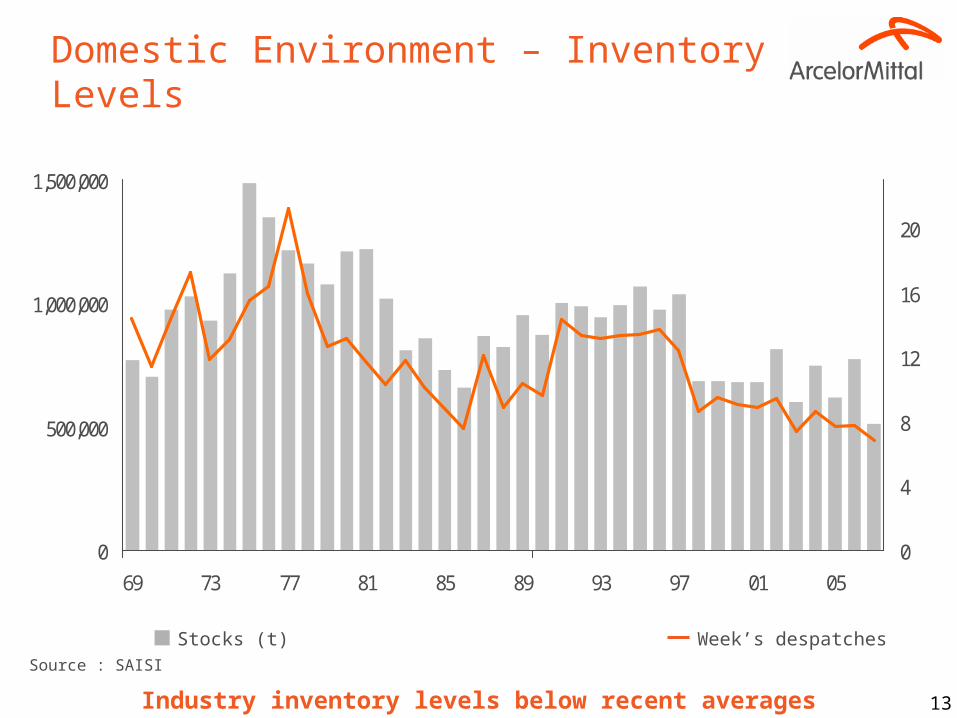
Domestic Environment – Inventory Levels
0
500,000
1,000,000
1,500,000
69 73 77 81 85 89 93 97 01 050
4
8
12
16
20
Stocks (t) Week’s despatches
Industry inventory levels below recent averages
Source : SAISI
14
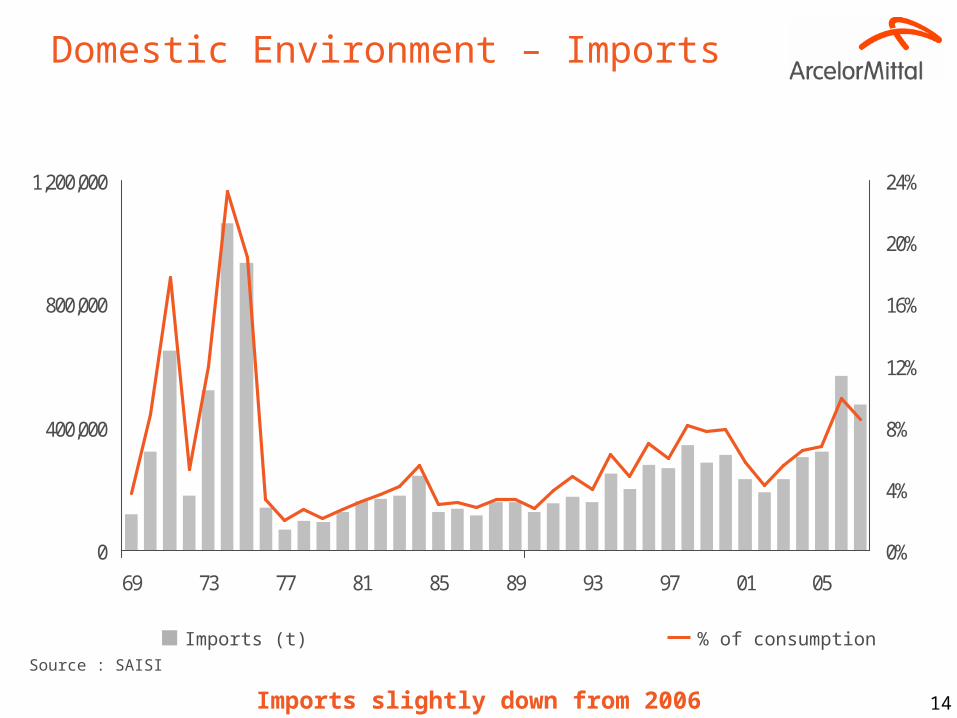
Domestic Environment – Imports
0
400,000
800,000
1,200,000
69 73 77 81 85 89 93 97 01 050%
4%
8%
12%
16%
20%
24%
Imports (t) % of consumption
Imports slightly down from 2006
Source : SAISI
15
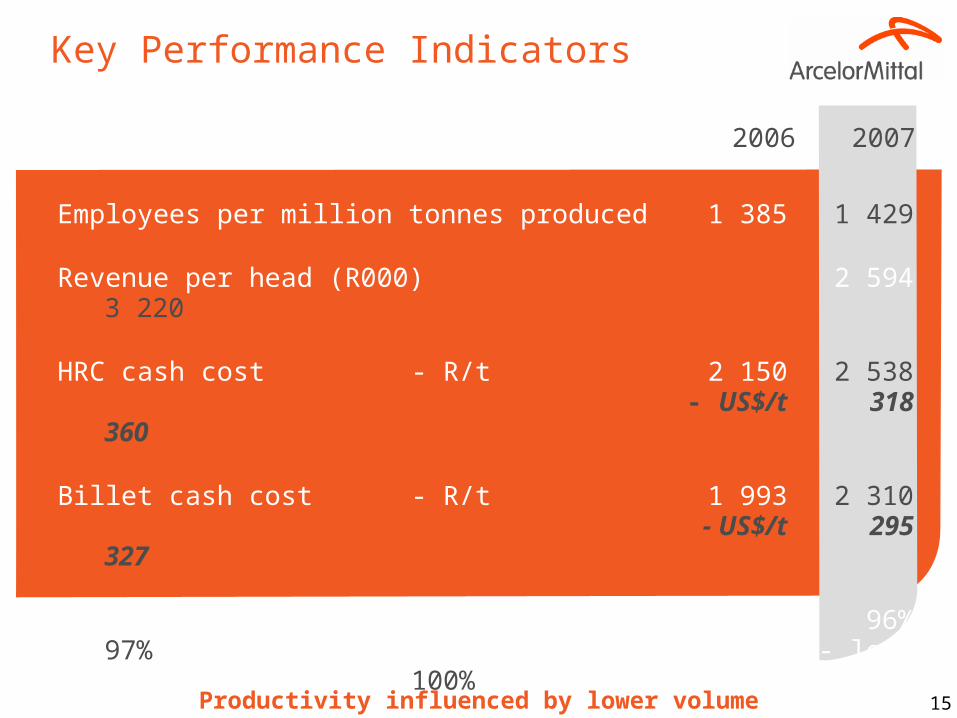
Key Performance Indicators
Productivity influenced by lower volume
Employees per million tonnes produced 1 385 1 429
Revenue per head (R000) 2 594 3 220
HRC cash cost - R/t 2 150 2 538- US$/t 318
360
Billet cash cost - R/t 1 993 2 310- US$/t 295
327
Percentage value-add exports - flat 96% 97%- long 94%
100%
2006 2007
16
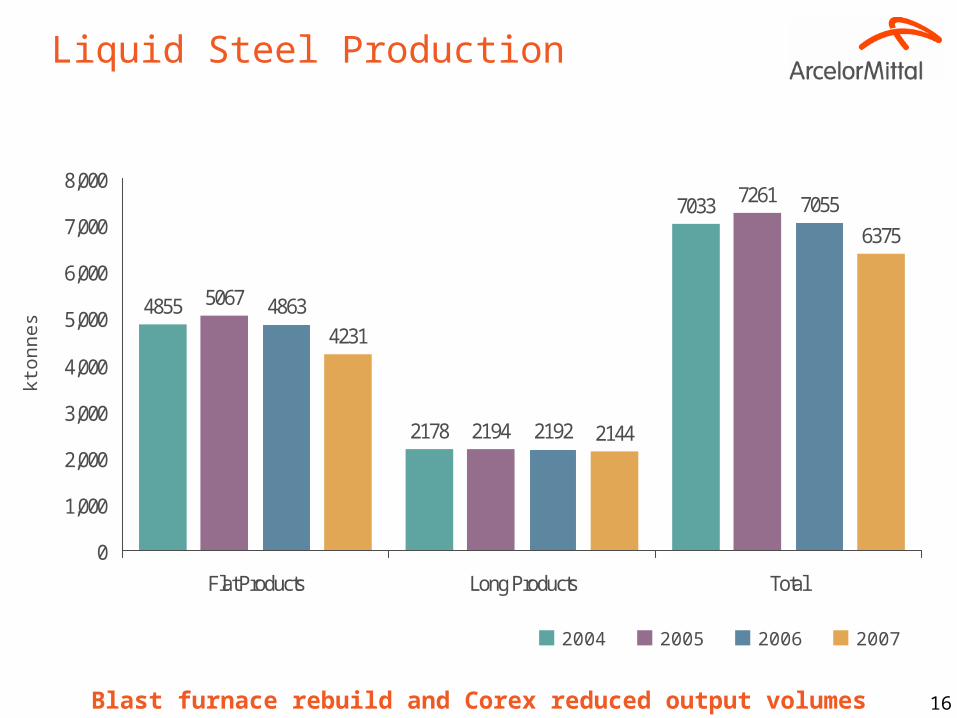
Liquid Steel Production
4855
2178
7033
5067
2194
7261
4863
2192
7055
4231
2144
6375
0
1,000
2,000
3,000
4,000
5,000
6,000
7,000
8,000
Flat Products Long Products Total
kton
nes
20062005 20072004
Blast furnace rebuild and Corex reduced output volumes
17
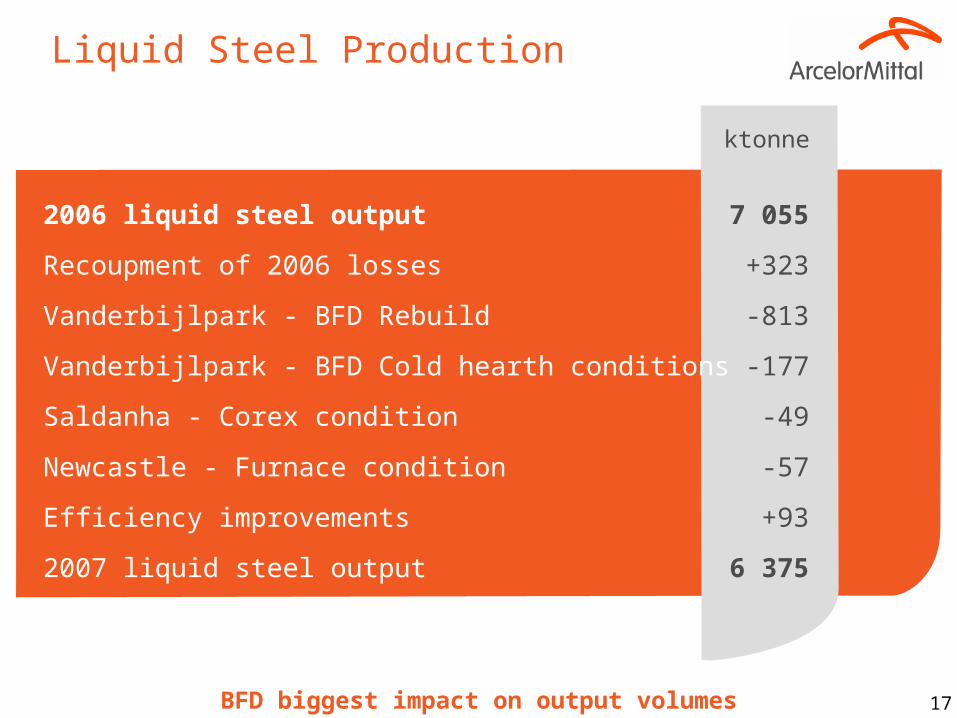
Liquid Steel Production
BFD biggest impact on output volumes
2006 liquid steel output 7 055
Recoupment of 2006 losses +323
Vanderbijlpark - BFD Rebuild -813
Vanderbijlpark - BFD Cold hearth conditions -177
Saldanha - Corex condition -49
Newcastle - Furnace condition -57
Efficiency improvements +93
2007 liquid steel output 6 375
ktonne
18
Operational developments
Blast Furnace D
Market Coke production at battery N2 at Newcastle Works
Galvanizing line 5 achieved full capacity
Colour coating line achieved record output
EAF at Vereeniging produced record volume
Various records at all rolling mills at Newcastle
Blast Furnace D overshadowed production
19
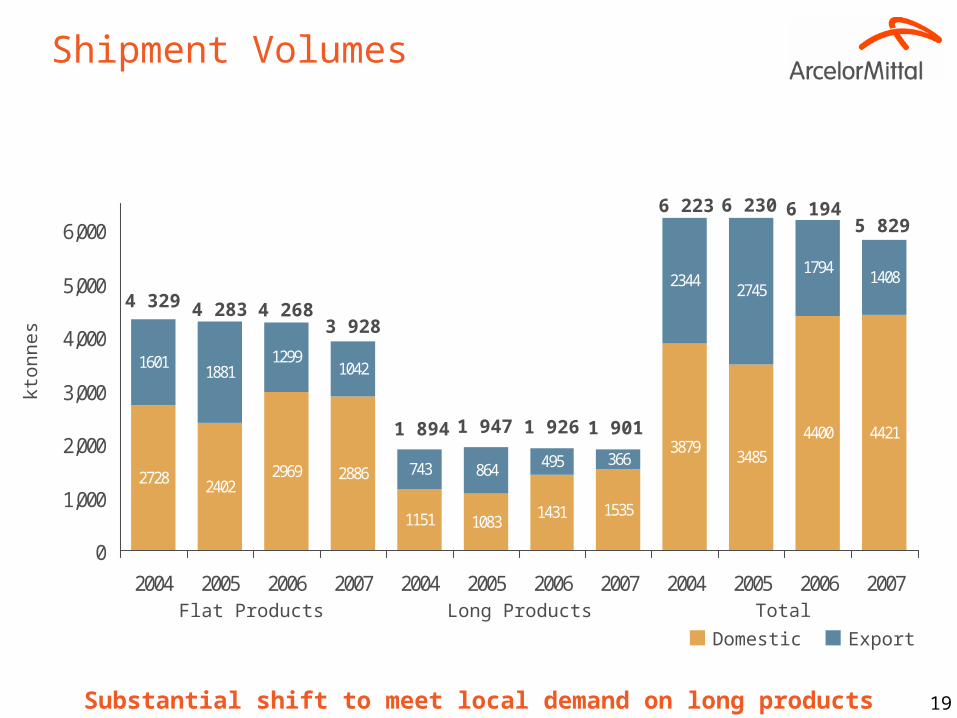
Shipment Volumes
2728 24022969 2886
1151 1083 1431 1535
3879 34854400 4421
1601 18811299
1042
743 864 495 366
2344 27451794 1408
0
1,000
2,000
3,000
4,000
5,000
6,000
2004 2005 2006 2007 2004 2005 2006 2007 2004 2005 2006 2007
kton
nes
ExportDomestic
4 329
1 894
6 223
4 283
1 947
6 230
4 268
1 926
6 194
Flat Products Long Products Total
3 928
1 901
5 829
Substantial shift to meet local demand on long products
20
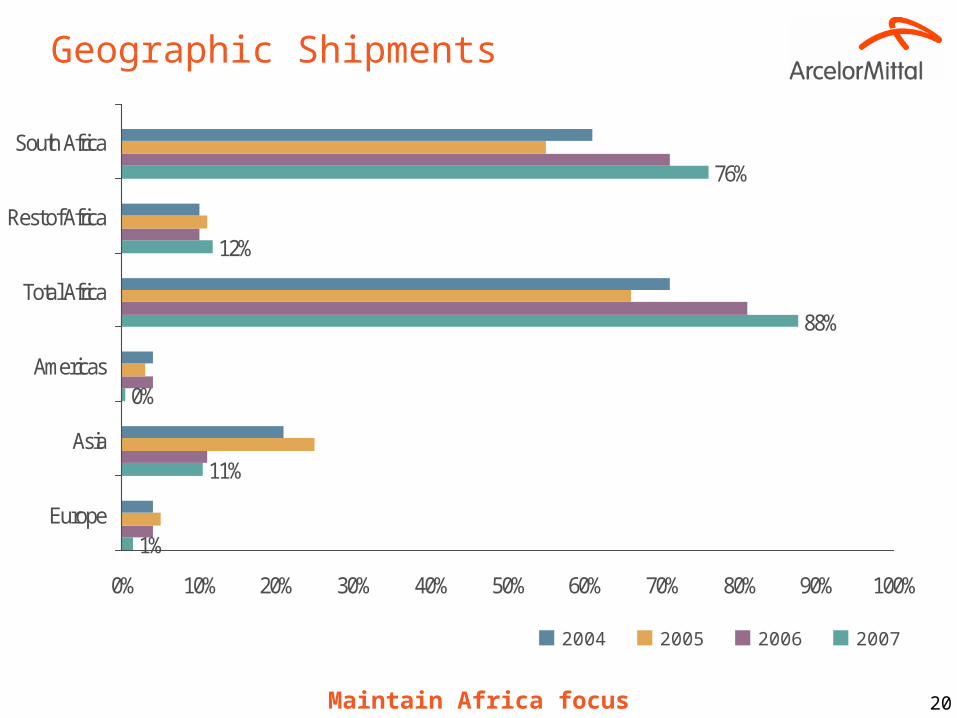
Geographic Shipments
1%
11%
0%
88%
12%
76%
0% 10% 20% 30% 40% 50% 60% 70% 80% 90% 100%
Europe
Asia
Americas
Total Africa
Rest of Africa
South Africa
20062005 20072004
Maintain Africa focus
21
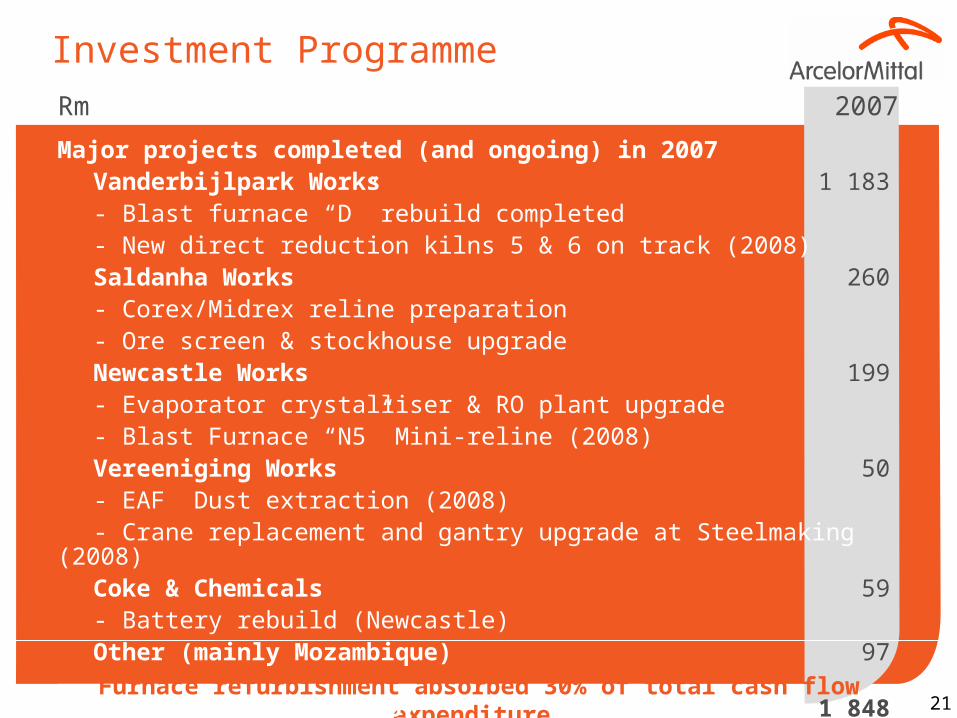
Investment Programme
Furnace refurbishment absorbed 30% of total cash flow expenditure
Rm 2007
Major projects completed (and ongoing) in 2007Vanderbijlpark Works 1 183- Blast furnace “D” rebuild completed- New direct reduction kilns 5 & 6 on track (2008)Saldanha Works 260- Corex/Midrex reline preparation- Ore screen & stockhouse upgradeNewcastle Works 199- Evaporator crystalliser & RO plant upgrade- Blast Furnace “N5” Mini-reline (2008)Vereeniging Works 50- EAF Dust extraction (2008)- Crane replacement and gantry upgrade at Steelmaking (2008)Coke & Chemicals 59- Battery rebuild (Newcastle)Other (mainly Mozambique) 97
Total Expenditure in 2007 1 848
22
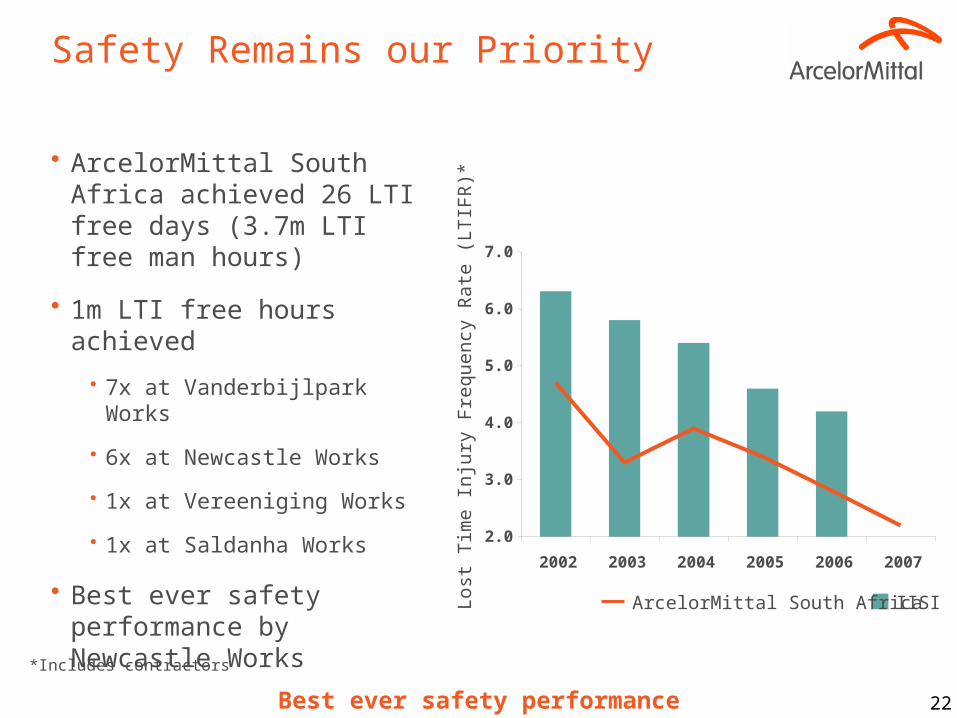
Safety Remains our Priority
ArcelorMittal South Africa achieved 26 LTI free days (3.7m LTI free man hours)
1m LTI free hours achieved
7x at Vanderbijlpark Works
6x at Newcastle Works
1x at Vereeniging Works
1x at Saldanha Works
Best ever safety performance by Newcastle Works
Best ever safety performance
*Includes contractors
IISI
Lost
Tim
e In
jury
Fre
quen
cy R
ate
(LTI
FR)*
2.0
3.0
4.0
5.0
6.0
7.0
2002 2003 2004 2005 2006 2007
ArcelorMittal South Africa
FinanceFinanceKobus VersterKobus Verster
24
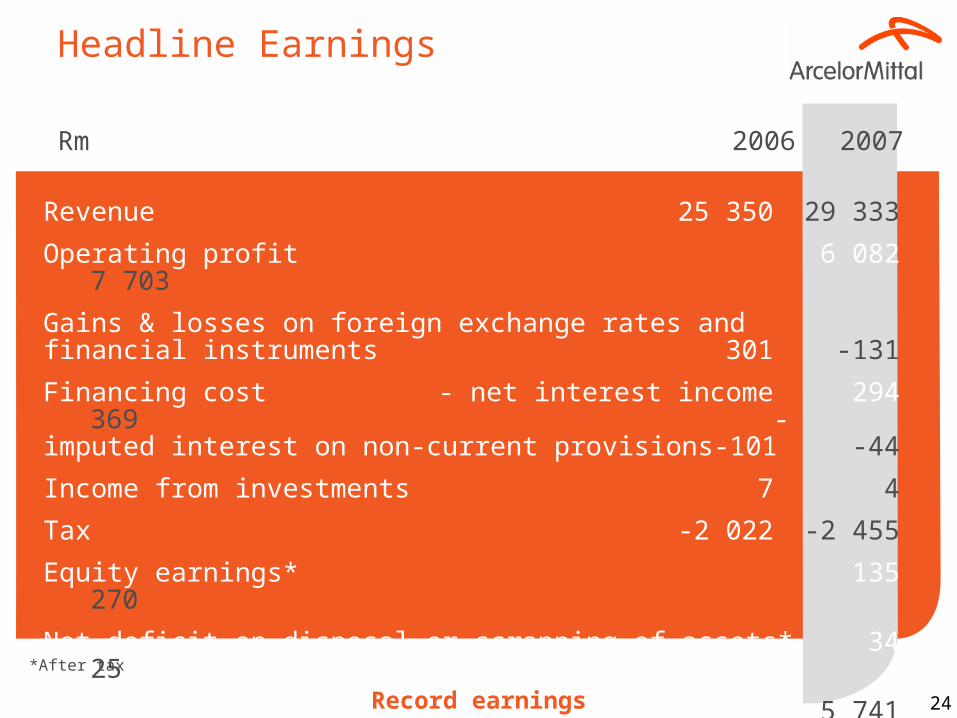
Headline Earnings
Record earnings
Revenue 25 350 29 333
Operating profit 6 082 7 703
Gains & losses on foreign exchange rates and financial instruments 301 -131
Financing cost - net interest income 294 369- imputed interest on non-current provisions -101
-44
Income from investments 7 4
Tax -2 022 -2 455
Equity earnings* 135 270
Net deficit on disposal or scrapping of assets* 34 25
Headline earnings 4 730 5 741- in US$m 693 816
Rm 2006 2007
*After tax
25
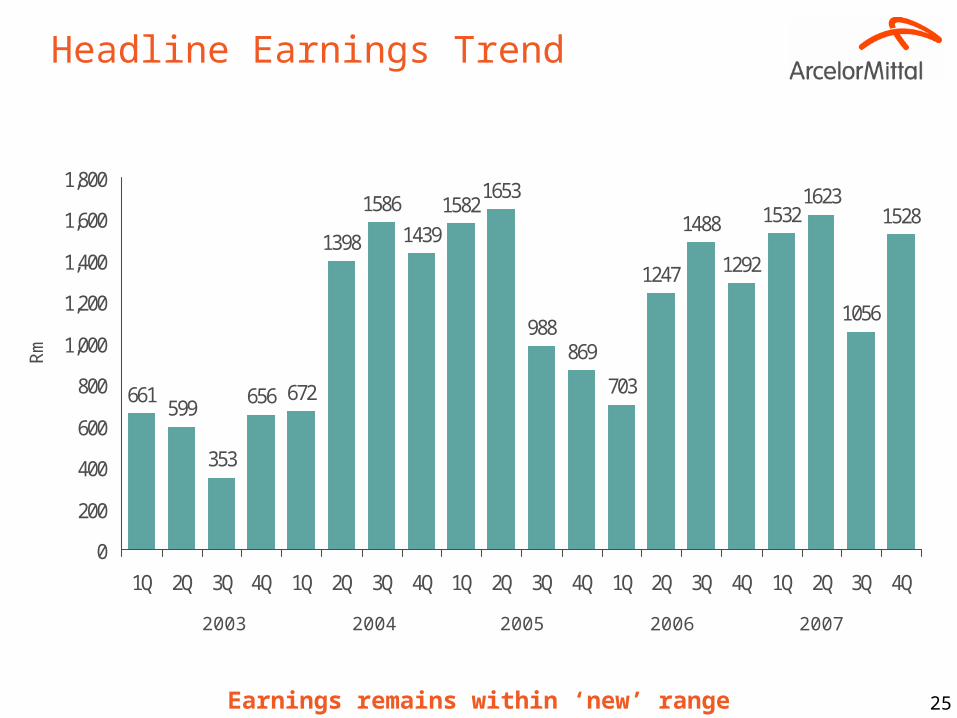
Headline Earnings Trend
661599
353
656 672
1398
15861439
15821653
988869
703
1247
1488
1292
15321623
1056
1528
0
200
400
600
800
1,000
1,200
1,400
1,600
1,800
1Q 2Q 3Q 4Q 1Q 2Q 3Q 4Q 1Q 2Q 3Q 4Q 1Q 2Q 3Q 4Q 1Q 2Q 3Q 4Q
Rm
2003 2004 2005 2006 2007
Earnings remains within ‘new’ range
26
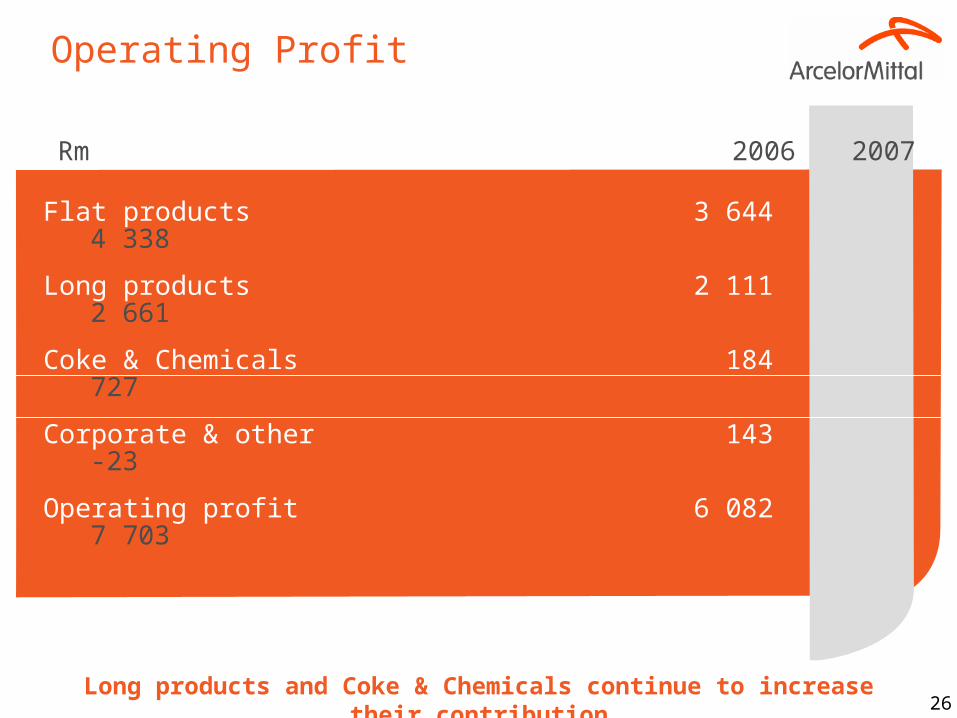
Operating Profit
Long products and Coke & Chemicals continue to increase their contribution
Flat products 3 6444 338
Long products 2 1112 661
Coke & Chemicals 184727
Corporate & other 143-23
Operating profit 6 0827 703
Rm 2006 2007
27
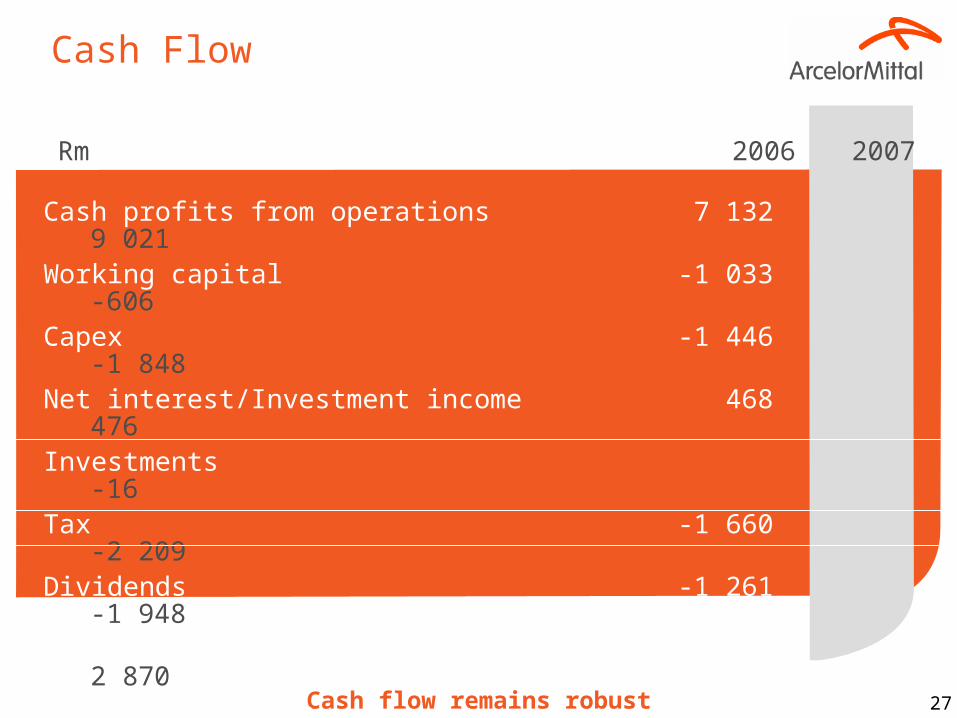
Cash Flow
Cash flow remains robust
Cash profits from operations 7 1329 021
Working capital -1 033-606
Capex -1 446-1 848
Net interest/Investment income 468476
Investments-16
Tax -1 660 -2 209Dividends -1 261
-1 948Net cash flow 2 200
2 870Capital reduction
-6 352Net cash flow after capital reduction 2 200
-3 482Net cash 7 679
3 973
Rm 2006 2007
28
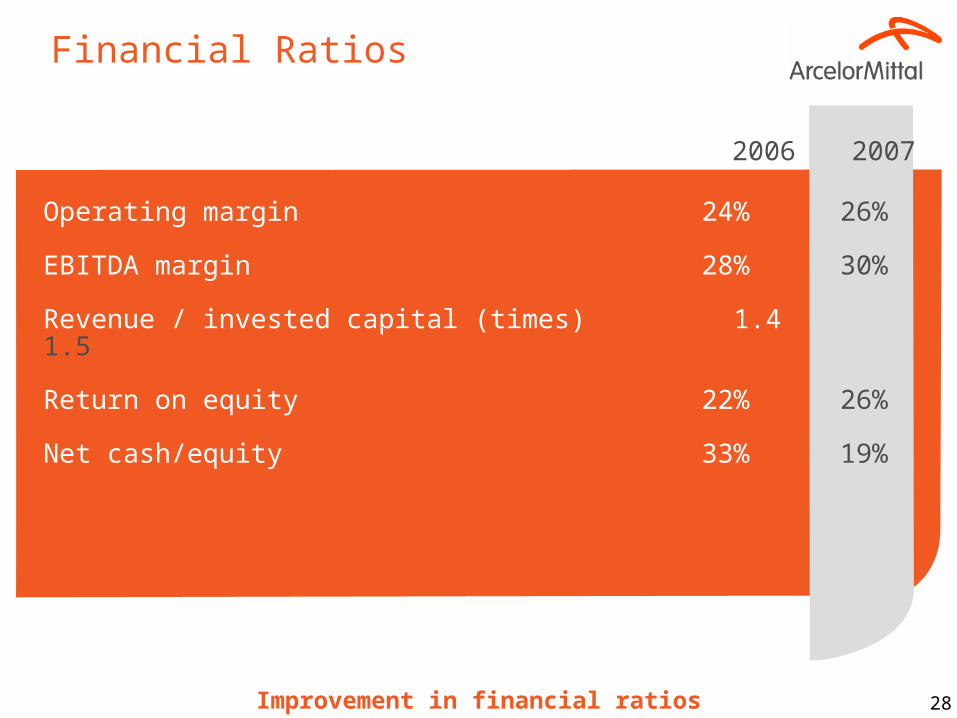
Financial Ratios
Improvement in financial ratios
Operating margin 24% 26%
EBITDA margin 28% 30%
Revenue / invested capital (times) 1.41.5
Return on equity 22% 26%
Net cash/equity 33% 19%
2006 2007
29
50
150
250
350
450
550
650
Arcelor Mittal South Africa ALSI Top 40
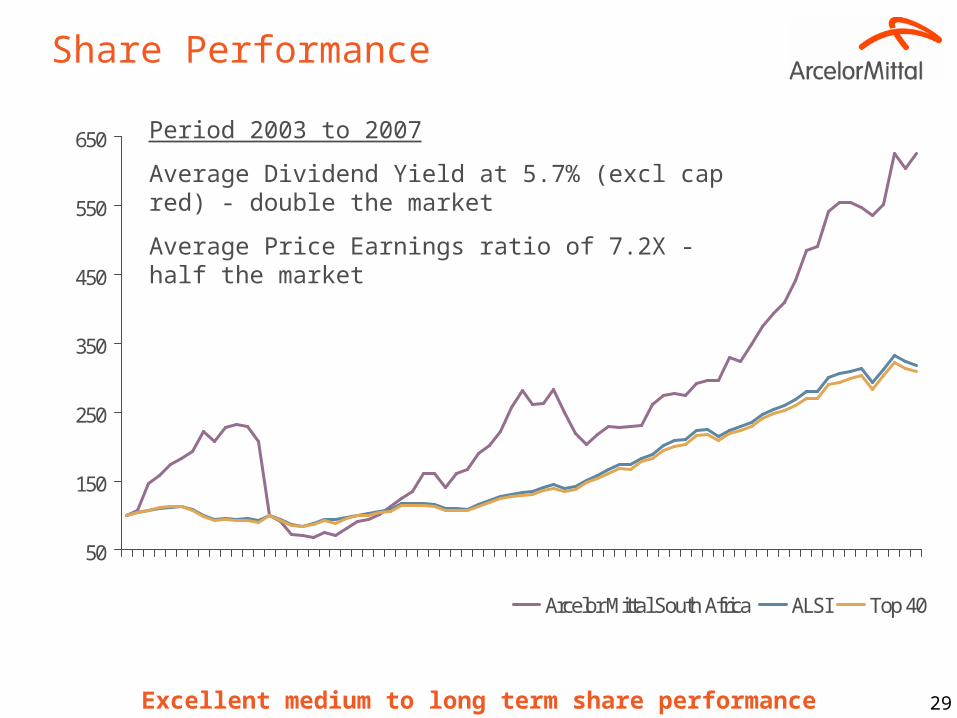
Period 2003 to 2007
Average Dividend Yield at 5.7% (excl cap red) - double the market
Average Price Earnings ratio of 7.2X - half the market
Share Performance
Excellent medium to long term share performance
30
Dividend
Dividend policy Distributing one third of headline earnings
Dividend and cash declared Interim dividend of 233 cents per share - 3 September 2007 Final dividend of 196 cents per share - 17 March 2008 Total dividend of 429 cents covered 3 times by EPS of 1 288 cents
Capital reduction of 1 425 cents - September & October 2007
Total cash distribution of 1 854 cents over past twelve months
Cash yield at 13.6%
Other DevelopmentsOther DevelopmentsRick ReatoRick Reato
32
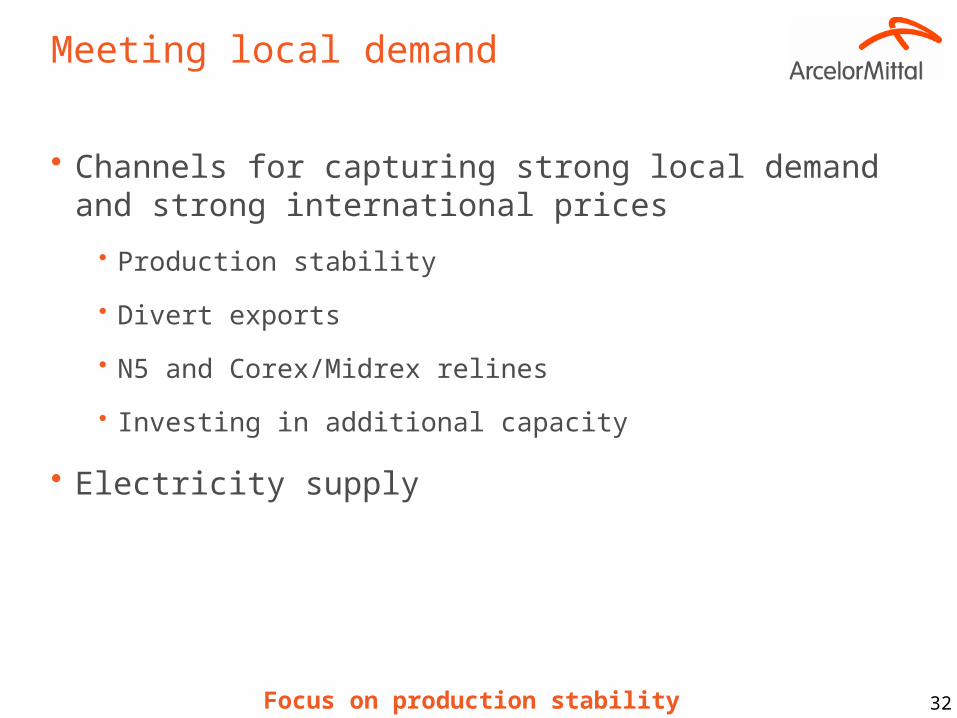
Meeting local demand
Channels for capturing strong local demand and strong international prices
Production stability
Divert exports
N5 and Corex/Midrex relines
Investing in additional capacity
Electricity supply
Focus on production stability
33
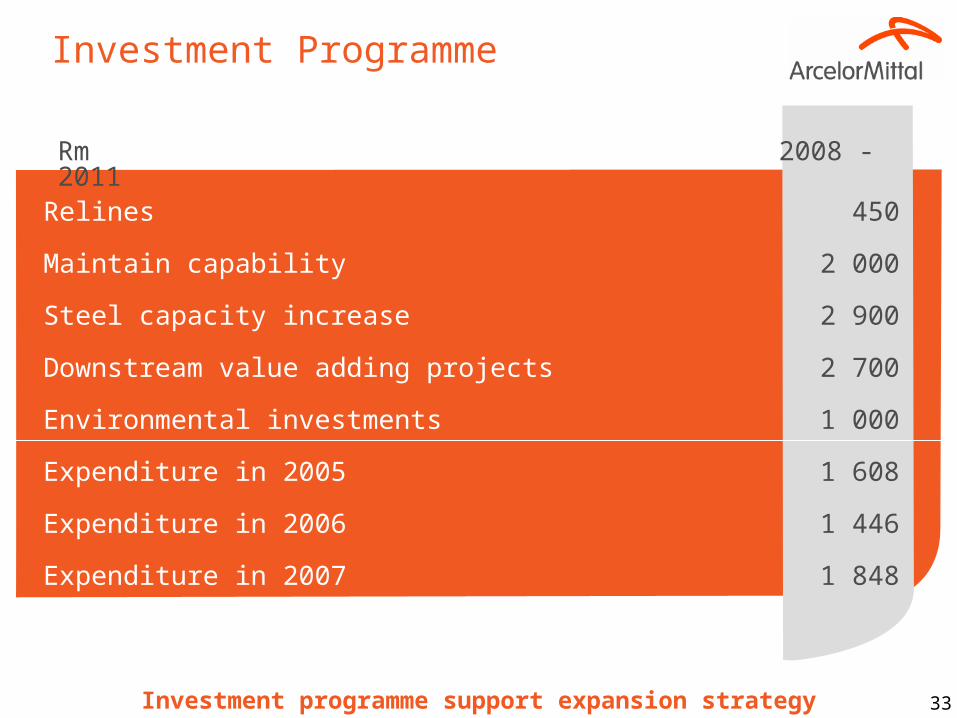
Investment Programme
Investment programme support expansion strategy
Relines 450
Maintain capability 2 000
Steel capacity increase 2 900
Downstream value adding projects 2 700
Environmental investments 1 000
Expenditure in 2005 1 608
Expenditure in 2006 1 446
Expenditure in 2007 1 848
Rm 2008 - 2011
34
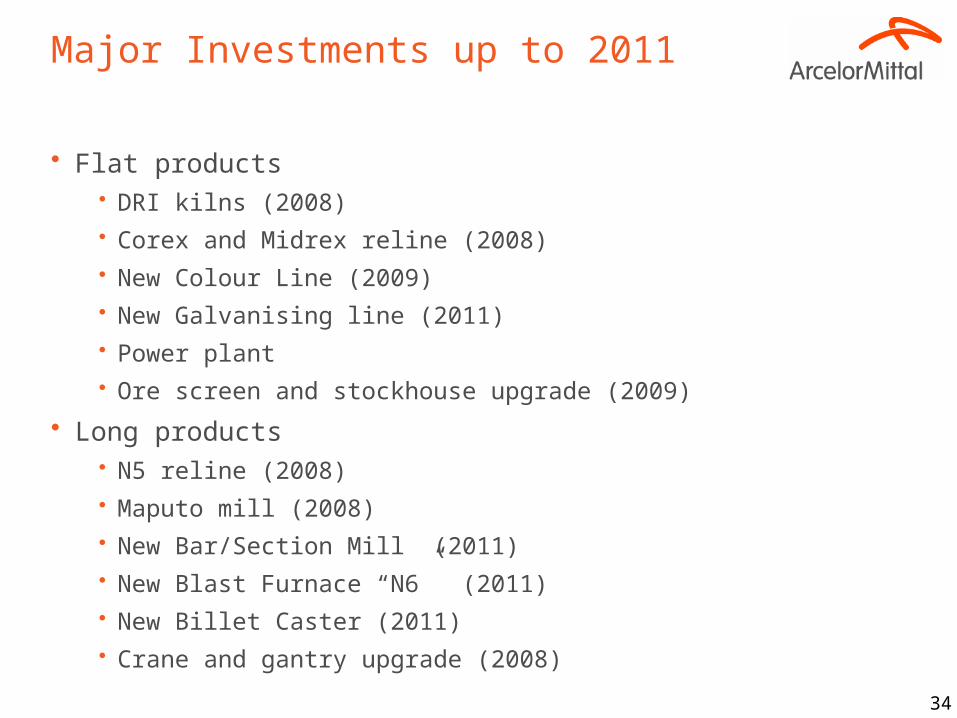
Major Investments up to 2011
Flat products DRI kilns (2008) Corex and Midrex reline (2008) New Colour Line (2009) New Galvanising line (2011) Power plant Ore screen and stockhouse upgrade (2009)
Long products N5 reline (2008) Maputo mill (2008) New Bar/Section Mill (2011) New Blast Furnace “N6” (2011) New Billet Caster (2011) Crane and gantry upgrade (2008)
35
Major Investments up to 2011
Environmental Sinter clean gas EAF dust extraction at Vanderbijlpark Works EAF dust extraction at Vereeniging Works Calcium Carbide Desulphurisation at Newcastle Works Evaporator crystallizer
36
Ongoing developments
Competition Tribunal
SARS BAA dispute
Iron ore supply
Electricity supply
BEE
37
Cost containment
Production stability
Increased throughput
Purchasing power
Efficiency improvements
Cost Control
OutlookOutlookRick ReatoRick Reato
39
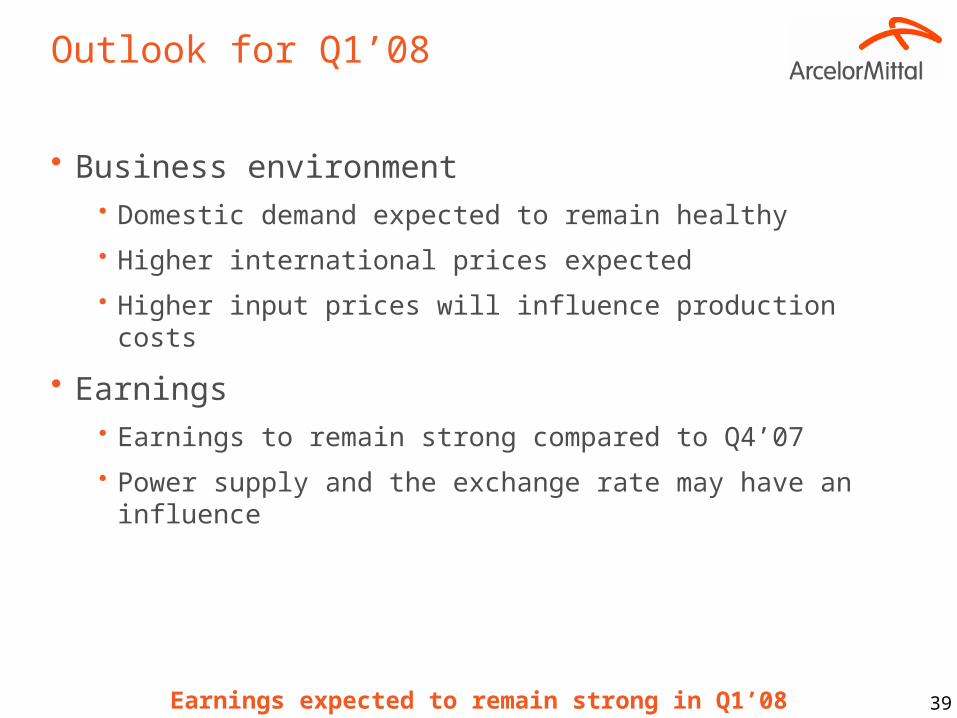
Outlook for Q1’08
Business environment Domestic demand expected to remain healthy Higher international prices expected Higher input prices will influence production costs
Earnings Earnings to remain strong compared to Q4’07 Power supply and the exchange rate may have an influence
Earnings expected to remain strong in Q1’08
Annual Financial ResultsAnnual Financial ResultsThank youThank you
ArcelorMittal South Africa Limited


![Three months ended December 31, Year ended December 31, … · 2016-01-27 · Three months ended December 31, Year ended December 31, 2015 2014 Change ~¦u]oo]}v 2015 2014 Change](https://img.pdfslide.us/doc/110x75/5f05bacd7e708231d41469d5/three-months-ended-december-31-year-ended-december-31-2016-01-27-three-months.jpg)