Embed Size (px)
Citation preview
APSG DocumentationRelease 0.5.1 Beta
Ondrej Lexa
Jun 04, 2018


Contents
1 Package modules 31.1 core module . . . . . . . . . . . . . . . . . . . . . . . . . . . . . . . . . . . . . . . . . . . . . . . 31.2 plotting module . . . . . . . . . . . . . . . . . . . . . . . . . . . . . . . . . . . . . . . . . . . . . . 221.3 tensors module . . . . . . . . . . . . . . . . . . . . . . . . . . . . . . . . . . . . . . . . . . . . . . 231.4 db module . . . . . . . . . . . . . . . . . . . . . . . . . . . . . . . . . . . . . . . . . . . . . . . . 27
2 Tutorial 292.1 Basic usage . . . . . . . . . . . . . . . . . . . . . . . . . . . . . . . . . . . . . . . . . . . . . . . . 292.2 Basic operations with vectors . . . . . . . . . . . . . . . . . . . . . . . . . . . . . . . . . . . . . . 292.3 Classes Lin and Fol . . . . . . . . . . . . . . . . . . . . . . . . . . . . . . . . . . . . . . . . . . . 302.4 Vec3 methods for Lin and Fol . . . . . . . . . . . . . . . . . . . . . . . . . . . . . . . . . . . . . . 312.5 Classes Pair and Fault . . . . . . . . . . . . . . . . . . . . . . . . . . . . . . . . . . . . . . . . . . 312.6 Group class . . . . . . . . . . . . . . . . . . . . . . . . . . . . . . . . . . . . . . . . . . . . . . . . 322.7 Ortensor class . . . . . . . . . . . . . . . . . . . . . . . . . . . . . . . . . . . . . . . . . . . . . . 332.8 StereoNet class . . . . . . . . . . . . . . . . . . . . . . . . . . . . . . . . . . . . . . . . . . . . . . 342.9 StereoGrid class . . . . . . . . . . . . . . . . . . . . . . . . . . . . . . . . . . . . . . . . . . . . . 412.10 FabricPlot class . . . . . . . . . . . . . . . . . . . . . . . . . . . . . . . . . . . . . . . . . . . . . . 442.11 Cluster class . . . . . . . . . . . . . . . . . . . . . . . . . . . . . . . . . . . . . . . . . . . . . . . 452.12 Some tricks . . . . . . . . . . . . . . . . . . . . . . . . . . . . . . . . . . . . . . . . . . . . . . . . 48
3 Installation 533.1 Conda package . . . . . . . . . . . . . . . . . . . . . . . . . . . . . . . . . . . . . . . . . . . . . . 533.2 Using pip . . . . . . . . . . . . . . . . . . . . . . . . . . . . . . . . . . . . . . . . . . . . . . . . . 533.3 Developement version . . . . . . . . . . . . . . . . . . . . . . . . . . . . . . . . . . . . . . . . . . 53
4 Usage 55
5 Contributing 575.1 Types of Contributions . . . . . . . . . . . . . . . . . . . . . . . . . . . . . . . . . . . . . . . . . . 575.2 Get Started! . . . . . . . . . . . . . . . . . . . . . . . . . . . . . . . . . . . . . . . . . . . . . . . . 585.3 Pull Request Guidelines . . . . . . . . . . . . . . . . . . . . . . . . . . . . . . . . . . . . . . . . . 595.4 Tips . . . . . . . . . . . . . . . . . . . . . . . . . . . . . . . . . . . . . . . . . . . . . . . . . . . . 59
6 Credits 616.1 Development Lead . . . . . . . . . . . . . . . . . . . . . . . . . . . . . . . . . . . . . . . . . . . . 616.2 Contributors . . . . . . . . . . . . . . . . . . . . . . . . . . . . . . . . . . . . . . . . . . . . . . . 61
i

7 Changes 637.1 0.1 (01 Nov 2014) . . . . . . . . . . . . . . . . . . . . . . . . . . . . . . . . . . . . . . . . . . . . 637.2 0.2 (09 Dec 2014) . . . . . . . . . . . . . . . . . . . . . . . . . . . . . . . . . . . . . . . . . . . . 637.3 0.2 (09 Dec 2014) . . . . . . . . . . . . . . . . . . . . . . . . . . . . . . . . . . . . . . . . . . . . 637.4 0.3 (09 Nov 2015) . . . . . . . . . . . . . . . . . . . . . . . . . . . . . . . . . . . . . . . . . . . . 64
Python Module Index 69
ii

APSG Documentation, Release 0.5.1 Beta
APSG defines several new python classes to easily manage, analyze and visualize orientational structural geology data.It is under active developement, so until documenation will be finished, you can go trough tutorial to see what APSGcan do for you.
Contents:
Contents 1

APSG Documentation, Release 0.5.1 Beta
2 Contents

CHAPTER 1
Package modules
APSG provides following modules:
1.1 core module
Python module to manipulate, analyze and visualize structural geology data
class apsg.core.Vec3Bases: numpy.ndarray
Vec3 is APSG base class to store 3D vectors derived from numpy.ndarray on which Lin and Fol classesare based.
Vec3 support most of common vector algebra using following operators:
• + - vector addition
• - - vector subtraction
• * - dor product
• ** - cross product
• abs - magnitude (length) of vector
See following methods and properties for additional operations.
Parameters
• a (array_like) – Input data, that can be converted to an array. This includes lists, tuplesand ndarrays. When more than one argument is passed (i.e. inc is not None) a is interpretedas dip direction of vector in degrees
• inc (float) – None or dip of vector in degrees
• mag (float) – magnitude of vector if inc is not None
Returns Vec3 object
3

APSG Documentation, Release 0.5.1 Beta
Example
>>> v = Vec3([1, 0.2, 1.6])>>> v = Vec3(120, 60) # dip-dir and dip of unit length vector>>> v = Vec3(120, 60, 3) # dip-dir, dip and magnitude of vector
H(other)Returns DefGrad rotational matrix H which rotate vector u to vector v
Parameters other (Vec3) – other vector
Returns Defgrad rotational matrix
Example
>>> u.transform(u.H(v)) == vTrue
angle(other)Angle of two vectors in degrees.
Parameters other – other Vec3 vector
Returns angle of self and other in degrees
Example
>>> u.angle(v)90.0
cross(other)Cross product of two vectors.
Parameters other – other Vec3 vector
Returns cross product of self and other
Example
>>> v = Vec3([0,2,-2])>>> u.cross(v)V(-4.000, 2.000, 2.000)
proj(other)Returns projection of vector u onto vector v.
Parameters other (Vec3) – other vector
Returns vector representation of self projected onto ‘other’
4 Chapter 1. Package modules

APSG Documentation, Release 0.5.1 Beta
Example
>> u.proj(v)
Note: To project on plane use: u - u.proj(v), where v is plane normal.
rotate(axis, phi)Returns rotated vector about axis.
Parameters
• axis (Vec3) – axis of rotation
• phi (float) – angle of rotation in degrees
Returns vector represenatation of self rotated phi degrees about vector axis. Rotation is clock-wise along axis direction.
Example
>>> v.rotate(u, 60)V(-2.000, 2.000, -0.000)
transform(F)Returns affine transformation of vector u by matrix F.
Parameters F (DefGrad or numpy.array) – transformation matrix
Returns vector representation of affine transformation (dot product) of self by F
Example
>>> u.transform(F)
VConvert self to Vec3 object
Alias of asvec3 property
asfolConvert self to Fol object
Example
>>> u = Vec3([1,1,1])>>> u.asfolS:225/55
aslinConvert self to Lin object
1.1. core module 5

APSG Documentation, Release 0.5.1 Beta
Example
>>> u = Vec3([1,1,1])>>> u.aslinL:45/35
asvec3Convert self to Vec3 object
Example
>>> l = Lin(120,50)>>> l.asvec3V(-0.321, 0.557, 0.766)
ddReturns dip-direction, dip tuple
Example
>>> azi, inc = v.dd
typeReturns type of self
uvNormalize vector to unit length
Returns unit vector of self
Example
>>> u = Vec3([1,1,1])>>> u.uvV(0.577, 0.577, 0.577)
class apsg.core.LinBases: apsg.core.Vec3
Class to store linear feature. It provides all Vec3 methods and properties but behave as axial vector.
Parameters
• azi – dip direction of linear feature in degrees
• inc – dip of linear feature in degrees
Example
>>> l = Lin(120, 60)
angle(other)Returns angle (<90) of two linear features in degrees
6 Chapter 1. Package modules

APSG Documentation, Release 0.5.1 Beta
Example
>>> u.angle(v)90.0
cross(other)Construct planar feature defined by two linear features
Example
>>> l=Lin(120,10)>>> l.cross(Lin(160,30))S:196/35
dot(other)Axial dot product
ddReturns dip-direction, dip tuple
class apsg.core.FolBases: apsg.core.Vec3
Class to store planar feature. It provides all Vec3 methods and properties but plane normal behave as axialvector.
Parameters
• azi – dip direction of planar feature in degrees
• inc – dip of planar feature in degrees
Example
>>> f = Fol(120, 60)
angle(other)Returns angle of two planar features in degrees
Example
>>> u.angle(v)90.0
cross(other)Returns linear feature defined as intersection of two planar features
Example
>>> f=Fol(60,30)>>> f.cross(Fol(120,40))L:72/29
1.1. core module 7

APSG Documentation, Release 0.5.1 Beta
dot(other)Axial dot product
rake(rake)Returns vector Vec3 object with given rake.
Example
>>> f = Fol(120,50)>>> f.rake(30)V(-0.911, -0.155, 0.383)>>> f.rake(30).aslin
transform(F)Returns affine transformation of planar feature by matrix F.
Parameters F (DefGrad or numpy.array) – transformation matrix
Returns representation of affine transformation (dot product) of self by F
Example
>>> f.transform(F)
ddReturn dip-direction, dip tuple
dvReturns dip vector Vec3 object.
Example
>>> f = Fol(120,50)>>> f.dvV(-0.321, 0.557, 0.766)
rhrReturn strike and dip tuple (right-hand-rule)
class apsg.core.Pair(fazi, finc, lazi, linc)Bases: object
Class to store pair of planar and linear feature.
When Pair object is created, both planar and linear feature are adjusted, so linear feature perfectly fit ontoplanar one. Warning is issued, when misfit angle is bigger than 20 degrees.
Parameters
• fazi (float) – Dip direction of planar feature in degrees
• finc (float) – dip of planar feature in degrees
• lazi (float) – Dip direction of linear feature in degrees
• linc (float) – dip of linear feature in degrees
8 Chapter 1. Package modules

APSG Documentation, Release 0.5.1 Beta
Example
>>> p = Pair(140, 30, 110, 26)
classmethod from_pair(fol, lin)Create Pair from Fol and Lin objects
Example
>>> f = Fol(140, 30)>>> l = Lin(110, 26)>>> p = Pair.from_pair(f, l)
rotate(axis, phi)Rotates Pair by angle phi about axis.
Parameters
• axis (Vec3) – axis of rotation
• phi (float) – angle of rotation in degrees
Example
>>> p = Pair(140, 30, 110, 26)>>> p.rotate(Lin(40, 50), 120)P:210/83-287/60
transform(F)Returns affine transformation of Pair by matrix F.
Parameters F (DefGrad or numpy.array) – transformation matrix
Returns representation of affine transformation (dot product) of self by F
Example
>>> p.transform(F)
folReturns planar feature of Pair as Fol.
linReturns linear feature of Pair as Lin.
raxReturns oriented vector perpendicular to both Fol and Lin.
type
class apsg.core.Fault(fazi, finc, lazi, linc, sense)Bases: apsg.core.Pair
Fault class for related Fol and Lin instances with sense of movement.
1.1. core module 9

APSG Documentation, Release 0.5.1 Beta
When Fault object is created, both planar and linear feature are adjusted, so linear feature perfectly fit ontoplanar one. Warning is issued, when misfit angle is bigger than 20 degrees.
Parameters
• fazi (float) – dip direction of planar feature in degrees
• finc (float) – dip of planar feature in degrees
• lazi (float) – dip direction of linear feature in degrees
• linc (float) – dip of linear feature in degrees
• sense (float) – sense of movement +/-1 hanging-wall up/down
Example
>>> p = Fault(140, 30, 110, 26, -1)
classmethod from_pair(fol, lin, sense)Create Fault with given sense from Fol and Lin objects
classmethod from_vecs(fvec, lvec)Create Fault from two ortogonal Vec3 objects
Parameters
• fvec – vector normal to fault plane
• lvec – vector parallel to movement
rotate(axis, phi)Rotates Fault by phi degrees about axis.
Parameters
• axis – axis of rotation
• phi – angle of rotation in degrees
Example
>>> f = Fault(140, 30, 110, 26, -1)>>> f.rotate(Lin(220, 10), 60)F:300/31-301/31 +
dReturn dihedra plane as Fol
mReturn kinematic M-plane as Fol
pReturn P-axis as Lin
pvecReturn P axis as Vec3
senseReturn sense of movement (+/-1)
10 Chapter 1. Package modules

APSG Documentation, Release 0.5.1 Beta
tReturn T-axis as Lin
tvecReturn T-axis as Vec3.
class apsg.core.Group(data, name=’Default’)Bases: list
Group is homogeneous group of Vec3, Fol or Lin objects.
Group provide append and extend methods as well as list indexing to get or set individual items. It also supportsfollowing operators:
• + - merge groups
• ** - mutual cross product
• abs - array of magnitudes (lengths) of all objects
See following methods and properties for additional operations.
Parameters
• data (list) – list of Vec3, Fol or Lin objects
• name (str) – Name of group
Returns Group object
Example
>>> g = Group([Lin(120, 20), Lin(151, 23), Lin(137, 28)])
angle(other=None)Return angles of all data in Group object
Without arguments it returns angles of all pairs in dataset. If argument is group or single data object allmutual angles are returned.
append(object)→ None – append object to end
bootstrap(N=100, size=None)Return iterator of bootstraped samples from Group.
Parameters
• N – number of samples to be generated
• size – number of data in sample. Default is same as Group.
Example
>>> g = Group.randn_lin(100, mean=Lin(120,40))>>> sm = [gb.R for gb in g.bootstrap(100)]>>> g.fisher_stats{'csd': 18.985075817669784, 'a95': 3.4065695594364684, 'k': 18.→˓203100466576508}>>> Group(sm).fisher_stats{'csd': 1.9142106832769188, 'a95': 0.33404753286607225, 'k': 1790.→˓5669592301119}
1.1. core module 11
APSG Documentation, Release 0.5.1 Beta
copy()→ list – a shallow copy of L
cross(other=None)Return cross products of all data in Group object
Without arguments it returns cross product of all pairs in dataset. If argument is group or single data objectall mutual cross products are returned.
dot(vec)Return array of dot products of all data in Group with vector.
classmethod examples(name=None)Create Group from example datasets. Available names are returned when no name of example dataset isgiven as argument.
Keyword Arguments name – name of dataset
Example
>>> g = Group.examples('B2')
extend(iterable)→ None – extend list by appending elements from the iterable
classmethod from_array(azis, incs, typ=<class ’apsg.core.Lin’>, name=’Default’)Create Group object from arrays of dip directions and dips
Parameters
• azis – list or array of dip directions
• incs – list or array of inclinations
Keyword Arguments
• typ – type of data. Fol or Lin
• name – name of Group object. Default is ‘Default’
Example
>>> f = Fault(140, 30, 110, 26, -1)
classmethod from_csv(fname, typ=<class ’apsg.core.Lin’>, delimiter=’, ’, acol=1, icol=2)Create Group object from csv file
Parameters fname – csv filename
Keyword Arguments
• typ – Type of objects. Default Lin
• delimiter (str) – values delimiter. Default ‘,’
• acol (int) – azimuth column. Default 1
• icol (int) – inclination column. Default 2
12 Chapter 1. Package modules

APSG Documentation, Release 0.5.1 Beta
Example
>>> g = Group.from_csv('file.csv', typ=Fol, acol=2, icol=3)
classmethod from_file(filename=’group.dat’)Load group to file.
Keyword Arguments filename (str) – name of data file to load. Default ‘group.dat’
classmethod gss_fol(N=500, name=’Default’)Method to create Group of uniformly distributed Fol objects. Based on Group.gss_vec3 method,but only half of sphere is used.
Parameters
• N – number of objects to be generated. Default 500
• name – name of dataset. Default is ‘Default’
Example
>>> g = Group.gss_fol(300)>>> g.ortensor.eigenvalsarray([ 0.33498373, 0.3333366 , 0.33167967])
classmethod gss_lin(N=500, name=’Default’)Method to create Group of uniformly distributed Lin objects. Based on Group.gss_vec3 method,but only half of sphere is used.
Parameters
• N – number of objects to be generated. Default 500
• name – name of dataset. Default is ‘Default’
Example
>>> g = Group.gss_lin(300)>>> g.ortensor.eigenvalsarray([ 0.33498373, 0.3333366 , 0.33167967])
classmethod gss_vec3(N=1000, name=’Default’)Method to create Group of uniformly distributed Vec3 objects. Golden Section Spiral points on a spherealgorithm.
http://www.softimageblog.com/archives/115
Parameters
• N – number of objects to be generated. Default 1000
• name – name of dataset. Default is ‘Default’
1.1. core module 13

APSG Documentation, Release 0.5.1 Beta
Example
>>> v = Group.gss_vec3(300)>>> v.ortensor.eigenvalsarray([ 0.33335689, 0.33332315, 0.33331996])
classmethod kent_lin(p, kappa=20, beta=0, N=500, name=’Default’)Method to create Group of Lin objects distributed according to Kent distribution (Kent, 1982) - The5-parameter Fisher–Bingham distribution.
Parameters
• p – Pair object defining orientation of data
• N – number of objects to be generated
• kappa – concentration parameter. Default 20
• beta – ellipticity 0 <= beta < kappa
• name – name of dataset. Default is ‘Default’
Example
>>> p = Pair(135, 30, 90, 22)>>> g = Group.kent_lin(p, 30, 5, 300)
proj(vec)Return projections of all data in Group onto vector.
classmethod randn_fol(N=100, mean=S:0/0, sig=20, name=’Default’)Method to create Group of normaly distributed random Fol objects.
Keyword Arguments
• N – number of objects to be generated
• mean – mean orientation given as Fol. Default Fol(0, 0)
• sig – sigma of normal distribution. Default 20
• name – name of dataset. Default is ‘Default’
Example
>>> g = Group.randn_fol(100, Lin(240, 60))>>> g.RS:238/61
classmethod randn_lin(N=100, mean=L:0/90, sig=20, name=’Default’)Method to create Group of normaly distributed random Lin objects.
Keyword Arguments
• N – number of objects to be generated
• mean – mean orientation given as Lin. Default Lin(0, 90)
• sig – sigma of normal distribution. Default 20
14 Chapter 1. Package modules

APSG Documentation, Release 0.5.1 Beta
• name – name of dataset. Default is ‘Default’
Example
>>> g = Group.randn_lin(100, Lin(120, 40))>>> g.RL:120/39
rotate(axis, phi)Rotate Group object phi degress about axis.
classmethod sfs_fol(N=500, name=’Default’)Method to create Group of uniformly distributed Fol objects. Based on Group.sfs_vec3 method,but only half of sphere is used.
Parameters
• N – number of objects to be generated. Default 500
• name – name of dataset. Default is ‘Default’
Example
>>> g = Group.sfs_fol(300)>>> g.ortensor.eigenvalsarray([ 0.33417707, 0.33333973, 0.33248319])
classmethod sfs_lin(N=500, name=’Default’)Method to create Group of uniformly distributed Lin objects. Based on Group.sfs_vec3 method,but only half of sphere is used.
Parameters
• N – number of objects to be generated. Default 500
• name – name of dataset. Default is ‘Default’
Example
>>> g = Group.sfs_lin(300)>>> g.ortensor.eigenvalsarray([ 0.33417707, 0.33333973, 0.33248319])
classmethod sfs_vec3(N=1000, name=’Default’)Method to create Group of uniformly distributed Vec3 objects. Spherical Fibonacci Spiral points on asphere algorithm adopted from John Burkardt.
http://people.sc.fsu.edu/~jburkardt/
Keyword Arguments
• N – number of objects to be generated. Default 1000
• name – name of dataset. Default is ‘Default’
1.1. core module 15
APSG Documentation, Release 0.5.1 Beta
Example
>>> v = Group.sfs_vec3(300)>>> v.ortensor.eigenvalsarray([ 0.33346453, 0.33333475, 0.33320072])
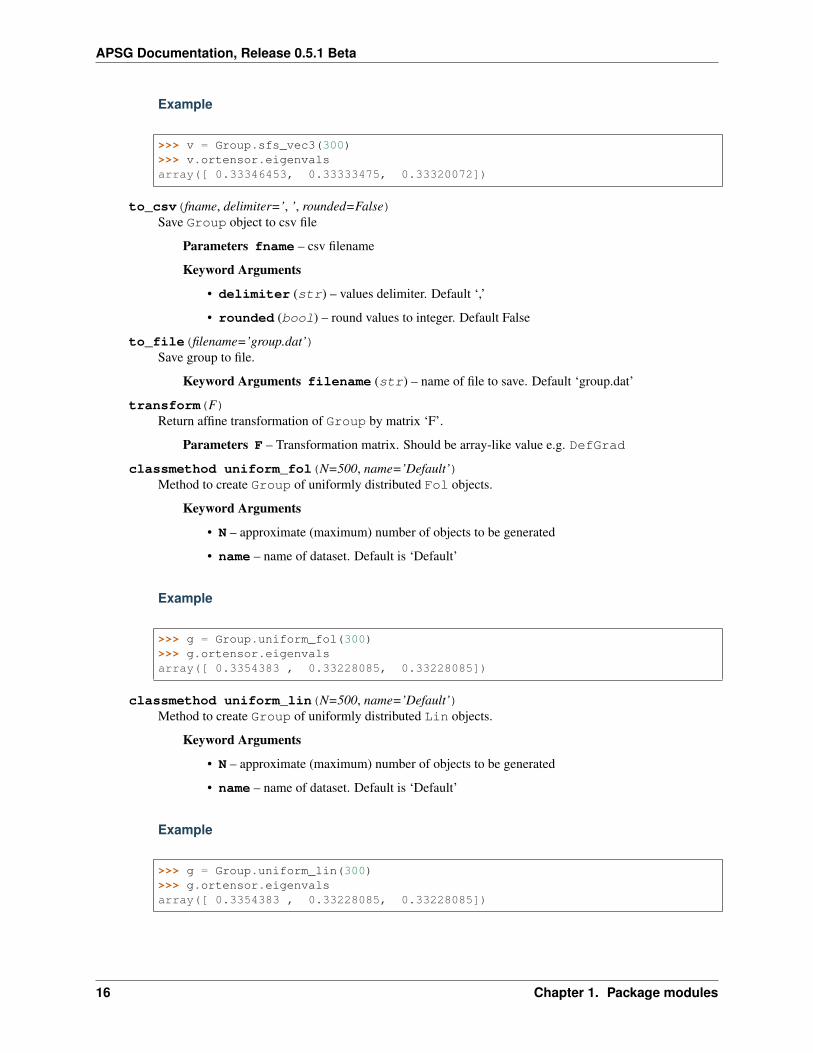
to_csv(fname, delimiter=’, ’, rounded=False)Save Group object to csv file
Parameters fname – csv filename
Keyword Arguments
• delimiter (str) – values delimiter. Default ‘,’
• rounded (bool) – round values to integer. Default False
to_file(filename=’group.dat’)Save group to file.
Keyword Arguments filename (str) – name of file to save. Default ‘group.dat’
transform(F)Return affine transformation of Group by matrix ‘F’.
Parameters F – Transformation matrix. Should be array-like value e.g. DefGrad
classmethod uniform_fol(N=500, name=’Default’)Method to create Group of uniformly distributed Fol objects.
Keyword Arguments
• N – approximate (maximum) number of objects to be generated
• name – name of dataset. Default is ‘Default’
Example
>>> g = Group.uniform_fol(300)>>> g.ortensor.eigenvalsarray([ 0.3354383 , 0.33228085, 0.33228085])
classmethod uniform_lin(N=500, name=’Default’)Method to create Group of uniformly distributed Lin objects.
Keyword Arguments
• N – approximate (maximum) number of objects to be generated
• name – name of dataset. Default is ‘Default’
Example
>>> g = Group.uniform_lin(300)>>> g.ortensor.eigenvalsarray([ 0.3354383 , 0.33228085, 0.33228085])
16 Chapter 1. Package modules

APSG Documentation, Release 0.5.1 Beta
RReturn resultant of data in Group object.
Resultant is of same type as Group. Note that Fol and Lin are axial in nature so resultant can give otherresult than expected. For most cases is should not be problem as it is calculated as resultant of centereddata. Anyway for axial data orientation tensor analysis will give you right answer.
As axial summing is not commutative we use vectorial summing of centered data for Fol and Lin
VReturn Group object with all data converted to Vec3.
asfolReturn Group object with all data converted to Fol.
aslinReturn Group object with all data converted to Lin.
asvec3Return Group object with all data converted to Vec3.
centeredRotate Group object to position that eigenvectors are parallel to axes of coordinate system: E1(vertical),E2(east-west), E3(north-south)
clusterReturn hierarchical clustering Cluster of Group.
dataReturn list of objects in Group.
ddReturn array of dip directions and dips of Group
deltaCone angle containing ~63% of the data in degrees.
fisher_statsFisher’s statistics.
fisher_stats property returns dictionary with k, csd and a95 keywords.
halfspaceChange orientation of vectors in Group, so all have angle<=90 with resultant.
ortensorReturn orientation tensor Ortensor of Group.
rdegreeDegree of preffered orientation of data in Group object.
D = 100 * (2 * |R| - n) / n
rhrReturn array of strikes and dips of Group
totvarReturn total variance based on projections onto resultant
totvar = sum(|x - R|^2) / 2n
Note that difference between totvar and var is measure of difference between sample and population mean
uvReturn Group object with normalized (unit length) elements.
1.1. core module 17

APSG Documentation, Release 0.5.1 Beta
varSpherical variance based on resultant length (Mardia 1972).
var = 1 - |R| / n
class apsg.core.PairSet(data, name=’Default’)Bases: list
PairSet is homogeneous group of Pair objects
append(object)→ None – append object to end
extend(iterable)→ None – extend list by appending elements from the iterable
classmethod from_array(fazis, fincs, lazis, lincs, name=’Default’)Create PairSet from arrays of dip directions and dips
classmethod from_csv(fname, delimiter=’, ’, facol=1, ficol=2, lacol=3, licol=4)Read PairSet from csv file
rotate(axis, phi)Rotate PairSet
to_csv(fname, delimiter=’, ’, rounded=False)
data
folReturn Fol part of PairSet as Group of Fol
fvecReturn vectors of Fol of PairSet as Group of Vec3
linReturn Lin part of PairSet as Group of Lin
lvecReturn vectors of Lin part of PairSet as Group of Vec3
misfitReturn array of misfits
class apsg.core.FaultSet(data, name=’Default’)Bases: apsg.core.PairSet
FaultSet is homogeneous group of Fault objects
angmech(method=’classic’)Implementation of Angelier-Mechler dihedra method
Parameters
• method – ‘probability’ or ‘classic’. Classic method assigns +/-1
• individual positions, while 'probability' returns maximum(to) –
• estimate. (likelihood) –
classmethod examples(name=None)Create FaultSet from example datasets. Available names are returned when no name of example datasetis given as argument.
Keyword Arguments name – name of dataset
18 Chapter 1. Package modules

APSG Documentation, Release 0.5.1 Beta
Example
>>> fs = FaultSet.examples('MELE')
classmethod from_array(fazis, fincs, lazis, lincs, senses, name=’Default’)Create dataset from arrays of dip directions and dips
classmethod from_csv(fname, delimiter=’, ’, facol=1, ficol=2, lacol=3, licol=4, scol=5)Read FaultSet from csv file
to_csv(fname, delimiter=’, ’, rounded=False)
dReturn dihedra planes of FaultSet as Group of Fol
mReturn m-planes of FaultSet as Group of Fol
pReturn p-axes of FaultSet as Group of Lin
pvecReturn p-axes of FaultSet as Group of Vec3
senseReturn array of sense values
tReturn t-axes of FaultSet as Group of Lin
tvecReturn t-axes of FaultSet as Group of Vec3
class apsg.core.Ortensor(d, **kwargs)Bases: object
Ortensor is orientation tensor, which characterize data distribution using eigenvalue method. See (Watson 1966,Scheidegger 1965).
See following methods and properties for additional operations.
Parameters data (Group) – grou of Vec3, Fol or Lin objects
Returns Ortensor object
Example
>>> g = Group.examples('B2')>>> ot = Ortensor(g)>>> otOrtensor: B2 Kind: prolate(E1:0.9825,E2:0.01039,E3:0.007101)[[ 0.19780807 -0.13566589 -0.35878837][-0.13566589 0.10492993 0.25970594][-0.35878837 0.25970594 0.697262 ]]>>> ot.eigenlins.data[L:144/57, L:360/28, L:261/16]
BCylindricity index - Vollmer, 1990
1.1. core module 19

APSG Documentation, Release 0.5.1 Beta
CCylindricity index
E1Max eigenvalue
E2Middle eigenvalue
E3Min eigenvalue
GGirdle index - Vollmer, 1990
IIntensity index - Lisle, 1985
MADReturn approximate deviation according to shape
MADoReturn approximate deviation from the plane normal to E3
MADpReturn approximate angular deviation from the major axis along E1
PPoint index - Vollmer, 1990
RRandom index - Vollmer, 1990
eigenfolsReturn group of eigenvectors as Fol objects
eigenlinsReturn group of eigenvectors as Lin objects
eigenvectsReturn group of eigenvectors. If scaled property is True their length is scaled by eigenvalues, otherwisewith unit length.
kindReturn descriptive type of ellipsoid
shapeWoodcock shape
strengthWoodcock strength
class apsg.core.Cluster(d, **kwargs)Bases: object
Cluster provides hierarchical clustering using scipy.cluster routines.
Distance matrix is calculated as angle beetween features, where Fol and Lin use axial angles while Vec3 usesdirection angles.
cluster(**kwargs)Do clustering on data
Result is stored as tuple of Groups in groups property.
20 Chapter 1. Package modules
APSG Documentation, Release 0.5.1 Beta
Keyword Arguments
• criterion – The criterion to use in forming flat clusters
• maxclust – number of clusters
• angle – maximum cophenetic distance(angle) in clusters
dendrogram(**kwargs)Show dendrogram
See scipy.cluster.hierarchy.dendrogram for possible kwargs.
elbow(no_plot=False, n=None)Plot within groups variance vs. number of clusters.
Elbow criterion could be used to determine number of clusters.
linkage(**kwargs)Do linkage of distance matrix
Keyword Arguments method – The linkage algorithm to use
RReturn group of clusters resultants.
class apsg.core.StereoGrid(d=None, **kwargs)Bases: object
Class to store regular grid of values to be contoured on StereoNet.
StereoGrid object could be calculated from Group object or by user- defined function, which accept unitvector as argument.
Parameters
• g – Group object of data to be used for desity calculation. If
• zero values grid is returned. (ommited,) –
Keyword Arguments
• npoints – approximate number of grid points Default 1800
• grid – type of grid ‘radial’ or ‘ortho’. Default ‘radial’
• sigma – sigma for kernels. Default 1
• method – ‘exp_kamb’, ‘linear_kamb’, ‘square_kamb’, ‘schmidt’, ‘kamb’. Default‘exp_kamb’
• trim – Set negative values to zero. Default False
• weighted – use euclidean norms as weights. Default False
apply_func(func, *args, **kwargs)Calculate values using function passed as argument. Function must accept vector (3 elements array) asargument and return scalar value.
calculate_density(dcdata, **kwargs)Calculate density of elements from Group object.
contour(*args, **kwargs)Show contours of values.
contourf(*args, **kwargs)Show filled contours of values.
1.1. core module 21

APSG Documentation, Release 0.5.1 Beta
initgrid(**kwargs)
plotcountgrid()Show counting grid.
apsg.core.G(s, typ=<class ’apsg.core.Lin’>, name=’Default’)Create group from space separated string of dip directions and dips
1.2 plotting module
class apsg.plotting.StereoNet(*args, **kwargs)Bases: object
StereoNet class for Schmidt net plotting
animate(**kwargs)
arrow(pos_lin, dir_lin=None, sense=1, **kwargs)
axtitle(title)
cla()Clear projection
close()
cone(obj, alpha, *args, **kwargs)
contour(obj, *args, **kwargs)
contourf(obj, *args, **kwargs)
draw()
fault(obj, *arg, **kwargs)Plot a fault-and-striae plot - Angelier plot
format_coord(x, y)
getfol()get Fol by mouse click
getfols()get Group of Fol by mouse
getlin()get Lin by mouse click
getlins()get Group of Lin by mouse
hoeppner(obj, *arg, **kwargs)Plot a tangent lineation plot - Hoeppner plot
line(obj, *args, **kwargs)
new()Re-initialize StereoNet figure
pair(obj, *arg, **kwargs)Plot a fol-lin pair
plane(obj, *args, **kwargs)
22 Chapter 1. Package modules

APSG Documentation, Release 0.5.1 Beta
pole(obj, *args, **kwargs)
savefig(filename=’apsg_stereonet.pdf’, **kwargs)
show()
tensor(obj, *arg, **kwargs)Plot tensor pricipal planes or directions
vector(obj, *args, **kwargs)This mimics plotting on upper and lower hemisphere
closed
class apsg.plotting.FabricPlot(*args, **kwargs)Bases: object
FabricPlot class for triangular fabric plot (Vollmer, 1989)
cla()Clear projection
close()
draw()
format_coord(x, y)
new()Re-initialize StereoNet figure
plot(obj, *args, **kwargs)
savefig(filename=’apsg_fabricplot.pdf’, **kwargs)
show()
triplot(a, b, c, *args, **kwargs)
closed
apsg.plotting.rose(a, bins=13, **kwargs)Plot rose diagram
1.3 tensors module
class apsg.tensors.DefGradBases: numpy.ndarray
DefGrad store deformation gradient tensor derived from numpy.ndarray
Parameters a (3x3 array_like) – Input data, that can be converted to an 3x3 2D array. Thisincludes lists, tuples and ndarrays.
Returns DefGrad object
Example
>>> F = DefGrad(np.diag([2, 1, 0.5]))
classmethod from_axis(vector, theta)Return DefGrad representing rotation around axis.
1.3. tensors module 23

APSG Documentation, Release 0.5.1 Beta
Parameters
• vector – Rotation axis as Vec3 like object
• theta – Angle of rotation in degrees
Example
>>> F = DefGrad.from_axis(Lin(120, 30), 45)
classmethod from_comp(xx=1, xy=0, xz=0, yx=0, yy=1, yz=0, zx=0, zy=0, zz=1)Return DefGrad tensor. Default is identity tensor.
Keyword Arguments xy, xz, yx, yy, yz, zx, zy, zz (xx,) – tensor components
Example
>>> F = DefGrad.from_comp(xy=1, zy=-0.5)>>> FDefGrad:[[ 1. 1. 0. ][ 0. 1. 0. ][ 0. -0.5 1. ]]
classmethod from_pair(p)
rotate(vector, theta)Rotate tensor around axis by angle theta
Using rotation matrix it returns F = R*F*R.T
E1Max eigenvalue
E2Middle eigenvalue
E3Min eigenvalue
IReturns inverse tensor
RReturn rotation part of DefGrad from polar decomposition.
UReturn stretching part of DefGrad from right polar decomposition.
VReturn stretching part of DefGrad from left polar decomposition.
eigenfolsReturn `Group` of principal eigenvectors as Fol objects.
eigenlinsReturn `Group` of principal eigenvectors as Lin objects.
24 Chapter 1. Package modules

APSG Documentation, Release 0.5.1 Beta
eigenvalsReturn tuple of sorted eigenvalues
eigenvectsReturn `Group` of principal eigenvectors as Vec3 objects.
class apsg.tensors.VelGradBases: numpy.ndarray
VelGrad store velocity gradient tensor derived from numpy.ndarray
Parameters a (3x3 array_like) – Input data, that can be converted to an 3x3 2D array. Thisincludes lists, tuples and ndarrays.
Returns VelGrad object
Example
>>> L = VelGrad(np.diag([0.1, 0, -0.1]))
defgrad(time=1)Return DefGrad accumulated after given time
classmethod from_comp(xx=0, xy=0, xz=0, yx=0, yy=0, yz=0, zx=0, zy=0, zz=0)Return VelGrad tensor. Default is zero tensor.
Keyword Arguments xy, xz, yx, yy, yz, zx, zy, zz (xx,) – tensor components
Example
>>> L = VelGrad.from_comp(xx=0.1, zz=-0.1)>>> LVelGrad:[[ 0.1 0. 0. ][ 0. 0. 0. ][ 0. 0. -0.1]]
rateReturn rate of deformation tensor
spinReturn spin tensor
class apsg.tensors.StressBases: numpy.ndarray
Stress store stress tensor derived from numpy.ndarray
Parameters a (3x3 array_like) – Input data, that can be converted to an 3x3 2D array. Thisincludes lists, tuples and ndarrays.
Returns Stress object
Example
>>> S = Stress([[-8, 0, 0],[0, -5, 0],[0, 0, -1]])
1.3. tensors module 25

APSG Documentation, Release 0.5.1 Beta
cauchy(n)Return stress vector associated with plane given by normal vector
Parameters n – normal given as Vec3 or Fol object
Example
>>> S = Stress.from_comp(xx=-5, yy=-2, zz=10, xy=1)>>> S.cauchy(Fol(160, 30))V(-2.520, 0.812, 8.660)
fault(n)Return Fault object derived from given by normal vector
Parameters n – normal given as Vec3 or Fol object
Example
S = Stress.from_comp(xx=-5, yy=-2, zz=10, xy=8) >>> S.fault(Fol(160, 30)) F:160/30-141/29 +
classmethod from_comp(xx=0, xy=0, xz=0, yy=0, yz=0, zz=0)Return Stress tensor. Default is zero tensor. Note that stress tensor must be symmetrical.
Keyword Arguments xy, xz, yy, yz, zz (xx,) – tensor components
Example
>>> S = Stress.from_comp(xx=-5, yy=-2, zz=10, xy=1)>>> SStress:[[-5 1 0][ 1 -2 0][ 0 0 10]]
normal_stress(n)Return magnitude of normal stress component on plane given by normal vector
rotate(vector, theta)Rotate tensor around axis by angle theta
Using rotation matrix it returns S = R*S*R.T
shear_stress(n)Return magnitude of shear stress component on plane given by normal vector
stress_comp(n)Return normal and shear stress Vec3 components on plane given by normal vector
E1Max eigenvalue
E2Middle eigenvalue
E3Min eigenvalue
26 Chapter 1. Package modules

APSG Documentation, Release 0.5.1 Beta
eigenfols
eigenlins
eigenvalsReturn tuple of eigenvalues
eigenvects
1.4 db module
API to read data from PySDB database
class apsg.db.SDBBases: object
PySDB database access class
execsql(sql)
group(struct, **kwargs)Method to retrieve data from SDB database to apsg.Group
Parameters struct – name of structure to retrieve
Kwargs: sites: name or list of names of sites to retrieve from units: name or list of names of units toretrieve from tags: tag or list of tags to retrieve
Example
>>> g = db.group('L2', units=['HG', 'MG'], tags='bos')
info(verbose=False)
meta(name)
sites(**kwargs)Return list of sites in data. For kwargs see group method.
structures(**kwargs)Return list of structures in data. For kwargs see group method.
tags(**kwargs)Return list of tags in data. For kwargs see group method.
units(**kwargs)Return list of units in data. For kwargs see group method.
1.4. db module 27

APSG Documentation, Release 0.5.1 Beta
28 Chapter 1. Package modules

CHAPTER 2
Tutorial
APSG defines several new python classes to easily manage, analyze and visualize orientation structural geology data.Base class Vec3 is derived from numpy.array class and offers several new method which will be explained infollowing examples.
2.1 Basic usage
APSG module could be imported either into own name space or into active one for easier interactive work:
>>> from apsg import *
2.2 Basic operations with vectors
Instance of vector object Vec3 could be created from any iterable object as list, tuple or array:
>>> u = Vec3([1, -2, 3])>>> v = Vec3([-2, 1, 1])
For common vector operation we can use standard mathematical operators or special methods using dot notation:
>>> u + vV(-1.000, -1.000, 4.000)>>> u - vV(3.000, -3.000, 2.000)>>> 3*u - 2*vV(7.000, -8.000, 7.000)
Its magnitude or length is most commonly defined as its Euclidean norm and could be calculated using abs:
29
APSG Documentation, Release 0.5.1 Beta
>>> abs(v)2.4494897427831779>>> abs(u+v)4.2426406871192848
For dot product we can use multiplication operator * or dot method:
>>> u*v-1>>> u.dot(v)-1
For cross product we can use operator ** or method cross:
>>> u**vV(-5.000, -7.000, -3.000)>>> u.cross(v)V(-5.000, -7.000, -3.000)
To project vector u onto vector v we can use method proj:
>>> u.proj(v)V(0.333, -0.167, -0.167)
To find angle (in degrees) between to vectors we use method angle:
>>> u.angle(v)96.263952719927218
Method rotate provide possibility to rotate vector around another vector. For example, to rotate vector u aroundvector v for 45°:
>>> u.rotate(v, 45)V(2.248, 0.558, 2.939)
2.3 Classes Lin and Fol
To work with orientation data in structural geology, APSG provide two classes derived from Vec3 class. There is Folclass to represent planar features by planes and Lin class to represent linear feature by lines. Both classes provide allVec3 methods, but they differ in way how instance is created and how some operations are calculated, as structuralgeology data are commonly axial in nature.
To create instance of Lin or Fol class, we have to provide dip direction and dip, both in degrees:
>>> Lin(120, 60)L:120/60>>> Fol(216, 62)S:216/62
or we can create instance from Vec3 object using aslin and asfol properties:
>>> u.aslinL:297/53>>> u.asfolS:117/37
30 Chapter 2. Tutorial

APSG Documentation, Release 0.5.1 Beta
2.4 Vec3 methods for Lin and Fol
To find angle between two linear or planar features we can use method angle:
>>> l1 = Lin(110, 40)>>> l2 = Lin(160, 30)>>> l1.angle(l2)41.597412680035468>>> p1 = Fol(330, 50)>>> p2 = Fol(250, 40)>>> p1.angle(p2)54.696399321975328
We can use cross product to construct planar feature defined by two linear features:
>>> l1**l2S:113/40
or to construct linear feature defined as intersection of two planar features:
>>> p1**p2L:278/36
Cross product of planar and linear features could be used to construct plane defined by linear feature and normal ofplanar feature:
>>> l2**p2S:96/53
or to find perpendicular linear feature on given plane:
>>> p2**l2L:276/37
To rotate structural features we can use method rotate:
>>> p2.rotate(l2, 45)S:269/78
2.5 Classes Pair and Fault
To work with paired orientation data like foliations and lineations or fault data in structural geology, APSG providetwo base Pair class and derived Fault class. Both classes are instantiated providing dip direction and dip of planarand linear measurements, which are automatically orthogonalized. If misfit is too high, warning is raised. The Faultclass expects one more argument providing sense of movement information, either 1 or -1.
To create instance of Pair class, we have to provide dip direction and dip of planar and linear feature, both in degrees:
>>> p = Pair(120, 40, 162, 28)>>> pP:118/39-163/30>>> p.misfit3.5623168411508175>>> type(p)<class 'apsg.core.Pair'>
2.4. Vec3 methods for Lin and Fol 31

APSG Documentation, Release 0.5.1 Beta
Planar and linear features are accessible using fol and lin properties:
>>> p.folS:118/39>>> p.linL:163/30>>> type(p.fol)<class 'apsg.core.Fol'>>>> type(p.lin)<class 'apsg.core.Lin'>
To rotate Pair instance we can use rotate method:
>>> p.rotate(Lin(45, 10), 60)P:314/83-237/61
Instantiation of Fault class is similar, we just have to provide argument to define sense of movement:
>>> f = Fault(120, 60, 110, 58, -1) # -1 for normal fault>>> fF:120/59-110/59 -
Note the change in sense of movement after Fault rotation:
>>> f.rotate(Lin(45, 10), 60)F:312/62-340/59 +
For simple fault analyses Fault class also provide p, t, m and d properties to get PT-axes, kinematic plane anddihedra separation plane:
>>> f.pL:315/75>>> f.tL:116/14>>> f.mS:27/85>>> f.dS:290/31
2.6 Group class
Group class serve as a homogeneous container for Lin, Fol and Vec3 objects. It allows grouping of features eitherfor visualization or batch analysis:
>>> g = Group([Lin(120,60), Lin(116,50), Lin(132,45), Lin(90,60), Lin(84,52)],>>> name='L1')>>> gL1: 5 Lin
To simplify interactive group creation, you can use function G:
>>> g = G('120 60 116 50 132 45 90 60 84 52', name='L1')
Method len returns number of features in group:
32 Chapter 2. Tutorial
APSG Documentation, Release 0.5.1 Beta
>>> len(g)5
Most of the Lin, Fol and Vec3 methods could be used for Group as well. For example, to measure angles betweenall features in group and another feature, we can use method angle:
>>> g.angle(Lin(110,50))array([ 11.49989817, 3.85569115, 15.61367789, 15.11039885, 16.3947936 ])
To rotate all features in group around another feature, we can use method rotate:
>>> gr = g.rotate(Lin(150, 30), 45)
To show data in list you can use data property:
>>> gr.data[L:107/35, L:113/26, L:126/30, L:93/26, L:94/18]
Property R gives mean or resultant of all features in group. Note that Lin and Fol are axial in nature, so resultantvector is not reliable.
You can use ortensor property.:
>>> g.RL:110/55
Group class offers several methods to infer spherical statistics as spherical variance, Fisher’s statistics, confidencecones on data etc.:
>>> g.var0.02337168447438509>>> g.fisher_stats{'k': 34.229454059110871, 'a95': 13.264029905117329, 'csd': 13.844747281750971}>>> g.delta12.411724720740544
To calculate orientation tensor of all features in group, we can use ortensor property.:
>>> g.ortensorOrtensor: L1 Kind: prolate(E1:0.954,E2:0.04021,E3:0.005749)[[ 0.07398181 -0.09605477 -0.14324311][-0.09605477 0.28446118 0.42092899][-0.14324311 0.42092899 0.64155701]]
2.7 Ortensor class
Ortensor class represents orientation tensor of set of planar or linear features. Eigenvalues and eigenvectors couldbe obtained by methods eigenvals and eigenvects. Eigenvectors could be also represented by linear or planarfeatures using properties eigenlins and eigenfols. Several properties to describe orientation distribution is alsoimpleneted, e.g. Woodcock’s shape and strength or Vollmer’s P, G, R and C indexes.:
>>> ot = Ortensor(g)>>> ot.eigenvals
(continues on next page)
2.7. Ortensor class 33

APSG Documentation, Release 0.5.1 Beta
(continued from previous page)
(0.95403846865963882, 0.040212749461964611, 0.0057487818783963102)>>> ot.eigenvects.data[V(0.192, -0.542, -0.818), V(-0.981, -0.082, -0.176), V(-0.028, -0.836, 0.547)]>>> ot.eigenlins.data[L:110/55, L:5/10, L:268/33]>>> ot.eigenfols.data[S:290/35, S:185/80, S:88/57]>>> ot.strength, ot.shape(5.111716009046873, 1.6278666609093613)>>> ot.P, ot.G, ot.R(0.91382571919767419, 0.068927935167136606, 0.017246345635188932)
2.8 StereoNet class
Any Fol, Lin, Group object could be visualized as plane, line or pole in stereographic projection using StereoNetclass:
>>> s = StereoNet()>>> s.plane(Fol(150, 40))>>> s.pole(Fol(150, 40))>>> s.line(Lin(112, 30))>>> s.show()
34 Chapter 2. Tutorial

APSG Documentation, Release 0.5.1 Beta
When StereoNet class instance is created with arguments, they are immidiatelly plotted. Most of the objectsprovided by APSG could be plotted. Here we use the Group object and principal planes and lines of Ortensor:
>>> StereoNet(g, ot.eigenfols, ot.eigenlins)
A cones (or small circles) could be plotted as well:
>>> s = StereoNet()>>> g = Group.randn_lin(mean=Lin(40, 15))>>> s.line(g, 'k.')>>> s.cone(g.R, g.fisher_stats['a95'], 'r') # confidence cone on resultant>>> s.cone(g.R, g.fisher_stats['csd'], 'g') # confidence cone on 63% of data>>> s.show()
2.8. StereoNet class 35

APSG Documentation, Release 0.5.1 Beta
To make density contours plots, a contour and contourf methods are available:
>>> s = StereoNet()>>> g = Group.randn_lin(mean=Lin(40, 20))>>> s.contourf(g, 8, legend=True, sigma=2)>>> s.line(g, 'g.')>>> s.show()
36 Chapter 2. Tutorial
APSG Documentation, Release 0.5.1 Beta
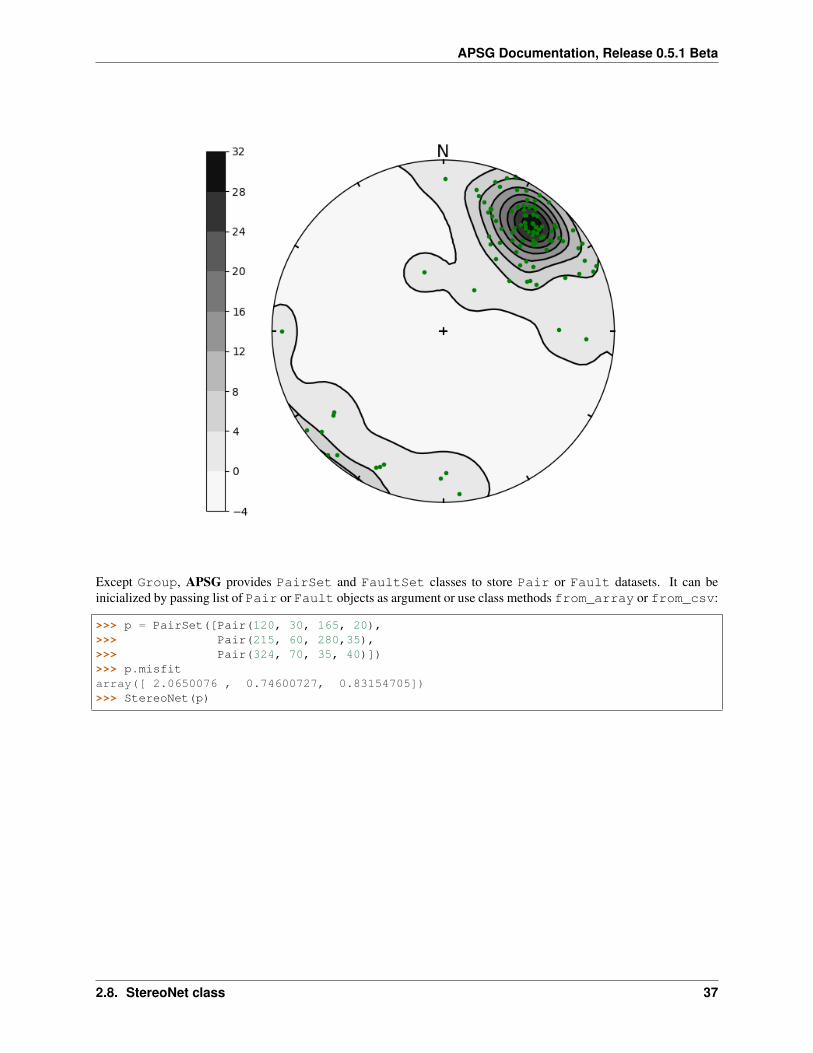
Except Group, APSG provides PairSet and FaultSet classes to store Pair or Fault datasets. It can beinicialized by passing list of Pair or Fault objects as argument or use class methods from_array or from_csv:
>>> p = PairSet([Pair(120, 30, 165, 20),>>> Pair(215, 60, 280,35),>>> Pair(324, 70, 35, 40)])>>> p.misfitarray([ 2.0650076 , 0.74600727, 0.83154705])>>> StereoNet(p)
2.8. StereoNet class 37

APSG Documentation, Release 0.5.1 Beta
StereoNet has two special methods to visualize fault data. Method fault produce classical Angelier plot:
>>> f = FaultSet([Fault(170, 60, 182, 59, -1),>>> Fault(210, 55, 195, 53, -1),>>> Fault(10, 60, 15, 59, -1),>>> Fault(355, 48, 22, 45, -1)])>>> s = StereoNet()>>> s.fault(f)>>> s.line(f.p, label='P-axes')>>> s.line(f.t, label='T-axes')>>> s.plane(f.m, label='M-planes')>>> s.show()
38 Chapter 2. Tutorial
APSG Documentation, Release 0.5.1 Beta
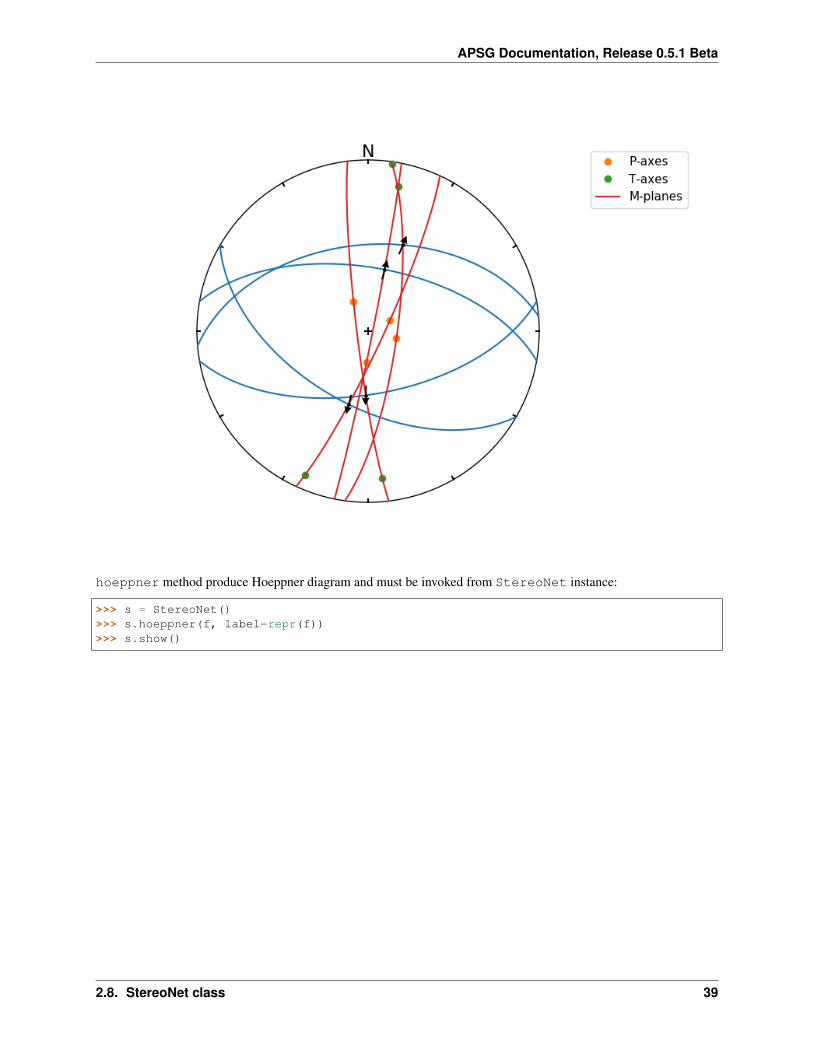
hoeppner method produce Hoeppner diagram and must be invoked from StereoNet instance:
>>> s = StereoNet()>>> s.hoeppner(f, label=repr(f))>>> s.show()
2.8. StereoNet class 39

APSG Documentation, Release 0.5.1 Beta
Note that fault method is used, when data are passed directly to StereoNet instance:
>>> f = Fault(120, 60, 110, 58, -1)>>> StereoNet(f, f.m, f.d, f.p, f.t)
40 Chapter 2. Tutorial

APSG Documentation, Release 0.5.1 Beta
2.9 StereoGrid class
StereoGrid class allows to visualize any scalar field on StereoNet. Internally it is used for plotting contour di-agrams, but it exposes apply_func method to calculate scalar field by any user-defined function. Function mustaccept three element numpy.array as first argument passed from grid points of StereoGrid.
Following example shows how to plot resolved shear stress on plane from given stress tensor. StereoGrid.apply_func method is used to calculate this value over all directions and finally values are plotted by StereoNet:
>>> S = Stress([[-10, 2, -3],[2, -5, 1], [-3, 1, 2]])>>> d = StereoGrid()>>> d.apply_func(S.shear_stress)>>> s = StereoNet()>>> s.contourf(d, 10, legend=True)>>> s.show()
2.9. StereoGrid class 41

APSG Documentation, Release 0.5.1 Beta
The FaultSet provide also amgmech method which provide access to Angelier dihedra method. Results are storedin StereoGrid. Default behavior is to calculate counts (positive in extension, negative in compression):
>>> f = FaultSet.examples('MELE')>>> StereoNet(f.angmech())
42 Chapter 2. Tutorial

APSG Documentation, Release 0.5.1 Beta
Setting method to ‘probability’, maximum likelihood estimate is calculated.:
>>> f = FaultSet.examples('MELE')>>> StereoNet(f.angmech(method='probability'))
2.9. StereoGrid class 43

APSG Documentation, Release 0.5.1 Beta
2.10 FabricPlot class
FabricPlot class provide triangular fabric plot (Vollmer, 1989). You can pass either Ortensor or Group in-stances:
>>> g1 = Group.examples('B2')>>> g2 = Group.examples('B4')>>> g3 = Group.uniform_lin(name='Uniform')>>> FabricPlot(g1, g2, g3)
44 Chapter 2. Tutorial

APSG Documentation, Release 0.5.1 Beta
2.11 Cluster class
Cluster class provide access to scipy hierarchical clustering. Distance matrix is calculated as mutual angles offeatures within Group keeping axial and/or vectorial nature in mind. Cluster.explain method allows to exploreexplained variance versus number of clusters relation. Actual cluster is done by Cluster.cluster method, usingdistance or maxclust criterion. Using of Cluster is explained in following example. We generate some data andplot dendrogram:
>>> g1 = Group.randn_lin(mean=Lin(45,30))>>> g2 = Group.randn_lin(mean=Lin(320,56))>>> g3 = Group.randn_lin(mean=Lin(150,40))>>> g = g1 + g2 + g3>>> cl = Cluster(g)>>> cl.dendrogram(no_labels=True)
2.11. Cluster class 45

APSG Documentation, Release 0.5.1 Beta
Now we can explore evolution of within-groups variance versus number of clusters on Elbow plot (Note change inslope for three clusters):
>>> cl.elbow()
46 Chapter 2. Tutorial

APSG Documentation, Release 0.5.1 Beta
Finally we can do clustering and plot created clusters:
>>> cl.cluster(maxclust=3)>>> cl.R.data # Restored centres of clusters[L:146/39, L:43/26, L:323/59]>>> StereoNet(*cl.groups)
2.11. Cluster class 47

APSG Documentation, Release 0.5.1 Beta
2.12 Some tricks
Double cross products are allowed but not easy to understand.
For example p**l**p is interpreted as p**(l**p): a) l**p is plane defined by l and p normal b) intersection ofthis plane and p is calculated:
>>> p = Fol(250,40)>>> l = Lin(160,25)>>> StereoNet(p, l, l**p, p**l, l**p**l, p**l**p)
48 Chapter 2. Tutorial
APSG Documentation, Release 0.5.1 Beta
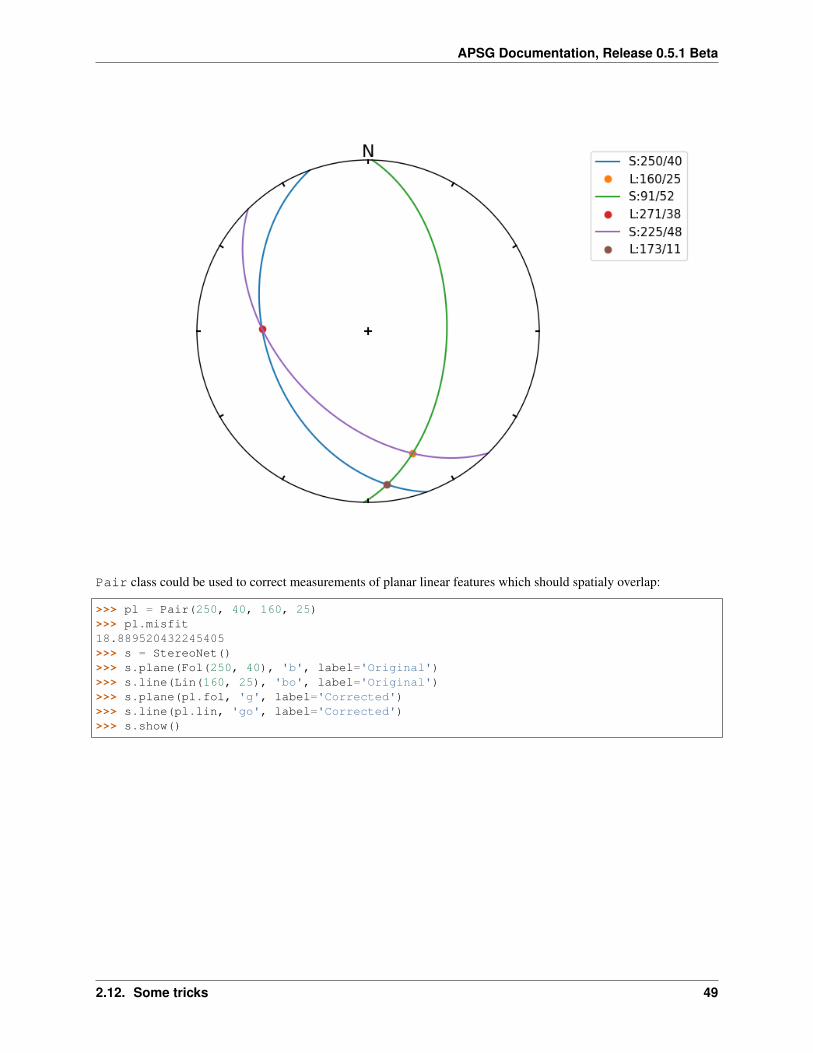
Pair class could be used to correct measurements of planar linear features which should spatialy overlap:
>>> pl = Pair(250, 40, 160, 25)>>> pl.misfit18.889520432245405>>> s = StereoNet()>>> s.plane(Fol(250, 40), 'b', label='Original')>>> s.line(Lin(160, 25), 'bo', label='Original')>>> s.plane(pl.fol, 'g', label='Corrected')>>> s.line(pl.lin, 'go', label='Corrected')>>> s.show()
2.12. Some tricks 49
APSG Documentation, Release 0.5.1 Beta
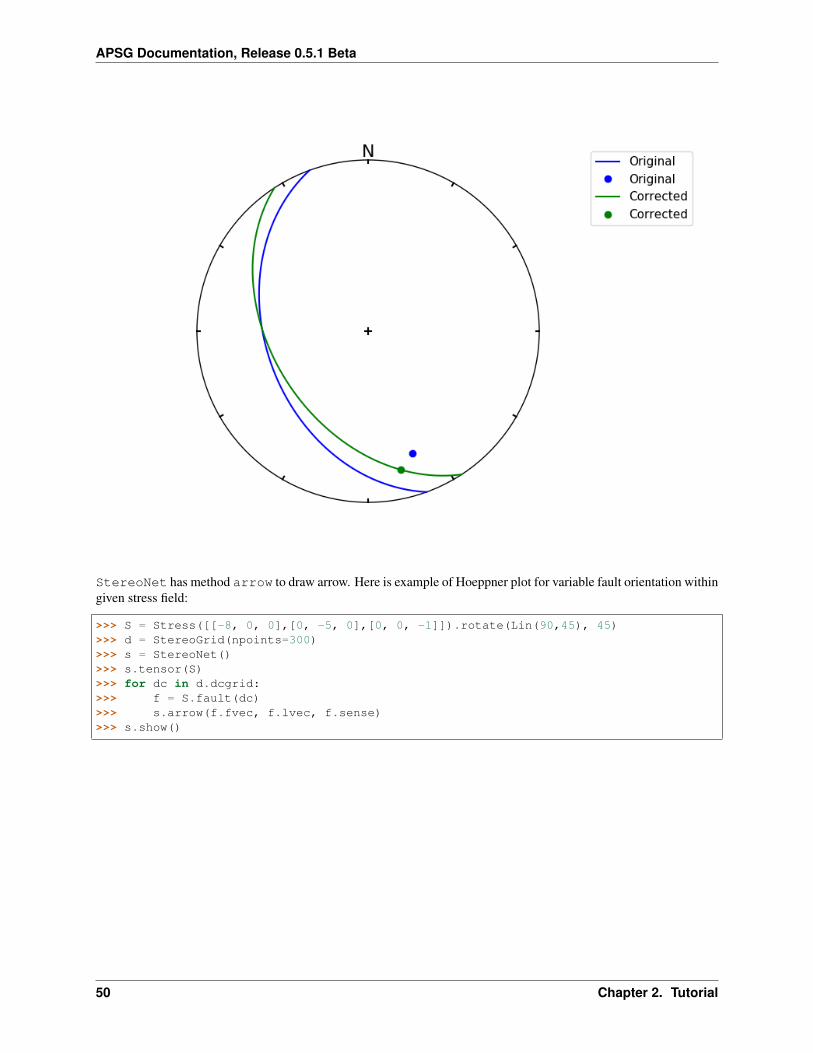
StereoNet has method arrow to draw arrow. Here is example of Hoeppner plot for variable fault orientation withingiven stress field:
>>> S = Stress([[-8, 0, 0],[0, -5, 0],[0, 0, -1]]).rotate(Lin(90,45), 45)>>> d = StereoGrid(npoints=300)>>> s = StereoNet()>>> s.tensor(S)>>> for dc in d.dcgrid:>>> f = S.fault(dc)>>> s.arrow(f.fvec, f.lvec, f.sense)>>> s.show()
50 Chapter 2. Tutorial

APSG Documentation, Release 0.5.1 Beta
2.12. Some tricks 51

APSG Documentation, Release 0.5.1 Beta
52 Chapter 2. Tutorial

CHAPTER 3
Installation
3.1 Conda package
For Anaconda distribution you can install directly from my personal channel:
conda install -c ondrolexa apsg
3.2 Using pip
APSG requires dependencies which could be installed using conda:
conda install numpy matplotlib scipy
or by any other mechanism (see Installing Scientific Packages).
You can install APSG directly from github using pip:
pip install https://github.com/ondrolexa/apsg/archive/master.zip
To safely upgrade installed APSG package use:
pip install --upgrade --upgrade-strategy only-if-needed \https://github.com/ondrolexa/apsg/archive/master.zip
3.3 Developement version
To install most recent (and likely less stable) development version use:
pip install https://github.com/ondrolexa/apsg/archive/develop.zip
53
APSG Documentation, Release 0.5.1 Beta
To upgrade to latest development version use:
pip install --upgrade --upgrade-strategy only-if-needed \https://github.com/ondrolexa/apsg/archive/develop.zip
54 Chapter 3. Installation

CHAPTER 4
Usage
To use APSG in a project:
import apsg
To use APSG interactively it is easier to import into current namespace:
from apsg import *
55

APSG Documentation, Release 0.5.1 Beta
56 Chapter 4. Usage

CHAPTER 5
Contributing
Contributions are welcome, and they are greatly appreciated! Every little bit helps, and credit will always be given.
You can contribute in many ways:
5.1 Types of Contributions
5.1.1 Report Bugs
Report bugs at https://github.com/ondrolexa/apsg/issues.
If you are reporting a bug, please include:
• Your operating system name and version.
• Any details about your local setup that might be helpful in troubleshooting.
• Detailed steps to reproduce the bug.
5.1.2 Fix Bugs
Look through the GitHub issues for bugs. Anything tagged with “bug” is open to whoever wants to implement it.
5.1.3 Implement Features
Look through the GitHub issues for features. Anything tagged with “feature” is open to whoever wants to implementit.
57

APSG Documentation, Release 0.5.1 Beta
5.1.4 Write Documentation
APSG could always use more documentation, whether as part of the official APSG docs, in docstrings, or even on theweb in blog posts, articles, and such.
5.1.5 Submit Feedback
The best way to send feedback is to file an issue at https://github.com/ondrolexa/apsg/issues.
If you are proposing a feature:
• Explain in detail how it would work.
• Keep the scope as narrow as possible, to make it easier to implement.
• Remember that this is a volunteer-driven project, and that contributions are welcome :)
5.2 Get Started!
Ready to contribute? Here’s how to set up apsg for local development.
1. Fork the apsg repo on GitHub.
2. Clone your fork locally:
$ git clone [email protected]:ondrolexa/apsg.git
3. Install your local copy into a virtualenv. Assuming you have virtualenvwrapper installed, this is how you set upyour fork for local development:
$ mkvirtualenv apsg$ cd apsg/$ python setup.py develop
4. Create a branch for local development:
$ git checkout -b name-of-your-bugfix-or-feature
Now you can make your changes locally.
5. When you’re done making changes, check that your changes pass flake8 and the tests, including testing otherPython versions with tox:
$ flake8 apsg tests$ python setup.py test$ tox
To get flake8 and tox, just pip install them into your virtualenv.
6. Commit your changes and push your branch to GitHub:
$ git add .$ git commit -m "Your detailed description of your changes."$ git push origin name-of-your-bugfix-or-feature
7. Submit a pull request through the GitHub website.
58 Chapter 5. Contributing

APSG Documentation, Release 0.5.1 Beta
5.3 Pull Request Guidelines
Before you submit a pull request, check that it meets these guidelines:
1. The pull request should include tests.
2. If the pull request adds functionality, the docs should be updated. Put your new functionality into a functionwith a docstring, and add the feature to the list in README.rst.
3. The pull request should work for Python 2.6, 2.7, 3.3, and 3.4, and for PyPy. Check https://travis-ci.org/ondrolexa/apsg/pull_requests and make sure that the tests pass for all supported Python versions.
5.4 Tips
To run a subset of tests:
$ python -m unittest tests.test_apsg
5.3. Pull Request Guidelines 59

APSG Documentation, Release 0.5.1 Beta
60 Chapter 5. Contributing

CHAPTER 6
Credits
6.1 Development Lead
• Ondrej Lexa <[email protected]>
6.2 Contributors
None yet. Why not be the first?
61

APSG Documentation, Release 0.5.1 Beta
62 Chapter 6. Credits

CHAPTER 7
Changes
7.1 0.1 (01 Nov 2014)
• First release of APSG
7.2 0.2 (09 Dec 2014)
• new StereoNet class for Schmidt projection
• Quick plot when data are passed to StereoNet class instantiation
• mplstereonet dependency depreceated
• new Pair and Fault classes to manipulate paired data (full support in future)
• new uniform_lin and uniform_fol Group methods
• abs for Group implemented to calculate euclidean norms
• new Group method normalized
• new Group properties and methods to calculate spherical statistics
7.3 0.2 (09 Dec 2014)
7.3.1 0.2.1 (09 Dec 2014)
• Quick plotting of groups fixed.
63

APSG Documentation, Release 0.5.1 Beta
7.3.2 0.2.2 (17 Apr 2015)
• FaultSet class added. Fault and Hoeppner methods of StereoNet implemented
• VelGrad and DefGrad classes used for transformations added
• G class to quickly create groups from strings added.
7.3.3 0.2.3 (21 Oct 2015)
• New Docstrings format
• StereoNet.getfols method bug fixed.
• Shell scripts to run interactive session improved.
7.4 0.3 (09 Nov 2015)
• Group fancy indexing implemented. Group could be indexed by sequences of indexes like list, tuple or array aswell as sliced.
• Cluster class with hierarchical clustering implemented
• Group to_file and from_file methods implemented to store data in file
• Group copy method for shallow copy implemented
• StereoNet now accept Vec3 and Fault object as well for instant plotting.
• Ortensor updated with new properties E1,E2,E3 and Vollmer(1989) indexes P,G,R and C. Bug in Woodcocks’sshape and strength values fixed.
• uniform_lin and uniform_fol improved.
• asvec3 method implemented for Fol and Lin
• fol_plot property of StereoNet allows choose poles or great circles for immediate plotting
• bootstrap method of Group provide generator of random resampling with replacements.
• Group examples method provide few well-known datasets.
• Matplotlib deprecation warnings are ignored by default
7.4.1 0.3.1 (20 Nov 2015)
• SDB class improved. Support basic filtering including tags
• StereoNet has close method to close figure and new method to re-initialize figure when closed in interactivemode
• iapsg shell script added to invoke apsg ipython shell
64 Chapter 7. Changes

APSG Documentation, Release 0.5.1 Beta
7.4.2 0.3.2 (22 Feb 2016)
• FabricPlot - triangular fabric plot added
• .asvec3 property has .V alias
• Resultant of Fol and Lin is calculated as vectorial in centered position
• dv property of Fol added to return dip slip vector
7.4.3 0.3.3 (04 Jun 2016)
• Added E1,E2,E3 properties and polar decomposition method to DefGrad object
• StereoNet has vector method to mimics lower and upper hemisphere plotting of Lin and Vec3 objects as used inpaleomagnetic plots
• StereoNet could be initialized with subplots
• rake method of Fol added to return vector defined by rake
• Density could be initialized without data for user-defined calculations New method apply_func could be used tocalculate density
• Contour(f) methods accept Density object as argument
• Added Group class methods to generate Spherical Fibonacci and Golden Section based uniform distributions ofVec3, Lin and Fol
7.4.4 0.3.4 (20 Jun 2016)
• RTD fix
7.4.5 0.3.5 (12 Nov 2016)
• Simple settings interface implemented in in apsg.core.seetings dictionary. To change: from apsg.core importsettings
setting[‘name’]=value
• notation setting with values dd or rhr control how azimuth argument of Fol is represented.
• vec2dd setting with values True or False control how Vec3 is represented.
• Vec3 could be instantiated by one arument (vector like), 2 arguments (azimuth, inclination) or 3 arguments(azimuth, inclination, magnitude).
• Group and FaultSet can return array or list of user-defined attributes of all elements
7.4.6 0.3.6 (03 Jan 2017)
• shell script iapsg opens interactive console
7.4. 0.3 (09 Nov 2015) 65

APSG Documentation, Release 0.5.1 Beta
7.4.7 0.3.7 (05 Jan 2017)
• conda build for all platforms
• numpy, matplotlib and other helpres imported by default
• ortensor is normed by default
• ortensor MADp, MADo, MAD and kind properties added
7.4.8 0.4 (04 Mar 2017)
• Density class renamed to StereoGrid
• Fault sense under rotation fixed
• FaultSet example provided
• Angelier-Mechler dihedra method implemented for FaultSet
• StereoNet accepts StereoGrid and Ortensor as quick plot arguments
• StereoNet instance has axtitle method to put text below stereonet
7.4.9 0.4.1-2 (04 Mar 2017)
• bugfix
7.4.10 0.4.3 (25 Mar 2017)
• Stress tensor with few basic methods implemented
• StereoGrid keyword argument ‘weighted’ to control weighting
• StereoNet kwargs are passed to underlying methods for immediate plots
• StereoNet tensor method implemented (draw eigenlins or fols based on fol_plot settings)
• Group totvar property and dot and proj methods implemented
• Fol and Lin dot method returns absolute value of dot product
• Vec3 H method implemented
• StereoNet.contourf method draw contour lines as well by default. Option clines controls it.
• centered bug fixed
• StereoNet allows simple animations. Add animate=True kwarg to plotting method and finally call StereoNetanimate method.
7.4.11 0.4.4 (25 Mar 2017)
• Group method centered improved
• Group method halfspace added to reorient all vectors towards resultant halfspace
66 Chapter 7. Changes

APSG Documentation, Release 0.5.1 Beta
7.4.12 0.5.0 (19 Nov 2017)
• bux fix minor release
7.4.13 0.5.1 (05 Dec 2017)
• Kent distribution implemented to generate samples
• Automatic kernel density estimate for contouring
• UserWarnings fix
7.4. 0.3 (09 Nov 2015) 67

APSG Documentation, Release 0.5.1 Beta
68 Chapter 7. Changes

Python Module Index
aapsg.core, 3apsg.db, 27apsg.plotting, 22apsg.tensors, 23
69

APSG Documentation, Release 0.5.1 Beta
70 Python Module Index

Index
Aangle() (apsg.core.Fol method), 7angle() (apsg.core.Group method), 11angle() (apsg.core.Lin method), 6angle() (apsg.core.Vec3 method), 4angmech() (apsg.core.FaultSet method), 18animate() (apsg.plotting.StereoNet method), 22append() (apsg.core.Group method), 11append() (apsg.core.PairSet method), 18apply_func() (apsg.core.StereoGrid method), 21apsg.core (module), 3apsg.db (module), 27apsg.plotting (module), 22apsg.tensors (module), 23arrow() (apsg.plotting.StereoNet method), 22asfol (apsg.core.Group attribute), 17asfol (apsg.core.Vec3 attribute), 5aslin (apsg.core.Group attribute), 17aslin (apsg.core.Vec3 attribute), 5asvec3 (apsg.core.Group attribute), 17asvec3 (apsg.core.Vec3 attribute), 6axtitle() (apsg.plotting.StereoNet method), 22
BB (apsg.core.Ortensor attribute), 19bootstrap() (apsg.core.Group method), 11
CC (apsg.core.Ortensor attribute), 19calculate_density() (apsg.core.StereoGrid method), 21cauchy() (apsg.tensors.Stress method), 25centered (apsg.core.Group attribute), 17cla() (apsg.plotting.FabricPlot method), 23cla() (apsg.plotting.StereoNet method), 22close() (apsg.plotting.FabricPlot method), 23close() (apsg.plotting.StereoNet method), 22closed (apsg.plotting.FabricPlot attribute), 23closed (apsg.plotting.StereoNet attribute), 23cluster (apsg.core.Group attribute), 17
Cluster (class in apsg.core), 20cluster() (apsg.core.Cluster method), 20cone() (apsg.plotting.StereoNet method), 22contour() (apsg.core.StereoGrid method), 21contour() (apsg.plotting.StereoNet method), 22contourf() (apsg.core.StereoGrid method), 21contourf() (apsg.plotting.StereoNet method), 22copy() (apsg.core.Group method), 11cross() (apsg.core.Fol method), 7cross() (apsg.core.Group method), 12cross() (apsg.core.Lin method), 7cross() (apsg.core.Vec3 method), 4
Dd (apsg.core.Fault attribute), 10d (apsg.core.FaultSet attribute), 19data (apsg.core.Group attribute), 17data (apsg.core.PairSet attribute), 18dd (apsg.core.Fol attribute), 8dd (apsg.core.Group attribute), 17dd (apsg.core.Lin attribute), 7dd (apsg.core.Vec3 attribute), 6DefGrad (class in apsg.tensors), 23defgrad() (apsg.tensors.VelGrad method), 25delta (apsg.core.Group attribute), 17dendrogram() (apsg.core.Cluster method), 21dot() (apsg.core.Fol method), 7dot() (apsg.core.Group method), 12dot() (apsg.core.Lin method), 7draw() (apsg.plotting.FabricPlot method), 23draw() (apsg.plotting.StereoNet method), 22dv (apsg.core.Fol attribute), 8
EE1 (apsg.core.Ortensor attribute), 20E1 (apsg.tensors.DefGrad attribute), 24E1 (apsg.tensors.Stress attribute), 26E2 (apsg.core.Ortensor attribute), 20E2 (apsg.tensors.DefGrad attribute), 24
71

APSG Documentation, Release 0.5.1 Beta
E2 (apsg.tensors.Stress attribute), 26E3 (apsg.core.Ortensor attribute), 20E3 (apsg.tensors.DefGrad attribute), 24E3 (apsg.tensors.Stress attribute), 26eigenfols (apsg.core.Ortensor attribute), 20eigenfols (apsg.tensors.DefGrad attribute), 24eigenfols (apsg.tensors.Stress attribute), 26eigenlins (apsg.core.Ortensor attribute), 20eigenlins (apsg.tensors.DefGrad attribute), 24eigenlins (apsg.tensors.Stress attribute), 27eigenvals (apsg.tensors.DefGrad attribute), 24eigenvals (apsg.tensors.Stress attribute), 27eigenvects (apsg.core.Ortensor attribute), 20eigenvects (apsg.tensors.DefGrad attribute), 25eigenvects (apsg.tensors.Stress attribute), 27elbow() (apsg.core.Cluster method), 21examples() (apsg.core.FaultSet class method), 18examples() (apsg.core.Group class method), 12execsql() (apsg.db.SDB method), 27extend() (apsg.core.Group method), 12extend() (apsg.core.PairSet method), 18
FFabricPlot (class in apsg.plotting), 23Fault (class in apsg.core), 9fault() (apsg.plotting.StereoNet method), 22fault() (apsg.tensors.Stress method), 26FaultSet (class in apsg.core), 18fisher_stats (apsg.core.Group attribute), 17fol (apsg.core.Pair attribute), 9fol (apsg.core.PairSet attribute), 18Fol (class in apsg.core), 7format_coord() (apsg.plotting.FabricPlot method), 23format_coord() (apsg.plotting.StereoNet method), 22from_array() (apsg.core.FaultSet class method), 19from_array() (apsg.core.Group class method), 12from_array() (apsg.core.PairSet class method), 18from_axis() (apsg.tensors.DefGrad class method), 23from_comp() (apsg.tensors.DefGrad class method), 24from_comp() (apsg.tensors.Stress class method), 26from_comp() (apsg.tensors.VelGrad class method), 25from_csv() (apsg.core.FaultSet class method), 19from_csv() (apsg.core.Group class method), 12from_csv() (apsg.core.PairSet class method), 18from_file() (apsg.core.Group class method), 13from_pair() (apsg.core.Fault class method), 10from_pair() (apsg.core.Pair class method), 9from_pair() (apsg.tensors.DefGrad class method), 24from_vecs() (apsg.core.Fault class method), 10fvec (apsg.core.PairSet attribute), 18
GG (apsg.core.Ortensor attribute), 20G() (in module apsg.core), 22
getfol() (apsg.plotting.StereoNet method), 22getfols() (apsg.plotting.StereoNet method), 22getlin() (apsg.plotting.StereoNet method), 22getlins() (apsg.plotting.StereoNet method), 22Group (class in apsg.core), 11group() (apsg.db.SDB method), 27gss_fol() (apsg.core.Group class method), 13gss_lin() (apsg.core.Group class method), 13gss_vec3() (apsg.core.Group class method), 13
HH() (apsg.core.Vec3 method), 4halfspace (apsg.core.Group attribute), 17hoeppner() (apsg.plotting.StereoNet method), 22
II (apsg.core.Ortensor attribute), 20I (apsg.tensors.DefGrad attribute), 24info() (apsg.db.SDB method), 27initgrid() (apsg.core.StereoGrid method), 21
Kkent_lin() (apsg.core.Group class method), 14kind (apsg.core.Ortensor attribute), 20
Llin (apsg.core.Pair attribute), 9lin (apsg.core.PairSet attribute), 18Lin (class in apsg.core), 6line() (apsg.plotting.StereoNet method), 22linkage() (apsg.core.Cluster method), 21lvec (apsg.core.PairSet attribute), 18
Mm (apsg.core.Fault attribute), 10m (apsg.core.FaultSet attribute), 19MAD (apsg.core.Ortensor attribute), 20MADo (apsg.core.Ortensor attribute), 20MADp (apsg.core.Ortensor attribute), 20meta() (apsg.db.SDB method), 27misfit (apsg.core.PairSet attribute), 18
Nnew() (apsg.plotting.FabricPlot method), 23new() (apsg.plotting.StereoNet method), 22normal_stress() (apsg.tensors.Stress method), 26
Oortensor (apsg.core.Group attribute), 17Ortensor (class in apsg.core), 19
Pp (apsg.core.Fault attribute), 10
72 Index

APSG Documentation, Release 0.5.1 Beta
p (apsg.core.FaultSet attribute), 19P (apsg.core.Ortensor attribute), 20Pair (class in apsg.core), 8pair() (apsg.plotting.StereoNet method), 22PairSet (class in apsg.core), 18plane() (apsg.plotting.StereoNet method), 22plot() (apsg.plotting.FabricPlot method), 23plotcountgrid() (apsg.core.StereoGrid method), 22pole() (apsg.plotting.StereoNet method), 22proj() (apsg.core.Group method), 14proj() (apsg.core.Vec3 method), 4pvec (apsg.core.Fault attribute), 10pvec (apsg.core.FaultSet attribute), 19
RR (apsg.core.Cluster attribute), 21R (apsg.core.Group attribute), 16R (apsg.core.Ortensor attribute), 20R (apsg.tensors.DefGrad attribute), 24rake() (apsg.core.Fol method), 8randn_fol() (apsg.core.Group class method), 14randn_lin() (apsg.core.Group class method), 14rate (apsg.tensors.VelGrad attribute), 25rax (apsg.core.Pair attribute), 9rdegree (apsg.core.Group attribute), 17rhr (apsg.core.Fol attribute), 8rhr (apsg.core.Group attribute), 17rose() (in module apsg.plotting), 23rotate() (apsg.core.Fault method), 10rotate() (apsg.core.Group method), 15rotate() (apsg.core.Pair method), 9rotate() (apsg.core.PairSet method), 18rotate() (apsg.core.Vec3 method), 5rotate() (apsg.tensors.DefGrad method), 24rotate() (apsg.tensors.Stress method), 26
Ssavefig() (apsg.plotting.FabricPlot method), 23savefig() (apsg.plotting.StereoNet method), 23SDB (class in apsg.db), 27sense (apsg.core.Fault attribute), 10sense (apsg.core.FaultSet attribute), 19sfs_fol() (apsg.core.Group class method), 15sfs_lin() (apsg.core.Group class method), 15sfs_vec3() (apsg.core.Group class method), 15shape (apsg.core.Ortensor attribute), 20shear_stress() (apsg.tensors.Stress method), 26show() (apsg.plotting.FabricPlot method), 23show() (apsg.plotting.StereoNet method), 23sites() (apsg.db.SDB method), 27spin (apsg.tensors.VelGrad attribute), 25StereoGrid (class in apsg.core), 21StereoNet (class in apsg.plotting), 22strength (apsg.core.Ortensor attribute), 20
Stress (class in apsg.tensors), 25stress_comp() (apsg.tensors.Stress method), 26structures() (apsg.db.SDB method), 27
Tt (apsg.core.Fault attribute), 10t (apsg.core.FaultSet attribute), 19tags() (apsg.db.SDB method), 27tensor() (apsg.plotting.StereoNet method), 23to_csv() (apsg.core.FaultSet method), 19to_csv() (apsg.core.Group method), 16to_csv() (apsg.core.PairSet method), 18to_file() (apsg.core.Group method), 16totvar (apsg.core.Group attribute), 17transform() (apsg.core.Fol method), 8transform() (apsg.core.Group method), 16transform() (apsg.core.Pair method), 9transform() (apsg.core.Vec3 method), 5triplot() (apsg.plotting.FabricPlot method), 23tvec (apsg.core.Fault attribute), 11tvec (apsg.core.FaultSet attribute), 19type (apsg.core.Pair attribute), 9type (apsg.core.Vec3 attribute), 6
UU (apsg.tensors.DefGrad attribute), 24uniform_fol() (apsg.core.Group class method), 16uniform_lin() (apsg.core.Group class method), 16units() (apsg.db.SDB method), 27uv (apsg.core.Group attribute), 17uv (apsg.core.Vec3 attribute), 6
VV (apsg.core.Group attribute), 17V (apsg.core.Vec3 attribute), 5V (apsg.tensors.DefGrad attribute), 24var (apsg.core.Group attribute), 17Vec3 (class in apsg.core), 3vector() (apsg.plotting.StereoNet method), 23VelGrad (class in apsg.tensors), 25
Index 73