Embed Size (px)
Citation preview
Approaches to Assessing Currency Misalignment
Menzie D. Chinn UW-Madison & NBER
http://www.ssc.wisc.edu/~mchinn
Presentation at
Office of International Affairs
Department of the TreasuryOctober 26, 2006
Outline
• Caveats
• Methodologies
• Example: China
• New Approaches
• Conclusion

Key Point: There Are Many Equilibrium Exch. Rates
• There is no way to get the equilibrium rate and hence misalignment
• The appropriate measure depends upon the conditions of the economy you’re examining
• Different models will be relevant• And different models will be consistent
with different time horizons.
Methodologies
• Relative PPP
• Absolute PPP/Deviations from Absolute PPP
• Productivity based models
• BEERs/Fair Value Models
• Macroeconomic Balance/FEERs/External or Basic Balance
Relative PPP
• Assumes that relative price levels (measured by deflators, CPIs, or PPIs) adjusted by nominal exchange rates must be revert to some average level.
• Other deflators possible -- ULCs• More flexible interpretations allow for
reversion to trends.• A long run – goods arbitrage perspective

Example: US Dollar (in real terms)
Source: DB, Exchange Rate Perspectives, October 2006.
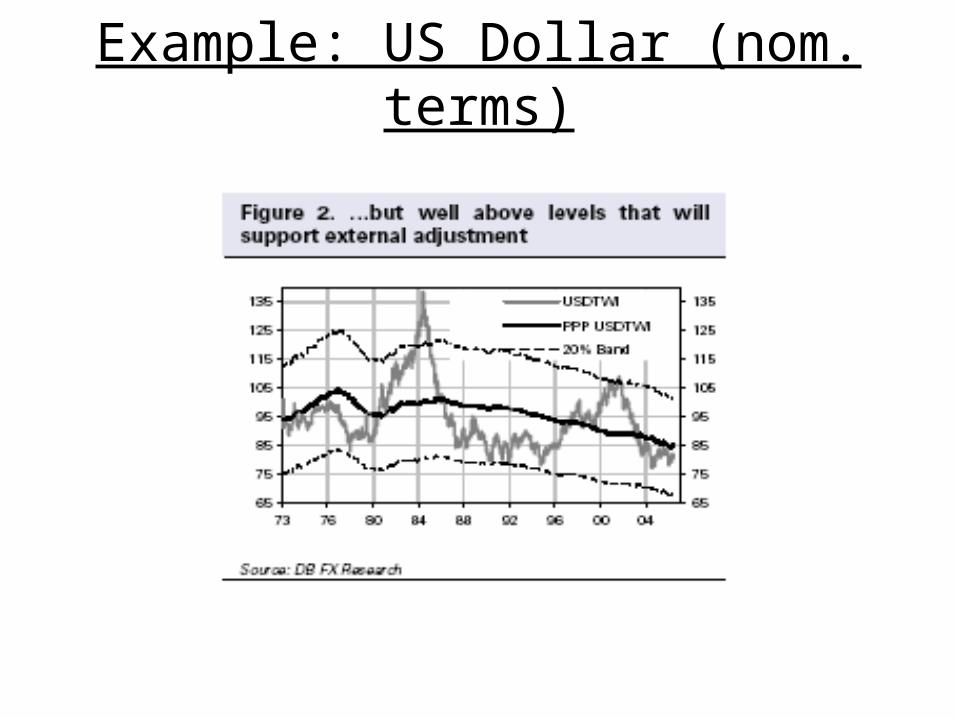
Example: US Dollar (nom. terms)

Example: Korean Won (nom. terms)
Source: Chinn, EMR (2000)
Problems
• The relative PPP level must occur in the sample period.
• Only if the real exchange rate is stationary is the conditional mean invariant with respect to the sample.
• Related to the issue of whether the real rate is I(0), or price indices and the exchange rate are cointegrated with (1 -1 1) coefficients.
Absolute PPP
• Absolute PPP requires the prices of bundles of goods are equalized in common currency terms.
• MacParity is a special case of absolute PPP.
• But Absolute PPP doesn’t hold across countries of dissimilar incomes
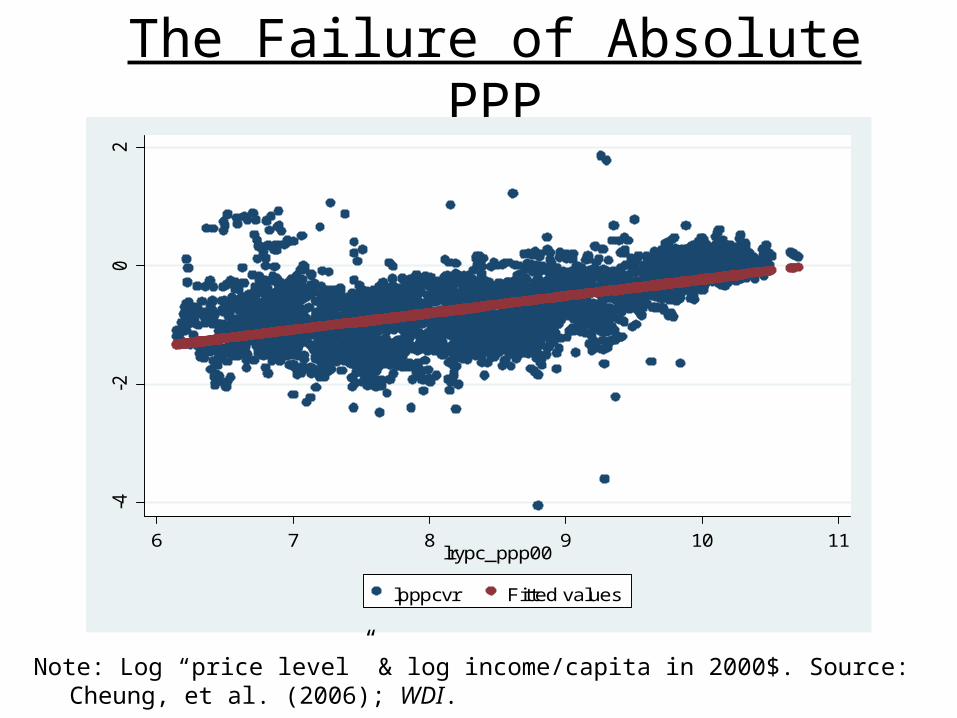
The Failure of Absolute PPP-4
-20
2
6 7 8 9 10 11lrypc_ppp00
lpppcvr Fitted values
Note: Log “price level” & log income/capita in 2000$. Source: Cheung, et al. (2006); WDI.

“Penn Effect” and MacParity
Source: Pakko and Pollard, FRB SL Review (2003).
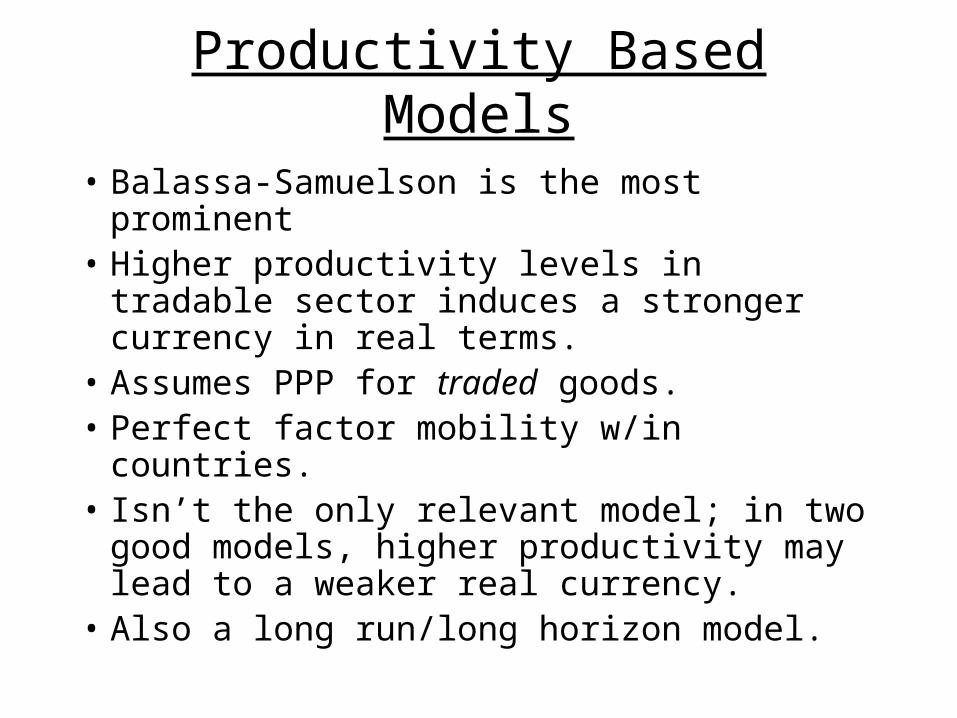
Productivity Based Models
• Balassa-Samuelson is the most prominent• Higher productivity levels in tradable sector
induces a stronger currency in real terms.• Assumes PPP for traded goods.• Perfect factor mobility w/in countries.• Isn’t the only relevant model; in two good
models, higher productivity may lead to a weaker real currency.
• Also a long run/long horizon model.

Example: China
Source: Cheung, et al., FRB SF conference paper (2005).
1.3
1.4
1.5
1.6
1.7
1.8
1.9
88 90 92 94 96 98 00 02 04
Real Bilat.Exchange Rate(RMB/USD)
Est'dProd'y
SzirmaiMfg. prod'y
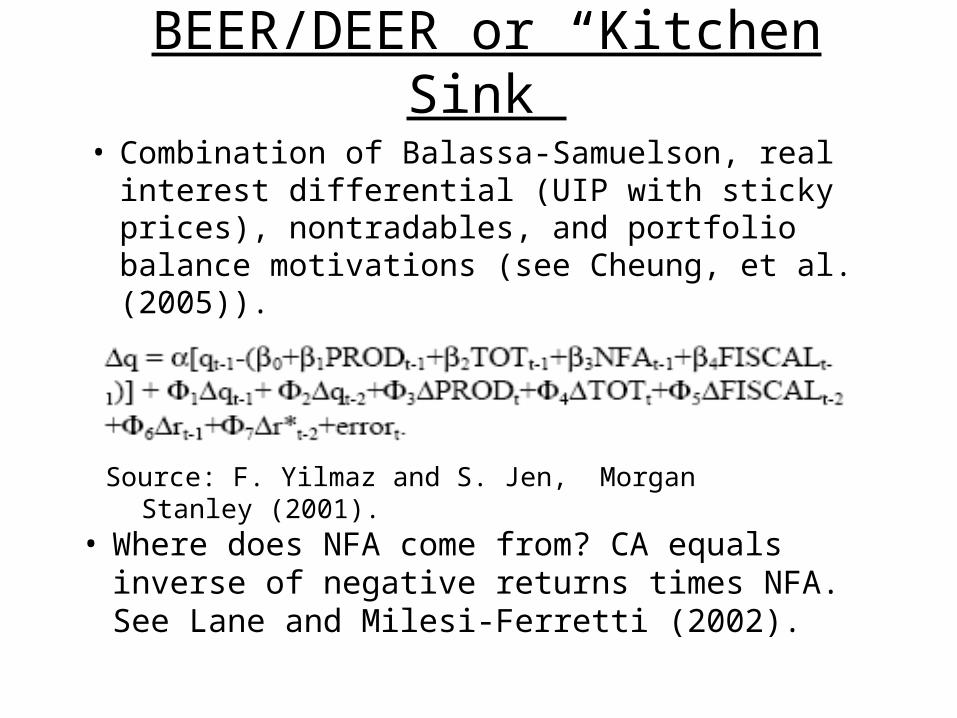
BEER/DEER or “Kitchen Sink”
• Combination of Balassa-Samuelson, real interest differential (UIP with sticky prices), nontradables, and portfolio balance motivations (see Cheung, et al. (2005)).
Source: F. Yilmaz and S. Jen, Morgan Stanley (2001).
• Where does NFA come from? CA equals inverse of negative returns times NFA. See Lane and Milesi-Ferretti (2002).
Macro Balance and Related Approaches
• Determine a “normal” level of current account balance or “basic balance”
• “Basic balance” is current account plus financial account (sometimes FDI flows).
• Using price elasticities, back out the equilibrium exchange rate.
• If an econometric approach is used to determine “normal” level of CA, then IMF’s “Macroeconomic Balance” approach.
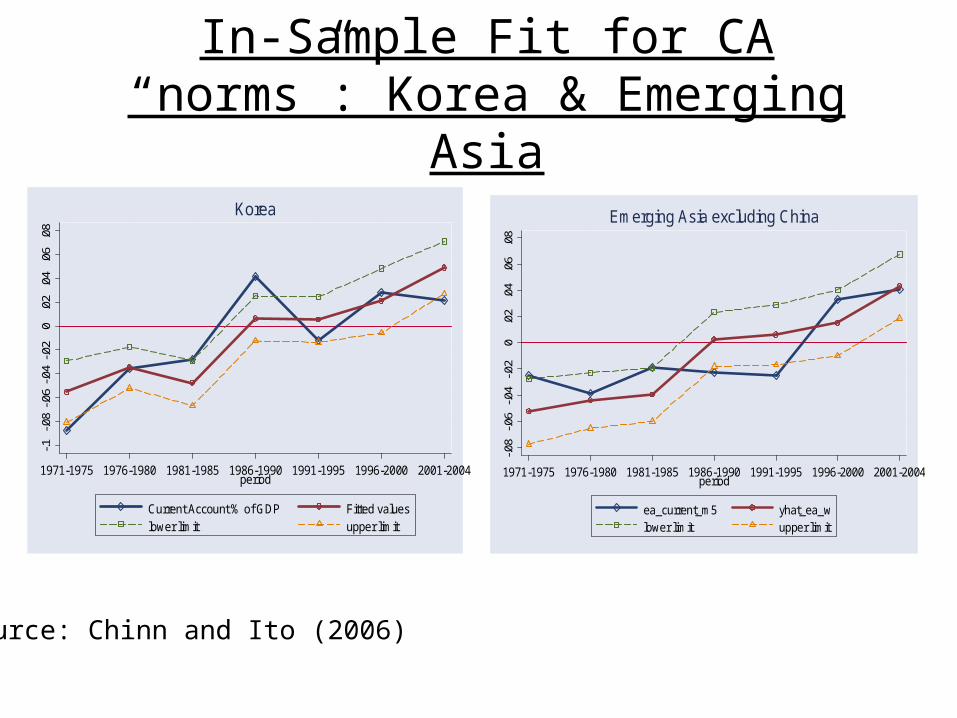
In-Sample Fit for CA “norms”: Korea & Emerging Asia
-.1-.0
8-.0
6-.0
4-.0
20
.02
.04
.06
.08
1971-1975 1976-1980 1981-1985 1986-1990 1991-1995 1996-2000 2001-2004period
Current Account % of GDP Fitted valueslower limit upper limit
Korea
-.08
-.06
-.04
-.02
0.0
2.0
4.0
6.0
8
1971-1975 1976-1980 1981-1985 1986-1990 1991-1995 1996-2000 2001-2004period
ea_current_m5 yhat_ea_wlower limit upper limit
Emerging Asia excluding China
Source: Chinn and Ito (2006)

In-Sample Fit: China
-.04
-.02
0.0
2.0
4.0
6
1971-1975 1976-1980 1981-1985 1986-1990 1991-1995 1996-2000 2001-2004period
Current Account % of GDP Fitted valueslower limit upper limit
China
Source: Chinn and Ito (2006)
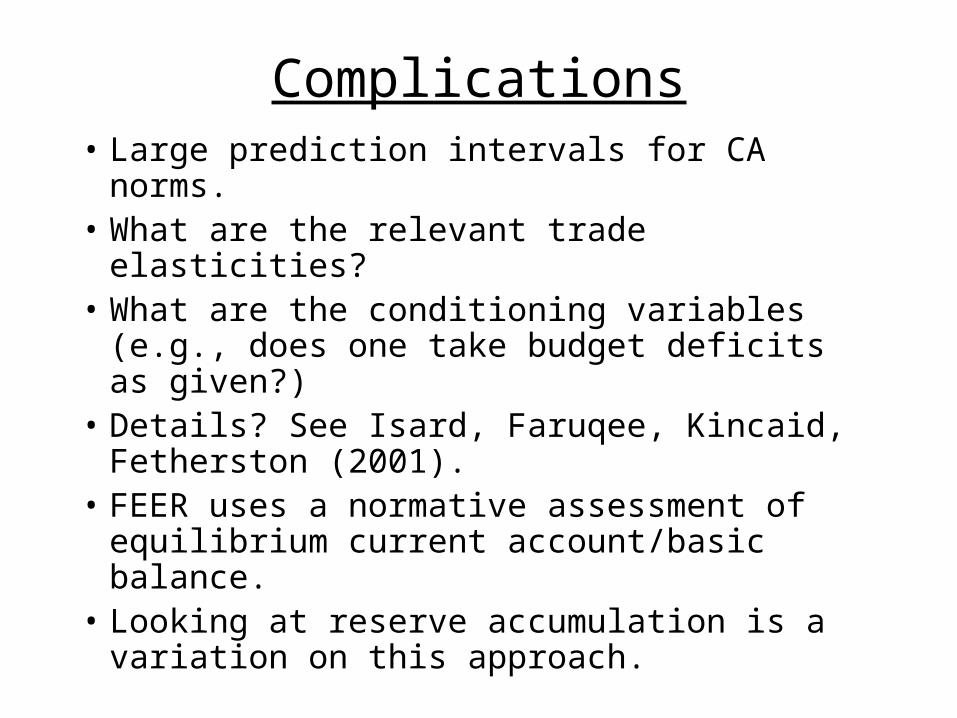
Complications• Large prediction intervals for CA norms.• What are the relevant trade elasticities?• What are the conditioning variables (e.g.,
does one take budget deficits as given?)• Details? See Isard, Faruqee, Kincaid,
Fetherston (2001).• FEER uses a normative assessment of
equilibrium current account/basic balance.• Looking at reserve accumulation is a
variation on this approach.
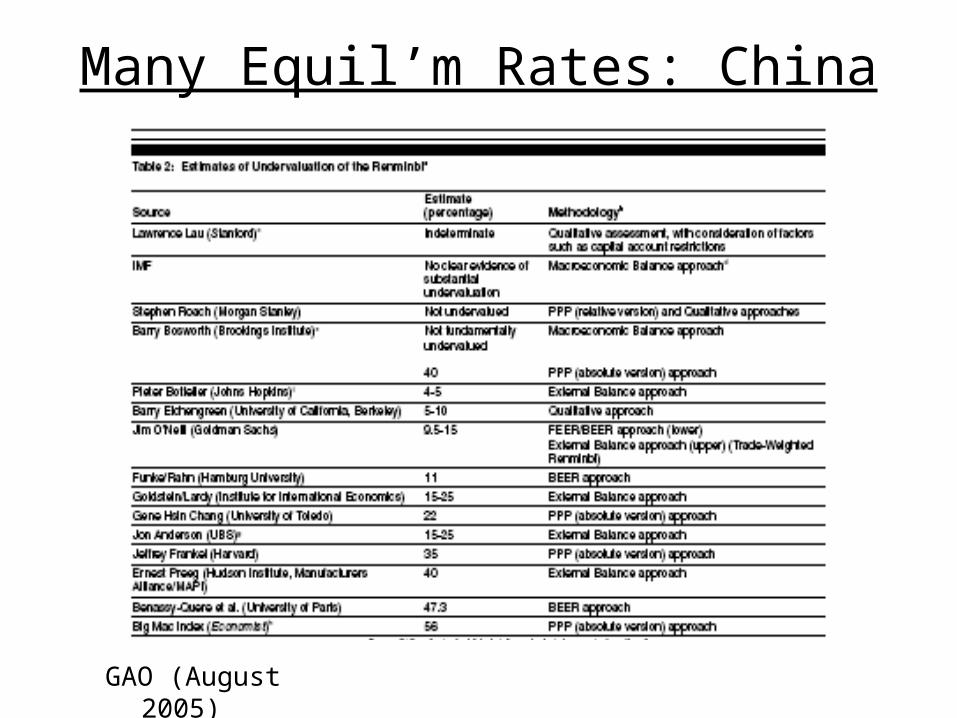
Many Equil’m Rates: China
GAO (August 2005)
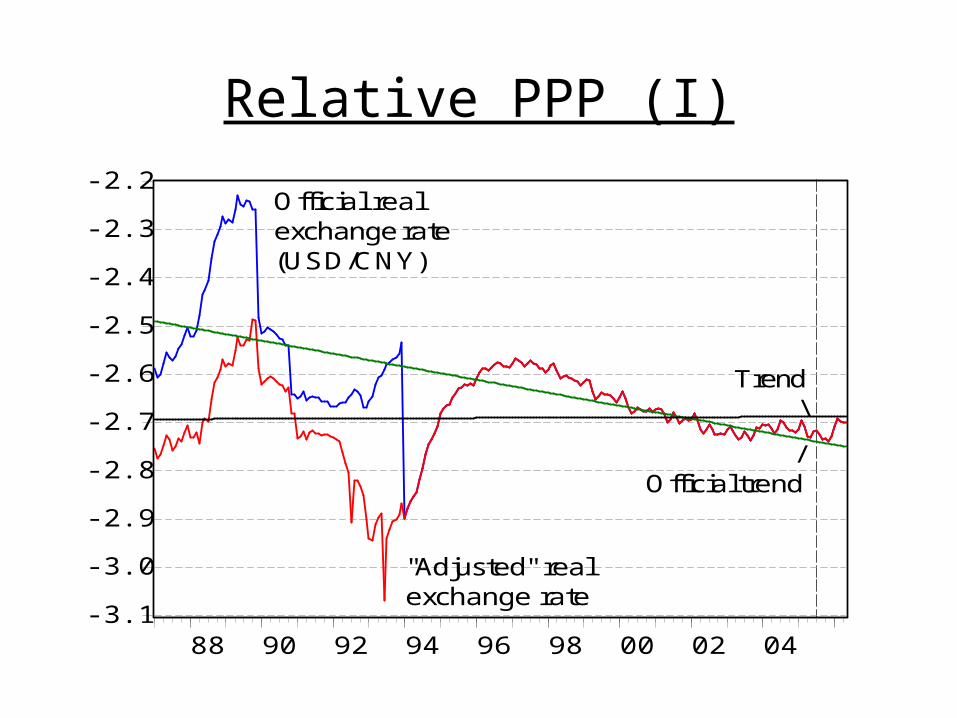
Relative PPP (I)
-3.1
-3.0
-2.9
-2.8
-2.7
-2.6
-2.5
-2.4
-2.3
-2.2
88 90 92 94 96 98 00 02 04
Official realexchange rate(USD/CNY)
"Adjusted" realexchange rate
/Official trend
Trend \

Relative PPP (II)
4.0
4.4
4.8
5.2
5.6
6.0
80 82 84 86 88 90 92 94 96 98 00 02 04 06
Trade WeightedValue of RMB
Trend

Absolute PPP and Uncertainty
-3.5
-3
-2.5
-2
-1.5
-1
-0.5
0
0.5
1
1.5
-5 -4 -3 -2 -1 0 1 2
Relative per capita income in PPP terms
Relative price level
China 2004
China 1975
Source: Cheung et al. (2006)
Recent Developments
• The role of net foreign assets, gross assets
• Measurement of the effective exchange rate
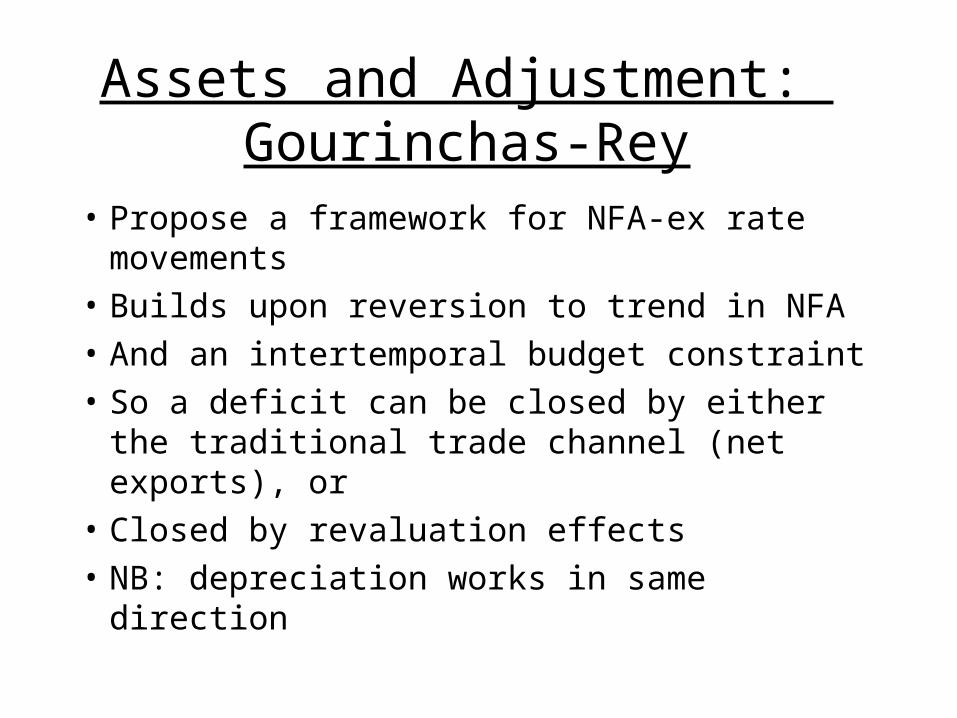
Assets and Adjustment: Gourinchas-Rey
• Propose a framework for NFA-ex rate movements
• Builds upon reversion to trend in NFA
• And an intertemporal budget constraint
• So a deficit can be closed by either the traditional trade channel (net exports), or
• Closed by revaluation effects
• NB: depreciation works in same direction

Normalized net exports/net assets
• Nxa is normalized so export weight is unity • This means it’s measured in same units as
exports.• Interpretation: nxa is (approx.) the %age
increase in exports necessary to restore ext. balance
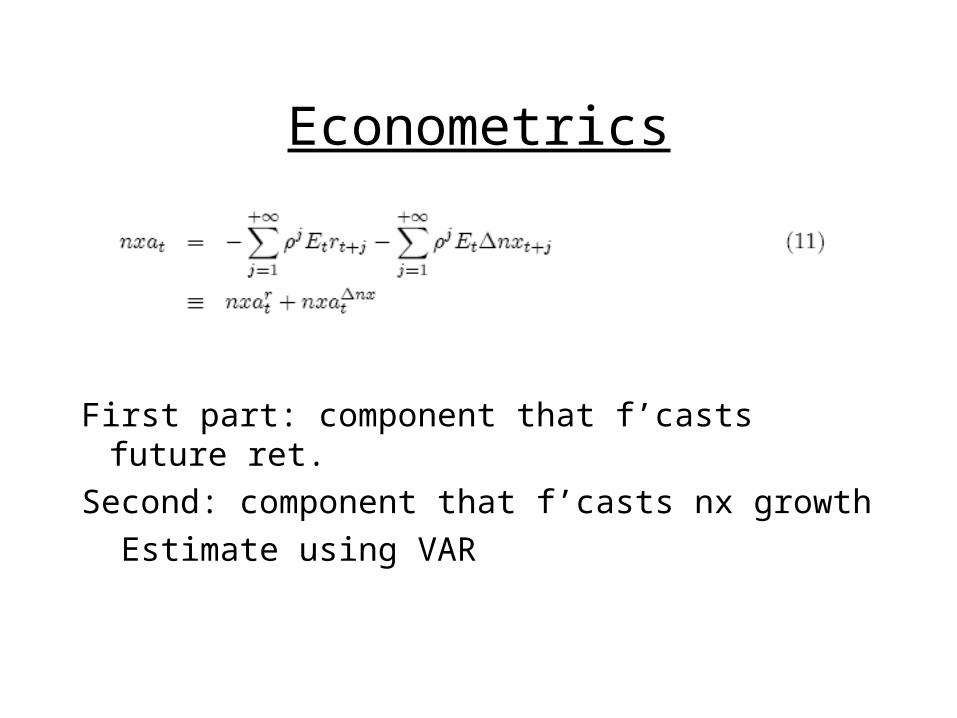
Econometrics
First part: component that f’casts future ret.
Second: component that f’casts nx growth
Estimate using VAR

Exchange Rate Adjustment
Gourinchas and Rey, “International Financial Adjustment” (2005)
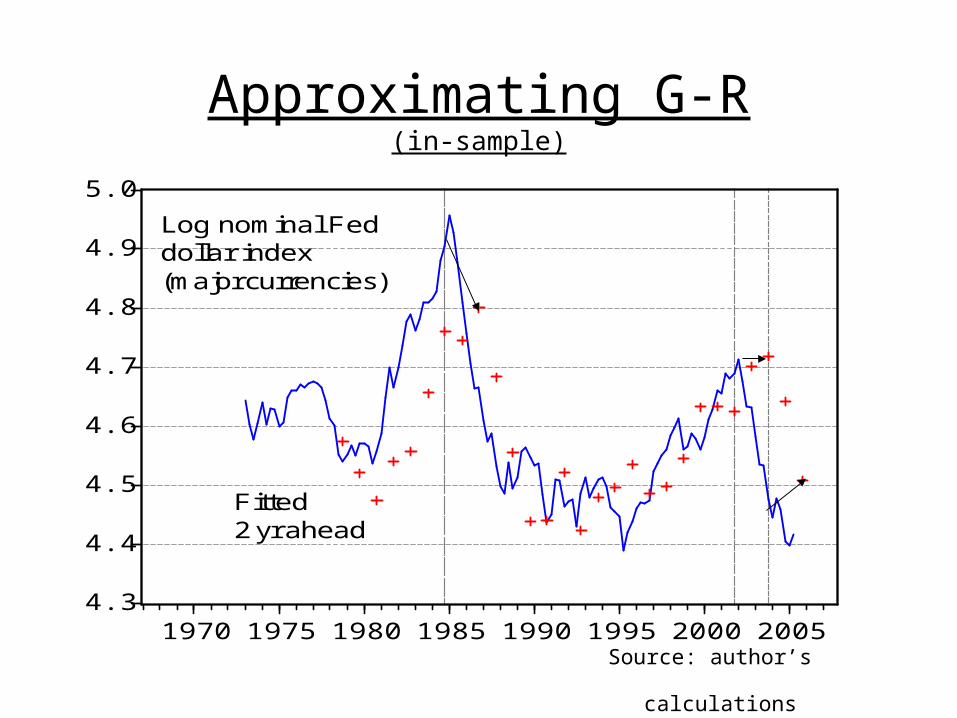
Approximating G-R(in-sample)
4.3
4.4
4.5
4.6
4.7
4.8
4.9
5.0
1970 1975 1980 1985 1990 1995 2000 2005
Log nominal Feddollar index(major currencies)
Fitted2 yr ahead
Source: author’s calculations

Measurement: Divisia vs. geometric?
Source: Thomas and Marquez (2006)
ReferencesCheung, Yin-Wong, Menzie Chinn and Eiji Fujii, 2006, “The
Overvaluation of Renminbi Undervaluation,” paper presented at the conference on “Financial and Commercial Integration,” SCCIE-JIMF conference, Santa Cruz (Sept.).
http://sccie.ucsc.edu/webpages/conf/Cheung-Chinn.pdf Cheung, Yin-Wong, Menzie Chinn and Antonio Garcia Pascual, 2005
“Empirical Exchange Rate Models of the Nineties: Are Any Fit to Survive?” Journal of International Money and Finance 24: 1150-1175.
http://www.ssc.wisc.edu/~mchinn/FXForecast.pdf
Chinn, Menzie, 2000, “Before the Fall: Were East Asian Currencies Overvalued?” Emerging Markets Review 1(2) (August 2000): 101-126. http://www.ssc.wisc.edu/~mchinn/BeforetheFall_EMR.pdf
GAO, 2005, “International Trade: Treasury Assessments Have Not Found Currency Manipulation, but Concerns about Exchange Rates Continue,” Report GAO-05-351 (April).
Gourinchas, Pierre-Olivier and Helene Rey, 2005, “International Financial Adjustment.” NBER Working Paper No. 11155 (February).
http://www.nber.org/w11155/
Isard, Peter , Hamid Faruqee, G. Russell Kincaid, Martin Fetherston, 2001, Methodology for Current Account and Exchange Rate Assessments, IMF Occasional Paper No. 209.
Lane, Philip and Gian Maria Milesi-Ferretti, 2002, “External Wealth, the Trade Balance, and the Real Exchange Rate,” European Economic Review 46: 1049-71.
Pakko, Michael R. and Patricia S. Pollard, 2003, “Burgernomics: A Big Mac™ Guide to Purchasing Power Parity,” Review 85(6) Nov.: 9-28.
http://research.stlouisfed.org/publications/review/03/11/pakko.pdf