Embed Size (px)
Citation preview
Journal of Development Economics 81 (2006) 163–192
www.elsevier.com/locate/econbase
What matters for financial development? Capital
controls, institutions, and interactions
Menzie D. Chinn a,b,*, Hiro Ito c
a LaFollette School of Public Affairs, University of Wisconsin, Madison, United Statesb NBER, United States
c Portland State University, United States
Received 1 May 2002; accepted 1 May 2005
Abstract
We investigate whether financial openness leads to financial development after controlling for the
level of legal development using a panel encompassing 108 countries over the period 1980 to 2000.
We also examine the issue of the optimal sequence of liberalization in both goods and financial
markets. Our findings suggest that a higher level of financial openness spurs equity market
development only if a threshold level of legal development has been attained. On the issue of
sequencing, we find that trade openness is a prerequisite for capital account liberalization while
banking system development is a precondition for equity market development.
D 2005 Elsevier B.V. All rights reserved.
JEL classification: F36; F43; G28
Keywords: Financial development; Capital controls; Financial liberalization; Legal institutions; Sequence of liberalization
1. Introduction
Recent years have witnessed a surge of interest in issues surrounding globalization,
including financial globalization. A series of financial crises in the 1990s rekindled the
debates on the effects of removing capital controls, which led many observers to reconsider
0304-3878/$ - see front matter D 2005 Elsevier B.V. All rights reserved.
doi:10.1016/j.jdeveco.2005.05.010
* Corresponding author. Department of Economics, University of Wisconsin, 1180 Observatory Drive, Madison, W
53706-1393, United States. Tel./fax: +1 608 262 7397/2033.
E-mail address: [email protected] (M.D. Chinn).
I

M.D. Chinn, H. Ito / Journal of Development Economics 81 (2006) 163–192164
gains and pains of financial liberalization (Kaminsky and Schmukler, 2001a,b, 2002;
Schmukler, 2003).1
Many studies have argued capital account liberalization can affect economic development
through financial development; liberalized financial markets may contribute to developing
financial markets that provide funds to borrowers who may have productive investment
opportunities.2 Theory suggests that capital account liberalization can lead to development of
financial systems through several channels. First, financial liberalization may mitigate
financial repression in protected financial markets, allowing the (real) interest rate to rise to
its competitive market equilibrium (McKinnon, 1973; Shaw, 1973). Second, removing capital
controls allows domestic and foreign investors to engage in more portfolio diversification.
These two points can be summarized as that financial liberalization may reduce the cost of
capital and increasing its availability for the borrowers. Stultz (1999) shows that financial
globalization reduces the cost of equity capital because of the reduction in the expected
returns to compensate risk as well as in agency costs (also, Henry, 2000; Bekaert et al.,
2000, 2001). Third, not least, the liberalization process usually increases the efficiency level
of the financial system by weeding out inefficient financial institutions and creating greater
pressure for a reform of the financial infrastructure (Claessens et al., 2001; Stultz, 1999;
Stiglitz, 2000). Such an improvement in financial infrastructure may alleviate information
asymmetry, decreasing adverse selection and moral hazard, and further raising the availability
of credit.
The link between financial liberalization and financial development is not unequivocal,
however. It is often argued that to benefit from more open cross-border financial
transactions, financial systems need to be equipped with reasonable legal and institutional
infrastructure.
In economies where the legal system does not clearly define property rights or guarantee the
enforcement of contracts, the incentives for loan activities can be limited. Legal protections for
creditors and the level of credibility and transparency of accounting rules are also likely to affect
economic agents’ financial decisions.3 Levine et al. (2000) investigate whether the level of legal
and regulatory determinants of financial development influences the development financial
intermediary sector. La Porta, Lopez-de-Silanes, Shleifer, and Vishny (hereafter La Porta et al.,
1997, 1998) argue that the national legal origin (whether English, French, German, or
Scandinavian) strongly affects the legal and regulatory environment in financial transactions and
explains cross-country differences in financial development. La Porta et al. (1997, 1998) and
Levine (1998, 2002) show that low levels of shareholder rights are associated with poorly
developed equity markets (especially in French civil law countries). In contrast, Common law
1 In this study, we do not discuss the merits of capital controls in the context of financial crises. For a review, see
Aizenman (2002). Kletzer and Mody (2000) survey the debate in the context of bself-protection policiesQ for emerging
markets. Ito (2004) investigates the correlation between financial liberalization and the output performance of crisis-hit
economies.2 See, for instance, Leahy et al. (2001) for OECD-specific results. Klein and Olivei (2001) document the linkage
between financial development and economic growth for developed countries, and its absence for less developed
countries, while Spiegel (2001) examines an APEC sample. Arteta et al. (2001) and Klein (2005) document the presence
of nonlinearities in growth effects of capital account liberalizations. IMF (2001, Chapter 4) surveys both the growth and
finance, and finance and liberalization literatures. For the most recent review on finance and growth, refer to Quinn et al.
(2002).3 For the analysis of legal development on financial development, see Beck and Levine (2004), Claessens et al. (2002a),
Caprio et al. (2004), and Johnson et al. (2002). For a general discussion on the importance of legal and institutional
foundations for financial development, see Beim and Calomiris (2001) and Stultz (1999).

M.D. Chinn, H. Ito / Journal of Development Economics 81 (2006) 163–192 165
countries have high levels of shareholder rights with correspondingly high levels of equity
market development (Claessens et al., 2002a; Caprio et al., 2004), and that greater creditor rights
are positively associated with financial intermediary development.4
Clearly, the link between financial liberalization and financial development is of great
importance to emerging market policymakers, and naturally, one needs to examine the effect of
liberalizing cross-border financial transactions in the context the institutional setting. However,
very little investigation has been made to shed light on the link in such a context. This is the
topic of our study.
In this article, we extend our work (Chinn and Ito, 2002) focusing on the links between
capital account liberalization, legal and institutional development, and financial development.
Since our study is motivated by the development of equity markets through financial
liberalization and its contribution to economic development among emerging market countries
in the 1990s, our focus is on the effect of capital account liberalization on the development of
equity markets among less developed and emerging market countries. We conduct a panel data
analysis encompassing 108 countries (including 21 industrialized countries and 31 emerging
market countries) and 20 years ranging from 1980 to 2000. In addition to searching for the
effects of each set of factors, we examine the oft-discussed issue of the sequence of
liberalization. It has been often argued that countries need to liberalize their goods market prior
to liberalizing financial sector (McKinnon, 1991). Also, in order for financial systems to reap the
benefit of financial liberalization, the systems themselves need to be developed up to a certain
level, suggesting the importance of a sequence of liberalization within the financial sector
(Martell and Stulz, 2003). To test these claims, we examine whether the opening of the goods
sector is a precondition for financial opening and, furthermore, investigate whether a well-
developed banking sector is a precondition for financial liberalization to lead to equity market
development. Additionally, we explore whether bank and equity market development
complements or substitutes.
Our empirical results suggest that a higher level of financial openness contributes both
directly and in an interactive manner with legal and institutional development to the
development of equity markets, but only if a country is equipped with a reasonable level of
legal and institutional development, which is more prevalent among emerging market
countries than developing countries. A higher level of bureaucratic quality and law and order,
as well as the lower levels of corruption, may enhance the effect of financial opening in
fostering the development of equity markets. We also find that, among emerging market
countries, the overall level of finance-related legal/institutional development increases stock
market trading volumes and enhances the effect of financial openness. However, the finance-
related legal/institutional variables do not exhibit as strong an effect as the general legal/
institutional variables. In examining the issue of the sequencing, we find that the
liberalization in cross-border goods transactions is a precondition for capital account
liberalization, in a result similar to that obtained by Aizenman and Noy (2004). Our
findings also indicate that the development in the banking sector is a precondition for equity
market development, and that the developments in these two types of financial markets have
interactive effects.
4 Rajan and Zingales (2003), on the other hand, question the link between legal origins and cross-country difference in
financial development, and instead stress the important role of political forces in shaping policies toward financial
markets and their development.
M.D. Chinn, H. Ito / Journal of Development Economics 81 (2006) 163–192166
2. An econometric analysis of openness, institutions and financial development
The link between capital account openness, financial development, and legal/institutional
environment has been investigated by Chinn and Ito (2002). In this study, we demonstrated that
financial systems with a higher degree of legal/institutional development on average benefit
more from financial liberalization than those with a lower one. Furthermore, the positive effect
of legal/institutional development seems to flow primarily from the degree of shareholder
protection and accounting standards. In what follows, we extend our previous study by
employing updated data and also exploring more questions related to the link between capital
account openness and financial development. More specifically, we will investigate the issues
relevant to the sequence of liberalization between financial and goods cross-border flows and the
sequence of development in banking and equity markets.
2.1. The empirical specification
First, we reexamine the long-term effect of capital account openness on financial
development in a model that controls for the level of legal and institutional development. The
model is specified as:
FDit � FDi
t�5 ¼ c0 þ qFDit�5 þ c1KAOPEN
it�5 þ c2L
i þ c3 Li � KAOPENit�5
� �
þ X it�5Cþ uit; ð1Þ
where FD is a measure of financial development; KAOPEN is a measure of financial openness;
X is a vector of economic control variables; and Li refers to a measure of legal or institutional
development.
For the capital openness variable, we use the Chinn–Ito index which is described in greater
detail in a later section. The vector X contains macroeconomic control variables that include log
per capita income in PPP terms, the inflation rate, and trade openness, measured as the ratio of
the sum of exports and imports to GDP. In this analysis, the set is kept fairly small so as to retain
some interpretability of the correlations. Log per capita income is included as there is a long
literature ascribing financial deepening, aside from the role of regulation, to the increasing
complexity of economic structures associated with rising income. The inflation rate–which
might proxy for inflation variability–is included because it may distort decision-making. In
particular, moderate to high inflation may discourage financial intermediation, and encourage
saving in real assets. Finally, trade openness is included as an ad hoc control; many empirical
studies find a correlation of trade openness with any number of economic variables. The
relationship between trade openness and financial openness will be investigated more thoroughly
in a later section.
A series of regressions is conducted for each of the financial development variables (FD),
which include private credit creation (PCGDP), stock market capitalization (SMKC), stock
market total value (SMTV), all measured as a ratio of GDP, and stock market turnover (SMTO).
Also, for the series of regressions with different financial development measures, we also include
each of the nine legal/institutional variables and its interactive term with the capital account
openness index. The nine legal/institutional variables include those which are pertaining to the
general development of legal systems or institutions as well as those pertaining particularly to
financial transactions. Further discussions about the legal/institutional variables are presented in
the data section.

M.D. Chinn, H. Ito / Journal of Development Economics 81 (2006) 163–192 167
In order to avoid problems of endogeneity associated with short-term cyclical effects, we
specify our model as a growth rate on levels regression, akin to a panel error–correction model
with non-overlapping data. That is, we only sample data every 5 years between 1980 and 2000,
and use the 5-year average growth of the level of financial development as the dependent
variable and the binitial conditionsQ for time-variant explanatory variables, including the initial
level of the financial development indicator, for each 5-year panel.5
2.2. The data
The data are drawn from a number of sources, primarily the World Bank’s World
Development Indicators, the IMF’s International Financial Statistics, and the databases
associated with Beck et al. (2000). The analysis is based upon data originally recorded at an
annual frequency, over the 1970–2000 period, covering 108 countries.6
2.2.1. Financial development measures
The measures of financial development are extracted from the data set of Beck et al. (2000).
PCGDP, the ratio of private credit from deposit money banks to the private sector, represents the
overall development in private banking markets.7 While this variable is examined for purposes
of comparison, our focus is primarily on the development of equity markets development, for
which we use three variables as the measures: SMKC (stock market capitalization), SMTV (total
value of stocks traded), and SMTO (stock market turnover ratio). We can consider SMKC as the
measure of the size of equity markets and SMTVand SMTO as the measure of the activeness of
equity markets.
Regarding the measurement issues surrounding financial development, we make two
observations. First, in this study, we do not investigate the role of offshore markets in the
process of financial development, and therefore, focus merely on the development of domestic
equity markets. Although we have witnessed through the Asian financial crisis that some
emerging market countries such as Korea and Thailand complemented their domestic markets by
developing offshore markets and allowing foreign investors–mostly hedge funds–to actively
engage, the literature regarding these issues has remained largely undeveloped, owing mainly to
the recentness of the development of hedge funds and offshore markets.8 Furthermore, with the
exception of Kim and Wei (2002), the relationship between onshore and offshore funds has not
been rigorously investigated, largely due to data unavailability.9 Hence, we do not attempt to link
offshore funds to domestic equity markets.
Secondly, our analysis does not consider the effect of capital account liberalization on the
overseas listings by international firms. Several authors have discussed the process of emerging
market companies migrating to mature markets by listing their shares and trading in New York
5 Time fixed effects are also included in the model to control for possible time-specific exogenous shocks.6 More details on the data can be found in Appendix 1 of the working paper version of this paper.7 While many researchers use M2 or liquidity liabilities (M2Y and LLY in our data set), we only report results for
PCGDP as our focus is on equity market development, and also because the correlation between M2Y or LLY and
PCGDP is quite high (84.9% and 81.9%, respectively).8 The exceptions include Fung and Hseih (2001), their other works, Brown and Goetzmann (2001), and Brown et al.
(1998).9 Kim and Wei study the behavior of the Korean offshore market, and find that the Korean offshore funds trade more
aggressively than onshore markets; but they do not engage in positive feedback trading unlike their onshore counterparts;
and that they do herd, but not so much as the onshore funds in the U.S. or U.K. which tends to herd more during a crisis.

Table 1
Growth rates of PCGDP, SMKC, SMTV, and SMTO 1970–2000 and decades
Growth rates of
Private credit creation
(PCGDP) (%)
Stock market capitalization
(SMKC) (%)
Stock market total value
(SMTV) (%)
Stock market turnover
(SMTO) (%)
1970–2000
Full 0.87 1.93 1.87 2.47
IDC 1.74 2.96 3.67 3.45
LDC 0.61 1.32 0.84 1.87
EMG 0.91 1.49 1.09 2.49
1970–1979
Full 0.62 0.47 0.18 0.35
IDC 0.77 �0.22 0.25 �0.35LDC 0.57 1.70 0.11 1.85
EMG 0.70 1.29 0.09 1.55
1980–1989
Full 0.68 1.52 1.33 1.98
IDC 1.99 2.89 2.25 3.61
LDC 0.30 0.53 0.70 0.78
EMG 0.49 0.70 0.82 1.16
1990–2000
Full 1.08 3.33 3.72 3.81
IDC 1.95 5.59 7.51 4.40
LDC 0.85 2.27 1.99 3.53
EMG 1.35 2.66 3.00 5.14
1995–2000
Full 1.59 3.03 4.81 5.08
IDC 3.10 9.50 12.06 6.52
LDC 1.19 0.25 1.66 4.45
EMG 1.78 �0.39 2.83 7.30
M.D. Chinn, H. Ito / Journal of Development Economics 81 (2006) 163–192168
or other major stock markets. Claessens et al. (2002b) and Levine and Schmukler (2003) provide
evidence that migration of trading from domestic to international markets allows firms to reap
from international portfolio diversification gains, while contributing to the shrinkage of local
markets. In contrast, Karolyi (2004) demonstrates that cross-listings in the form of American
Depository Receipts (ADRs) neither facilitate nor hinder local market development, but that it
bmay be an outcome of the declining market conditions and not a cause of themQ.10 While it
would be desirable to investigate this hypothesis, we are–given the wide cross section of
countries we examine–constrained by the limitations of data availability. Hence, we focus on the
development of domestic equity markets.
Table 1 reports the growth rates of financial development measured in the variables used in
this study. Inspection of the table reveals that during the 1990s, all subsample groups
experienced the most rapid development in equity markets, measured along several dimensions,
10 Sarkissian and Schill (2002) show that internationalization of trading is constrained by geographical and institutional/
cultural familiarity, making the gains from international portfolio diversification small. Their analysis shows that overseas
listings are not conducted to bovercome investor home biasQ, but breflect the biasQ.
M.D. Chinn, H. Ito / Journal of Development Economics 81 (2006) 163–192 169
including size (SMKC) and transactions activity (SMTV and SMTO). This is true despite the
retrenchment in the equity markets of less developed and emerging market countries during the
second half of the decade. Hence, the development of equity markets has progressed–albeit in a
halting fashion–for the last three decades.
2.2.2. Capital openness index—the Chinn–Ito index
It is well known that it is extremely difficult to measure the extent of openness in capital
account transactions (e.g., Eichengreen, 2002; Edison et al., 2002). Although many measures
exist to describe the extent and intensity of capital account controls, the consensus is that such
measures fail to fully capture the complexity of real-world capital controls for a number of
reasons.11
First, conventional measures of quantifying capital controls (or financial openness)
sometimes fail to account for the intensity of capital controls. The most prominent example
of such measures include binary variables based upon the IMF’s categorical enumeration
reported in Annual Report on Exchange Arrangements and Exchange Restrictions (AREAER).12
Second, IMF-based variables are too aggregated to depict the intricacy of actual capital controls.
Capital controls can differ depending on the direction of capital flows (i.e., inflows or outflows)
as well as the type of financial transactions targeted.13 Thirdly, it is almost impossible to
distinguish between de jure and de facto controls on capital transactions. Capital control policies
are often implemented without explicit policy goals to control the volume and/or type of capital
flows. Conversely, as Edwards (1999) discusses, it is often the case that the private sector
circumvents capital account restrictions, nullifying the expected effect of regulatory capital
controls. Therefore, researchers often refer to financial integration among countries and interpret
it as de facto restrictions on capital transactions (see De Gregorio, 1998; Rajan, 2003).
In this study, we rely upon the capital account openness index, KAOPEN developed by Chinn
and Ito (2002).14 This index is the first principle component of the four IMF binary variables
discussed above.15 One of the merits of the KAOPEN index is that it attempts to measure the
intensity of capital controls, insofar as the intensity is correlated with the existence of other
restrictions on international transactions. By the nature of its construction, one may argue that
11 See Edison and Warnock (2001), Edwards (2001), and Edison et al. (2002) for discussions and comparisons of
various measures on capital restrictions. Dooley (1996) provides an extensive literature review and Neely (1999) presents
a descriptive overview of capital controls.12 There are binary variables created based on a set of bon–offQ clarification, which includes an indicator variable for the
existence of multiple exchange rates (k1); restrictions on current account (k2); capital account transactions (k3); and a
variable indicating the requirement of the surrender of export proceeds (k4). k3 is the one often used for capital controls.
In 1996, the classification method in the AREAER changed and these four categories became more disaggregated as an
effort to reflect the complexity of capital controls policies.13 This issue is somewhat alleviated by the recent disaggregation in the AREAER of the k3 category into 13
subcategories. Johnston and Tamirisa (1998) created the time series of capital controls based on the new 13 disaggregated
components in the AREAER. However, their data series are not sufficiently long; it only covers years after 1996. Most
recently, Miniane (2004) constructed a set of indices to measure the intensity of capital controls, based on an approach
akin to Johnston et al., but extending the data back to 1983 for 34 countries.14 For the extension of the four binary classifications after 1996, we followed Mody and Murshid (2005).15 More strictly speaking, KAOPEN is the first standardized principal component of k1, k2 SHAREk3, k4 where
SHAREk3 stands for the share of a 5-year window that capital controls (k3) were not in effect. More detailed explanation
on the construction of KAOPEN can be found in Appendix 2 of the working paper version of this paper. The first
eigenvector for KAOPEN was found to be (SHAREk3, k1, k2, k4)V=(0.573, 0.273, 0.521, 0.571)V, indicating that the
variability of KAOPEN is not merely driven by the SHAREk3 series.

M.D. Chinn, H. Ito / Journal of Development Economics 81 (2006) 163–192170
the KAOPEN index measures the extensity of capital controls because it may not directly refer to
the stringency of restrictions on cross-border transactions, but to the existence of different types
of restrictions. However, measuring the extensity of capital controls may be a good proxy to the
measure of intensity of capital controls.16 This point can be made more concrete by considering
a country with an open capital account. It may still restrict the flow of capital by limiting
transactions on the current account restrictions or other systems such as multiple exchange rates
and requirements to surrender export proceeds. Alternatively, countries that already have closed
capital accounts might try to increase the stringency of those controls by imposing other types of
restrictions (such as restrictions on current account and requirements for surrender of trade
proceeds) so that the private sector cannot circumvent the capital account restrictions. Another
merit of this index is its wide coverage (more than 100 countries) for a long time period (1970–
2000).17,18
2.2.3. Measures of legal/institutional development
The legal/institutional variables can be categorized into two groups. The first group contains
the measures related to the general development of legal systems and institutions, namely,
LEGAL1, Corrupt, LAO, and BQ. LEGAL1 is the first principal component of the other three
variables, and we treat this variable as a representative measure of the general level of legal/
institutional development.19 Corrupt, LAO, and BQ measure the level of corruption, law and
order, and the quality of the bureaucratic system, respectively. All of these data series included in
LEGAL1 are obtained from the ICRG database. In these indexes, higher values indicate better
conditions. The data series are available for the period of 1984–1997, but are included as the
period-average in order to maintain comparability with the LEGAL2 variables.
The second group of legal variables–CREDITOR, ENFORCE, SHRIGHTS, and AC-
COUNT–pertain specifically to financial transactions, and are obtained from La Porta et al.
(1998). CREDITOR refers to the level of creditor protection, while ENFORCE is an index of the
effectiveness of the legal system in enforcing contracts. SHRIGHTS is a measure of shareholder
protection, and ACCOUNT is an index of the comprehensiveness of company reports. LEGAL2
is the first standardized principal component of the four variables and therefore depicts the
overall development of the legal system governing financial transactions.
Before discussing the results, we make the following two observations. First, although we use
panel data specifications in the following analyses, the data on legal/institutional development
are cross-sectional in nature, i.e., they are time-invariant. However, the inclusion of these time-
16 One might think of the Quinn (1997) index as the measure of the intensity of capital controls. The Quinn index is a
composite measure of financial regulation that ranges from 0 to 14, with 14 representing the least regulated and most
open regime. The bulk of the index is based upon Quinn’s coding of the qualitative information contained in the
AREAER pertaining to k2 and k3, augmented by information regarding whether the country in question has entered into
international agreements with international organizations such as the OECD and EU. A complete tabulation for the
OECD members exists, but the coverage for the less developed countries is much less extensive. The correlation between
the Quinn index and the Chinn–Ito index is found to be 83.9%, suggesting that KAOPEN is proxying the intensity of
capital controls. The correlation between the aforementioned index by Miniane (2004), which is based on more
disaggregated AREAER information on capital controls, and the Chinn–Ito index is found to be 80.2%.17 The Quinn index is available for the OECD members between 1958 and 1997, but the coverage for the less developed
countries is limited to certain years (1958, 1973, 1982, 1988, and 1997).18 See the working paper version of this paper for more detailed discussions on the evolution of KAOPEN among
countries.19 The first eigenvector for Legal1 was estimated as (Corrupt, LAO, BQ)V=(0.574, 0.580, 0.578)V, indicating that the
variability of LEGAL1 is not merely driven by any particular series.
M.D. Chinn, H. Ito / Journal of Development Economics 81 (2006) 163–192 171
invariant factors do not pose a substantial problem for our analysis, since these characteristics
represented by the legal/institutional variables are likely to change only very slowly.20 Moreover,
we focus mainly on the effect of financial openness on financial development, but not the effect
of legal/institutional development per se. In other words, rather than shedding light on how the
development of institutions and legal systems affects financial development, we examine how
the effect of financial openness changes depending upon the benvironmentQ of institutions andlegal systems. Therefore, time variation of the legal/institutional variables is not critical to our
study.
The second issue is sample size. While the original panel encompasses 108 countries, the data
set based on LLSV spans less than 50 countries. There is minimal impact on the coverage of the
industrialized countries, but the size of the LDC sample is substantially reduced. Consequently,
our LDC sample in this portion of the analysis essentially becomes the emerging market group
previously defined. Hence, for the regressions with the first group of legal/institutional variables
(i.e., LEGAL1, Corrupt, LAO, and BQ), we will present results for the full sample and the
subsamples for less developed countries (LDC) and emerging market countries (EMG) whereas
for those with the second group of legal variables, we report results for the full sample and a
subset titled the bLDC/EMGQ category, which is mainly composed of EMG countries.
2.3. Empirical results
The regression results for the model specified in Eq. (1) are reported in Tables 2-1–2-4. We
focus on the coefficients of KAOPENt�5 (first row), the legal variable (second row), and the
interactive term between the legal variable and KAOPENt�5 (third row). Our observations will
mainly focus on the regressions with equity market development measures and especially those
of less developed and emerging market countries.21
Table 2-1 reports the regression results for the models with LEGAL1. We can see that when
the regressions are controlled for the general development of legal systems and institutions
(LEGAL1), financial openness (KAOPENt�5) contributes to financial development in equity
markets, measured by stock market total values, in both LDC and EMG subsamples. In these
models, the interactive effect between financial openness and legal development is also detected.
Significant coefficients for the interactive term are also found in the models with other measures
of equity market development for both LDC and EMG subsamples. However, we must be
careful about how to interpret the overall effect of capital account openness because it depends
on the level of legal development.22 That is, given Eq. (1), the total effect of financial openness
can be shown as
Total effect of KA opennessi ¼ c1 þ c3L� �
KAOPENit�5;
20 Stultz (1999) and Stiglitz (2000) argue that financial globalization puts pressure on governments to improve legal
systems and infrastructure for financial markets. However, to our knowledge, there is no empirical evidence for the
causality. Also, as previously mentioned, the ICRG legal variables are available since 1984, which also creates practical
data constraints for us to use time-varying variables for legal and institutional development.21 The definition of emerging market countries relies upon the International Financial Corporation’s (IFC) indices. The
group of emerging market countries in this study refers to the countries which were included in either IFC’s Global,
Investible, or Frontier Index as of 1995. By this definition, there are 31 EMG countries in our sample.22 In case of the regressions with LEGAL1, the fact that the variable can be negative for a lower value also contributes to
the complexity in the interpretation.
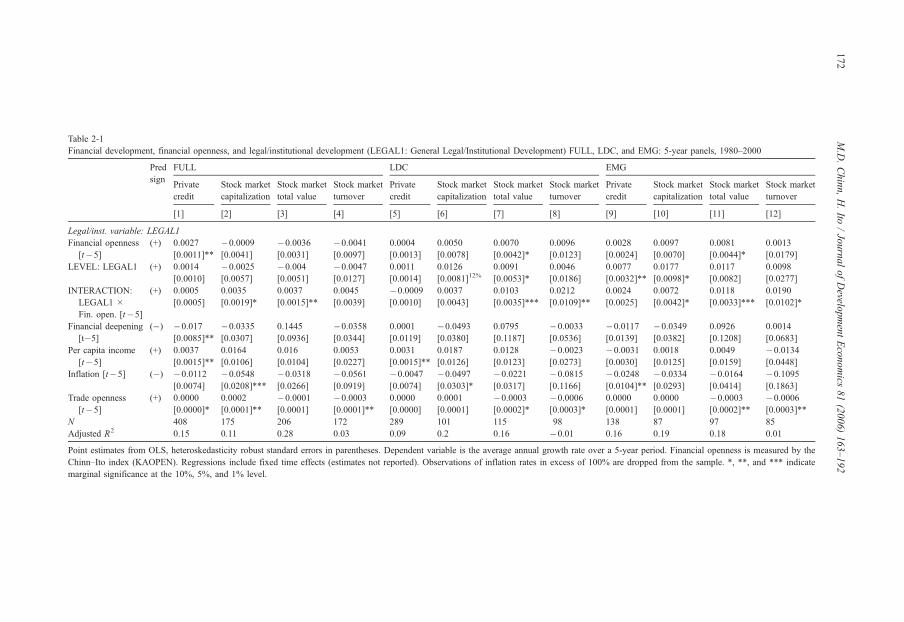
Table 2-1
Financial development, financial openness, and legal/institutional development (LEGAL1: General Legal/Institutional Development) FULL, LDC, and EMG: 5-year panels, 1980–2000
Pred
sign
FULL LDC EMG
Private
credit
Stock market
capitalization
Stock market
total value
Stock market
turnover
Private
credit
Stock market
capitalization
Stock market
total value
Stock market
turnover
Private
credit
Stock market
capitalization
Stock market
total value
Stock market
turnover
[1] [2] [3] [4] [5] [6] [7] [8] [9] [10] [11] [12]
Legal/inst. variable: LEGAL1
Financial openness
[t�5]
(+) 0.0027
[0.0011]**
�0.0009[0.0041]
�0.0036
[0.0031]
�0.0041[0.0097]
0.0004
[0.0013]
0.0050
[0.0078]
0.0070
[0.0042]*
0.0096
[0.0123]
0.0028
[0.0024]
0.0097
[0.0070]
0.0081
[0.0044]*
0.0013
[0.0179]
LEVEL: LEGAL1 (+) 0.0014
[0.0010]
�0.0025[0.0057]
�0.004
[0.0051]
�0.0047[0.0127]
0.0011
[0.0014]
0.0126
[0.0081]12%0.0091
[0.0053]*
0.0046
[0.0186]
0.0077
[0.0032]**
0.0177
[0.0098]*
0.0117
[0.0082]
0.0098
[0.0277]
INTERACTION:
LEGAL1 �Fin. open. [t�5]
(+) 0.0005
[0.0005]
0.0035
[0.0019]*
0.0037
[0.0015]**
0.0045
[0.0039]
�0.0009[0.0010]
0.0037
[0.0043]
0.0103
[0.0035]***
0.0212
[0.0109]**
0.0024
[0.0025]
0.0072
[0.0042]*
0.0118
[0.0033]***
0.0190
[0.0102]*
Financial deepening
[t�5](�) �0.017
[0.0085]**
�0.0335[0.0307]
0.1445
[0.0936]
�0.0358[0.0344]
0.0001
[0.0119]
�0.0493[0.0380]
0.0795
[0.1187]
�0.0033
[0.0536]
�0.0117[0.0139]
�0.0349
[0.0382]
0.0926
[0.1208]
0.0014
[0.0683]
Per capita income
[t�5]
(+) 0.0037
[0.0015]**
0.0164
[0.0106]
0.016
[0.0104]
0.0053
[0.0227]
0.0031
[0.0015]**
0.0187
[0.0126]
0.0128
[0.0123]
�0.0023
[0.0273]
�0.0031[0.0030]
0.0018
[0.0125]
0.0049
[0.0159]
�0.0134[0.0448]
Inflation [t�5] (�) �0.0112
[0.0074]
�0.0548[0.0208]***
�0.0318
[0.0266]
�0.0561[0.0919]
�0.0047[0.0074]
�0.0497[0.0303]*
�0.0221[0.0317]
�0.0815
[0.1166]
�0.0248[0.0104]**
�0.0334
[0.0293]
�0.0164[0.0414]
�0.1095[0.1863]
Trade openness
[t�5]
(+) 0.0000
[0.0000]*
0.0002
[0.0001]**
�0.0001
[0.0001]
�0.0003[0.0001]**
0.0000
[0.0000]
0.0001
[0.0001]
�0.0003[0.0002]*
�0.0006
[0.0003]*
0.0000
[0.0001]
0.0000
[0.0001]
�0.0003[0.0002]**
�0.0006[0.0003]**
N 408 175 206 172 289 101 115 98 138 87 97 85
Adjusted R2 0.15 0.11 0.28 0.03 0.09 0.2 0.16 �0.01 0.16 0.19 0.18 0.01
Point estimates from OLS, heteroskedasticity robust standard errors in parentheses. Dependent variable is the average annual growth rate over a 5-year period. Financial openness is measured by the
Chinn–Ito index (KAOPEN). Regressions include fixed time effects (estimates not reported). Observations of inflation rates in excess of 100% are dropped from the sample. *, **, and *** indicate
marginal significance at the 10%, 5%, and 1% level.
M.D.Chinn,H.Ito
/JournalofDevelo
pmentEconomics
81(2006)163–192
172

M.D. Chinn, H. Ito / Journal of Development Economics 81 (2006) 163–192 173
where L is the mean of a measure of legal development. For example, when we examine the
regression specifications for the financial development measured in stock market total value for
LDC and EMG groups in Table 2-1 (columns [7] and [11]), the total effect of a one-unit increase
in KAOPEN is calculated to be �0.0006 for less developed countries and 0.005 for emerging
market countries if we use each subsample’s average of LEGAL1, �0.74 for the former group
and �0.28 for the latter. Thus, although the estimated coefficients for KAOPEN and the
interaction terms are not significantly different between LDC and EMG groups, the difference in
the general level of legal and institutional development makes the effect of KAOPEN on equity
market development quite different between the subsample groups; while opening capital
accounts, on average, leads to a lower rate of development in equity markets among less
developed countries, it leads to a more rapid rate of equity market development for emerging
market countries. As another example, Peru, an emerging market country in our sample,
increased its financial openness level from �1.84 to 2.27 between 1990 and 1995. Given its
LEGAL1 level of �1.65, the increase in financial openness would reduce the growth rate of
stock market total value by 4.1% point annually. Argentina, another EMG country, experienced a
smaller increase of 3.15 in its KAOPEN variable (from �1.16 to 2.00), but because its LEGAL1level is �0.175, higher than Peru’s, its SMTV is predicted to grow at an additional 1.9%
annually. Given that SMTV grew at 3.00% annually for emerging market countries during the
1990s (Table 1), this acceleration in the growth rate is significant. Thus, opening capital accounts
can be effective for financial development only if a country has attained a threshold level of legal
and institutional development.
Table 3 makes this point clear. In this table, row [A] shows the total effect of a one-unit
increase in KAOPEN calculated using the estimates from the regression model with stock market
total value for the subsample of less developed countries, evaluated at the average values of the
legal variable for LDC and EMG (shown in row [B]). Row [C] shows the threshold level of the
legal variable, above which a one-unit increase in capital account openness has a positive impact
on equity market development. Thus, we can conclude that, in order for capital account openness
to contribute to the development of equity markets, countries must be possessed of a level of
legal/institutional development greater than LEGAL1=�0.68. Hence, emerging market
countries (whose average value of LEGAL1 �0.28 exceeds the �0.68 threshold), will on
average benefit from opening their capital accounts. On the other hand, less developed countries
will hamper their equity market development by opening capital accounts. In our data set,
Tunisia has a value of LEGAL1 closest to the threshold level (its value is �0.683). The countriesmarginally above the threshold level include India and Morocco (�0.561 and �0.566,respectively) among others, while those closely below include Mexico and Iran (�0.793 and
�0.738, respectively) among others.
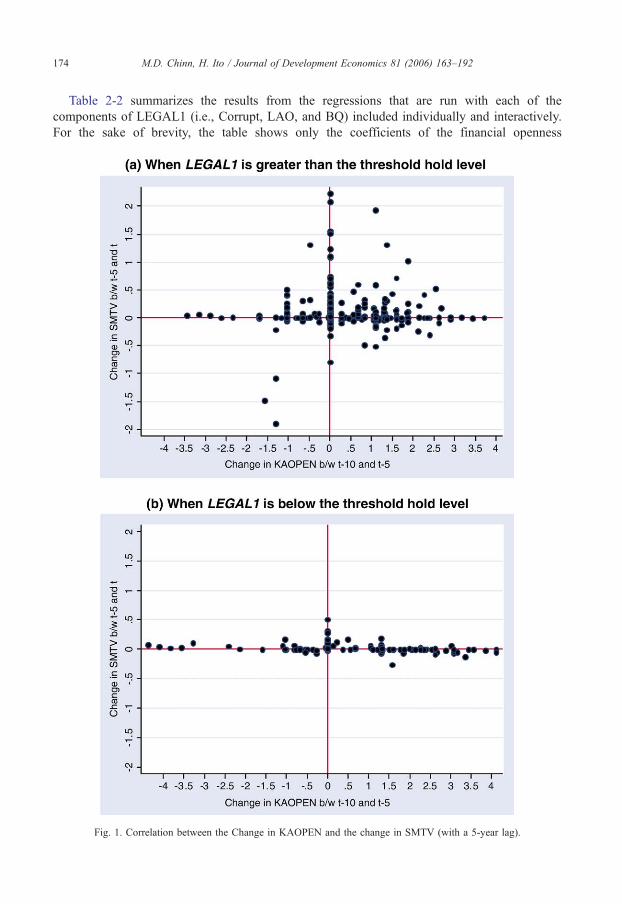
Fig. 1 depicts this clear difference in the correlation between capital account openness and
equity market development. The upper scatter diagram (a) shows the relationship between the 5-
year change in the KAOPEN level 5 years prior to the time period (i.e., change between t�10
and t�5) and the level change in SMTV between t�5 and the contemporary time period (t) for
the countries whose LEGAL1 value is above the threshold level, while diagram (b) is for those
with lower LEGAL1 variables than the threshold. Not surprisingly, we can observe that, for the
countries with above-threshold levels of general legal or institutional development, KAOPEN
and SMTV have a positive relationship. For the countries with below-threshold levels of legal
development, there is no discernable relationship between capital account opening and equity
market development. Also, in these countries, equity markets appear to be far from active
regardless of the degree of financial liberalization.
M.D. Chinn, H. Ito / Journal of Development Economics 81 (2006) 163–192174
Table 2-2 summarizes the results from the regressions that are run with each of the
components of LEGAL1 (i.e., Corrupt, LAO, and BQ) included individually and interactively.
For the sake of brevity, the table shows only the coefficients of the financial openness
Fig. 1. Correlation between the Change in KAOPEN and the change in SMTV (with a 5-year lag).

M.D. Chinn, H. Ito / Journal of Development Economics 81 (2006) 163–192 175
variable, the legal/institutional variable, and the interaction term. Across the different models
with different measures of financial development, the significance of the estimated coefficients
appears to be qualitatively the same as those of the regressions with LEGAL1. Table 3, again,
helps our interpretation of the overall effect of KAOPEN for the models with SMTV.
Generally, we can surmise that liberalizing capital accounts may lead to development in equity
markets only when the measures against corruption or law and order are higher than the
threshold levels (52.2 and 54.5, respectively). In other words, their measures need to be as
well-established as in emerging market countries in order to reap the benefit of capital account
liberalization. When we control for the level of bureaucratic quality, financial openness seems
to leads to financial development among both less developed and emerging market countries
(because of both subsample groups’ higher average values than the threshold level), but its
effect is higher for the latter group. Interestingly, we can observe that the coefficient of
KAOPENt�5 alone has a negative sign wherever the interactive term has a significant
coefficient, suggesting that opening financial markets alone may lead to underdevelopment of
equity markets, but it can be avoided only if the countries are equipped with a reasonable level
of legal/institutional development.
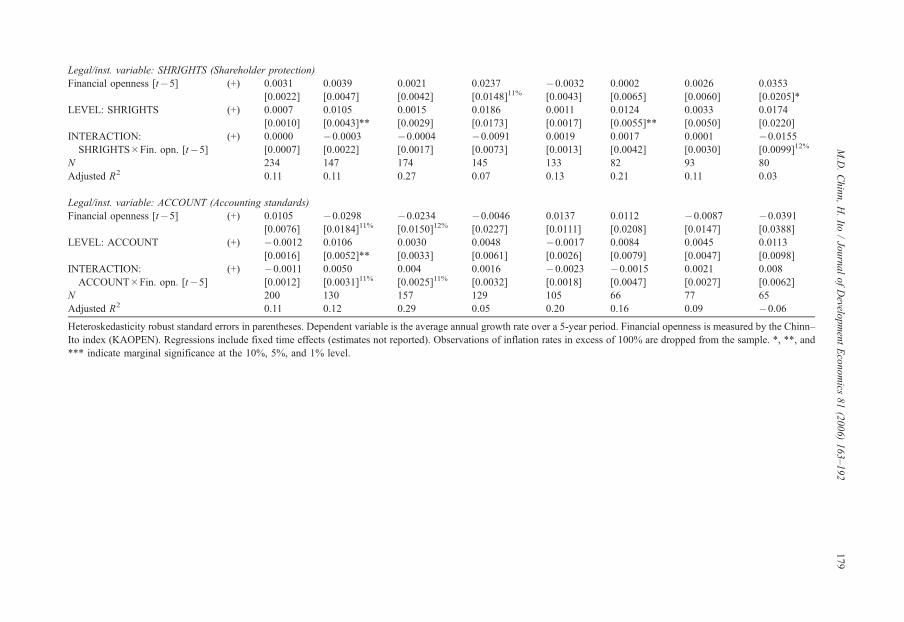
When we focus on the effect of legal development relating particularly to financial
transactions (LEGAL2 and La Porta et al. variables), the findings are not as decisive as in the
previous cases (results shown in Tables 2-3 and 2-4).23 Using LEGAL2 as the legal/institutional
variable (Table 2-3) in the LDC/EMG subgroup, its interactive effect with LEGAL2, and the
LEGAL2 level term are significant in the determination of the development in stock market
total value. Table 3 shows that the total effect of financial openness is positive on average in
the LDC/EMG subgroup (i.e., the subgroup’s average level of legal development is higher
than the threshold level). In other models for the LDC/EMG subgroup, however, neither
financial openness nor its interactive term seems to affect banking or equity market
development in a significant fashion.
Among the components of the financial legal development variable (LEGAL2), shown in
Table 2-4 (which again only shows the coefficients of interest), the level of creditor protection
seems to be an important factor for financial development in both banking and equity sectors
while no interactive effect is detected. When contract enforcement is used as the legal/
institutional variable, in all models with equity market development, we can detect a positive
interactive effect and a negative solo effect of the level of financial openness. Among the models
with shareholder protection, the level of shareholder protection seems to matter for stock market
capitalization while the level of financial openness contributes to stock market turnover. The
models using accounting standards as the legal/institutional measure do not indicate any effect of
financial openness on financial development.
Our findings suggest that in order for financial openness to help develop equity markets,
the level of legal and institutional development is crucial. If a country tries to develop its
equity markets while it is not equipped with well-developed legal systems or institutions,
opening capital accounts may even harm the development of equity markets. Also, we find
that it is the development of general legal systems and institutions, not of those specific to
financial transactions, that is crucial for a country to benefit from opening its financial
markets.
23 As previously discussed, due to the data availability of the LLSV variables, there is only one subsample for non-
industrialized countries, which we call LDC/EMG.
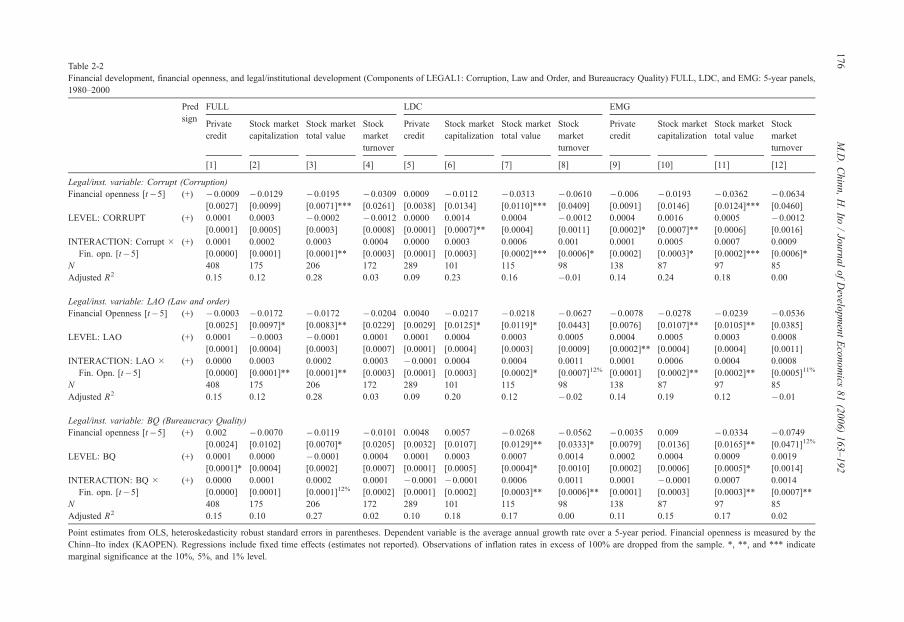
Table 2-2
Financial development, financial openness, and legal/institutional development (Components of LEGAL1: Corruption, Law and Order, and Bureaucracy Quality) FULL, LDC, and EMG: 5-year panels,
1980–2000
Pred
sign
FULL LDC EMG
Private
credit
Stock market
capitalization
Stock market
total value
Stock
market
turnover
Private
credit
Stock market
capitalization
Stock market
total value
Stock
market
turnover
Private
credit
Stock market
capitalization
Stock market
total value
Stock
market
turnover
[1] [2] [3] [4] [5] [6] [7] [8] [9] [10] [11] [12]
Legal/inst. variable: Corrupt (Corruption)
Financial openness [t�5] (+) �0.0009[0.0027]
�0.0129[0.0099]
�0.0195[0.0071]***
�0.0309[0.0261]
0.0009
[0.0038]
�0.0112[0.0134]
�0.0313[0.0110]***
�0.0610[0.0409]
�0.006[0.0091]
�0.0193[0.0146]
�0.0362[0.0124]***
�0.0634[0.0460]
LEVEL: CORRUPT (+) 0.0001
[0.0001]
0.0003
[0.0005]
�0.0002[0.0003]
�0.0012[0.0008]
0.0000
[0.0001]
0.0014
[0.0007]**
0.0004
[0.0004]
�0.0012[0.0011]
0.0004
[0.0002]*
0.0016
[0.0007]**
0.0005
[0.0006]
�0.0012[0.0016]
INTERACTION: Corrupt �Fin. opn. [t�5]
(+) 0.0001
[0.0000]
0.0002
[0.0001]
0.0003
[0.0001]**
0.0004
[0.0003]
0.0000
[0.0001]
0.0003
[0.0003]
0.0006
[0.0002]***
0.001
[0.0006]*
0.0001
[0.0002]
0.0005
[0.0003]*
0.0007
[0.0002]***
0.0009
[0.0006]*
N 408 175 206 172 289 101 115 98 138 87 97 85
Adjusted R2 0.15 0.12 0.28 0.03 0.09 0.23 0.16 �0.01 0.14 0.24 0.18 0.00
Legal/inst. variable: LAO (Law and order)
Financial Openness [t�5] (+) �0.0003[0.0025]
�0.0172[0.0097]*
�0.0172[0.0083]**
�0.0204[0.0229]
0.0040
[0.0029]
�0.0217[0.0125]*
�0.0218[0.0119]*
�0.0627[0.0443]
�0.0078[0.0076]
�0.0278[0.0107]**
�0.0239[0.0105]**
�0.0536[0.0385]
LEVEL: LAO (+) 0.0001
[0.0001]
�0.0003[0.0004]
�0.0001[0.0003]
0.0001
[0.0007]
0.0001
[0.0001]
0.0004
[0.0004]
0.0003
[0.0003]
0.0005
[0.0009]
0.0004
[0.0002]**
0.0005
[0.0004]
0.0003
[0.0004]
0.0008
[0.0011]
INTERACTION: LAO �Fin. Opn. [t�5]
(+) 0.0000
[0.0000]
0.0003
[0.0001]**
0.0002
[0.0001]**
0.0003
[0.0003]
�0.0001[0.0001]
0.0004
[0.0003]
0.0004
[0.0002]*
0.0011
[0.0007]12%0.0001
[0.0001]
0.0006
[0.0002]**
0.0004
[0.0002]**
0.0008
[0.0005]11%
N 408 175 206 172 289 101 115 98 138 87 97 85
Adjusted R2 0.15 0.12 0.28 0.03 0.09 0.20 0.12 �0.02 0.14 0.19 0.12 �0.01
Legal/inst. variable: BQ (Bureaucracy Quality)
Financial openness [t�5] (+) 0.002
[0.0024]
�0.0070[0.0102]
�0.0119[0.0070]*
�0.0101[0.0205]
0.0048
[0.0032]
0.0057
[0.0107]
�0.0268[0.0129]**
�0.0562[0.0333]*
�0.0035[0.0079]
0.009
[0.0136]
�0.0334[0.0165]**
�0.0749[0.0471]12%
LEVEL: BQ (+) 0.0001
[0.0001]*
0.0000
[0.0004]
�0.0001[0.0002]
0.0004
[0.0007]
0.0001
[0.0001]
0.0003
[0.0005]
0.0007
[0.0004]*
0.0014
[0.0010]
0.0002
[0.0002]
0.0004
[0.0006]
0.0009
[0.0005]*
0.0019
[0.0014]
INTERACTION: BQ �Fin. opn. [t�5]
(+) 0.0000
[0.0000]
0.0001
[0.0001]
0.0002
[0.0001]12%0.0001
[0.0002]
�0.0001[0.0001]
�0.0001[0.0002]
0.0006
[0.0003]**
0.0011
[0.0006]**
0.0001
[0.0001]
�0.0001[0.0003]
0.0007
[0.0003]**
0.0014
[0.0007]**
N 408 175 206 172 289 101 115 98 138 87 97 85
Adjusted R2 0.15 0.10 0.27 0.02 0.10 0.18 0.17 0.00 0.11 0.15 0.17 0.02
Point estimates from OLS, heteroskedasticity robust standard errors in parentheses. Dependent variable is the average annual growth rate over a 5-year period. Financial openness is measured by the
Chinn–Ito index (KAOPEN). Regressions include fixed time effects (estimates not reported). Observations of inflation rates in excess of 100% are dropped from the sample. *, **, and *** indicate
marginal significance at the 10%, 5%, and 1% level.
M.D.Chinn,H.Ito
/JournalofDevelo
pmentEconomics
81(2006)163–192
176
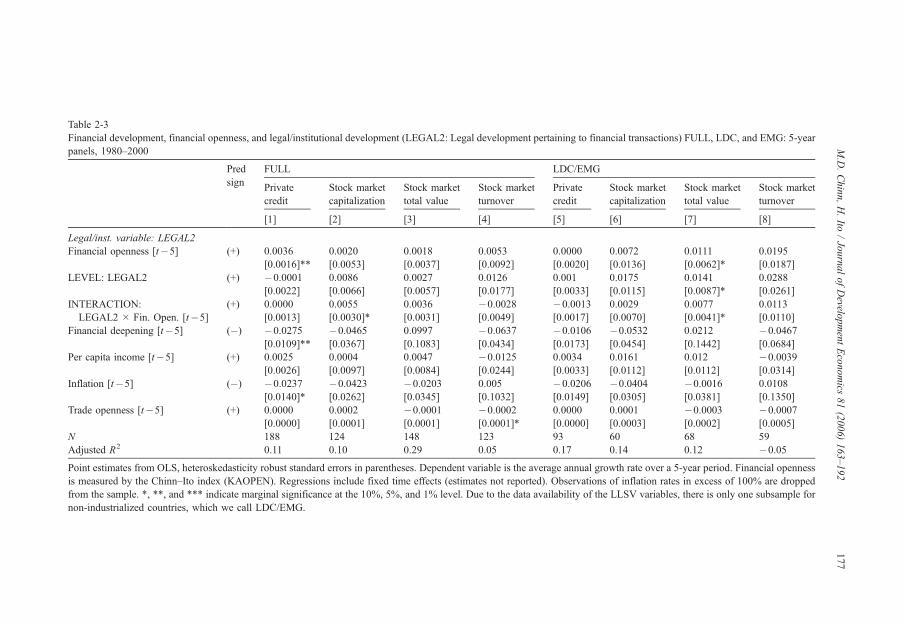
Table 2-3
Financial development, financial openness, and legal/institutional development (LEGAL2: Legal development pertaining to financial transactions) FULL, LDC, and EMG: 5-year
panels, 1980–2000
Pred
sign
FULL LDC/EMG
Private
credit
Stock market
capitalization
Stock market
total value
Stock market
turnover
Private
credit
Stock market
capitalization
Stock market
total value
Stock market
turnover
[1] [2] [3] [4] [5] [6] [7] [8]
Legal/inst. variable: LEGAL2
Financial openness [t�5] (+) 0.0036
[0.0016]**
0.0020
[0.0053]
0.0018
[0.0037]
0.0053
[0.0092]
0.0000
[0.0020]
0.0072
[0.0136]
0.0111
[0.0062]*
0.0195
[0.0187]
LEVEL: LEGAL2 (+) �0.0001[0.0022]
0.0086
[0.0066]
0.0027
[0.0057]
0.0126
[0.0177]
0.001
[0.0033]
0.0175
[0.0115]
0.0141
[0.0087]*
0.0288
[0.0261]
INTERACTION:
LEGAL2 � Fin. Open. [t�5](+) 0.0000
[0.0013]
0.0055
[0.0030]*
0.0036
[0.0031]
�0.0028[0.0049]
�0.0013[0.0017]
0.0029
[0.0070]
0.0077
[0.0041]*
0.0113
[0.0110]
Financial deepening [t�5] (�) �0.0275[0.0109]**
�0.0465[0.0367]
0.0997
[0.1083]
�0.0637[0.0434]
�0.0106[0.0173]
�0.0532[0.0454]
0.0212
[0.1442]
�0.0467[0.0684]
Per capita income [t�5] (+) 0.0025
[0.0026]
0.0004
[0.0097]
0.0047
[0.0084]
�0.0125[0.0244]
0.0034
[0.0033]
0.0161
[0.0112]
0.012
[0.0112]
�0.0039[0.0314]
Inflation [t�5] (�) �0.0237[0.0140]*
�0.0423[0.0262]
�0.0203[0.0345]
0.005
[0.1032]
�0.0206[0.0149]
�0.0404[0.0305]
�0.0016[0.0381]
0.0108
[0.1350]
Trade openness [t�5] (+) 0.0000
[0.0000]
0.0002
[0.0001]
�0.0001[0.0001]
�0.0002[0.0001]*
0.0000
[0.0000]
0.0001
[0.0003]
�0.0003[0.0002]
�0.0007[0.0005]
N 188 124 148 123 93 60 68 59
Adjusted R2 0.11 0.10 0.29 0.05 0.17 0.14 0.12 �0.05Point estimates from OLS, heteroskedasticity robust standard errors in parentheses. Dependent variable is the average annual growth rate over a 5-year period. Financial openness
is measured by the Chinn–Ito index (KAOPEN). Regressions include fixed time effects (estimates not reported). Observations of inflation rates in excess of 100% are dropped
from the sample. *, **, and *** indicate marginal significance at the 10%, 5%, and 1% level. Due to the data availability of the LLSV variables, there is only one subsample for
non-industrialized countries, which we call LDC/EMG.
M.D.Chinn,H.Ito
/JournalofDevelo
pmentEconomics
81(2006)163–192
177

Table 2-4
Financial development, financial openness, and legal/institutional development (Creditor protection, contract enforcement, shareholder protection, and accounting standards)
FULL, LDC, and EMG: 5-year panels, 1980–2000
Pred
sign
FULL LDC/EMG
Private
credit
Stock market
capitalization
Stock market
total value
Stock market
turnover
Private
credit
Stock market
capitalization
Stock market
total value
Stock market
turnover
[1] [2] [3] [4] [5] [6] [7] [8]
Legal/inst. variable: CREDITOR (Creditor protection)
Financial openness [t�5] (+) 0.0003
[0.0022]
0.0031
[0.0060]
0.0036
[0.0055]
0.0032
[0.0105]
0.0011
[0.0038]
�0.0013[0.0050]
�0.0021[0.0049]
�0.0058[0.0205]
LEVEL: CREDITOR (+) 0.0029
[0.0016]*
�0.0020[0.0038]
0.0012
[0.0035]
0.0169
[0.0089]*
0.0030
[0.0018]*
0.0027
[0.0035]
0.009
[0.0045]**
0.0202
[0.0118]*
INTERACTION:
CREDITOR�Fin. opn. [t�5](+) 0.0012
[0.0010]
�0.0003[0.0023]
�0.0014[0.0021]
�0.0018[0.0034]
�0.0001[0.0014]
0.0014
[0.0023]
0.0017
[0.0017]
0.0006
[0.0048]
N 230 145 169 143 129 80 88 78
Adjusted R2 0.14 0.07 0.27 0.05 0.15 0.19 0.12 �0.01
Legal/inst. variable: ENFORCE (Contract enforcement)
Financial Openness [t�5] (+) �0.0044[0.0057]
�0.0342[0.0160]**
�0.0211[0.0125]*
�0.0246[0.0427]
�0.0080[0.0131]
�0.0531[0.0231]**
�0.0587[0.0203]***
�0.1509[0.0974]
LEVEL: ENFORCE (+) 0.0020
[0.0014]
�0.0068[0.0070]
�0.0030[0.0058]
0.0002
[0.0219]
0.0059
[0.0028]**
0.0037
[0.0080]
0.0097
[0.0079]
0.0077
[0.0342]
INTERACTION:
ENFORCE�Fin. opn. [t�5](+) 0.0009
[0.0007]
0.0051
[0.0021]**
0.003
[0.0017]*
0.0034
[0.0054]
0.0015
[0.0021]
0.0093
[0.0042]**
0.0100
[0.0033]***
0.0243
[0.0144]*
N 240 151 178 149 139 86 97 84
Adjusted R2 0.12 0.11 0.28 0.04 0.16 0.23 0.18 0.03
M.D.Chinn,H.Ito
/JournalofDevelo
pmentEconomics
81(2006)163–192
178
Legal/inst. variable: SHRIGHTS (Shareholder protection)
Financial openness [t�5] (+) 0.0031
[0.0022]
0.0039
[0.0047]
0.0021
[0.0042]
0.0237
[0.0148]11%�0.0032[0.0043]
0.0002
[0.0065]
0.0026
[0.0060]
0.0353
[0.0205]*
LEVEL: SHRIGHTS (+) 0.0007
[0.0010]
0.0105
[0.0043]**
0.0015
[0.0029]
0.0186
[0.0173]
0.0011
[0.0017]
0.0124
[0.0055]**
0.0033
[0.0050]
0.0174
[0.0220]
INTERACTION:
SHRIGHTS�Fin. opn. [t�5](+) 0.0000
[0.0007]
�0.0003[0.0022]
�0.0004[0.0017]
�0.0091[0.0073]
0.0019
[0.0013]
0.0017
[0.0042]
0.0001
[0.0030]
�0.0155[0.0099]12%
N 234 147 174 145 133 82 93 80
Adjusted R2 0.11 0.11 0.27 0.07 0.13 0.21 0.11 0.03
Legal/inst. variable: ACCOUNT (Accounting standards)
Financial openness [t�5] (+) 0.0105
[0.0076]
�0.0298[0.0184]11%
�0.0234[0.0150]12%
�0.0046[0.0227]
0.0137
[0.0111]
0.0112
[0.0208]
�0.0087[0.0147]
�0.0391[0.0388]
LEVEL: ACCOUNT (+) �0.0012[0.0016]
0.0106
[0.0052]**
0.0030
[0.0033]
0.0048
[0.0061]
�0.0017[0.0026]
0.0084
[0.0079]
0.0045
[0.0047]
0.0113
[0.0098]
INTERACTION:
ACCOUNT�Fin. opn. [t�5](+) �0.0011
[0.0012]
0.0050
[0.0031]11%0.004
[0.0025]11%0.0016
[0.0032]
�0.0023[0.0018]
�0.0015[0.0047]
0.0021
[0.0027]
0.008
[0.0062]
N 200 130 157 129 105 66 77 65
Adjusted R2 0.11 0.12 0.29 0.05 0.20 0.16 0.09 �0.06Heteroskedasticity robust standard errors in parentheses. Dependent variable is the average annual growth rate over a 5-year period. Financial openness is measured by the Chinn–
Ito index (KAOPEN). Regressions include fixed time effects (estimates not reported). Observations of inflation rates in excess of 100% are dropped from the sample. *, **, and
*** indicate marginal significance at the 10%, 5%, and 1% level.
M.D.Chinn,H.Ito
/JournalofDevelo
pmentEconomics
81(2006)163–192
179
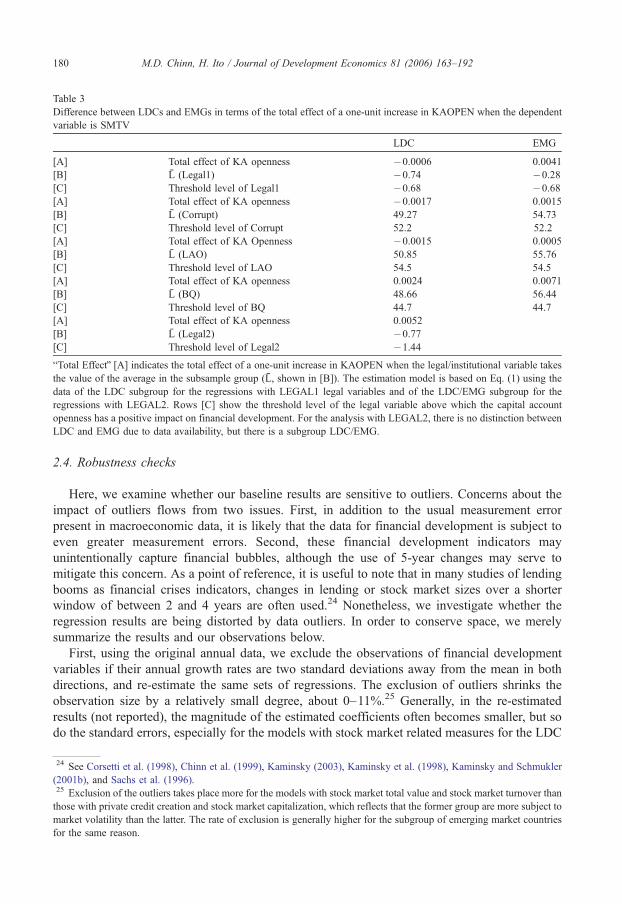
Table 3
Difference between LDCs and EMGs in terms of the total effect of a one-unit increase in KAOPEN when the dependent
variable is SMTV
LDC EMG
[A] Total effect of KA openness �0.0006 0.0041
[B] L (Legal1) �0.74 �0.28[C] Threshold level of Legal1 �0.68 �0.68[A] Total effect of KA openness �0.0017 0.0015
[B] L (Corrupt) 49.27 54.73
[C] Threshold level of Corrupt 52.2 52.2
[A] Total effect of KA Openness �0.0015 0.0005
[B] L (LAO) 50.85 55.76
[C] Threshold level of LAO 54.5 54.5
[A] Total effect of KA openness 0.0024 0.0071
[B] L (BQ) 48.66 56.44
[C] Threshold level of BQ 44.7 44.7
[A] Total effect of KA openness 0.0052
[B] L (Legal2) �0.77[C] Threshold level of Legal2 �1.44bTotal EffectQ [A] indicates the total effect of a one-unit increase in KAOPEN when the legal/institutional variable takes
the value of the average in the subsample group (L, shown in [B]). The estimation model is based on Eq. (1) using the
data of the LDC subgroup for the regressions with LEGAL1 legal variables and of the LDC/EMG subgroup for the
regressions with LEGAL2. Rows [C] show the threshold level of the legal variable above which the capital account
openness has a positive impact on financial development. For the analysis with LEGAL2, there is no distinction between
LDC and EMG due to data availability, but there is a subgroup LDC/EMG.
M.D. Chinn, H. Ito / Journal of Development Economics 81 (2006) 163–192180
2.4. Robustness checks
Here, we examine whether our baseline results are sensitive to outliers. Concerns about the
impact of outliers flows from two issues. First, in addition to the usual measurement error
present in macroeconomic data, it is likely that the data for financial development is subject to
even greater measurement errors. Second, these financial development indicators may
unintentionally capture financial bubbles, although the use of 5-year changes may serve to
mitigate this concern. As a point of reference, it is useful to note that in many studies of lending
booms as financial crises indicators, changes in lending or stock market sizes over a shorter
window of between 2 and 4 years are often used.24 Nonetheless, we investigate whether the
regression results are being distorted by data outliers. In order to conserve space, we merely
summarize the results and our observations below.
First, using the original annual data, we exclude the observations of financial development
variables if their annual growth rates are two standard deviations away from the mean in both
directions, and re-estimate the same sets of regressions. The exclusion of outliers shrinks the
observation size by a relatively small degree, about 0–11%.25 Generally, in the re-estimated
results (not reported), the magnitude of the estimated coefficients often becomes smaller, but so
do the standard errors, especially for the models with stock market related measures for the LDC
24 See Corsetti et al. (1998), Chinn et al. (1999), Kaminsky (2003), Kaminsky et al. (1998), Kaminsky and Schmukler
(2001b), and Sachs et al. (1996).25 Exclusion of the outliers takes place more for the models with stock market total value and stock market turnover than
those with private credit creation and stock market capitalization, which reflects that the former group are more subject to
market volatility than the latter. The rate of exclusion is generally higher for the subgroup of emerging market countries
for the same reason.
M.D. Chinn, H. Ito / Journal of Development Economics 81 (2006) 163–192 181
and EMG subgroups. Therefore, not only does the statistical significance of the coefficients
remain qualitatively unchanged, but in addition, some of the coefficients which were previously
insignificant become significant.
Interestingly, in many models the adjusted R2 increases. This is most apparent in the models
with LEGAL2 and ACCOUNT. In this analysis for the LDC/EMG group, the coefficient of
LEGAL2 is now significant for the model with SMKC, and both the KAOPEN variable and the
interactive term are statistically negative and positive, respectively, for the models with SMKC
and SMTV. The same exercise is then repeated, but increasing the range of outlier exclusion by
dropping the observations if their annual growth rates are larger than one and a half standard
deviations away from the mean in both directions. This exclusion shrinks the sample size quite
substantially (sometimes as much as 40%), although the results are largely unchanged. The fit
and the significance of the coefficients even improves for the models for the LDC/EMG with
LEGAL2 and ACCOUNT. Two conclusions flow from this exercise. First, the key findings of
the analysis are not driven by outliers. Second, some of the findings related to the legal/
institutional variables could have even been obscured by the effects of outliers.
2.5. Reverse causality?
One may reasonably ask if financial development is what allows countries to implement
financial liberalization policy, rather than the reverse. While we have worked with non-
overlapping, 5-year window panels in order to mitigate problems associated with simultaneity, it
may still be worthwhile to investigate whether countries need to develop their financial systems
before undertaking capital account liberalization. Conversely, if we can show that reverse
causality is irrelevant, that will be evidence that countries can develop their financial markets by
exogenously deciding to open their financial markets.
To explore the above question, we change the specification in Eq. (1) by exchanging the
places of KAOPENt�5 and financial development measures (PCGDP, SMKC, SMTV, and
SMTO); the left-hand side variable is now the 5-year average growth in KAOPEN while the
independent variables of our focus now becomes the financial development variable and the
interactive terms between the legal/institutional variables and the financial development
variables. We run regressions specified as follows, using non-overlapping data and including
each of the legal/institutional variables:
KAOPENit � KAOPENi
t�5 ¼ /0 þ uKAOPENit�5 þ /1FD
it�5 þ /2L
i
þ /3 Li � FDit�5
� �þ X i
t�5Uþ mit: ð2Þ
The coefficient of our interest is /1; A significantly positive /1 would indicate that the above
OLS regression results entail simultaneous causality, i.e., financial development leads to
financial openness. The regression results (not reported) show that across the regressions with
different financial development measures as well as legal/institutional variables, the coefficients,
/1’s, are mostly statistically insignificant or significantly negative, either of which is against the
null hypothesis that financial development leads to financial openness. The significantly
negative /1’s are found in the regressions that have the dependent variable of the equity market
development measures. One of the possible explanations for the negative /1 may be that a rapid
growth in equity markets, in terms of the size of the markets (SMKC) or the liquidity of the
markets (SMTVor SMTO) is sometimes associated with financial crises, and that policy makers
lower the degree of financial openness during periods of crisis (Ito, 2004). At the very least, we
M.D. Chinn, H. Ito / Journal of Development Economics 81 (2006) 163–192182
can conclude that our estimation results are not subject to obvious simultaneity issues (as in
Bekaert et al., 2000).
3. Investigating the sequence of liberalization
3.1. Trade and capital account liberalization
One suggestive result we must discuss is the frequent finding of statistically significant and
positive coefficients on the trade openness variable in the above estimation results based on Eq.
(2). To the extent that our trade openness variable reflects trade liberalization, our results are
germane to the question if trade openness is a precondition for financial opening. This is the
optimal sequence question, which has been raised by many, including McKinnon (1991). In fact,
liberalization in goods markets is often claimed to be a precondition for financial liberalization
policy (Tornell et al., 2004).
We empirically explore this hypothesis by employing a simple model that accounts for the
determinants of financial openness or restrictions. As stated in Eq. (3), we model financial
openness as the function of government budget surplus, international reserves, trade openness,
and per capita GDP.26
KAOPENt ¼ n0 þ n1KAOPENt�5 þ n2TradeOpent�5 þ Zt�1jt�5Nþ mt; ð3Þwhere Zt�1jt�5 is a vector of macroeconomic control variables, namely, government budget
surplus, international reserves, and per capita GDP.27 We select two variables–the government
budget surplus and international reserves–since they are most commonly argued as the
determinants of capital controls.28,29 We also include per capita GDP to control for the level of
development of the economic system. Since these variables are supposed to control for the
general trend of macro-variables, they are included as the 5-year average prior to the time period
t (as shown as (t�1jt�5) in the regression results table).
With these macro-variables, we test whether trade openness is a precondition for financial
opening by including a 5-year lagged variable for the trade openness measure. Although we used
in the previous analyses, opn, the sum of exports and imports divided by GDP, as the trade
openness variable, we use a different variable to measure openness in trade flows. By
construction, the variable opn measures the openness in good transactions in terms of not only
27 The variable for gross international reserves is a proxy to the balance of payments situation of the countries and is
measured by gross international reserves in months of imports. The lower gross reserves in months of imports, the higher
prevalence of balance of payments concerns are. The data are extracted from the World Bank’s World Development
Indicators.28 Grilli and Milesi-Ferretti (1995) show that capital controls have strong fiscal implications, i.e., countries with a less
developed tax system tend to implement capital controls as the source of government revenue as well as the remedy to
capital flows caused by the inflation-driven distortions in the financial markets. Johnston and Tamirisa (1998) find that
countries tend to implement capital controls, the more prevalent the balance of payments concerns are. For more
discussion of the macroeconomic determinants of capital controls, refer to Leblang (1997).29 In addition to the above variables, we included variables that refer to the government engagement in seigniorage, such
as the inflation rate or the reserve ratio. However, these measures of seigniorage can cause multicollinearity in regression
analysis due to its correlation with the level of government budget surplus, the reverse of which is often the reason for
seigniorage. Therefore, we decided not to include seigniorage-related variables in our regression model.
26 The empirical model also controls for regional differences by regional dummies. In Glick et al. (2004), an empirical
model of capital account liberalization is proposed. Our set of explanatory variables overlaps, but does not match, theirs.
In part the difference arises from their more empirically oriented motivation for model selection.

Table 4
Determinants of capital account and trade openness FULL, LDC, and EMG: 5-year panels, 1980–2000
Dependent variable Pred. sign Financial openness (t) Trade openness (t)
(1) (2) (3) (4) (5) (6)
Full LDC EMG Full LDC EMG
Financial openness
(t�5)+ 0.5939
[0.0580]*
0.5313
[0.0794]*
0.3499
[0.1176]*
�0.0001[0.0015]
0.0019
[0.0022]
�0.0005[0.0028]
Trade openness
(t�5)+ 2.1763
[1.0279]**
2.0317
[1.0586]**
1.9427
[2.0338]
0.5938
[0.0794]*
0.5633
[0.0857]*
0.5746
[0.0940]*
Avg. budget surplus
(t�1|t�5)+ 0.0402
[0.0151]*
0.0537
[0.0177]*
0.0618
[0.0305]**
0.0002
[0.0005]
0.0002
[0.0007]
0.0002
[0.0006]
Avg. total reserves
(t�1|t�5)+ �0.0049
[0.0245]
0.0043
[0.0304]
0.0124
[0.0413]
Avg. GDP per capita
(t�1|t�5)+ 0.3034
[0.0971]*
0.1945
[0.1157]***
0.5135
[0.2821]***
0.0174
[0.0035]*
0.0196
[0.0047]*
0.0339
[0.0086]*
Number of observations 263 181 100 223 151 82
Adjusted R2 0.59 0.42 0.35 0.75 0.63 0.70
Robust standard errors in brackets. Budget surplus, total reserves, and GDP per capita are included at the average over
t�1 through t�5. Constant and regional dummies for Asia, Europe, Middle East, and Africa are also included in the
regression, but their estimated coefficients are not reported. The regression estimations are conducted in non-overlapping
manners with the observations excepted for 1980, 1985, 1990, 1995, and 2000 excluded.
* Significant at 1%.
** Significant at 5%.
*** Significant at 10%.
M.D. Chinn, H. Ito / Journal of Development Economics 81 (2006) 163–192 183
economic factors but also regulatory measures such as tariffs and quotas. As such, we use
another variable TRADEOPEN which is a reciprocal of the duties imposed on both imports and
exports.30
In order to minimize the possibility of two-way causality, we employ a non-overlapping panel
data analysis as we did in previous analyses. While the macro-variables are included as the 5-
year average, both KAOPEN and TRADEOPEN are included as the initial conditions of each 5-
year panel. In the empirical analysis, we focus on the coefficient n2 to see if the openness in
goods trade can be a precondition for financial opening.
The first three columns of Table 4 report the regressions results. While the average budget
surplus and GDP per capita enter significantly, but not international reserves, the trade openness
variable seems to contribute to the level of financial openness in the full sample and the
subsample for the less developed countries, indicating that the openness in goods transactions is
a precondition for financial openness. Columns (4) through (6) of Table 4 show the results when
we switch the places for KAOPEN and TRADEOPEN in the regression, in order to see whether
the reverse causality also holds.31 We can see that in both the full sample and the subsamples, the
financial openness variable does not enter significantly. Hence, we can safely conclude that the
more openness in goods transactions can lead to a more openness in capital account, but the
reverse causality does not appear to be present, a result consistent with Tornell et al. (2004).
30 Import and export duties as a ratio to imports and exports, respectively, are available from the World Bank’s WDI.
The weighted average of these variables is calculated using the share of imports and exports in total trade and then
subtracted from 100 to show the openness. Hence, the higher (or close to 100) TRADEOPEN is, the less duties imposed
on trade flows in both directions, i.e., the more open trade flows are by regulation. Note the variable is included in log
form.31 The variable for international reserves is not retained because it lacks a theoretical motivation.

M.D. Chinn, H. Ito / Journal of Development Economics 81 (2006) 163–192184
3.2. Endogeneity and the sequence of liberalization
Taking our cue from the results reported above, we implement two stage least squares (2SLS)
estimation instrumenting the KAOPENt�5 variable in Eq. (1) with the initial conditions of
financial and trade openness 5 years prior to the variable (i.e., 10-year lagged), as well as
government budget surplus and GDP per capita as the 5-year average prior to t�5 and regional
dummies.32 If we can detect the effect of financial openness on financial development, we can
present evidence that financial opening which is preceded by trade opening leads to financial
development in a model where the level of legal/institutional development is controlled for.
The results (not reported) of applying 2SLS to a model that controls for the general
development level of legal systems and institutions (LEGAL1) suggest that, for the group of less
developed countries, both the magnitude and the statistical significance of the estimated
coefficients for the models with stock market capitalization (SMKC) and stock market total value
(SMTV) increase. For the SMKC, the levels of both legal development and financial openness are
significant contributors to equity market development. When financial development is measured
by stock market total value, in addition to the level effects of both financial openness and legal
development, the interactive effect between the two is also identified. Similar results are also
found in the group of emerging market countries. Given these results, we may conclude that
financial opening succeeding trading opening leads to equity market development especially
when it takes place in an economy with a reasonably developed legal system.
4. Interactions of banks and equity markets
In this section, we investigate two questions. The first is whether the development of a
banking sector a precondition for the development of an equity market. Second, does the
development of one sector substitute or complement development in another?
4.1. Sequencing in financial development
We modify the basic regression model of Eq. (1) by adding a new term: the level of financial
development in the alternative mode. For the regressions with equity market development, the
initial level of banking development, private credit creation (PCGDP), in each 5-year panel is
included in the regression model whereas the initial level of equity market development,
measured as stock market capitalization (SMKC), is included in the regressions for banking
development as a comparison. The new equation is now:
FDit � FDi
t�5 ¼ c0 þ qFDit�5 þ c1KAOPEN
it�5 þ c2L
i þ c3 Li � KAOPENit�5
� �
þ k0OtherFint�5 þ X it�5Cþ eit ð4Þ
where OtherFin refers to PCGDP for the regressions on equity market development and to
SMKC for the regression with PCGDP. As with the basic model, the regression is repeated for
each of the financial development measures as the dependent variable and using different legal/
institutional variables. Given the results from the previous section, we will only use the legal/
institutional variables from the LEGAL1 group.
The regression results are summarized in Table 5. This table contains only the estimated
coefficients for OtherFint�5(k0). While SMKCt�5 never enters significantly for the models on
32 The international reserves variable is not included because of its insignificance in the previous analysis.
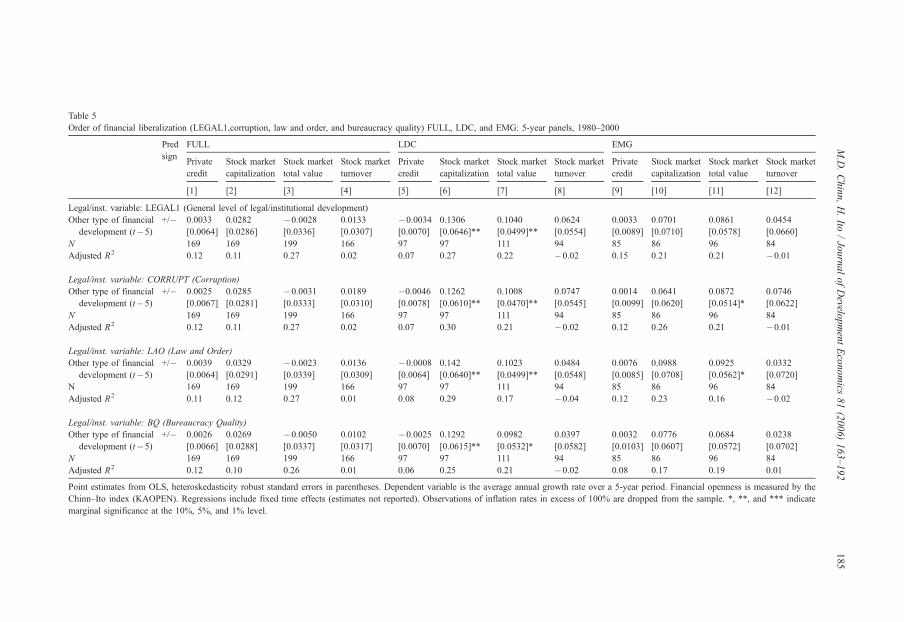
Table 5
Order of financial liberalization (LEGAL1,corruption, law and order, and bureaucracy quality) FULL, LDC, and EMG: 5-year panels, 1980–2000
Pred
sign
FULL LDC EMG
Private
credit
Stock market
capitalization
Stock market
total value
Stock market
turnover
Private
credit
Stock market
capitalization
Stock market
total value
Stock market
turnover
Private
credit
Stock market
capitalization
Stock market
total value
Stock market
turnover
[1] [2] [3] [4] [5] [6] [7] [8] [9] [10] [11] [12]
Legal/inst. variable: LEGAL1 (General level of legal/institutional development)
Other type of financial
development (t�5)+/� 0.0033
[0.0064]
0.0282
[0.0286]
�0.0028[0.0336]
0.0133
[0.0307]
�0.0034
[0.0070]
0.1306
[0.0646]**
0.1040
[0.0499]**
0.0624
[0.0554]
0.0033
[0.0089]
0.0701
[0.0710]
0.0861
[0.0578]
0.0454
[0.0660]
N 169 169 199 166 97 97 111 94 85 86 96 84
Adjusted R2 0.12 0.11 0.27 0.02 0.07 0.27 0.22 �0.02 0.15 0.21 0.21 �0.01
Legal/inst. variable: CORRUPT (Corruption)
Other type of financial
development (t�5)+/� 0.0025
[0.0067]
0.0285
[0.0281]
�0.0031[0.0333]
0.0189
[0.0310]
�0.0046[0.0078]
0.1262
[0.0610]**
0.1008
[0.0470]**
0.0747
[0.0545]
0.0014
[0.0099]
0.0641
[0.0620]
0.0872
[0.0514]*
0.0746
[0.0622]
N 169 169 199 166 97 97 111 94 85 86 96 84
Adjusted R2 0.12 0.11 0.27 0.02 0.07 0.30 0.21 �0.02 0.12 0.26 0.21 �0.01
Legal/inst. variable: LAO (Law and Order)
Other type of financial
development (t�5)+/� 0.0039
[0.0064]
0.0329
[0.0291]
�0.0023[0.0339]
0.0136
[0.0309]
�0.0008
[0.0064]
0.142
[0.0640]**
0.1023
[0.0499]**
0.0484
[0.0548]
0.0076
[0.0085]
0.0988
[0.0708]
0.0925
[0.0562]*
0.0332
[0.0720]
N 169 169 199 166 97 97 111 94 85 86 96 84
Adjusted R2 0.11 0.12 0.27 0.01 0.08 0.29 0.17 �0.04 0.12 0.23 0.16 �0.02
Legal/inst. variable: BQ (Bureaucracy Quality)
Other type of financial
development (t�5)+/� 0.0026
[0.0066]
0.0269
[0.0288]
�0.0050[0.0337]
0.0102
[0.0317]
�0.0025
[0.0070]
0.1292
[0.0615]**
0.0982
[0.0532]*
0.0397
[0.0582]
0.0032
[0.0103]
0.0776
[0.0607]
0.0684
[0.0572]
0.0238
[0.0702]
N 169 169 199 166 97 97 111 94 85 86 96 84
Adjusted R2 0.12 0.10 0.26 0.01 0.06 0.25 0.21 �0.02 0.08 0.17 0.19 0.01
Point estimates from OLS, heteroskedasticity robust standard errors in parentheses. Dependent variable is the average annual growth rate over a 5-year period. Financial openness is measured by the
Chinn–Ito index (KAOPEN). Regressions include fixed time effects (estimates not reported). Observations of inflation rates in excess of 100% are dropped from the sample. *, **, and *** indicate
marginal significance at the 10%, 5%, and 1% level.
M.D.Chinn,H.Ito
/JournalofDevelo
pmentEconomics
81(2006)163–192
185
Table 6
Relationship between different types of financial development (controlled for LEGAL1,Corruption, Law and order, and Bureaucracy quality) FULL, LDC, and EMG: 5-year panels, 1980–2000
Pred
sign
FULL LDC EMG
Private
credit
Stock
market
capitalization
Stock
market
total value
Stock
market
turnover
Private
credit
Stock
market
capitalization
Stock
market
total value
Stock
market
turnover
Private
credit
Stock
market
capitalization
Stock
market
total value
Stock
market
turnover
[1] [2] [3] [4] [5] [6] [7] [8] [9] [10] [11] [12]
Legal/inst. variable: LEGAL1 (General level of legal/institutional development)
Other type of financial
development (t |t�5)+/� 0.0410
[0.0504]
0.1769
[0.2149]
0.0443
[0.1745]
�0.1059[0.2432]
0.0910
[0.0402]**
0.7073
[0.2446]***
0.5069
[0.3314]12%�0.1026[0.6457]
0.0609
[0.0440]
0.4044
[0.2111]*
0.3362
[0.3061]
�0.2559[0.7226]
N 165 165 195 162 93 93 107 90 84 84 94 82
Adjusted R2 0.12 0.10 0.27 0.02 0.13 0.24 0.18 �0.03 0.17 0.2 0.18 �0.01
Legal/inst. variable: Corrupt (Corruption)
Other type of financial
development (t |t�5)+/� 0.0385
[0.0502]
0.1614
[0.2186]
0.0403
[0.1758]
�0.0887[0.2468]
0.0893
[0.0405]**
0.6745
[0.2572]**
0.4858
[0.3346]
�0.1425[0.6512]
0.0559
[0.0453]
0.3538
[0.2225]12%0.3605
[0.3242]
�0.0175[0.6922]
N 165 165 195 162 93 93 107 90 84 84 94 82
Adjusted R2 0.13 0.10 0.27 0.02 0.12 0.26 0.17 �0.03 0.14 0.24 0.18 �0.02
Legal/inst. variable: LAO (Law and Order)
Other type of financial
development (t |t�5)+/� 0.0403
[0.0499]
0.1701
[0.2135]
0.0394
[0.1743]
�0.1102[0.2397]
0.0934
[0.0411]**
0.7617
[0.2352]***
0.5088
[0.3244]12%�0.0498[0.5951]
0.0630
[0.0443]
0.4332
[0.2055]**
0.4339
[0.3160]
�0.1560[0.7124]
N 165 165 195 162 93 93 107 90 84 84 94 82
Adjusted R2 0.12 0.11 0.27 0.01 0.14 0.25 0.13 �0.04 0.15 0.20 0.14 �0.03
Legal/inst. variable: BQ (Bureaucracy Quality)
Other type of financial development
(t |t�5)+/� 0.0427
[0.0501]
0.1862
[0.2133]
0.0525
[0.1724]
�0.1068[0.2384]
0.0872
[0.0414]**
0.7163
[0.2353]***
0.4693
[0.3267]
�0.1257[0.6790]
0.0856
[0.0515]*
0.5783
[0.1907]***
0.4021
[0.2379]*
�0.1157[0.5846]
N 165 165 195 162 93 93 107 90 84 84 94 82
Adjusted R2 0.12 0.09 0.26 0.01 0.12 0.22 0.18 �0.03 0.12 0.18 0.18 0.01
Point estimates from OLS, heteroskedasticity robust standard errors in parentheses. Dependent variable is the average annual growth rate over a 5-year period. Financial openness is measured by the
Chinn–Ito index (KAOPEN). Regressions include fixed time effects (estimates not reported). Observations of inflation rates in excess of 100% are dropped from the sample. *, **, and *** indicate
marginal significance at the 10%, 5%, and 1% level.
M.D.Chinn,H.Ito
/JournalofDevelo
pmentEconomics
81(2006)163–192
186

M.D. Chinn, H. Ito / Journal of Development Economics 81 (2006) 163–192 187
banking development in both the full sample and the subsamples, the coefficient for PCGDPt�5is always significantly positive in the models with SMKC and SMTV for the LDC subsample
with all the legal/institutional variables. These results suggest that banking development is an
important precondition for the development in equity markets among less developed countries,
while, as expected, the development in equity markets does not seem to be a precondition for
banking development in any countries.
4.2. Complements or substitutes?
We now investigate the question of whether banking and equity markets are complements or
substitutes. To do so, we make only one modification to the previous empirical model. Instead of
the initial level of a different type of financial development, we include a new variable (OtherFDti�
OtherFDt�5i ) which is the 5-year average growth of financial development in another sector.
FDit � FDi
t�5 ¼ c0 þ qFDit�5 þ c1KAOPEN
it�5 þ c2L
i þ c3 Li � KAOPENit�5
� �
þ s0 OtherFDit � OtherFDi
t�5� �
þ X it�5Cþ eit ð5Þ
As in the previous analysis, the regressions on equity market development includes the 5-year
average growth of PCGDP as (OtherFDti�OtherFDt�5
i) and those with PCGDP includes the 5-
year average growth of SMKC. The estimator of our focus is now s0; a significantly positive
(negative) coefficient estimate indicates that developments in equity and banking sectors are
complements (substitutes).
Table 6 displays the estimated coefficients for (OtherFDti�OtherFDt�5
i). Interestingly, in the
LDC group with all the legal/institutional variables, both (PCGDPti�PCGDPt�5
i) in the SMKC
model and (SMKCti�SMKCt�5
i) in the PCGDP model are significantly positive. This means that
for the group of less developed countries, the development in banking sector and that in equity
markets are complementary to each other. Given the results in the previous section, while less
developed countries may well be able to develop their financial markets by opening capital
account if it is equipped with a reasonable level of legal/institutional development, banking
development and equity market development seem to have synergistic effects.
5. Concluding remarks
We began our empirical investigation by examining the nexus between capital account
liberalization and financial development. Our key empirical results suggest that financial
openness does contribute to equity market development, but only when a threshold level of
general development of legal systems and institutions has been attained. Financial development–
measured as activity of the stock market–appears to depend upon capital account openness both
individually and in interaction with the level of legal development.33
Interestingly, finance-specific legal institutions do not seem to fulfill the same role. Hence, we
conclude that the general level of legal development matters more than the level of finance-
specific legal/institutional development. These results are robust to the presence of outliers in the
data and simultaneity.
33 This finding is in part consistent with Klein’s (2005) finding that the impact of capital account liberalization on
economic growth is not monotonic, and depends upon the level of institutional quality. However, he demonstrates that the
relationship between institutional quality and the responsiveness of economic growth to capital account liberalization is
inverted-U shaped; countries with better (but not the best) institutions exhibit a statistically significant effect of capita
account openness on economic growth.
l
M.D. Chinn, H. Ito / Journal of Development Economics 81 (2006) 163–192188
We also obtain a series of other results. First, we find that the opening of goods markets is a
precondition for financial opening. When the financial openness variable is instrumented with
trade openness, the contribution of the general level of legal development still remains
significant. This finding could be interpreted as evidence that an increase in trade openness is a
prolog to financial openness, and thence to financial development.
Second, using a specification that controls for the level of legal and institutional development,
we show that the development in the banking sector is a precondition for the development in
equity markets. Finally, developments in less developed country banking and equity markets
have interactive effects working in both directions.
Country list (108 countries)
1 612 DZA Algeria
2 213 ARG Argentinae
3 193 AUS Australiai
4 122 AUT Austriai
5 313 BHS Bahamas, The
6 419 BHR Bahrain, Kingdom ofe
7 513 BGD Bangladeshe
8 316 BRB Barbados
9 124 BEL Belgiumi
10 339 BLZ Belize
11 638 BEN Benin
12 218 BOL Bolivia
13 616 BWA Botswanae
14 223 BRA Brazile
15 748 BFA Burkina Faso
16 618 BDI Burundi
17 622 CMR Cameroon
18 156 CAN Canadai
19 626 CAF Central African Rep.
20 628 TCD Chad
21 228 CHL Chilee
22 924 CHN Chinae
23 233 COL Colombiae
24 634 COG Congo, Republic of
25 238 CRI Costa Rica
26 662 CIV Cote d’Ivoiree
27 423 CYP Cyprus
28 128 DNK Denmarki
29 243 DOM Dominican Republic
30 248 ECU Ecuadore
31 469 EGY Egypte
32 253 SLV El Salvador
33 819 FJI Fiji
34 172 FIN Finlandi
35 132 FRA Francei
36 646 GAB Gabon
37 648 GMB Gambia, The
38 134 DEU Germanyi
39 652 GHA Ghanae
40 174 GRC Greecei, e
41 258 GTM Guatemala
42 263 HTI Haiti

43 268 HND Honduras
44 532 HKG Hong Konge
45 176 ISL Icelandi
46 534 IND Indiae
47 536 IDN Indonesiae
48 429 IRN Iran, Islamic Rep. of
49 178 IRL Irelandi
50 436 ISR Israele
51 136 ITA Italyi
52 343 JAM Jamaicae
53 158 JPN Japani
54 439 JOR Jordane
55 664 KEN Kenyae
56 542 KOR Koreae
57 443 KWT Kuwait
58 666 LSO Lesotho
59 674 MDG Madagascar
60 676 MWI Malawi
61 548 MYS Malaysiae
62 678 MLI Mali
63 181 MLT Malta
64 682 MRT Mauritania
65 684 MUS Mauritiuse
66 273 MEX Mexicoe
67 686 MAR Moroccoe
68 558 NPL Nepal
69 138 NLD Netherlandsi
70 196 NZL New Zealandi
71 278 NIC Nicaragua
72 692 NER Niger
73 694 NGA Nigeriae
74 142 NOR Norwayi
75 449 OMN Omane
76 564 PAK Pakistane
77 283 PAN Panama
78 853 PNG Papua New Guinea
79 288 PRY Paraguay
80 293 PER Perue
81 566 PHL Philippinese
82 182 PRT Portugali, e
83 714 RWA Rwanda
84 456 SAU Saudi Arabiae
85 722 SEN Senegal
86 718 SYC Seychelles
87 724 SLE Sierra Leone
88 576 SGP Singaporee
89 199 ZAF South Africae
90 184 ESP Spaini
91 524 LKA Sri Lankae
92 734 SWZ Swaziland
93 144 SWE Swedeni
94 146 CHE Switzerlandi
95 463 SYR Syrian Arab Republic
96 738 TZA Tanzania
97 578 THA Thailande
98 742 TGO Togo
M.D. Chinn, H. Ito / Journal of Development Economics 81 (2006) 163–192 189
99 369 TTO Trinidad and Tobagoe
100 744 TUN Tunisiae
101 186 TUR Turkeye
102 746 UGA Uganda
103 112 GBR United Kingdomi
104 111 USA United Statesi
105 298 URY Uruguay
106 299 VEN Venezuela, Rep. Bol.e
107 754 ZMB Zambia
108 698 ZWE Zimbabwee
i–industrialized countries (IDC), 22 countries.
e–emerging market countries (EMG),
31 countries (Standard and Poor (2000)).
M.D. Chinn, H. Ito / Journal of Development Economics 81 (2006) 163–192190
Acknowledgements
Helpful comments were received from the co-editor Carlos Vegh, an anonymous referee,
Joshua Aizenman, Michael Hutchison, Carl Walsh, Frank Warnock, Tom Willett, participants at
the Kennedy School Luncheon on International Economic Policy, the UCSC brown bag, and the
USC development seminar. We also thank Ashok Mody, Antu Panini Murshid, and Dennis
Quinn for providing data. The financial support of faculty research funds of UC Santa Cruz is
gratefully acknowledged.
References
Aizenman, J., 2002. Financial opening: evidence and policy options. National Bureau of Economic Research Working
Paper Series No. 8900, 1–27.
Aizenman, J., Noy, I., 2004. Endogenous financial openness: efficiency and political economy considerations.
Manuscript, University of California, Santa Cruz.
Arteta, C., Eichengreen, B.J., Wyplosz, C., 2001. When does capital account liberalization help more than it hurts?
National Bureau of Economic Research, Working Paper Series No. 8414.
Beck, T., Levine, R., 2004. Legal institutions and financial development. In: Claude, Menard, Shirley, M. (Eds.),
Handbook of New Institutional Economics. Kluwer Dordrecht, The Netherlands.
Beck, T., Demirguc-Kunt, A., Levine, R., 2000. A new database on the structure and development of the financial sector.
Policy Research Paper, vol. 2147. World Bank, Washington, DC.
Beim, D.O., Calomiris, C.W., 2001. Emerging Financial Markets. McGraw-Hill, New York.
Bekaert, G., Harvey, C.R., Lundblad, C., 2000. Emerging equity markets and economic development. National Bureau of
Economic Research Working Paper Series No. 7763.
Bekaert, G., Harvey, C.R., Lundblad, C., 2001. Does financial liberalization spur growth? National Bureau of Economic
Research Working Paper No. 8245.
Brown, S.J., Goetzmann, W.N., 2001. Hedge funds with style. Yale ICF Working Paper No. 00-29, 1–33.
Brown, S.J., Goetzmann, W.N., Parks, J.M., 1998. Hedge funds and the Asian currency crisis of 1997. Yale School of
Management. Working Paper No. F-58.
Caprio, G., Laeven, L., Levine, R., 2004. Governance and bank valuation. Mimeo. University of Minnesota.
Chinn, M.D., Ito, H., 2002. Capital account liberalization, institutions and financial development: cross country evidence.
National Bureau of Economic Research Working Paper Series No. 8967.
Chinn, M.D., Dooley, M.P., Shrestha, S., 1999. Latin America and East Asia in the context of an insurance model of
currency crises. Journal of International Money and Finance 18, 659–681.
Claessens, S., Demirguc-Kunt, A., Huizinga, H., 2001. How does foreign entry affect domestic banking markets? Journal
of Banking and Finance 25, 891–911.
Claessens, S., Djanky, S., Fan, J., Lang, L., 2002a. Expropriation of minority shareholders in East Asia. Journal of
Finance 57.
Claessens, S., Klingebiel, D., Schmukler, S.L., 2002b. Explaining the migration of stocks from exchanges in emerging
economies to international canters. Policy Research Working Paper Series No. 2816.
M.D. Chinn, H. Ito / Journal of Development Economics 81 (2006) 163–192 191
Corsetti, G., Pesenti, P., Roubini, N., 1998. Paper tigers? A preliminary assessment of the Asian crisis. National Bureau
of Economic Research Working Paper Series No. 6783.
De Gregorio, J., 1998. Financial integration, financial development and economic growth. Mimeo. Department of
Industrial Engineering, Universidad de Chile.
Dooley, M.P., 1996. A survey of literature on controls over international capital transactions. Staff Papers-International
Monetary Fund 43, 639–687.
Edison, H.J., Warnock, F.E., 2001. A simple measure of the intensity of capital controls. International finance discussion
paper No.708.
Edison, H.J., Klein, M.W., Ricci, L.A., Sløk, T., 2002. Capital account liberalization and economic performance: a review
of the Literature. Mimeo. International Monetary Fund, Washington, DC.
Edwards, S., 1999. How effective are capital controls? Journal of Economic Perspectives 13, 65–84.
Edwards, S., 2001. Capital mobility and economic performance: are emerging economies different? National Bureau of
Economic Research Working Paper Series No. 8076.
Eichengreen, B., 2002. Capital account liberalization: what do the cross-country studies tell us? World Bank Economic
Review 15 (3), 341–365.
Fung, W., Hseih, D.A., 2001. The risk in hedge fund strategies: theory and evidence from trend followers. Review of
Financial Studies 14, 313–341.
Glick, R., Guo, X., Hutchison, M.M., 2004. Currency crises, capital account liberalization, and selection bias. Santa Cruz
Center for International Economics Working Paper No. 04-14.
Grilli, V., Milesi-Ferretti, G.M., 1995. Economic effects and structural determinants of capital controls. Staff Papers-
International Monetary Fund 42 (3), 517–551.
Henry, P.B., 2000. Stock market liberalization, economic reform, and emerging market equity prices. Journal of Finance
55 (2), 529–564.
International Monetary Fund, 2001. World Economic Outlook. International Monetary Fund, Washington, DC.
Ito, H., 2004. Is financial openness a bad thing? An analysis on the correlation between financial liberalization and the
output performance of crisis-hit economies. Santa Cruz Center for International Economics Working Paper Series
No. 04-23.
Johnson, S., McMillan, J., Woodruff, C., 2002. Property rights and finance. American Economic Review 92, 1335–1356.
Johnston, R.B., Tamirisa, N.T., 1998. Why do countries use capital controls? IMF Working Paper WP/98/181.
Kaminsky, G.L., 2003. Varieties of currency crises. National Bureau of Economic Research Working Paper Series No.
10193.
Kaminsky, G.L., Schmukler, S.L., 2001a. Short- or long-run integration: do capital controls matter? Brookings Trade
Forum 2000. Brookings Institution, Washington, DC, pp. 125–178.
Kaminsky, G.L., Schmukler, S.L., 2001b. On booms and crashes: financial liberalization and stock market cycles.
Unpublished manuscript. World Bank, Washington, DC.
Kaminsky, G.L., Schmukler, S.L., 2002. Short-run pain, long-run gain: the effects of financial liberalization. World Bank
Working Paper No. 2912.
Kaminsky, G.L., Lizondo, J.S., Reinhart, C.M., 1998. Leading indicators of currency crises. IMF Staff Papers 45,
1–48.
Karolyi, G.A., 2004. The role of American depositary receipts in the development of emerging equity markets. Review of
Economics and Statistics 86 (3), 670–690.
Kim, W., Wei, S.J., 2002. Offshore investment funds: monsters in emerging markets. Journal of Development Economics
848.
Klein, M.W., 2005. Capital account liberalization, institutional quality and economic growth: theory and evidence.
National Bureau of Economic Research Working Paper Series No. 11112.
Klein, M., Olivei, G., 2001. Capital account liberalization, financial depth, and economic growth. Mimeo. Tufts
University, Medford, MA.
Kletzer, K., Mody, A., 2000. Will self-protection policies safeguard emerging markets from crises? In: Adams, C., Litan,
R.E., Pomerleano, M. (Eds.), Managing Financial and Corporate Distress: Lessons from Asia. Brookings Institution,
Washington, DC.
La Porta, R., Lopez-de-Silanes, F., Shleifer, A., Vishny, R.W., 1997. Legal determinants of external finance. Journal of
Finance 52, 1131–1150.
La Porta, R., Lopez-de-Silanes, F., Shleifer, A., Vishny, R.W., 1998. Law and finance. Journal of Political Economy 106,
1133–1155.
Leahy, M., Schich, S., Wehinger, G., Pelgrin, F., Thorgeirsson, T., 2001. Contributions of financial systems to growth in
OECD countries. OECD Economic Department Working Papers No. 280.

M.D. Chinn, H. Ito / Journal of Development Economics 81 (2006) 163–192192
Leblang, D.A., 1997. Domestic and systematic determinants of capital controls in the developed and developing world.
International Studies Quarterly 41, 435–454.
Levine, R., 1998. Stock markets, banks, and economic growth. American Economic Review 88, 537–558.
Levine, R., 2002. Bank-based or market-based financial systems: which is better? Journal of Financial Intermediation 11,
398–428.
Levine, R., Schmukler, S.L., 2003. Migration, spillovers, and trade diversion: the impact of internalization on stock
market liquidity. University of Minnesota Working Paper.
Levine, R., Loayza, N., Beck, T., 2000. Financial intermediation and growth: causality and causes. Journal of Monetary
Economics 46, 31–77.
Martell, R., Stulz, R.M., 2003. Equity market liberalizations as country IPOs. National Bureau of Economic Research
Working Paper Series No. 9481.
McKinnon, R.I., 1973. Money and Capital in Economic Development. Brookings Institution, Washington, DC.
McKinnon, R.I., 1991. The Order of Economic Liberalization: Financial Control in the Transition to a Market Economy.
Johns Hopkins University Press, Baltimore.
Miniane, J., 2004. A new set of measures on capital account restrictions. IMF Staff Papers 51 (2).
Mody, A., Murshid, A.P., 2005. Growing up with capital flows. Journal of International Economics 65, 249–266.
Neely, C.J., 1999. An introduction to capital controls. Review, Federal Reserve Bank of St. Louis, November/December.
Quinn, D., 1997. The correlates of change in international financial regulation. American Political Science Review 91 (3),
531–551.
Quinn, D., Toyoda, A.M., Inclan, C., 2002. Does capital account liberalization lead to economic growth? An empirical
investigation. Mimeo. Georgetown University, Washington, DC.
Rajan, K.S., 2003. Financial integration in ASEAN and beyond: implications for regional monetary integration. ASEAN
Roundtable 2003: Roadmap to an ASEAN Economic Community. Institute of Southeast Asian Studies, Singapore.
Rajan, R., Zingales, L., 2003. The great reversals: the politics of financial development in the twentieth century. Journal
of Financial Economics 69.
Sachs, J.D., Tornell, A., Velasco, A., 1996. Financial crises in emerging markets: the lessons from 1995. National Bureau
of Economic Research Working Paper Series No. 5576.
Sarkissian, S.A., Schill, M.J., 2002. The overseas listing decision: new evidence of proximity preference. McGill
University Working Paper.
Schmukler, S., 2003. Financial globalization: gains and pain for developing countries. World Bank, Washington, DC.
Shaw, E.S., 1973. Financial Deepening in Economic Development. Oxford University Press, New York.
Spiegel, M., 2001. Financial development and growth: Are the APEC nations unique? Federal Reserve Bank of San
Francisco. Pacific Basin Working Papers PB01-04.
Stiglitz, J.E., 2000. Capital market liberalization, economic growth, and instability. World Development 28, 1075–1086.
Stultz, R., 1999. Globalization, corporate finance and the cost of capital. Journal of Applied Corporate Finance 12 (3),
8–25.
Tornell, A., Westermann, F., Martinez, L., 2004. The positive link between financial liberalization, growth and crises.
National Bureau of Economic Research Working Paper Series No. 10293.