Embed Size (px)
Citation preview

The Trilemma, International Currencies, Capital Controls and Financial Development
Menzie D. ChinnUniversity of Wisconsin, Madison
and NBER
Central German Doctoral Program Economics
Leipzig UniversitätDecember 17-22, 2015Rev 21.12.2015 18:30

2
Outline of Week
1. Trilemma2. Trilemma vs. Dilemma/Capital Controls3. Capital Controls/Financial
Development/Int’l Currencies4. International Currencies

The Next Reserve Currencies

Roles of an International Currency
Table 1:
Function of money Governments Private actors
Store of value International reserve holdings Currency substitution (private dollarization)
Medium of exchange Vehicle currency for foreign exchange intervention
Invoicing trade and financial transactions
Unit of account Anchor for pegging local currency
Denominating trade and financial transactions
Source: Kenen (1983)

Reserve Holdings, Homogeneous data
5
.0
.1
.2
.3
.4
.5
.6
.7
.8
1965 1970 1975 1980 1985 1990 1995 2000
USD
DEM EUR
JPYFFR SFRNLG
ECU
GBP

Reserve Holdings, Old + COFER
6

Determinants, again
(1)The pattern of output and trade.
(2)Financial markets (3)Confidence in the currency (4)Network externalities
7

Key Estimates, using Logit
8

Antecedents for Lower Tier Switches: UK and Germany
9

GDP
10

Geography of FX Trading(Proxy for Financial Development)
11

Financial Development
12

Financial Development
13

Financial Development
14

Institutional Development
15

Financial Openness (Chinn-Ito)
16
The RMB’s Prospects
RMB bonds and deposits in Hong Kong are small as a fraction of total RMB bonds and deposits (and of course Hong Kong is in any case part of China).
Development of China’s domestic financial market has just begun.
It is still very highly regulated, and the domestic system is “financially repressed.”
Cross-border capital flows are subject to heavy controls. Foreign companies still cannot borrow in mainland China.
- Frankel (2011)17

Eichengreen, Chitu, Mehl
18

Benefits
Seigniorage Lower government and private
borrowing costs Other nonpecuniary benefits
(prestige)
19

Costs Some countries might peg their currency
against the new reserve currency , mitigating the use of the own currency as macroeconomic shock absorber
Greater financial integration will make external shocks more easily transmitted to the reserve currency economy, above and beyond that associated with open capital markets.
Private investor shifts in and out of the reserve currency will force monetary authorities to respond to larger shocks in money demand.
20

Other Aspects of New International Currencies

Roles of an International Currency
Table 1:
Function of money Governments Private actors
Store of value International reserve holdings Currency substitution (private dollarization)
Medium of exchange Vehicle currency for foreign exchange intervention
Invoicing trade and financial transactions
Unit of account Anchor for pegging local currency
Denominating trade and financial transactions
Source: Kenen (1983)

0
4
8
12
16
20
24
1998 2000 2002 2004 2006 2008 2010 2012 2014
CNY
CHF
JPYShare offorex trading(out of 200%)
Source: BIS Triennial Survey (2013)
RMB in Foreign Exchange Trading

International Borrowing in own currency
24Source: Prasad (2015)

Payments in RMB
25Source: Prasad (2015)

Payments in RMB by location
26Source: Prasad (2015)

Trade Invoicing and RMB
Estimation of determinants Long tradition
27

Underused RMB?
United Kingdom
Austria
Belgium
Denmark
FranceItaly
Luxembourg
Netherlands
Norway SwedenFinland
GreeceIceland
IrelandPortugal
SpainAustralia
Cyprus
IndonesiaThailand
Slovak REstoniaLatvia
HungaryLithuania Slovenia
ChinaGermany
Japan
0.0
2.0
4.0
6.0
8.1
Exp
orts
sha
re in
the
wor
ld(%
), 20
07-1
1
0 .2 .4 .6 .8 1Share of exports invoicing in home currency (%), 2007-11

The Dollar Dominance
AUTBELDNK FRADEUITA NLD NORSWE FIN ISL
IRL
PRTESP CYP
IND
SVK ESTLVA HUNLTUSVNAustralia
IndoneThailandUnited KingdomEuro_Area
Japan
0.2
.4.6
.81
Exp
orts
to th
e U
nite
d S
tate
s(%
), 20
07-1
1
0 .2 .4 .6 .8 1Dollar share of export invoicing (%), 2007-11

Ito and Chinn (2015) Analyze the link between financial
liberalization and the potential path for RMB’s internationalization
Investigate how China’s liberalization efforts would affect the use of RMB invoicing
RMB’s becoming a major invoicing currency is not a sufficient condition for the RMB internationalization
But focus on this issue because:o Data are limitedo RMB’s becoming an invoicing currency is
an important first step

Three Questions1. What factors, including capital account
liberalization, affect the use of currencies in terms of invoicing in international trade?
2. How does the RMB’s recent experience differ from that of other currencies in terms of their use for invoicing exports?
3. How would foreseeable capital account liberalization China may implement affect the level of use of the RMB in international trade?

Empirical Analysis
Investigate the determinants of the use of three currencies, the U.S. dollar, the Euro, and the home country’s currency for export invoicing by using the dataset that encompasses 50 countries
Show the implied share of RMB based on the model estimation
Predict the (out-of-period) path of RMB shares for different scenarios of CA liberalization

Data on the Shares of Currencies in Trade Invoicing
The empirical literature on trade invoicing is thin, esp. in terms of the cross-country analysis, due to data limitations
Exceptions: Goldberg and Tille (2008) and Kamps (2006)
Augment the Kamps dataset by resorting to past and recent papers and gov’t reports on trade invoicing Expand the data coverage from 43
countries for 1990s through 2004 to 50 countries for 1970s through 2012
The dataset is probably the most comprehensive one
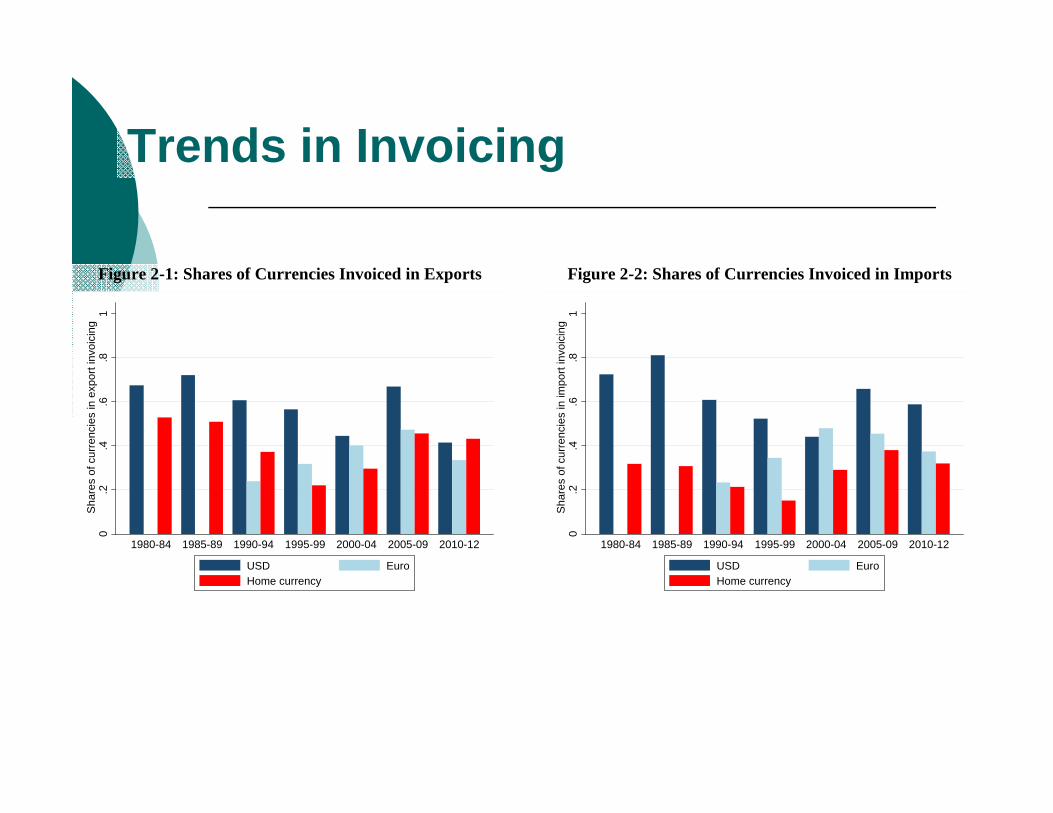
Trends in Invoicing
Figure 2-1: Shares of Currencies Invoiced in Exports
Figure 2-2: Shares of Currencies Invoiced in Imports
0.2
.4.6
.81
Sha
res
of c
urre
ncie
s in
exp
ort i
nvoi
cing
1980-84 1985-89 1990-94 1995-99 2000-04 2005-09 2010-12
USD EuroHome currency
0.2
.4.6
.81
Sha
res
of c
urre
ncie
s in
impo
rt in
voic
ing
1980-84 1985-89 1990-94 1995-99 2000-04 2005-09 2010-12
USD EuroHome currency

Trends in Invoicing - Groups
Figure 3-1: Shares of Currencies in Export Invoicing – EU Countries
Note: The countries in the EU subsample are: Austria, Belgium, Bulgaria, Cyprus, Czech Republic, Denmark, Estonia, Finland, France, Germany, Greece, Hungary, Iceland, Italy, Latvia, Lithuania, Luxembourg, Malta, Netherlands, Poland, Portugal, Romania, Slovak Republic, Slovenia, Spain, Sweden, and the United Kingdom.
Figure 3-2: Shares of Currencies Invoiced in Exports – ex-Japan Asian and Pacific Countries
Note: The countries in this subsample are: Australia, China, India, Indonesia, Korea, Malaysia, Pakistan, and Thailand.
0.2
.4.6
.81
Shar
es o
f cur
renc
ies
in e
xpor
t inv
oici
ng
1995-99 2000-04 2005-09 2010-12
USD EuroHome currency
0.2
.4.6
.81
Shar
es o
f cur
renc
ies
in e
xpor
t inv
oici
ng
1985-89 1990-94 1995-99 2000-04 2005-09 2010-12
USD EuroHome currency
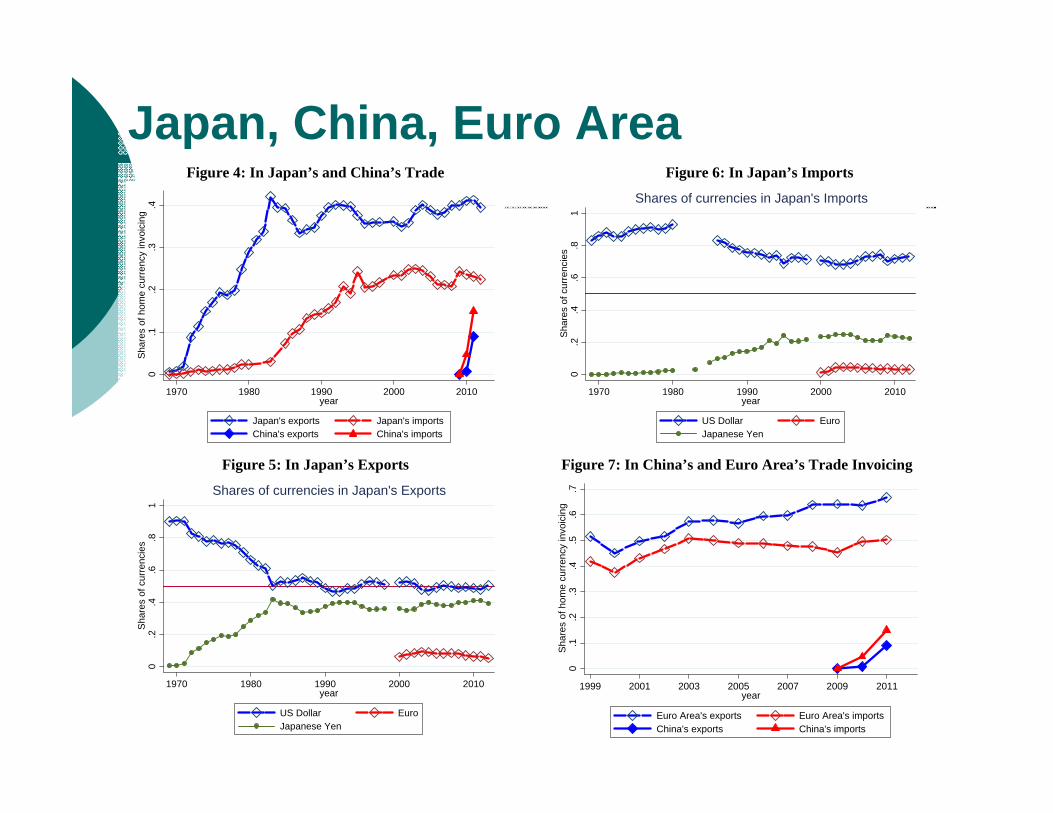
Japan, China, Euro AreaFigure 4: In Japan’s and China’s Trade
Figure 5: In Japan’s Exports
Figure 6: In Japan’s Imports
Figure 7: In China’s and Euro Area’s Trade Invoicing
0.1
.2.3
.4S
hare
s of
hom
e cu
rren
cy in
voic
ing
1970 1980 1990 2000 2010year
Japan's exports Japan's importsChina's exports China's imports
0.2
.4.6
.81
Sha
res
of c
urre
ncie
s
1970 1980 1990 2000 2010year
US Dollar EuroJapanese Yen
Shares of currencies in Japan's Exports
0.2
.4.6
.81
Sha
res
of c
urre
ncie
s
1970 1980 1990 2000 2010year
US Dollar EuroJapanese Yen
Shares of currencies in Japan's Imports
0.1
.2.3
.4.5
.6.7
Sha
res
of h
ome
curr
ency
invo
icin
g
1999 2001 2003 2005 2007 2009 2011year
Euro Area's exports Euro Area's importsChina's exports China's imports

Formal Empirical Analysis
Conduct panel data analysis to investigate the determinants of export invoicing
We use the augmented trade invoicing data that encompass 50 countries for 1970s through 2012 (though very unbalanced)
The model follows Kamps (2006)Cit
Cit
Cit
Cit
CEXit FLDX 1321

XCit Share of exports to the US or Euro area to total
exports, or to the world trade Commodity exports as a percentage of total
exports Relative income Exchange rate volatility and inflation
differentials Financial Development = Fin_Size = PCGDP x
Priv_sizeFLC
it = Financial openness, Chinn-Ito index (i.e., de jure index based on IMF’s AREAER)DC
it = Dummies for Monetary union and pegs to USD or Euro
Cit
Cit
Cit
Cit
CEXit FLDX 1321


Extended Analyses Tested w/ de facto measure of financial openness
using the Lane and Milesi-Ferretti data ??
Tested w/ post-1996 disaggregated AREAER data Capital market securities Money market instruments Collective investment securities Derivatives and other instruments Commercial credits Financial credits Guarantees, sureties, and financial backup facilities Direct investment Repatriation of profits or liquidation of direct investment Real estate transactions Personal capital movements Provisions specific to commercial banks and other credit institutions Provisions specific to institutional investors:

Extended Analyses When the average of 13
disaggregated categories is included ?? Significantly negative for both
USD and HOME eqs. When each of the disaggregated
categories is included: Significantly positive:
liquidation of direct investmentpersonal capital transactionsinstitutional investorscommercial credit

Extended Analyses What about the impact of legal
development? Use LEGAL = principal component of LAO, BQ, and CORRUPT
Insignificantly negative for the U.S. dollar share estimation, significantly negative for the Euro share estimation, and insignificantly positive for the home currency share estimation

Extended Analyses What about financial crisis? We include the dummy for
currency, banking, or debt crisis individually Countries that experience a banking crisis tend to
increase the share of the U.S. dollar for their export invoicing by 2.8 percentage points while they also tend to decrease the share of the Euro by 2.3 percentage points
The effect of banking crisis on the home currency share or that of other types of crises turn out to be insignificant
When including a dummy for the GFC Countries on average increase the share of dollar
invoicing by 4.1 percentage points, although the crisis does not affect other currency shares

Extended Analyses Do appreciation expectations of the home
currency lead to more use of the currency for export invoicing? We include in the time trend of the exchange rate Significantly positive for the U.S. dollar
share estimation = Appreciation trend of the home currency leads to less use of the USD for export invoicing

Extended Analyses Does net investment position matter? We
include the NIP variable based on the Lane and Milesi-Ferretti dataset Significantly positive for the home
currency share estimation = Countries with better net investment positions tend to be able to invoice their exports in their own currency
Endogeneity issues?: Countries with int’l currencies often turn into debtor countries

Methodological Robustness Checks
Tobit estimation Seemingly Unrelated Regression (SUR)
Estimation The estimates are mostly robust,
including the financial openness variable While financial development continues
to be a negative contributor to USD invoicing, it also becomes a significantly negative contributor to home currency invoicing

Predicted vs. Actual Currency Shares
(a) RMB in Chinese Exports
(c) USD in Japan’s Exports
(b) Japanese Yen in Japan’s Exports
(d) Euro Share in Euro Area’s Exports
0.1
.2.3
.4.5
.6.7
.8.9
1S
hare
of Y
uan
expo
rt in
voic
ing
2004 2005 2006 2007 2008 2009 2010years
Prediction Actual
0.1
.2.3
.4.5
.6.7
.8.9
1S
hare
of U
SD
exp
ort i
nvoi
cing
1970 1980 1990 2000 2010years
Prediction Actual
0.1
.2.3
.4.5
.6.7
.8.9
1S
hare
of Y
en e
xpor
t inv
oici
ng
1970 1980 1990 2000 2010years
Prediction Actual
.5.6
.7.8
.91
Sha
re o
f Eur
o in
exp
ort i
nvoi
cing
2000 2002 2004 2006 2008 2010years
Prediction Actual

Forecasting of the RMB Share in China’s Exports
0.0
5.1
.15
.2.2
5.3
.35
Sha
re o
f RM
B in
exp
ort i
nvoi
cing
2008 2010 2012 2014 2016 2018years
Optimistic Pessmistic Prediction Out-of-sample forecasting Actual
The baseline assumption: KAOPEN=0.35 for 2015 (c.f., the current level of 0.16), but not as high as the level of Brazil, Columbia, and Indonesia (0.41). 0.50 for 2018, more financially open than Turkey (0.45).
Under the pessimistic scenario: no change in KAOPEN in 2015 (i.e., 0.16). 0.25 In 2018
Under the optimistic scenario, 0.60 in 2015 and to 0.80 in 2018

Concluding Remarks The U.S. dollar still plays an important role as
the vehicle currency Asian countries in particular have relied heavily
on the U.S. dollar The share of the RMB use for trade
transactions has been rapidly rising Interestingly, the Chinese RMB has been more
used for import invoicing rather than for export invoicing
Countries with more developed financial markets tend to invoice less in the U.S. dollar
Countries with a more open capital account tend to invoice in either the Euro or their home currency

Concluding Remarks (Ito Chinn, 2015)
A currency with expected appreciation tends to be used for export invoicing
The use of the RMB in export invoicing should have been higher, around low to mid-20s as a percentage of total exports
The underperformance of the RMB export invoicing can be attributed to the inertia of the choice of currency for trade invoicing
The share of RMB invoicing for China’s exports may rise up to 27.5% in 2015 and 33.5% in 2018

Summing Up
On its present trajectory, China will have a nearly fully open capital account in the nextfew years, allowing the RMB to play an increasingly prominent role in global trade and finance. The RMB already plays a significant role in the denomination and settlement of international trade transactions that involve China. The RMB is also making inroads into the global financial system and is starting to appear in the reserve portfolios of certain emerging market central banks.
(Prasad, 2015)51

Roles of an International Currency
Table 1:
Function of money Governments Private actors
Store of value International reserve holdings Currency substitution (private dollarization)
Medium of exchange Vehicle currency for foreign exchange intervention
Invoicing trade and financial transactions
Unit of account Anchor for pegging local currency
Denominating trade and financial transactions
Source: Kenen (1983)

RMB as Anchor Currency
Do other currencies peg or manage against the RMB instead of USD or EUR?
53

RMB as Anchor (I)
-.20
-.15
-.10
-.05
.00
.05
.10
.15
2006 2007 2008
China Malaysia
Singapore
Taiwan
Thailand
Log SDRexchange rates,2005M06=0
Indonesia
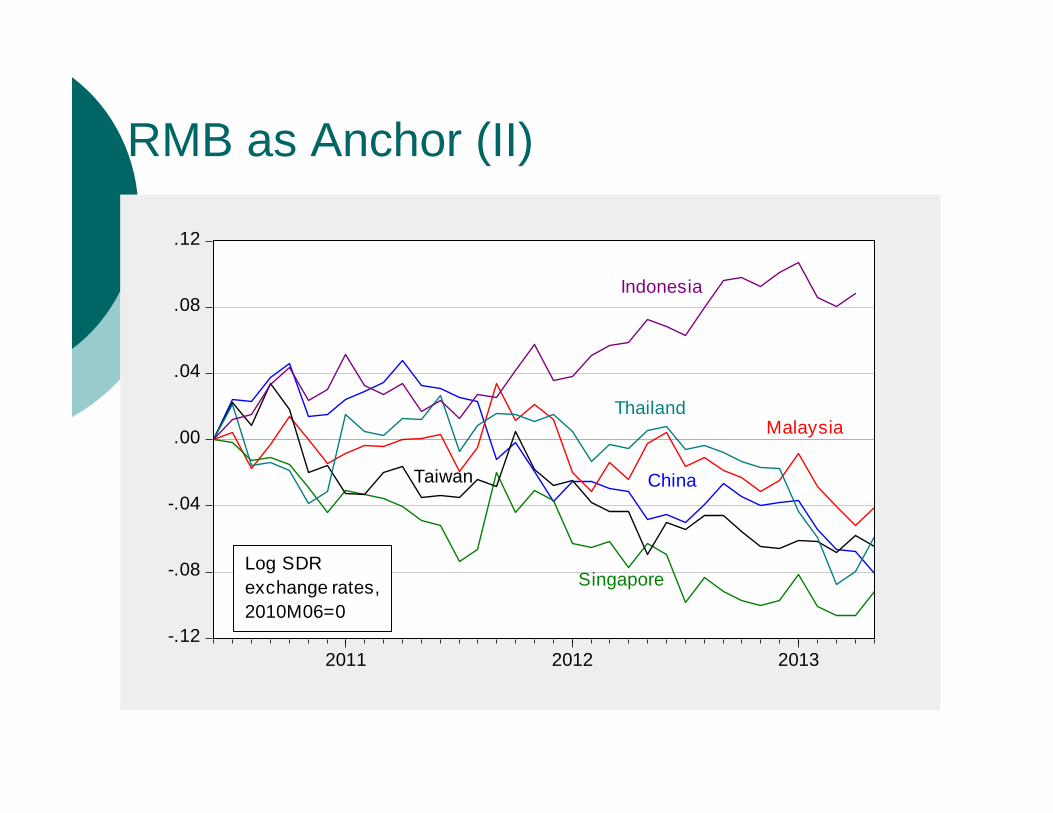
RMB as Anchor (II)
-.12
-.08
-.04
.00
.04
.08
.12
2011 2012 2013
China
Malaysia
Singapore
Taiwan
Thailand
Log SDRexchange rates,2010M06=0
Indonesia

Exchange Rate Factors
Formalize using Frankel-Wei approach to infer weights

Exchange Rate Factors & Long Run
Need a specification allows for both short and long run dynamics
Estimated with monthly data Allows for the effects of financial stress

Source: Chinn (2015)

The RMB Zone: Findings
In the pre-2005 period, little evidence of long run relationships between CNY, USD, JPY and respective currencies
Post-2005, there is greater evidence of cointegration
And more anchoring on the CNY Exception: KRW