Embed Size (px)
Citation preview

Applied Quantitative Analysis and Practices
LECTURE#20
By
Dr. Osman Sadiq Paracha

Previous Lecture Summary Rules of Thumb for Factor models and no of
factors Processes of Factor interpretation Rotation of factors Orthogonal Rotation Methods Significance of Factor Loadings Interpreting the factors Deriving Factor matrix

Rules of Thumb
Choosing Factor Models and Number of Factors• Although both component and common factor analysis models yield similar
results in common research settings (30 or more variables or communalities of .60 for most variables):
the component analysis model is most appropriate when data reduction is paramount.
the common factor model is best in well-specified theoretical applications.• Any decision on the number of factors to be retained should be based on several
considerations: use of several stopping criteria to determine the initial number of factors to
retain. Factors With Eigenvalues greater than 1.0. A pre-determined number of factors based on research objectives and/or
prior research. Enough factors to meet a specified percentage of variance explained, usually
60% or higher. Factors shown by the scree test to have substantial amounts of common
variance (i.e., factors before inflection point). More factors when there is heterogeneity among sample subgroups.
• Consideration of several alternative solutions (one more and one less factor than the initial solution) to ensure the best structure is identified.

Processes of Factor Interpretation
• Estimate the Factor Matrix• Factor Rotation• Factor Interpretation• Respecification of factor model, if needed, may
involve . . .o Deletion of variables from analysiso Desire to use a different rotational approacho Need to extract a different number of factorso Desire to change method of extraction

Rotation of Factors
Factor rotation = the reference axes of the factors are turned about the origin until some other position has been reached. Since unrotated factor solutions extract factors based on how much variance they account for, with each subsequent factor accounting for less variance. The ultimate effect of rotating the factor matrix is to redistribute the variance from earlier factors to later ones to achieve a simpler, theoretically more meaningful factor pattern.

Two Rotational Approaches
1. Orthogonal = axes are maintained at 90 degrees.
2. Oblique = axes are not maintained at 90 degrees.

Orthogonal Factor RotationUnrotated Factor
II
Unrotated Factor I
Rotated Factor I
Rotated Factor II
-1.0 -.50 0
+.50 +1.0
-.50
-1.0
+1.0
+.50
V1
V2
V3V4
V5

Unrotated Factor II
Unrotated Factor
IOblique Rotatio
n: Factor I
Orthogonal Rotation: Factor
II
-1.0 -.50 0
+.50 +1.0
-.50
-1.0
+1.0
+.50
V1
V2
V3V4
V5
Orthogonal Rotation: Factor I
Oblique Rotation: Factor II
Oblique Factor Rotation

Orthogonal Rotation Methods
• Quartimax (simplify rows)
• Varimax (simplify columns)
• Equimax (combination)

Rules of Thumb
Choosing Factor Rotation Methods
• Orthogonal rotation methods . . .
o are the most widely used rotational methods.
o are The preferred method when the research goal is data reduction to either a smaller number of variables or a set of uncorrelated measures for subsequent use in other multivariate techniques.
• Oblique rotation methods . . .
o best suited to the goal of obtaining several theoretically meaningful factors or constructs because, realistically, very few constructs in the “real world” are uncorrelated.
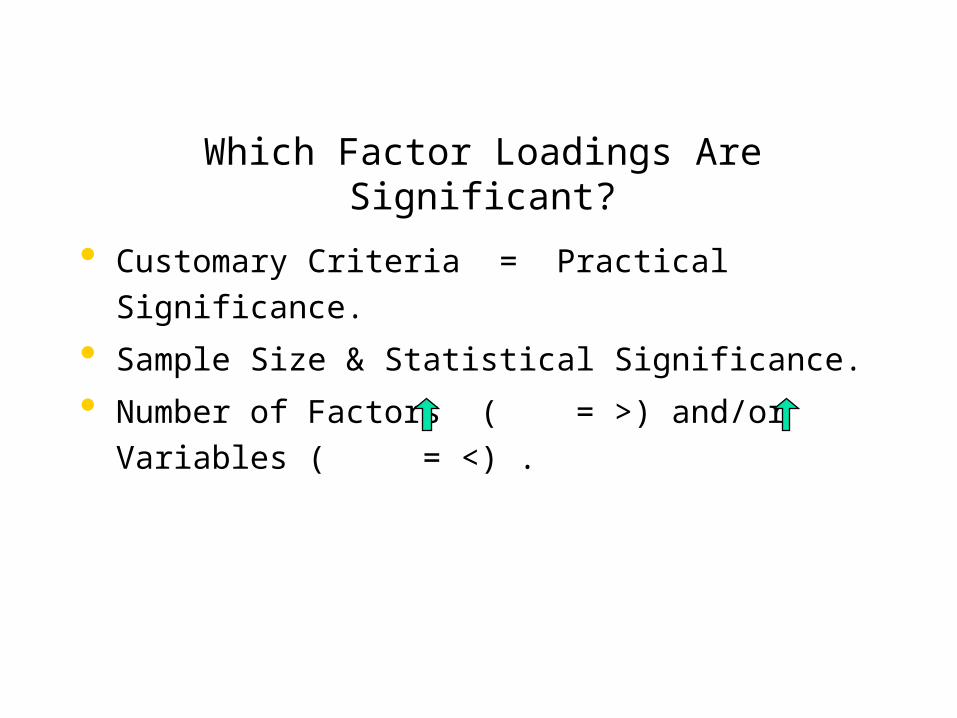
Which Factor Loadings Are Significant?
• Customary Criteria = Practical Significance.
• Sample Size & Statistical Significance.
• Number of Factors ( = >) and/or Variables ( = <) .

Guidelines for Identifying Significant Factor Loadings Based on Sample Size
Factor Loading Sample Size Needed for Significance*
.30 350
.35 250
.40 200
.45 150
.50 120
.55 100
.60 85
.65 70
.70 60
.75 50*Significance is based on a .05 significance level (a), a power level of 80 percent, and standard errors assumed to be twice those of conventional correlation coefficients.

Stage 5: Interpreting the Factors
• Selecting the factor extraction method
– common vs. component analysis.
• Determining the number of factors to
represent the data.

Interpreting a Factor Matrix:
1. Examine the factor matrix of loadings.
2. Identify the highest loading across all factors for each variable.
3. Assess communalities of the variables.
4. Label the factors.

Rules of Thumb
Interpreting The Factors
· An optimal structure exists when all variables have high loadings only on a single factor.
· Variables that cross-load (load highly on two or more factors) are usually deleted unless theoretically justified or the objective is strictly data reduction.
· Variables should generally have communalities of greater than .50 to be retained in the analysis.
· Re-specification of a factor analysis can include options such as:
o deleting a variable(s),
o changing rotation methods, and/or
o increasing or decreasing the number of factors.

Interpreting a Factor Matrix:
1. Examine the factor matrix of loadings.
2. Identify the highest loading across all factors for each variable.
3. Assess communalities of the variables.
4. Label the factors.

Lecture Summary Application in SPSS for below mentioned
concepts Rules of Thumb for Factor models and no of
factors Processes of Factor interpretation Rotation of factors Orthogonal Rotation Methods Significance of Factor Loadings Interpreting the factors Deriving Factor matrix