Embed Size (px)
Citation preview
1Northern Suburbs Transit Corridor | Preferred Mass Transit Study
Appendices
Appendix CTransport Modelling Technical Report

2Northern Suburbs Transit Corridor | Preferred Mass Transit Study
The forecasts has been produced using the Greater Hobart Urban Travel Demand Model (GHUTDM) and data as supplied by the Department of State Growth, and, from other sources identified in this report. PwC has not verified or audited the information provided to us and we make no representation as to its accuracy.
It is also important to appreciate that Traffic and Transport Models and Forecasts are not a precise science and are only an indication of what might happen in the future, and may not be achieved. They rely upon complex sets of data, assumptions and numerous factors which can influence actual patronage, many being beyond the control or reasonable foresight of the forecaster. Any traffic forecast or other information contained in this Report is based on the information provided by you, and obtained from the sources identified, and the assumptions you have agreed, and therefore is inherently subject to uncertainties. Inevitably, some assumptions used to develop our report will not be realised and unanticipated events and circumstances may occur.
Therefore, PwC cannot provide any form of assurance that the forecasts documented in the appendix will be achieved and no warranty should be implied as to the accuracy of the forecasts.
Liability limited by a scheme approved under Professional Standards legislation.
DisclaimerC
3Northern Suburbs Transit Corridor | Preferred Mass Transit Study
IntroductionThe purpose of this document is to present the model development, assumptions and findings of the transport modelling undertaken for the Northern Suburbs Mass Transit transport mode study.
The Greater Hobart Urban Travel Demand Model (GHUTDM) is a strategic transport model encompassing the Local Government Areas of Hobart, Glenorchy, Clarence and Brighton, whilst partially covering the LGAs of Kingborough and Sorell. The model development was originally commissioned by the Department of Infrastructure, Energy and Resources (DIER) in 2011, within the Cube/Voyager software platform. The model was developed with a base year of 2009 and a forecast year of 2031.
In 2016, the Department of State Growth engaged GHD to undertake an update to the GHUTDM, whereby, the base year was updated to 2016 with forecast years of 2027 and 2037.
The GHUTDM has been used to provide quantitative transport outcome metrics for transport options for the corridor.
Structure of this reportThis appendix has been structured with the following chapters:
C.2 - Modelling process: outlines the structure in which the GHUTDM encompasses
C.3 - Assumptions: outlines the modelling assumptions underpinning the transport modelling outcomes
C.4 - Modelling scenarios: outlines the model runs undertaken to facilitate the MCA assessment
C.4 - Results: outlines the transport metrics utilised for the MCA assessment
C.5 - Conclusion and recommendations: outlines a summary of results and advice for future improvements
IntroductionC.1
4Northern Suburbs Transit Corridor | Preferred Mass Transit Study
The GHUTDM follows a conventional four step modelling process which is further broken down into six main elements.
1. Trip generation - produces daily trip ends (person trips) by purpose
2. Trip distribution - distributes motorised trip ends using generalised cost and production-attraction matrices by purpose
3. Mode choice - separates daily production-attraction by trip purpose into highway and public transport
4. Time period factors - separates production-attraction matrices by mode and purpose into peak period origin-destination matrices
5. Special trips - includes commercial vehicles and external trips
6. Assignment - assigns trips by mode into the network (highway and public transport) and updates generalised cost by highway and public transport modes.
Source: Greater Hobart Urban Travel Demand Model User Manual, AECOM 2011
Modelling processC.2
5Northern Suburbs Transit Corridor | Preferred Mass Transit Study
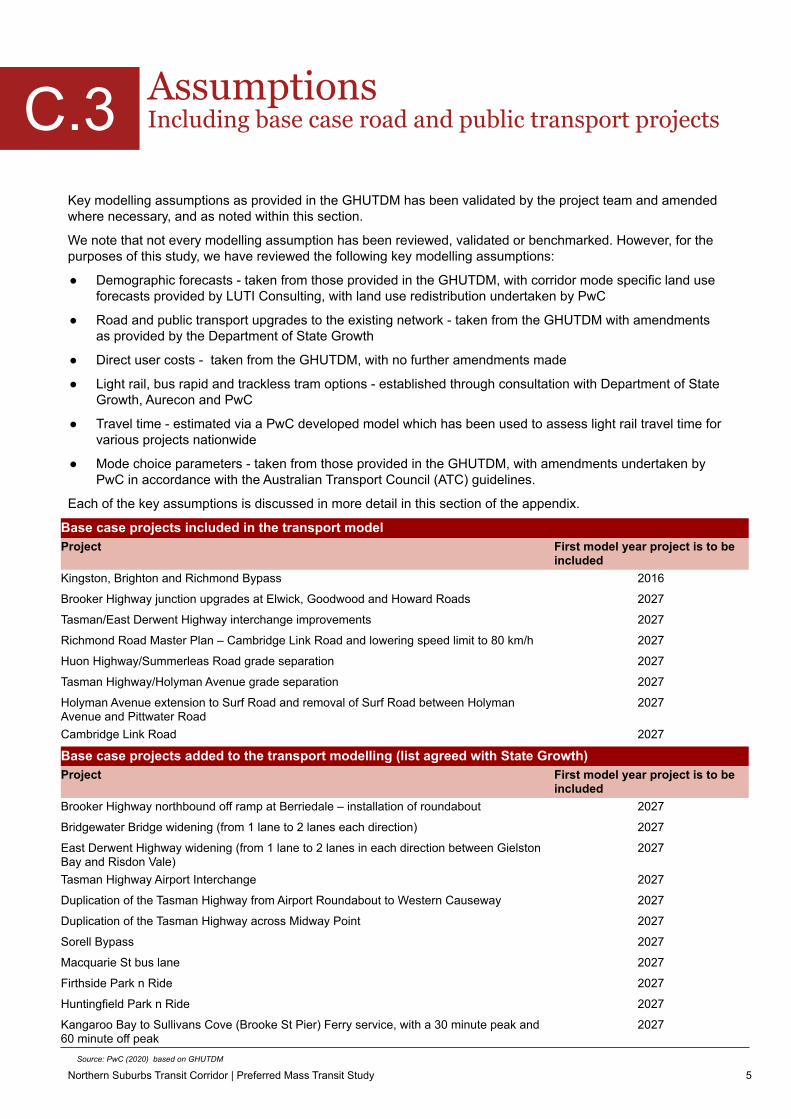
Key modelling assumptions as provided in the GHUTDM has been validated by the project team and amended where necessary, and as noted within this section.
We note that not every modelling assumption has been reviewed, validated or benchmarked. However, for the purposes of this study, we have reviewed the following key modelling assumptions:
● Demographic forecasts - taken from those provided in the GHUTDM, with corridor mode specific land use forecasts provided by LUTI Consulting, with land use redistribution undertaken by PwC
● Road and public transport upgrades to the existing network - taken from the GHUTDM with amendments as provided by the Department of State Growth
● Direct user costs - taken from the GHUTDM, with no further amendments made
● Light rail, bus rapid and trackless tram options - established through consultation with Department of State Growth, Aurecon and PwC
● Travel time - estimated via a PwC developed model which has been used to assess light rail travel time for various projects nationwide
● Mode choice parameters - taken from those provided in the GHUTDM, with amendments undertaken by PwC in accordance with the Australian Transport Council (ATC) guidelines.
Each of the key assumptions is discussed in more detail in this section of the appendix.
Assumptions Including base case road and public transport projects
Base case projects included in the transport modelProject First model year project is to be
includedKingston, Brighton and Richmond Bypass 2016
Brooker Highway junction upgrades at Elwick, Goodwood and Howard Roads 2027
Tasman/East Derwent Highway interchange improvements 2027
Richmond Road Master Plan – Cambridge Link Road and lowering speed limit to 80 km/h 2027
Huon Highway/Summerleas Road grade separation 2027
Tasman Highway/Holyman Avenue grade separation 2027
Holyman Avenue extension to Surf Road and removal of Surf Road between Holyman Avenue and Pittwater Road
2027
Cambridge Link Road 2027
Base case projects added to the transport modelling (list agreed with State Growth)Project First model year project is to be
includedBrooker Highway northbound off ramp at Berriedale – installation of roundabout 2027
Bridgewater Bridge widening (from 1 lane to 2 lanes each direction) 2027
East Derwent Highway widening (from 1 lane to 2 lanes in each direction between Gielston Bay and Risdon Vale)
2027
Tasman Highway Airport Interchange 2027
Duplication of the Tasman Highway from Airport Roundabout to Western Causeway 2027
Duplication of the Tasman Highway across Midway Point 2027
Sorell Bypass 2027
Macquarie St bus lane 2027
Firthside Park n Ride 2027
Huntingfield Park n Ride 2027
Kangaroo Bay to Sullivans Cove (Brooke St Pier) Ferry service, with a 30 minute peak and 60 minute off peak
2027
C.3
Source: PwC (2020) based on GHUTDM
6Northern Suburbs Transit Corridor | Preferred Mass Transit Study
Demographic forecasts
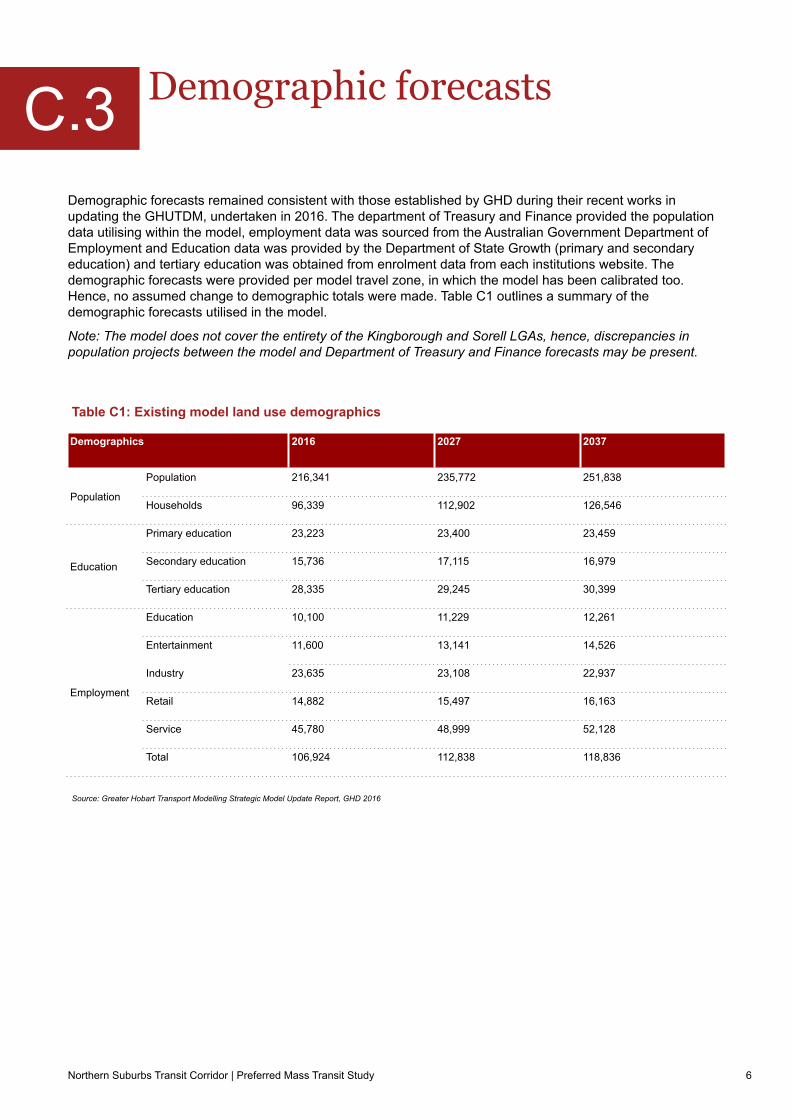
Demographics 2016 2027 2037
Population
Population 216,341 235,772 251,838
Households 96,339 112,902 126,546
Education
Primary education 23,223 23,400 23,459
Secondary education 15,736 17,115 16,979
Tertiary education 28,335 29,245 30,399
Employment
Education 10,100 11,229 12,261
Entertainment 11,600 13,141 14,526
Industry 23,635 23,108 22,937
Retail 14,882 15,497 16,163
Service 45,780 48,999 52,128
Total 106,924 112,838 118,836
Table C1: Existing model land use demographics
Demographic forecasts remained consistent with those established by GHD during their recent works in updating the GHUTDM, undertaken in 2016. The department of Treasury and Finance provided the population data utilising within the model, employment data was sourced from the Australian Government Department of Employment and Education data was provided by the Department of State Growth (primary and secondary education) and tertiary education was obtained from enrolment data from each institutions website. The demographic forecasts were provided per model travel zone, in which the model has been calibrated too. Hence, no assumed change to demographic totals were made. Table C1 outlines a summary of the demographic forecasts utilised in the model.
Note: The model does not cover the entirety of the Kingborough and Sorell LGAs, hence, discrepancies in population projects between the model and Department of Treasury and Finance forecasts may be present.
C.3
Source: Greater Hobart Transport Modelling Strategic Model Update Report, GHD 2016
7Northern Suburbs Transit Corridor | Preferred Mass Transit Study
Land Use uplift / redistribution
Scenario 2027Dwellings
2027Employment
2037Dwellings
2037Employment
Bus rapid Stage 1 145 40 869 239
Bus rapid Stage 1 and 2
174 37 1,043 223
Trackless tram Stage 1
284 71 1,702 428
Trackless tram Stage 1 and 2
353 88 2,119 529
Light rail Stage 1 604 143 3,622 860
Light rail Stage 1 and 2
776 180 4,657 1,082
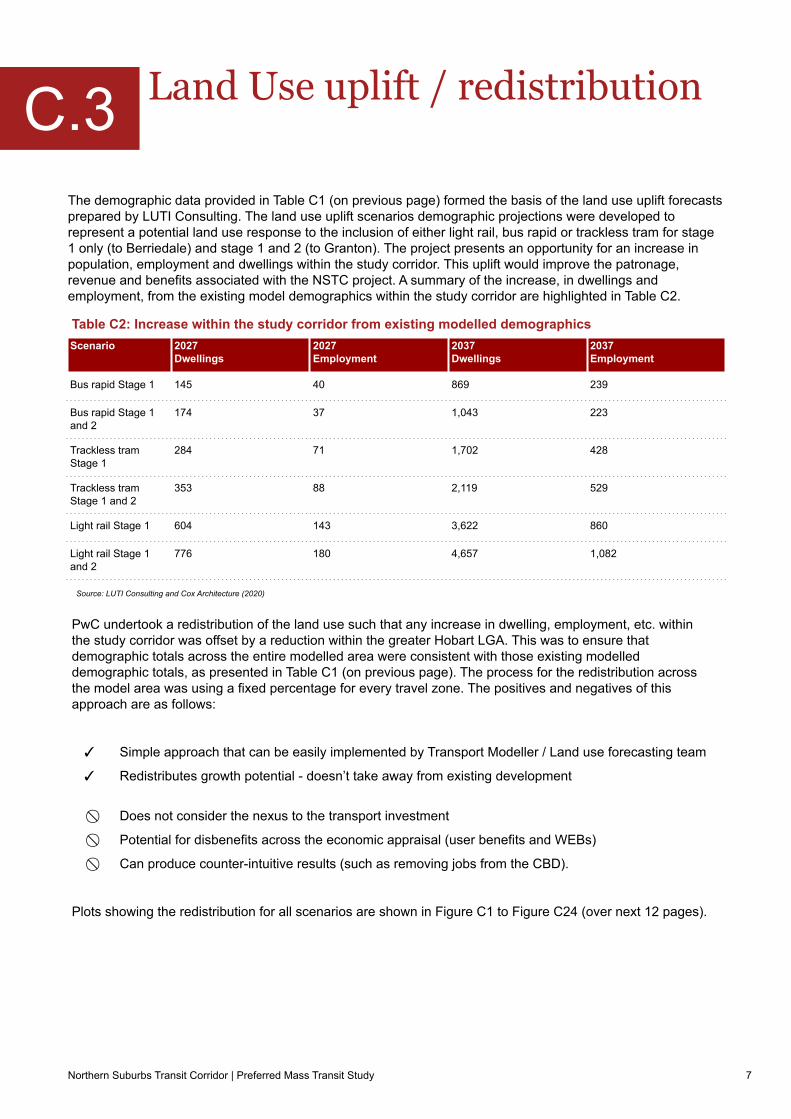
Table C2: Increase within the study corridor from existing modelled demographics
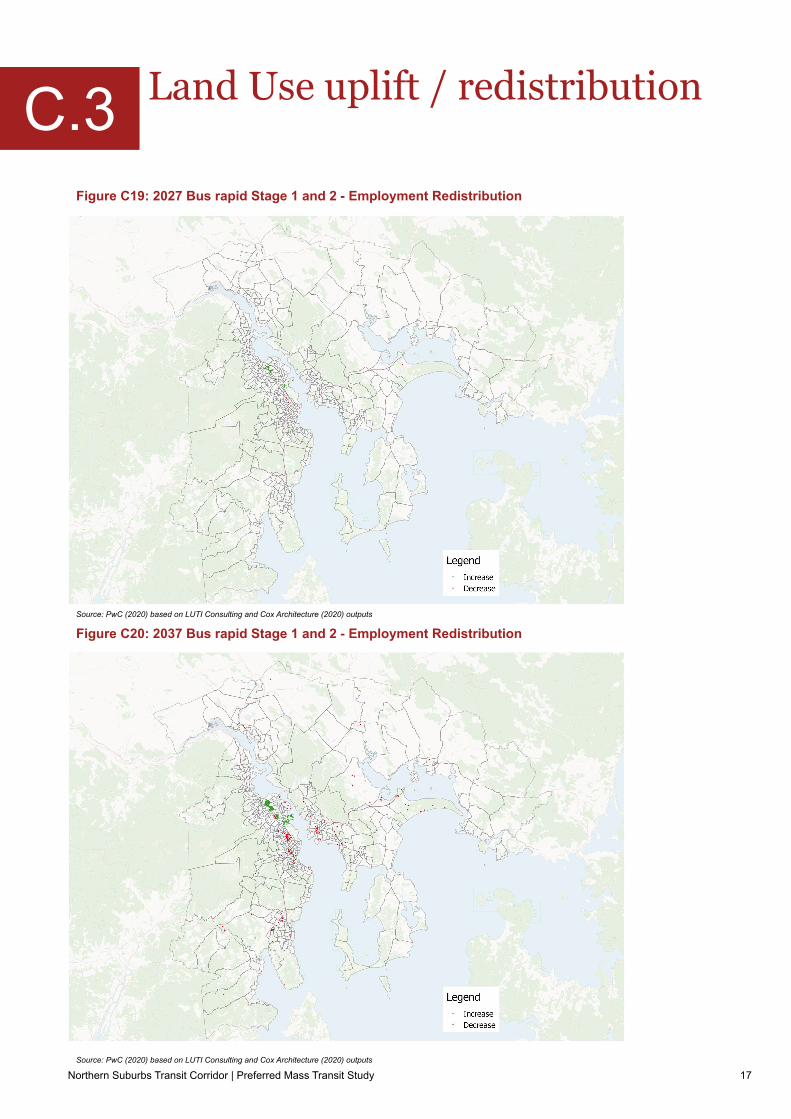
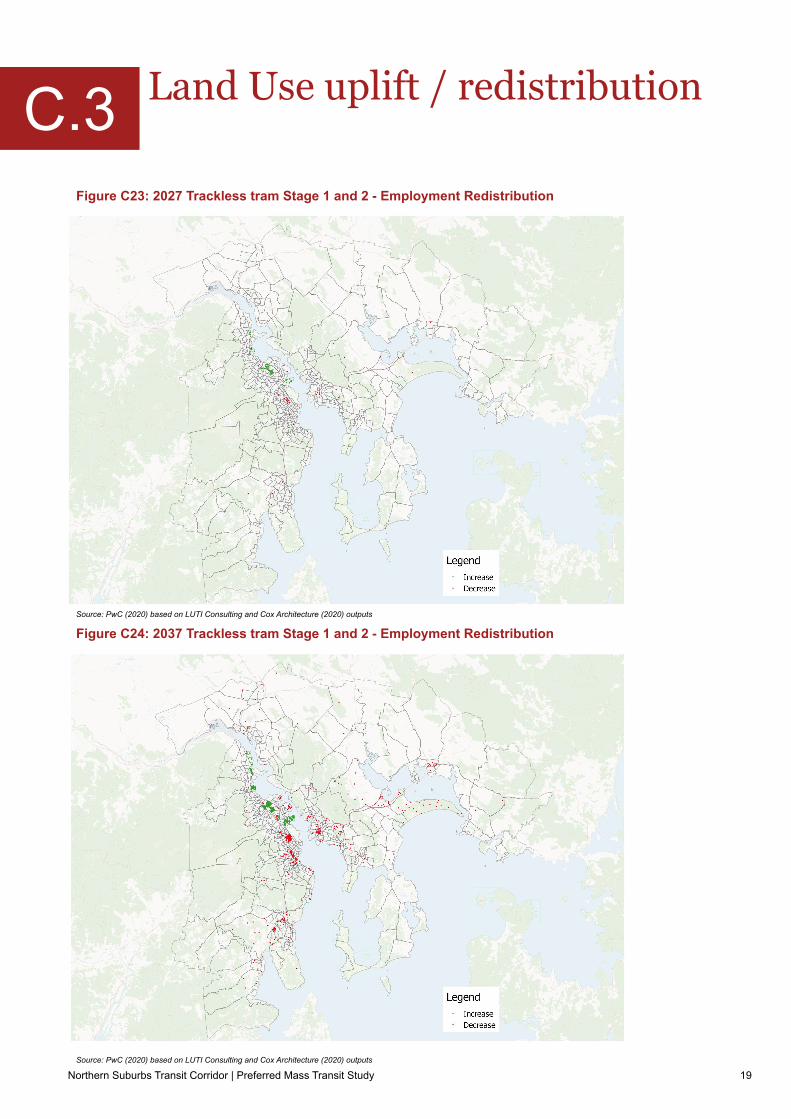
The demographic data provided in Table C1 (on previous page) formed the basis of the land use uplift forecasts prepared by LUTI Consulting. The land use uplift scenarios demographic projections were developed to represent a potential land use response to the inclusion of either light rail, bus rapid or trackless tram for stage 1 only (to Berriedale) and stage 1 and 2 (to Granton). The project presents an opportunity for an increase in population, employment and dwellings within the study corridor. This uplift would improve the patronage, revenue and benefits associated with the NSTC project. A summary of the increase, in dwellings and employment, from the existing model demographics within the study corridor are highlighted in Table C2.
PwC undertook a redistribution of the land use such that any increase in dwelling, employment, etc. within the study corridor was offset by a reduction within the greater Hobart LGA. This was to ensure that demographic totals across the entire modelled area were consistent with those existing modelled demographic totals, as presented in Table C1 (on previous page). The process for the redistribution across the model area was using a fixed percentage for every travel zone. The positives and negatives of this approach are as follows:
✓ Simple approach that can be easily implemented by Transport Modeller / Land use forecasting team
✓ Redistributes growth potential - doesn’t take away from existing development
⃠ Does not consider the nexus to the transport investment
⃠ Potential for disbenefits across the economic appraisal (user benefits and WEBs)
⃠ Can produce counter-intuitive results (such as removing jobs from the CBD).
Plots showing the redistribution for all scenarios are shown in Figure C1 to Figure C24 (over next 12 pages).
C.3
Source: LUTI Consulting and Cox Architecture (2020)
8Northern Suburbs Transit Corridor | Preferred Mass Transit Study
Land Use uplift / redistribution
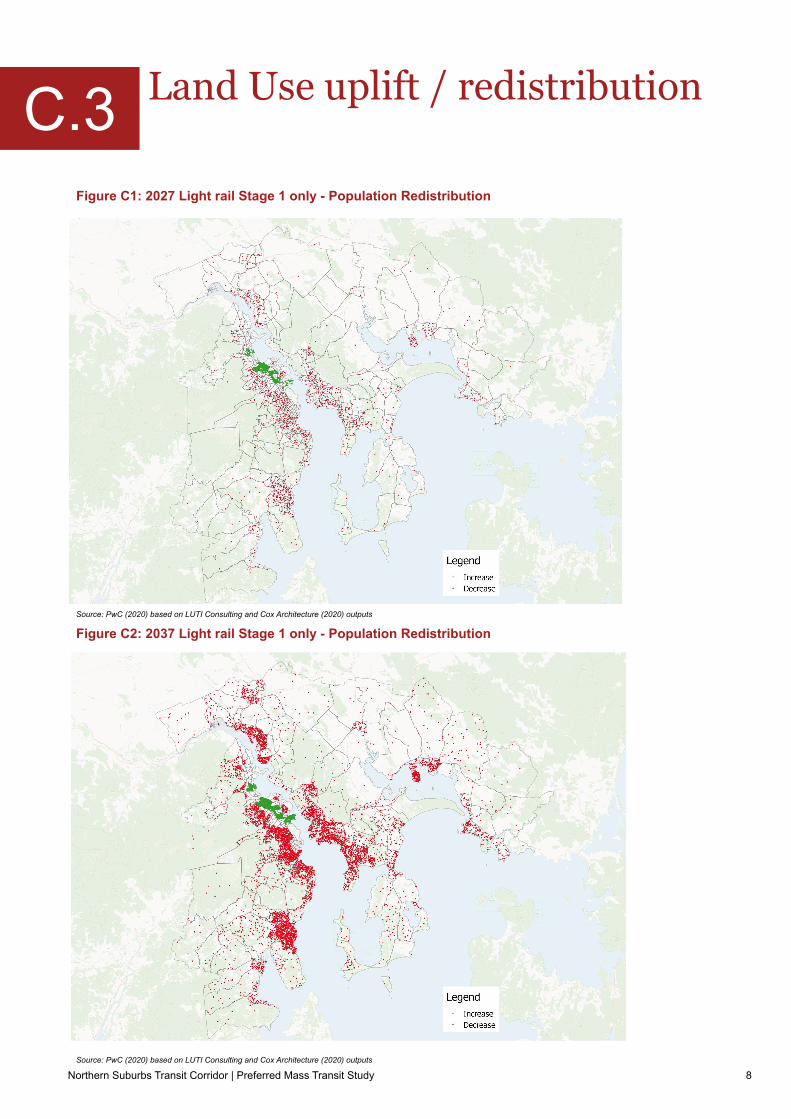
Figure C1: 2027 Light rail Stage 1 only - Population Redistribution
Figure C2: 2037 Light rail Stage 1 only - Population Redistribution
C.3
Source: PwC (2020) based on LUTI Consulting and Cox Architecture (2020) outputs
Source: PwC (2020) based on LUTI Consulting and Cox Architecture (2020) outputs

9Northern Suburbs Transit Corridor | Preferred Mass Transit Study
Land Use uplift / redistribution
Figure C3: 2027 Light rail Stage 1 and 2 - Population Redistribution
Figure C4: 2037 Light rail Stage 1 and 2 - Population Redistribution
C.3
Source: PwC (2020) based on LUTI Consulting and Cox Architecture (2020) outputs
Source: PwC (2020) based on LUTI Consulting and Cox Architecture (2020) outputs

10Northern Suburbs Transit Corridor | Preferred Mass Transit Study
Land Use uplift / redistribution
Figure C5: 2027 Bus rapid Stage 1 only - Population Redistribution
Figure C6: 2037 Bus rapid Stage 1 only - Population Redistribution
C.3
Source: PwC (2020) based on LUTI Consulting and Cox Architecture (2020) outputs
Source: PwC (2020) based on LUTI Consulting and Cox Architecture (2020) outputs
11Northern Suburbs Transit Corridor | Preferred Mass Transit Study
Land Use uplift / redistribution
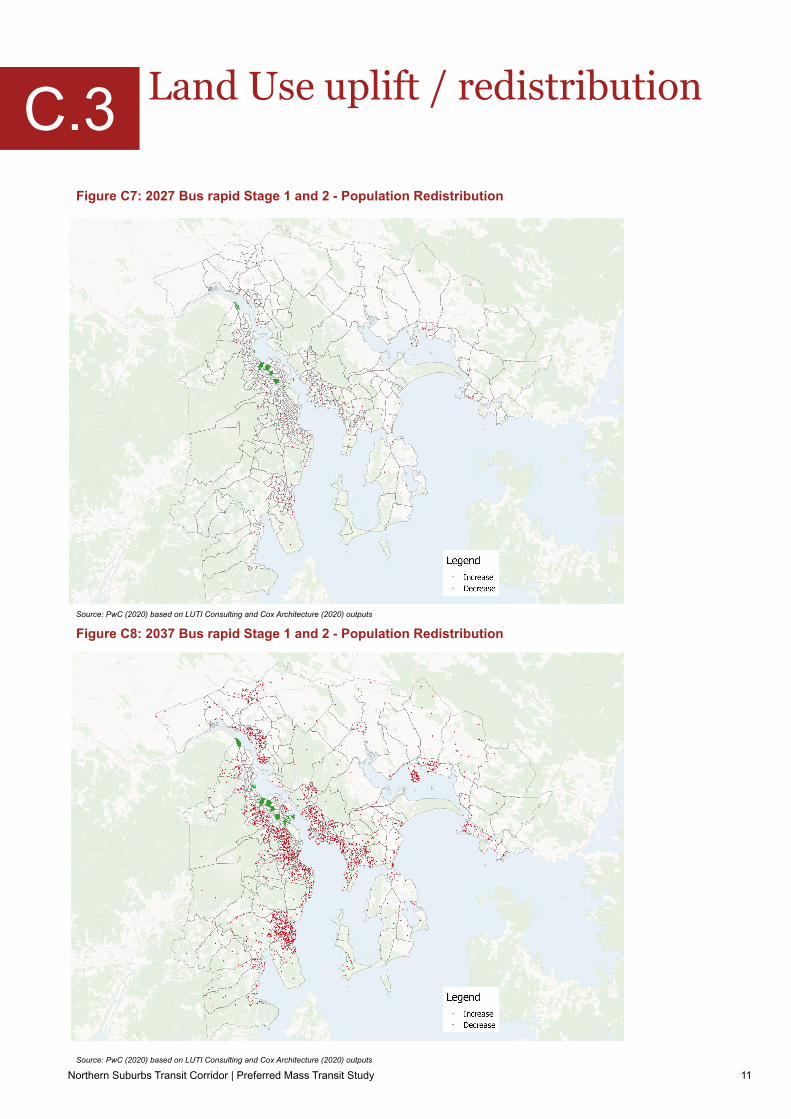
Figure C7: 2027 Bus rapid Stage 1 and 2 - Population Redistribution
Figure C8: 2037 Bus rapid Stage 1 and 2 - Population Redistribution
C.3
Source: PwC (2020) based on LUTI Consulting and Cox Architecture (2020) outputs
Source: PwC (2020) based on LUTI Consulting and Cox Architecture (2020) outputs

12Northern Suburbs Transit Corridor | Preferred Mass Transit Study
Land Use uplift / redistribution
Figure C9: 2027 Trackless tram Stage 1 only - Population Redistribution
Figure C10: 2037 Trackless tram Stage 1 only - Population Redistribution
C.3
Source: PwC (2020) based on LUTI Consulting and Cox Architecture (2020) outputs
Source: PwC (2020) based on LUTI Consulting and Cox Architecture (2020) outputs
13Northern Suburbs Transit Corridor | Preferred Mass Transit Study
Land Use uplift / redistribution
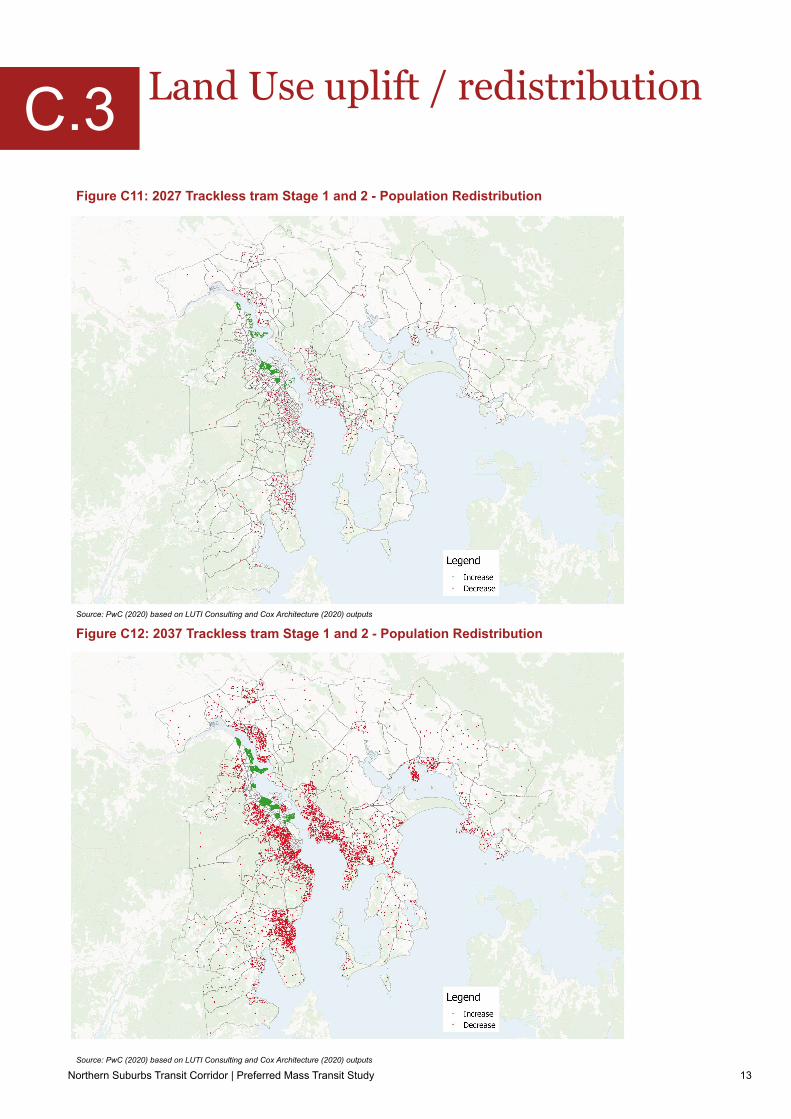
Figure C11: 2027 Trackless tram Stage 1 and 2 - Population Redistribution
Figure C12: 2037 Trackless tram Stage 1 and 2 - Population Redistribution
C.3
Source: PwC (2020) based on LUTI Consulting and Cox Architecture (2020) outputs
Source: PwC (2020) based on LUTI Consulting and Cox Architecture (2020) outputs

14Northern Suburbs Transit Corridor | Preferred Mass Transit Study
Land Use uplift / redistribution
Figure C13: 2027 Light rail Stage 1 only - Employment Redistribution
Figure C14: 2037 Light rail Stage 1 only - Employment Redistribution
C.3
Source: PwC (2020) based on LUTI Consulting and Cox Architecture (2020) outputs
Source: PwC (2020) based on LUTI Consulting and Cox Architecture (2020) outputs

15Northern Suburbs Transit Corridor | Preferred Mass Transit Study
Land Use uplift / redistribution
Figure C15: 2027 Light rail Stage 1 and 2 - Employment Redistribution
Figure C16: 2037 Light rail Stage 1 and 2 - Employment Redistribution
C.3
Source: PwC (2020) based on LUTI Consulting and Cox Architecture (2020) outputs
Source: PwC (2020) based on LUTI Consulting and Cox Architecture (2020) outputs

16Northern Suburbs Transit Corridor | Preferred Mass Transit Study
Land Use uplift / redistribution
Figure C17: 2027 Bus rapid Stage 1 only - Employment Redistribution
Figure C18: 2037 Bus rapid Stage 1 only - Employment Redistribution
C.3
Source: PwC (2020) based on LUTI Consulting and Cox Architecture (2020) outputs
Source: PwC (2020) based on LUTI Consulting and Cox Architecture (2020) outputs
17Northern Suburbs Transit Corridor | Preferred Mass Transit Study
Land Use uplift / redistribution
Figure C19: 2027 Bus rapid Stage 1 and 2 - Employment Redistribution
Figure C20: 2037 Bus rapid Stage 1 and 2 - Employment Redistribution
C.3
Source: PwC (2020) based on LUTI Consulting and Cox Architecture (2020) outputs
Source: PwC (2020) based on LUTI Consulting and Cox Architecture (2020) outputs

18Northern Suburbs Transit Corridor | Preferred Mass Transit Study
Land Use uplift / redistribution
Figure C21: 2027 Trackless tram Stage 1 only - Employment Redistribution
Figure C22: 2037 Trackless tram Stage 1 only - Employment Redistribution
C.3
Source: PwC (2020) based on LUTI Consulting and Cox Architecture (2020) outputs
Source: PwC (2020) based on LUTI Consulting and Cox Architecture (2020) outputs
19Northern Suburbs Transit Corridor | Preferred Mass Transit Study
Land Use uplift / redistribution
Figure C23: 2027 Trackless tram Stage 1 and 2 - Employment Redistribution
Figure C24: 2037 Trackless tram Stage 1 and 2 - Employment Redistribution
C.3
Source: PwC (2020) based on LUTI Consulting and Cox Architecture (2020) outputs
Source: PwC (2020) based on LUTI Consulting and Cox Architecture (2020) outputs
20Northern Suburbs Transit Corridor | Preferred Mass Transit Study
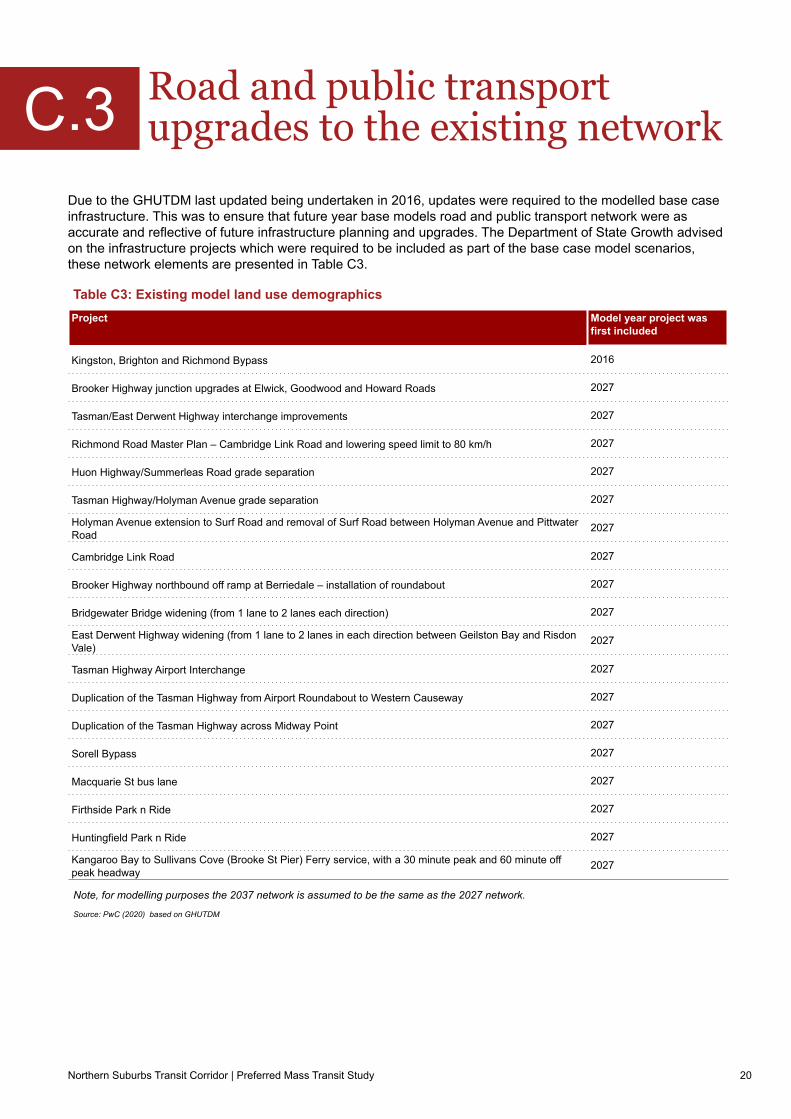
Due to the GHUTDM last updated being undertaken in 2016, updates were required to the modelled base case infrastructure. This was to ensure that future year base models road and public transport network were as accurate and reflective of future infrastructure planning and upgrades. The Department of State Growth advised on the infrastructure projects which were required to be included as part of the base case model scenarios, these network elements are presented in Table C3.
Road and public transport upgrades to the existing network
Project Model year project was first included
Kingston, Brighton and Richmond Bypass 2016
Brooker Highway junction upgrades at Elwick, Goodwood and Howard Roads 2027
Tasman/East Derwent Highway interchange improvements 2027
Richmond Road Master Plan – Cambridge Link Road and lowering speed limit to 80 km/h 2027
Huon Highway/Summerleas Road grade separation 2027
Tasman Highway/Holyman Avenue grade separation 2027
Holyman Avenue extension to Surf Road and removal of Surf Road between Holyman Avenue and Pittwater Road
2027
Cambridge Link Road 2027
Brooker Highway northbound off ramp at Berriedale – installation of roundabout 2027
Bridgewater Bridge widening (from 1 lane to 2 lanes each direction) 2027
East Derwent Highway widening (from 1 lane to 2 lanes in each direction between Geilston Bay and Risdon Vale)
2027
Tasman Highway Airport Interchange 2027
Duplication of the Tasman Highway from Airport Roundabout to Western Causeway 2027
Duplication of the Tasman Highway across Midway Point 2027
Sorell Bypass 2027
Macquarie St bus lane 2027
Firthside Park n Ride 2027
Huntingfield Park n Ride 2027
Kangaroo Bay to Sullivans Cove (Brooke St Pier) Ferry service, with a 30 minute peak and 60 minute off peak headway
2027
Table C3: Existing model land use demographics
C.3
Note, for modelling purposes the 2037 network is assumed to be the same as the 2027 network.
Source: PwC (2020) based on GHUTDM
21Northern Suburbs Transit Corridor | Preferred Mass Transit Study
Direct user costs within the GHUTDM have remained consistent with those established by GHD during their model update in 2016. Hence, PwC have made no change to the public transport fare system or parking charges.
Public transport faresNo assumed changes to the currently modelled public transport fare system were made. The fare system follows a structure whereby, each public transport service has a defined fare system factor which it belongs to. The factors are 1-urban, 2-rural or 3-ferry.
It was assumed that for a light rail, bus rapid and trackless tram scenario this public transport service will follow the urban fare system factor.
Parking chargesNo assumed changes to the currently modelled parking supply demand model were made. In the mode choice component of the model, parking charges are incorporated as part of the generalised cost of private transport. The parking model is applied by specifying the parking supply by type in each zone and then calculating from the current model iteration the demand for parking by type in each zone. The parking delay was capped at 35 minutes so that it would encourage trips to shift to other modes but would not cause unrealistic delays and instability in the mode choice.
Direct user costsC.3

22Northern Suburbs Transit Corridor | Preferred Mass Transit Study
Light rail assumptions
One of the three transport modes assessed for the Northern Suburbs Mass Transit transport mode study was light rail. For modelling purposes the development of the Light rail encompasses four core assumptions alignment, stations and operations listed below and travel time.
AlignmentThe light rail project alignment and station locations are consistent with those presented by Aurecon. The corridor alignment is outlined below:
● Stage 1 Northern end: MONA, Berriedale Bay
● Stage 2 Northern end: Granton Bridge.
StationsThe stations included in the transport modelling are as follows:
● Hobart CBD
● Macquarie Point
● Botanical Gardens
● New Town
● Albert Road
● Derwent Park Road
● Hobart Showgrounds
● Glenorchy Central
● Brooker Interchange
● Berriedale / MONA
● Claremont (Stage 2)
● Austins Ferry (Stage 2)
● Grant Bridge / Interchange (Stage 2)
Light rail operationThe following were assumed to facilitate in the running of the transport models:
● Headway of 10 minutes during AM, PM and OP
● Fare system 1-Urban to be utilised for the light rail, this is consistent with the existing bus network
● No change to current operation or routes of current bus services with the inclusion of light rail.
C.3
23Northern Suburbs Transit Corridor | Preferred Mass Transit Study
Bus rapid assumptions
One of the three transport modes assessed for the Northern Suburbs Mass Transit transport mode study was bus rapid. For modelling purposes the development of the bus rapid encompasses four core assumptions alignment, stations and operations listed below and travel time.
AlignmentThe bus rapid project alignment and station locations are consistent with the light rail project scenario. The corridor alignment is outlined below:
● Stage 1 Northern end: MONA, Berriedale Bay
● Stage 2 Northern end: Granton Bridge.
StationsThe stations included in the transport modelling are as follows:
● Hobart CBD
● Macquarie Point
● Botanical Gardens
● New Town
● Albert Road
● Derwent Park Road
● Hobart Showgrounds
● Glenorchy Central
● Brooker Interchange
● Berriedale / MONA
● Claremont (Stage 2)
● Austins Ferry (Stage 2)
● Grant Bridge / Interchange (Stage 2)
Bus rapid operationThe following were assumed to facilitate in the running of the transport models:
● Headway of 10 minutes during AM, PM and OP
● Fare system 1-Urban to be utilised for the bus rapid, this is consistent with the existing bus network
● No change to current operation or routes of current bus services with the inclusion the bus rapid.
C.3

24Northern Suburbs Transit Corridor | Preferred Mass Transit Study
Trackless tram assumptions
One of the three transport modes assessed for the Northern Suburbs Mass Transit transport mode study was trackless tram. For modelling purposes the development of the trackless tram encompasses four core assumptions alignment, stations and operations listed below and travel time.
AlignmentThe trackless tram project alignment and station locations are consistent with the light rail project scenario. The corridor alignment is outlined below:
● Stage 1 Northern end: MONA, Berriedale Bay
● Stage 2 Northern end: Granton Bridge.
StationsThe stations included in the transport modelling are as follows:
● Hobart CBD
● Macquarie Point
● Botanical Gardens
● New Town
● Albert Road
● Derwent Park Road
● Hobart Showgrounds
● Glenorchy Central
● Brooker Interchange
● Berriedale / MONA
● Claremont (Stage 2)
● Austins Ferry (Stage 2)
● Grant Bridge / Interchange (Stage 2)
Trackless tram operationThe following were assumed to facilitate in the running of the transport models:
● Headway of 10 minutes during AM, PM and OP
● Fare system 1-Urban to be utilised for the trackless tram, this is consistent with the existing bus network
● No change to current operation or routes of current bus services with the inclusion of trackless tram.
C.3
25Northern Suburbs Transit Corridor | Preferred Mass Transit Study
Travel time
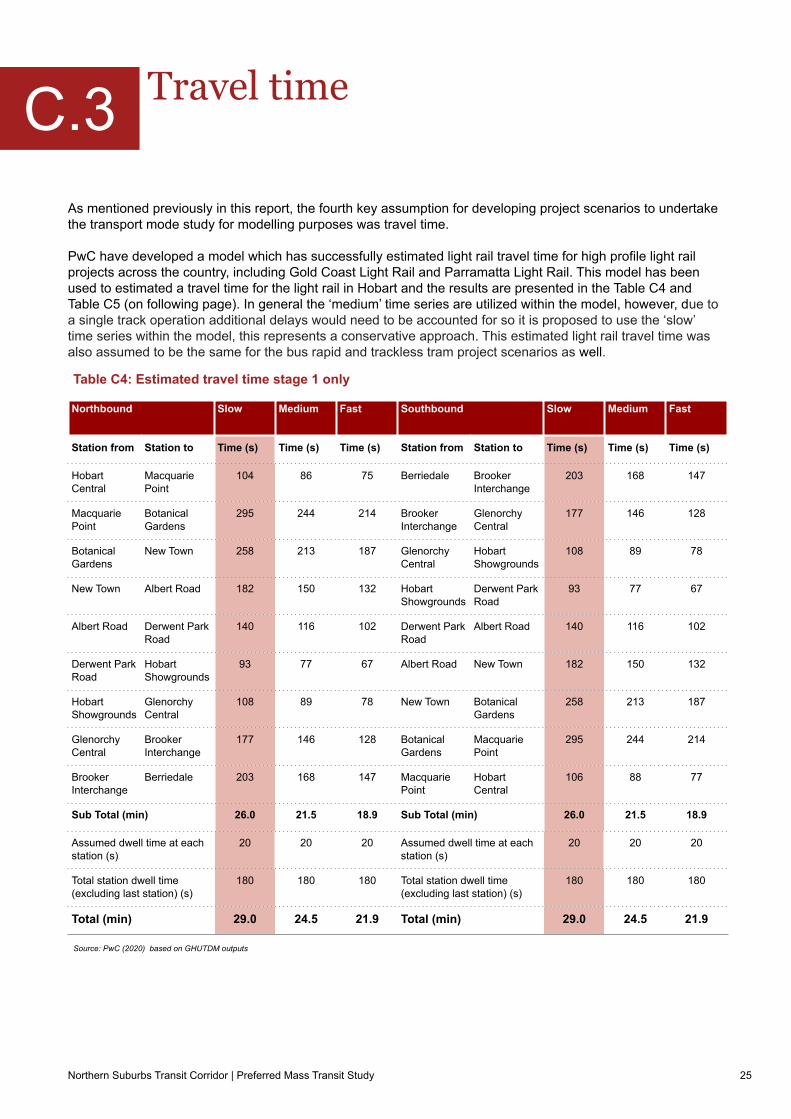
As mentioned previously in this report, the fourth key assumption for developing project scenarios to undertake the transport mode study for modelling purposes was travel time.
PwC have developed a model which has successfully estimated light rail travel time for high profile light rail projects across the country, including Gold Coast Light Rail and Parramatta Light Rail. This model has been used to estimated a travel time for the light rail in Hobart and the results are presented in the Table C4 and Table C5 (on following page). In general the ‘medium’ time series are utilized within the model, however, due to a single track operation additional delays would need to be accounted for so it is proposed to use the ‘slow’ time series within the model, this represents a conservative approach. This estimated light rail travel time was also assumed to be the same for the bus rapid and trackless tram project scenarios as well.
Table C4: Estimated travel time stage 1 only
Northbound Slow Medium Fast Southbound Slow Medium Fast
Station from Station to Time (s) Time (s) Time (s) Station from Station to Time (s) Time (s) Time (s)
Hobart Central
Macquarie Point
104 86 75 Berriedale Brooker Interchange
203 168 147
Macquarie Point
Botanical Gardens
295 244 214 Brooker Interchange
Glenorchy Central
177 146 128
Botanical Gardens
New Town 258 213 187 Glenorchy Central
Hobart Showgrounds
108 89 78
New Town Albert Road 182 150 132 Hobart Showgrounds
Derwent Park Road
93 77 67
Albert Road Derwent Park Road
140 116 102 Derwent Park Road
Albert Road 140 116 102
Derwent Park Road
Hobart Showgrounds
93 77 67 Albert Road New Town 182 150 132
Hobart Showgrounds
Glenorchy Central
108 89 78 New Town Botanical Gardens
258 213 187
Glenorchy Central
Brooker Interchange
177 146 128 Botanical Gardens
Macquarie Point
295 244 214
Brooker Interchange
Berriedale 203 168 147 Macquarie Point
Hobart Central
106 88 77
Sub Total (min) 26.0 21.5 18.9 Sub Total (min) 26.0 21.5 18.9
Assumed dwell time at each station (s)
20 20 20 Assumed dwell time at each station (s)
20 20 20
Total station dwell time (excluding last station) (s)
180 180 180 Total station dwell time (excluding last station) (s)
180 180 180
Total (min) 29.0 24.5 21.9 Total (min) 29.0 24.5 21.9
C.3
Source: PwC (2020) based on GHUTDM outputs

26Northern Suburbs Transit Corridor | Preferred Mass Transit Study
Travel time
Note, travel time between stations is re-adjusted within the model, with the inclusion of the Stage 2 stations, due to the increased total alignment length. Hence, the discrepancy in travel time between the Stage 1 only scenario (Table C4 previous page) and Stage 1 and 2 (Table C5).
Table C5: Estimated travel time stage 1 only
Northbound Slow Medium Fast Southbound Slow Medium Fast
Station from Station to Time (s) Time (s) Time (s) Station from Station to Time (s) Time (s) Time (s)
Hobart Central
Macquarie Point
94 78 70 Granton Austins Ferry 215 178 160
Macquarie Point
Botanical Gardens
266 221 198 Austins Ferry Claremont 415 345 309
Botanical Gardens
New Town 232 193 173 Claremont Berriedale 262 218 195
New Town Albert Road 164 136 122 Berriedale Brooker Interchange
183 152 136
Albert Road Derwent Park Road
126 105 94 Brooker Interchange
Glenorchy Central
160 133 119
Derwent Park Road
Hobart Showgrounds
84 69 62 Glenorchy Central
Hobart Showgrounds
97 81 72
Hobart Showgrounds
Glenorchy Central
97 81 72 Hobart Showgrounds
Derwent Park Road
84 69 62
Glenorchy Central
Brooker Interchange
160 133 119 Derwent Park Road
Albert Road 126 105 94
Brooker Interchange
Berriedale 183 152 136 Albert Road New Town 164 136 122
Berriedale Claremont 262 218 195 New Town Botanical Gardens
232 193 173
Claremont Austins Ferry 415 345 309 Botanical Gardens
Macquarie Point
266 221 198
Austins Ferry Granton 215 178 160 Macquarie Point
Hobart Central
96 79 71
Sub Total (min) 38.3 31.8 28.5 Sub Total (min) 38.3 31.8 28.5
Assumed dwell time at each station (s)
20 20 20 Assumed dwell time at each station (s)
20 20 20
Total station dwell time (excluding last station) (s)
240 240 240 Total station dwell time (excluding last station) (s)
240 240 240
Total (min) 42.3 35.8 32.5 Total (min) 42.3 35.8 32.5
C.3
Source: PwC (2020) based on GHUTDM outputs
27Northern Suburbs Transit Corridor | Preferred Mass Transit Study
Mode choice parameters
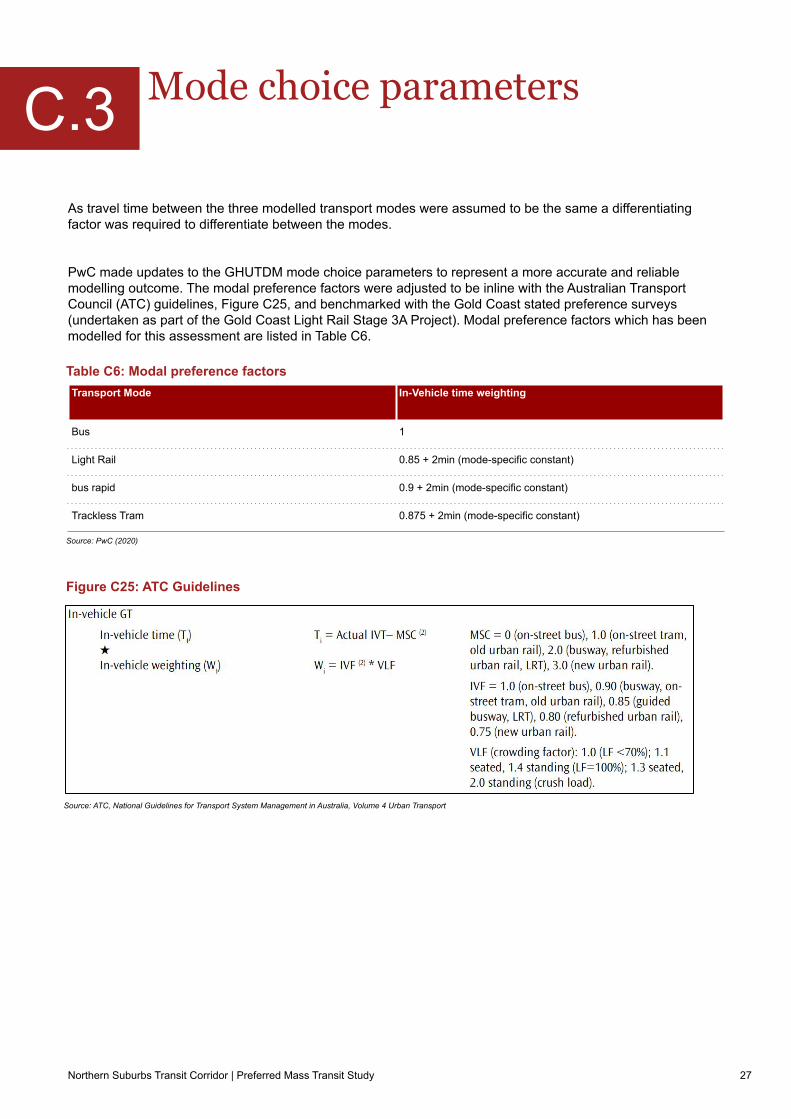
As travel time between the three modelled transport modes were assumed to be the same a differentiating factor was required to differentiate between the modes.
PwC made updates to the GHUTDM mode choice parameters to represent a more accurate and reliable modelling outcome. The modal preference factors were adjusted to be inline with the Australian Transport Council (ATC) guidelines, Figure C25, and benchmarked with the Gold Coast stated preference surveys (undertaken as part of the Gold Coast Light Rail Stage 3A Project). Modal preference factors which has been modelled for this assessment are listed in Table C6.
Table C6: Modal preference factorsTransport Mode In-Vehicle time weighting
Bus 1
Light Rail 0.85 + 2min (mode-specific constant)
bus rapid 0.9 + 2min (mode-specific constant)
Trackless Tram 0.875 + 2min (mode-specific constant)
Figure C25: ATC Guidelines
C.3
Source: PwC (2020)
Source: ATC, National Guidelines for Transport System Management in Australia, Volume 4 Urban Transport
28Northern Suburbs Transit Corridor | Preferred Mass Transit Study
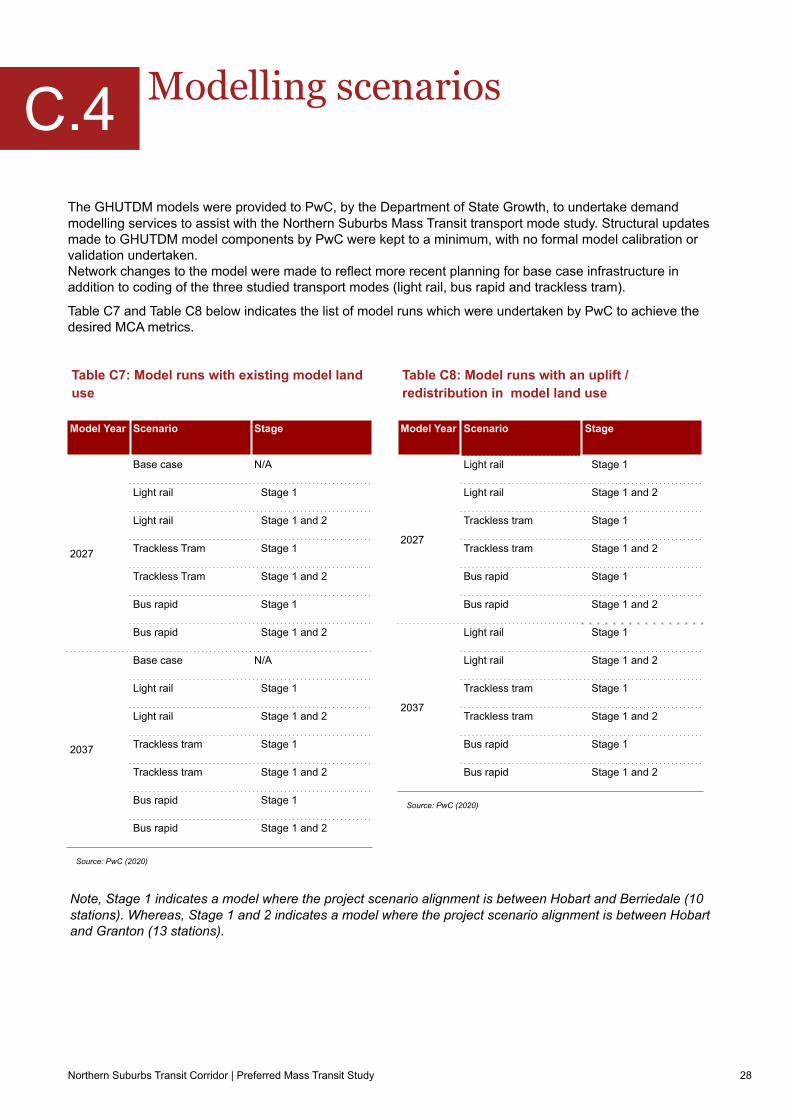
The GHUTDM models were provided to PwC, by the Department of State Growth, to undertake demand modelling services to assist with the Northern Suburbs Mass Transit transport mode study. Structural updates made to GHUTDM model components by PwC were kept to a minimum, with no formal model calibration or validation undertaken. Network changes to the model were made to reflect more recent planning for base case infrastructure in addition to coding of the three studied transport modes (light rail, bus rapid and trackless tram).
Table C7 and Table C8 below indicates the list of model runs which were undertaken by PwC to achieve the desired MCA metrics.
Modelling scenariosC.4
Model Year Scenario Stage
2027
Base case N/A
Light rail Stage 1
Light rail Stage 1 and 2
Trackless Tram Stage 1
Trackless Tram Stage 1 and 2
Bus rapid Stage 1
Bus rapid Stage 1 and 2
2037
Base case N/A
Light rail Stage 1
Light rail Stage 1 and 2
Trackless tram Stage 1
Trackless tram Stage 1 and 2
Bus rapid Stage 1
Bus rapid Stage 1 and 2
Model Year Scenario Stage
2027
Light rail Stage 1
Light rail Stage 1 and 2
Trackless tram Stage 1
Trackless tram Stage 1 and 2
Bus rapid Stage 1
Bus rapid Stage 1 and 2
2037
Light rail Stage 1
Light rail Stage 1 and 2
Trackless tram Stage 1
Trackless tram Stage 1 and 2
Bus rapid Stage 1
Bus rapid Stage 1 and 2
Table C7: Model runs with existing model land use
Table C8: Model runs with an uplift / redistribution in model land use
Note, Stage 1 indicates a model where the project scenario alignment is between Hobart and Berriedale (10 stations). Whereas, Stage 1 and 2 indicates a model where the project scenario alignment is between Hobart and Granton (13 stations).
Source: PwC (2020)
Source: PwC (2020)
29Northern Suburbs Transit Corridor | Preferred Mass Transit Study
The following section outlines the strategic modelling results for the core scenarios as presented in Table C7 and C8 (on previous page). The transport modelling results were extracted in accordance of the following key principles:
● Ensuring a transport service that is safe and accessible
○ Congestion between Granton and Hobart (Brooker Highway / Main Road)
○ Public transport efficiency
● Realising a “30 minute city”
○ Network wide transport congestion
○ Population within 30 minutes of metropolitan and strategic centres.
The transport modelling outcomes which has been extracted and presented in this report are as follows:
● Network difference plots highlighting the increase in public transport line loading and the decrease in vehicle demand with the inclusion of light rail (stage 1 and 2) project in comparison to the base case during 2037
● Car travel time(per vehicle) between Granton and Hobart during the AM peak period (7AM-9AM)
● Public transport travel time (per person) between Granton and Hobart during the AM peak period
● Network wide Vehicle Kilometres Travelled (VKT) at a daily level
● Network wide Vehicle Hours Travelled (VHT) at a daily level
● Network wide Passenger Kilometres Travelled (PKT) at a daily level
● Network wide Passenger Hours Travelled (PHT) at a daily level
● Population within a 15, 30 and 45 public transport journey of Hobart, Moonah, Glenorchy, Berriedale and Claremont.
A note about the model results: When reviewing the car distance and travel time results (VKT and VHT) there are some counterintuitive results when comparing the options. The options assessed (BRT, Trackless tram and LRT) are all very similar in the way that they are represented in the demand model. The highway assignment within the GHUTDM is suitable to provide costs (travel time, distance) into the model’s distribution and mode choice models, however it does not converge to a level which we consider suitable to accurately reflect the impacts and benefits to the road network to differentiate between the options. We recommend refinement of the highway assignment process to improve the convergence.
ResultsC.5
30Northern Suburbs Transit Corridor | Preferred Mass Transit Study
Results
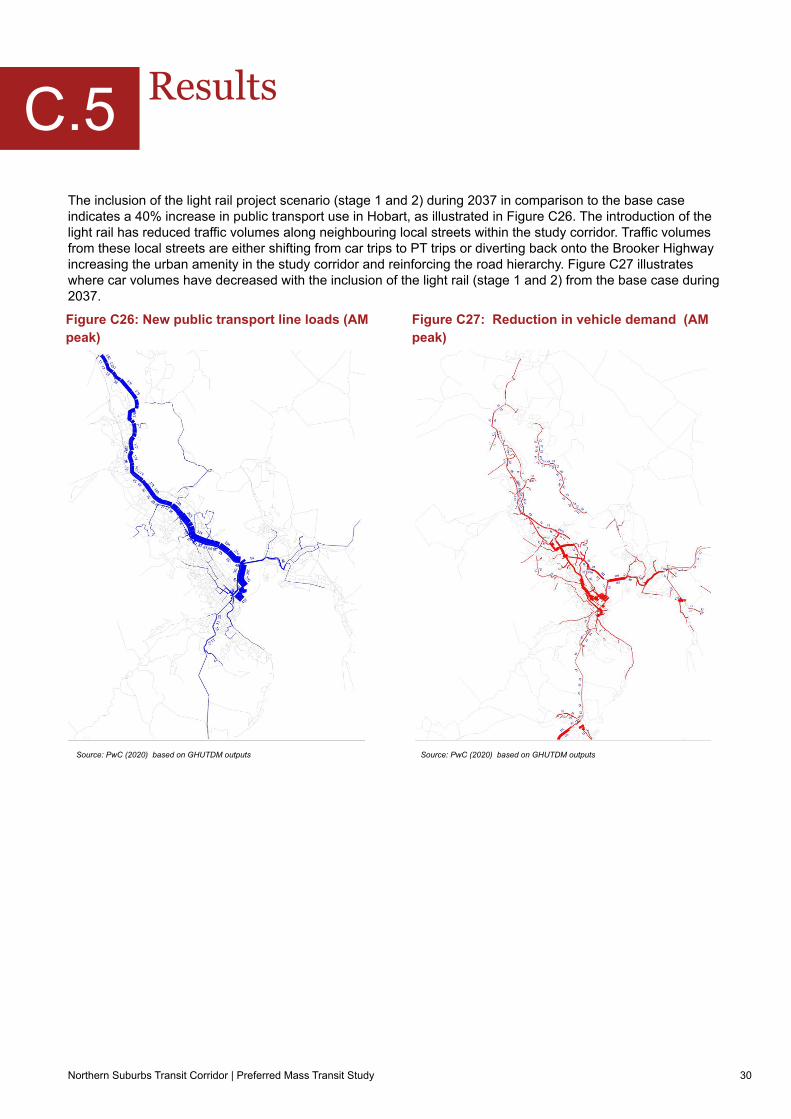
The inclusion of the light rail project scenario (stage 1 and 2) during 2037 in comparison to the base case indicates a 40% increase in public transport use in Hobart, as illustrated in Figure C26. The introduction of the light rail has reduced traffic volumes along neighbouring local streets within the study corridor. Traffic volumes from these local streets are either shifting from car trips to PT trips or diverting back onto the Brooker Highway increasing the urban amenity in the study corridor and reinforcing the road hierarchy. Figure C27 illustrates where car volumes have decreased with the inclusion of the light rail (stage 1 and 2) from the base case during 2037.
C.5
Figure C27: Reduction in vehicle demand (AM peak)
Figure C26: New public transport line loads (AM peak)
Source: PwC (2020) based on GHUTDM outputs Source: PwC (2020) based on GHUTDM outputs
31Northern Suburbs Transit Corridor | Preferred Mass Transit Study
Results
Scenario 2027 Stage 1 only
2027 Stage 1 only w/ LU
2027 Stage 1 and 2
2027 Stage 1 and 2 w/ LU
2037 Stage 1 only
2037 Stage 1 only w/ LU
2037 Stage 1 and 2
2037 Stage 1 and 2 w/ LU
Granton - Hobart Car Travel Time AM (min)
Base case 23.62 24.25
Light rail 23.28 22.64 23.39 22.56 24.07 23.00 23.94 22.95
Bus rapid 23.41 22.48 23.27 22.33 24.01 22.76 23.90 23.04
Trackless trams
23.46 22.40 23.35 22.52 24.05 22.80 23.97 22.78
Hobart - Granton Car Travel Time AM (min)
Base case 21.16 21.21
Light rail 21.16 21.18 21.18 21.19 21.21 21.23 21.20 21.23
Bus rapid 21.16 21.19 21.16 21.17 21.21 21.23 21.20 21.23
Trackless trams
21.18 21.21 21.18 21.20 21.21 21.24 21.20 21.24
Table C9: Modelled travel time (per vehicle) between Granton and Hobart (AM Peak)
Scenario 2027 Stage 1 only
2027 Stage 1 only w/ LU
2027 Stage 1 and 2
2027 Stage 1 and 2 w/ LU
2037 Stage 1 only
2037 Stage 1 only w/ LU
2037 Stage 1 and 2
2037 Stage 1 and 2 w/ LU
Granton - Hobart Perceived Public Transport Travel Time AM (min)
Base case 200.50 202.34
Light rail 177.01 176.81 106.67 106.67 177.12 176.85 106.67 106.67
Bus rapid 178.34 178.14 108.67 108.67 178.46 178.18 108.67 108.67
Trackless trams
177.69 177.48 107.68 107.68 177.79 177.52 107.68 107.68
Hobart - Granton Perceived Public Transport Travel Time AM (min)
Base case 252.79 252.79
Light rail 167.02 167.03 106.64 106.64 167.02 167.02 106.64 106.64
Bus rapid 168.38 168.39 108.64 108.64 168.38 168.38 108.64 108.64
Trackless trams
167.70 167.71 107.64 107.64 167.70 167.70 107.64 107.64
Table C10: Modelled public transport travel time (per person) between Granton and Hobart (AM Peak)
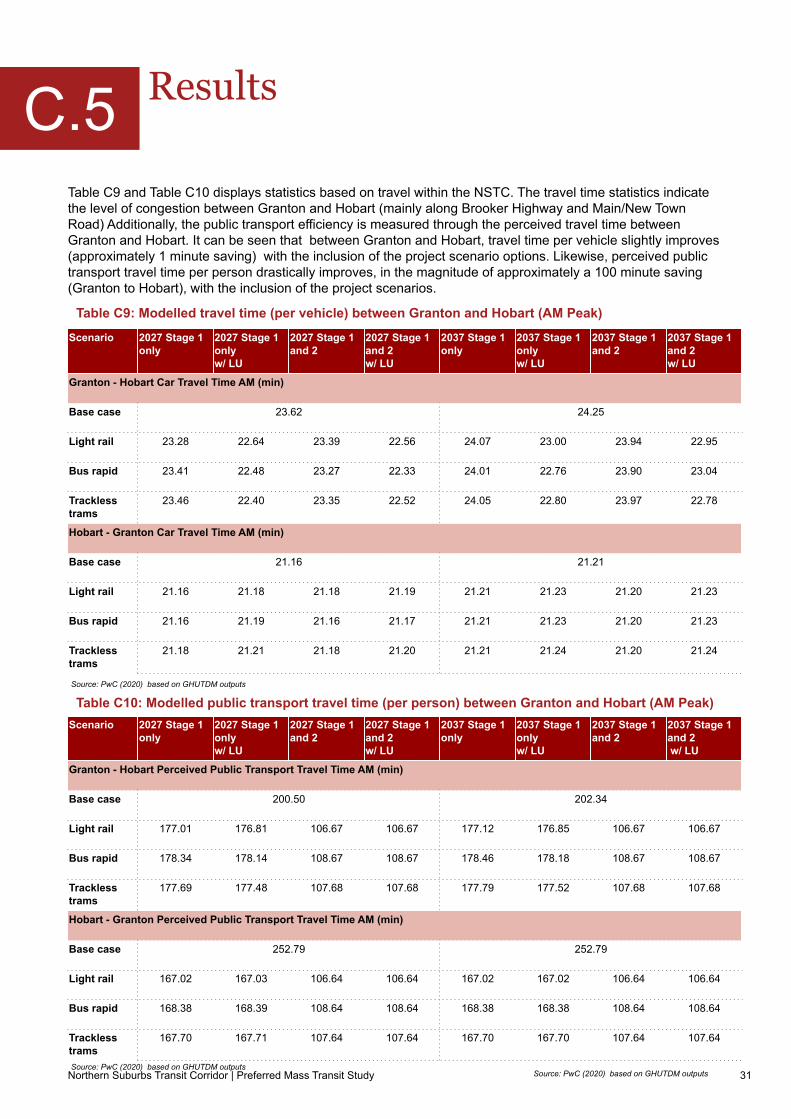
Table C9 and Table C10 displays statistics based on travel within the NSTC. The travel time statistics indicate the level of congestion between Granton and Hobart (mainly along Brooker Highway and Main/New Town Road) Additionally, the public transport efficiency is measured through the perceived travel time between Granton and Hobart. It can be seen that between Granton and Hobart, travel time per vehicle slightly improves (approximately 1 minute saving) with the inclusion of the project scenario options. Likewise, perceived public transport travel time per person drastically improves, in the magnitude of approximately a 100 minute saving (Granton to Hobart), with the inclusion of the project scenarios.
C.5
Source: PwC (2020) based on GHUTDM outputs
Source: PwC (2020) based on GHUTDM outputsSource: PwC (2020) based on GHUTDM outputs
32Northern Suburbs Transit Corridor | Preferred Mass Transit Study
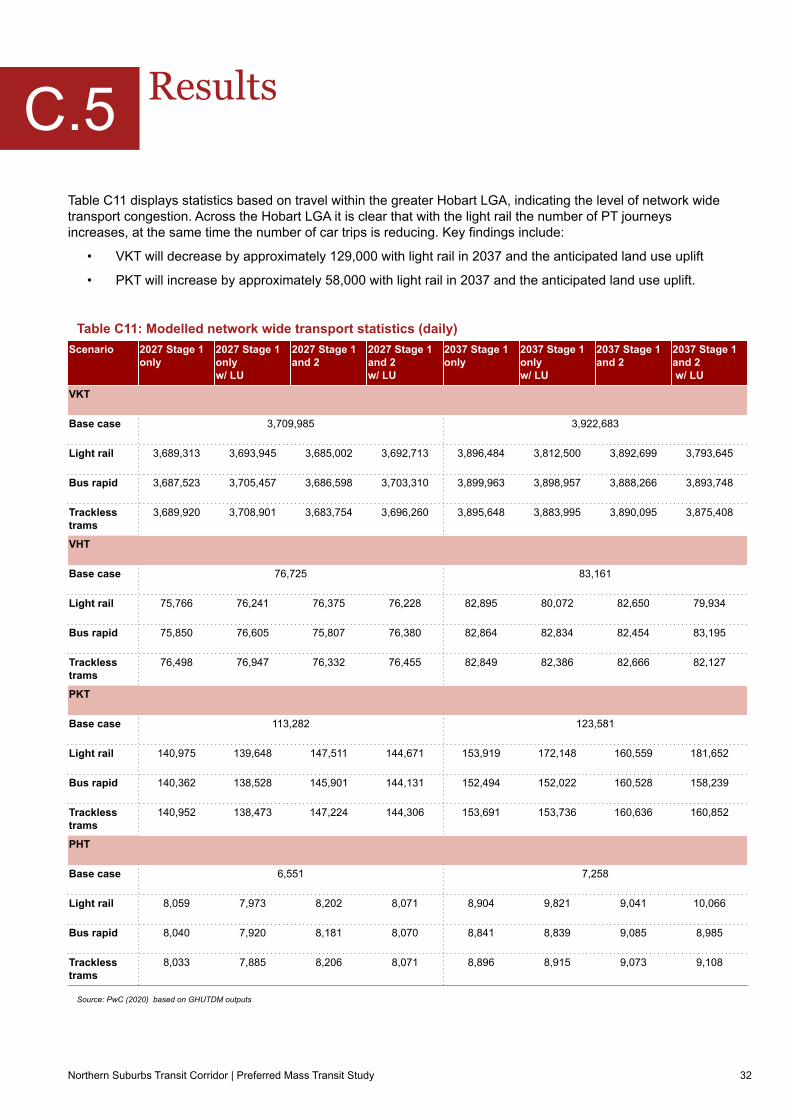
Table C11 displays statistics based on travel within the greater Hobart LGA, indicating the level of network wide transport congestion. Across the Hobart LGA it is clear that with the light rail the number of PT journeys increases, at the same time the number of car trips is reducing. Key findings include:
• VKT will decrease by approximately 129,000 with light rail in 2037 and the anticipated land use uplift
• PKT will increase by approximately 58,000 with light rail in 2037 and the anticipated land use uplift.
Results
Scenario 2027 Stage 1 only
2027 Stage 1 only w/ LU
2027 Stage 1 and 2
2027 Stage 1 and 2 w/ LU
2037 Stage 1 only
2037 Stage 1 only w/ LU
2037 Stage 1 and 2
2037 Stage 1 and 2 w/ LU
VKT
Base case 3,709,985 3,922,683
Light rail 3,689,313 3,693,945 3,685,002 3,692,713 3,896,484 3,812,500 3,892,699 3,793,645
Bus rapid 3,687,523 3,705,457 3,686,598 3,703,310 3,899,963 3,898,957 3,888,266 3,893,748
Trackless trams
3,689,920 3,708,901 3,683,754 3,696,260 3,895,648 3,883,995 3,890,095 3,875,408
VHT
Base case 76,725 83,161
Light rail 75,766 76,241 76,375 76,228 82,895 80,072 82,650 79,934
Bus rapid 75,850 76,605 75,807 76,380 82,864 82,834 82,454 83,195
Trackless trams
76,498 76,947 76,332 76,455 82,849 82,386 82,666 82,127
PKT
Base case 113,282 123,581
Light rail 140,975 139,648 147,511 144,671 153,919 172,148 160,559 181,652
Bus rapid 140,362 138,528 145,901 144,131 152,494 152,022 160,528 158,239
Trackless trams
140,952 138,473 147,224 144,306 153,691 153,736 160,636 160,852
PHT
Base case 6,551 7,258
Light rail 8,059 7,973 8,202 8,071 8,904 9,821 9,041 10,066
Bus rapid 8,040 7,920 8,181 8,070 8,841 8,839 9,085 8,985
Trackless trams
8,033 7,885 8,206 8,071 8,896 8,915 9,073 9,108
Table C11: Modelled network wide transport statistics (daily)
C.5
Source: PwC (2020) based on GHUTDM outputs
33Northern Suburbs Transit Corridor | Preferred Mass Transit Study
Results
Scenario 2027 Stage 1 only
2027 Stage 1 only w/ LU
2027 Stage 1 and 2
2027 Stage 1 and 2 w/ LU
2037 Stage 1 only
2037 Stage 1 onlyw/ LU
2037 Stage 1 and 2
2037 Stage 1 and 2 w/ LU
Hobart
Base case 38,000 40,000
Light rail 39,000 38,000 41,000 41,000 40,000 39,000 42,000 43,000
Bus rapid 39,000 39,000 41,000 41,000 40,000 40,000 42,000 43,000
Trackless trams
39,000 39,000 41,000 41,000 40,000 40,000 42,000 43,000
Moonah
Base case 27,000 27,000
Light rail 27,000 29,000 29,000 30,000 28,000 34,000 30,000 37,000
Bus rapid 27,000 28,000 28,000 28,000 28,000 30,000 28,000 30,000
Trackless trams
28,000 28,000 29,000 30,000 28,000 31,000 30,000 32,000
Glenorchy
Base case 26,000 25,000
Light rail 28,000 29,000 28,000 29,000 29,000 35,000 29,000 36,000
Bus rapid 28,000 28,000 28,000 28,000 29,000 30,000 29,000 30,000
Trackless trams
28,000 28,000 28,000 28,000 28,000 32,000 29,000 32,000
Berriedale
Base case 15,000 16,000
Light rail 17,000 18,000 17,000 18,000 17,000 23,000 17,000 24,000
Bus rapid 17,000 17,000 17,000 17,000 17,000 19,000 17,000 19,000
Trackless trams
17,000 17,000 17,000 17,000 17,000 20,000 17,000 20,000
Claremont
Base case 14,000 15,000
Light rail 14,000 14,000 25,000 26,000 15,000 15,000 26,000 32,000
Bus rapid 14,000 14,000 23,000 23,000 15,000 15,000 24,000 25,000
Trackless trams
14,000 14,000 25,000 25,000 15,000 15,000 26,000 29,000
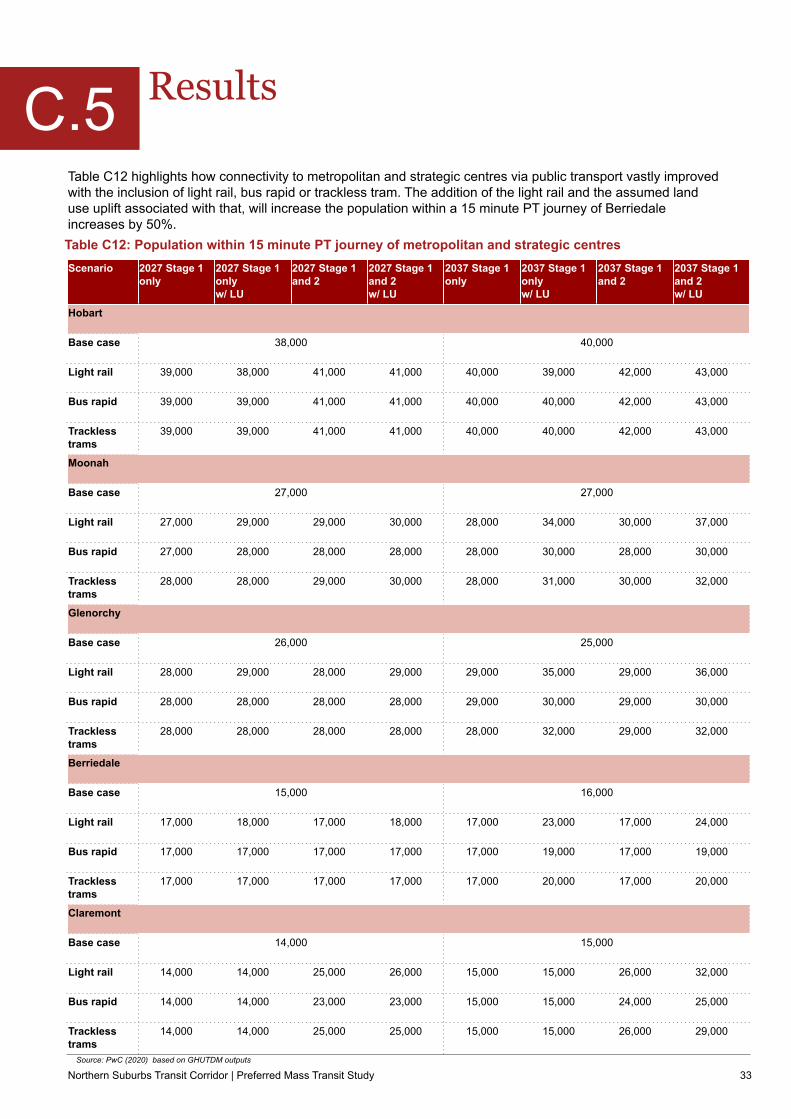
Table C12: Population within 15 minute PT journey of metropolitan and strategic centres
Table C12 highlights how connectivity to metropolitan and strategic centres via public transport vastly improved with the inclusion of light rail, bus rapid or trackless tram. The addition of the light rail and the assumed land use uplift associated with that, will increase the population within a 15 minute PT journey of Berriedale increases by 50%.
C.5
Source: PwC (2020) based on GHUTDM outputs

34Northern Suburbs Transit Corridor | Preferred Mass Transit Study
Results
Scenario 2027 Stage 1 only
2027 Stage 1 only w/ LU
2027 Stage 1 and 2
2027 Stage 1 and 2w/ LU
2037 Stage 1 only
2037 Stage 1 only w/ LU
2037 Stage 1 and 2
2037 Stage 1 and 2 w/ LU
Hobart
Base case 83,000 83,000
Light rail 90,000 91,000 93,000 94,000 92,000 97,000 95,000 100,000
Bus rapid 89,000 89,000 91,000 91,000 90,000 91,000 92,000 94,000
Trackless trams
90,000 93,000 93,000 93,000 92,000 94,000 93,000 96,000
Moonah
Base case 71,000 72,000
Light rail 73,000 73,000 75,000 76,000 75,000 81,000 77,000 83,000
Bus rapid 73,000 74,000 75,000 75,000 75,000 77,000 77,000 78,000
Trackless trams
72,000 74,000 75,000 75,000 75,000 78,000 77,000 79,000
Glenorchy
Base case 72,000 74,000
Light rail 74,000 77,000 78,000 80,000 76,000 83,000 81,000 88,000
Bus rapid 74,000 76,000 76,000 77,000 76,000 77,000 78,000 80,000
Trackless trams
76,000 76,000 78,000 79,000 76,000 78,000 78,000 82,000
Berriedale
Base case 52,000 53,000
Light rail 57,000 59,000 57,000 59,000 58,000 65,000 60,000 67,000
Bus rapid 53,000 54,000 57,000 58,000 55,000 57,000 59,000 61,000
Trackless trams
57,000 58,000 57,000 58,000 58,000 62,000 59,000 62,000
Claremont
Base case 30,000 30,000
Light rail 30,000 31,000 54,000 55,000 30,000 34,000 56,000 63,000
Bus rapid 30,000 30,000 53,000 54,000 31,000 31,000 55,000 57,000
Trackless trams
29,000 31,000 53,000 54,000 30,000 32,000 56,000 59,000
Table C13: Population within 30 minute PT journey of metropolitan and strategic centres
Table C13 highlights how connectivity to metropolitan and strategic centres via public transport vastly improved with the inclusion of light rail, bus rapid or Trackless Tram. The addition of the light rail and the assumed land use uplift associated with that, will increase the population within a 30 minute PT journey of Berriedale increases by 26%.
C.5
Source: PwC (2020) based on GHUTDM outputs
35Northern Suburbs Transit Corridor | Preferred Mass Transit Study
Results
Scenario 2027 Stage 1 only
2027 Stage 1 only w/ LU
2027 Stage 1 and 2
2027 Stage 1 and 2 w/ LU
2037 Stage 1 only
2037 Stage 1 only w/ LU
2037 Stage 1 and 2
2037 Stage 1 and 2 w/ LU
Hobart
Base case 138,000 143,000
Light rail 151,000 151,000 158,000 158,000 158,000 161,000 165,000 168,000
Bus rapid 149,000 149,000 157,000 157,000 156,000 157,000 165,000 166,000
Trackless trams
150,000 151,000 157,000 157,000 157,000 159,000 165,000 166,000
Moonah
Base case 112,000 115,000
Light rail 112,000 114,000 114,000 115,000 116,000 120,000 116,000 123,000
Bus rapid 113,000 114,000 113,000 116,000 116,000 117,000 116,000 118,000
Trackless trams
114,000 118,000 114,000 114,000 116,000 118,000 116,000 120,000
Glenorchy
Base case 110,000 113,000
Light rail 111,000 112,000 114,000 115,000 116,000 120,000 118,000 123,000
Bus rapid 110,000 111,000 112,000 112,000 115,000 117,000 116,000 117,000
Trackless trams
111,000 112,000 112,000 112,000 116,000 118,000 116,000 119,000
Berriedale
Base case 90,000 93,000
Light rail 105,000 104,000 111,000 112,000 109,000 113,000 122,000 124,000
Bus rapid 103,000 103,000 108,000 105,000 106,000 108,000 115,000 114,000
Trackless trams
103,000 104,000 107,000 107,000 107,000 109,000 120,000 119,000
Claremont
Base case 62,000 64,000
Light rail 64,000 66,000 107,000 108,000 65,000 73,000 110,000 114,000
Bus rapid 64,000 64,000 101,000 101,000 66,000 67,000 105,000 105,000
Trackless trams
62,000 65,000 103,000 103,000 65,000 68,000 106,000 108,000
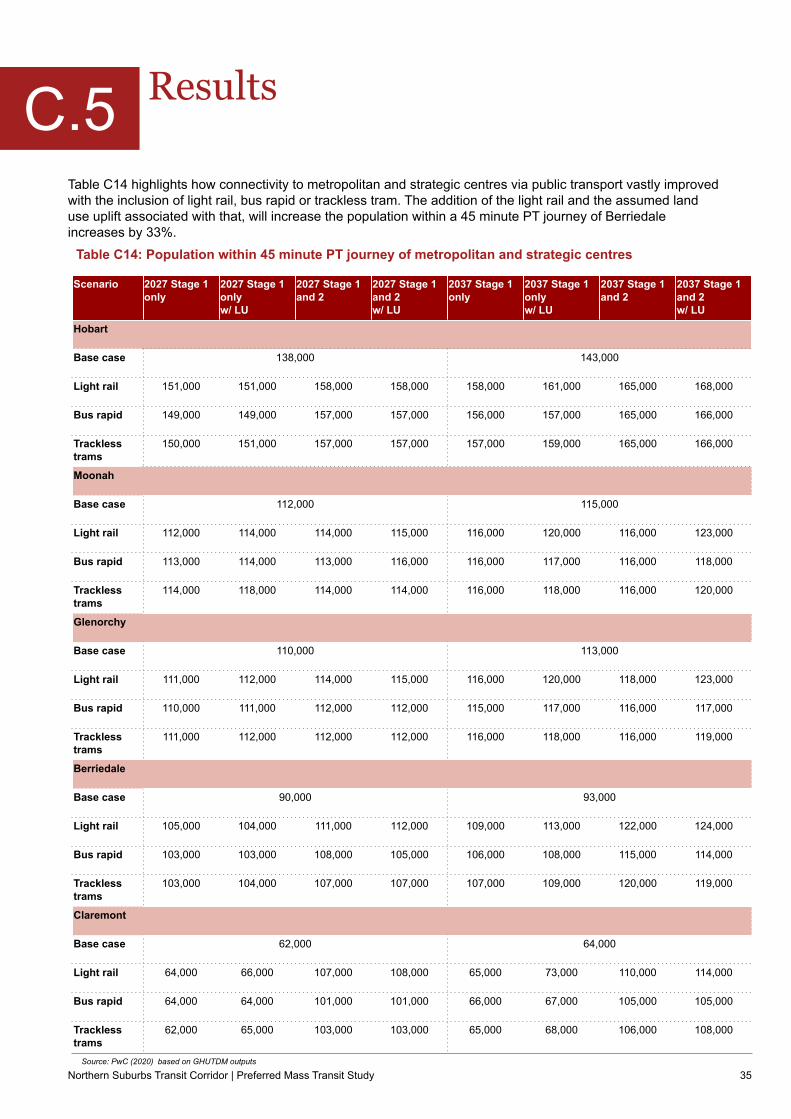
Table C14: Population within 45 minute PT journey of metropolitan and strategic centres
Table C14 highlights how connectivity to metropolitan and strategic centres via public transport vastly improved with the inclusion of light rail, bus rapid or trackless tram. The addition of the light rail and the assumed land use uplift associated with that, will increase the population within a 45 minute PT journey of Berriedale increases by 33%.
C.5
Source: PwC (2020) based on GHUTDM outputs
36Northern Suburbs Transit Corridor | Preferred Mass Transit Study
Conclusion and recommendations
The transport modelling undertaken for the Northern Suburbs Mass Transit mode study has confirmed the travel benefits to the community each project scenario demonstrates in accordance with the service requirement of the project. Model inputs for forecast years of 2027 and 2037 has been developed and confirmed through a series of workshops with representatives for the NSTC project team, Department of State Growth, Aurecon, LUTI Consulting and PwC.
The model, inclusive of the land use redistribution, indicates that the light rail project will have the largest uptake in public transport trips in comparison to the bus rapid and trackless tram project scenarios. However, without land use change the transport modes deliver a relatively similar transport service. Additionally, with the inclusion of the project scenarios Hobart would be able to further solidify a “30 minute city" benchmark.
This report documents forecasts made within the current scope of work. Through the study, PwC has identified areas of potential future work to improve the evidence base underpinning the forecasts:
● Refinement of the highway assignment process to improve the convergence. The model in its current form is not suitable for detailed economic appraisal across options that are marginally different.
● Undertake a more thorough and robust land use redistribution approach, whereby, the redistribution is informed by the planning intent of travel zones and level of transport network accessibility
● Refinement of the feeder bus service, through truncation, removal or redistribution of service kilometres of the existing bus network would likely improve project outcomes.
C.6

© 2020 PricewaterhouseCoopers Consulting (Australia) Pty Limited. All rights reserved. PwC refers to PricewaterhouseCoopers Consulting (Australia) Pty Limited, and may sometimes refer to the PwC network. Each member firm is a separate legal entity. Please see www.pwc.com/structure for further details. Liability limited by a scheme approved under Professional Standards Legislation.
www.pwc.com