Embed Size (px)
Citation preview
Transport Modelling Guidelines for Activity Centre structure plans
June 2016
Department of Transport
2
This document has been published by the Department of Transport with input from the Department of Planning, Main Roads WA and Public Transport Authority.
Contents1. Introduction 3
1.1 What is an Activity Centre? 4
1.2 What is the role of transport modelling in relation to activity centre structure plans? 4
1.3 What is the current context of strategic models in Perth? 5
2. What is the model hierarchy? 6
2.1 Macroscopic/ strategic model (ROM24, STEM) 6
2.2 Mesoscopic modelling 7
2.3 Microscopic modelling 7
3. Strategic transport planning phase 10
3.1 Stakeholder discussion 10
3.2 Data collation and collection 10
3.3 Strategic model setup 11
3.4 Option testing 13
4. Tactical transport planning phase 16
4.1 Mesoscopic model development 16
4.2 Mesoscopic model options testing 18
5. Operational transport modelling 20
5.1 Microscopic transport model development 20
5.2 Microscopic transport model option testing 21
6. Timing and cost 23
7. Glossary and reference material 26
Transport Modelling Guidelines for Activity Centre structure plans
3Transport Modelling Guidelines for Activity Centre structure plans
Transport modelling guidelines for Activity Centre structure plans
01 Introduction
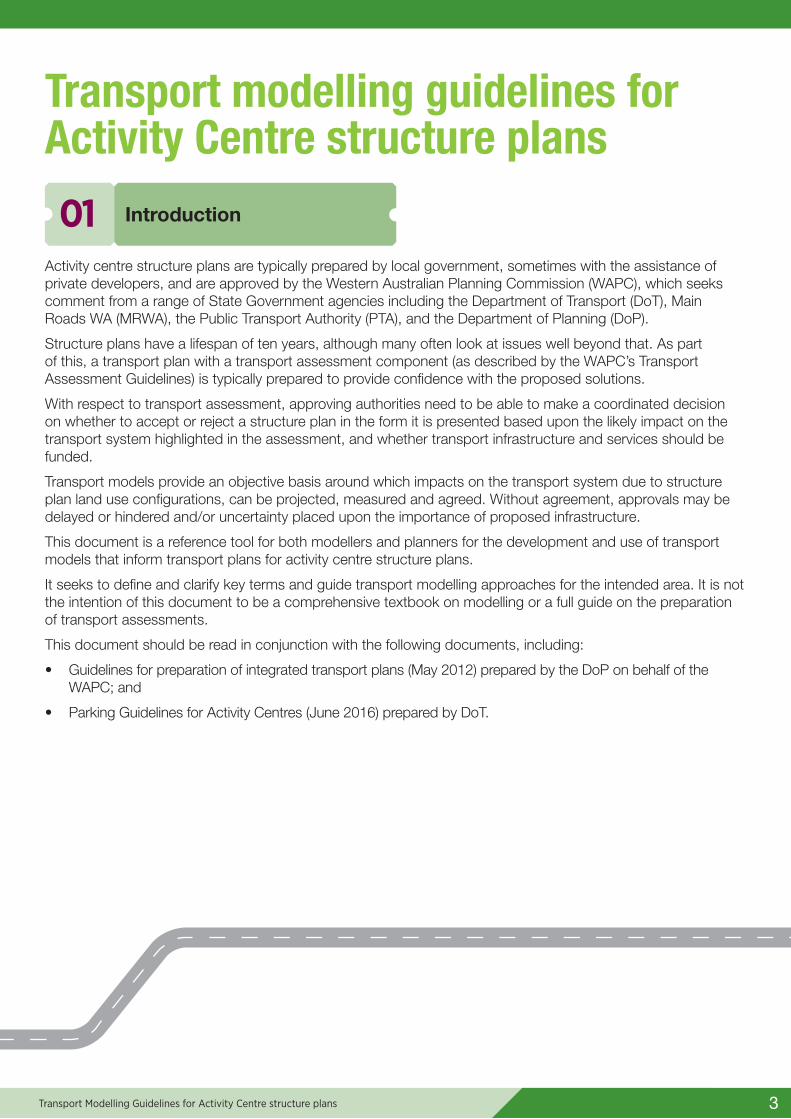
Activity centre structure plans are typically prepared by local government, sometimes with the assistance of private developers, and are approved by the Western Australian Planning Commission (WAPC), which seeks comment from a range of State Government agencies including the Department of Transport (DoT), Main Roads WA (MRWA), the Public Transport Authority (PTA), and the Department of Planning (DoP).
Structure plans have a lifespan of ten years, although many often look at issues well beyond that. As part of this, a transport plan with a transport assessment component (as described by the WAPC’s Transport Assessment Guidelines) is typically prepared to provide confidence with the proposed solutions.
With respect to transport assessment, approving authorities need to be able to make a coordinated decision on whether to accept or reject a structure plan in the form it is presented based upon the likely impact on the transport system highlighted in the assessment, and whether transport infrastructure and services should be funded.
Transport models provide an objective basis around which impacts on the transport system due to structure plan land use configurations, can be projected, measured and agreed. Without agreement, approvals may be delayed or hindered and/or uncertainty placed upon the importance of proposed infrastructure.
This document is a reference tool for both modellers and planners for the development and use of transport models that inform transport plans for activity centre structure plans.
It seeks to define and clarify key terms and guide transport modelling approaches for the intended area. It is not the intention of this document to be a comprehensive textbook on modelling or a full guide on the preparation of transport assessments.
This document should be read in conjunction with the following documents, including:
• Guidelines for preparation of integrated transport plans (May 2012) prepared by the DoP on behalf of the WAPC; and
• Parking Guidelines for Activity Centres (June 2016) prepared by DoT.
1.1 What is an Activity Centre?State Planning Policy 4.2 (WAPC, 2010) defines activity centres as community focal points. They include activities such as “commercial, retail, higher-density housing, entertainment, tourism, civic/ community, higher education, and medical services. Activity centres vary in size and diversity and are designed to be well-serviced by public transport.”
The type and spatial location for activity centres in Directions 2031 (WAPC, 2010) is broadly categorised by good existing (or future planned) public transport access (ie. close to a railway station or major bus routes) and they are often centred around existing employment, education, or retail hubs.
Business and retail also prefer good road network access, these existing hubs are typically situated close or adjacent to existing highways and or freeways.
It should be recognised that successful activity centres, by their very nature, attract activity, which can lead to increased travel and congestion. As such, it is reasonable to expect movement and vibrancy within these centres and a reasonable level of congestion on some streets during the peak periods.
1.2 What is the role of transport modelling in relation to activity centre structure plans?
Transport modelling is, by definition, intended to minimise effort in context with the importance of the decision and the risks associated with the inputs. It is a waste of effort to build a detailed or precise traffic model for a scenario where the inputs are so uncertain, whilst, similarly, it is a waste to build and use a model which is singularly unsuited for assessing a particular task.
Structure plan transport modelling exercises are always at risk of being a significant drain on resources because there are expectations on precise outputs for scenarios with significant uncertainty around the inputs. The impact of this is that it can become very expensive both in terms of time and budget.
Utilising a hierarchical transport modelling approach however, is one way of reducing both time and cost, whilst still capturing the detail in appropriate locations.
What is hierarchical transport modelling
Hierarchical transport modelling approaches are characterised by having different levels of detail, sometimes described as the macroscopic or strategic, mesoscopic and microscopic levels of resolution.
When utilised, time and cost savings are realised because each level is interlinked, ensuring high levels of model resolution only where required.
4 Transport Modelling Guidelines for Activity Centre structure plans
1.3 What is the current context of strategic models in Perth?There are currently two government owned strategic level transport models in Perth:
à Strategic Transport Evaluation Model (STEM) a conventional four stage transport model of Metropolitan Perth and Peel held within the DoT. It should be noted that there are two versions of this model, with variations in parameters and inputs, and implemented on different software packages. This model originated from a previous model called SPECTRE which focused on the modelling of travel demand.
à Regional Operations Model 24 Hours (ROM24) a conventional four stage transport model of Metropolitan Perth and Peel held within MRWA. This model has been primarily developed and used for forecasting highway demand. In general, the key differences between this model and the STEM is this model has more detailed road network modelling with more zones, but has less detail with respect to the aspects of travel demand (ie. traffic generation, mode choice and distribution).
In November 2013, the Planning and Transport Research Centre (PATREC) was appointed to conduct a comprehensive review of the transport modelling practices in Perth. The review involved evaluating the current transport modelling approaches that are typically applied when evaluating structure plans and the like; and providing a recommendation for future model development.
Based on PATREC’s findings, the DoT, MRWA and the DoP are progressing with the development of one new, strategic integrated transport model that will provide full hierarchical transport modelling support.
In absence of this proposed strategic transport model, this document provides guidance through a hierarchical approach (highlighted in Figure 2) to the transport modelling of activity centre structure plans using the existing ROM24 and STEM. Descriptions of each task are outlined in this document.
5Transport Modelling Guidelines for Activity Centre structure plans
6
02 What is the model hierarchy?
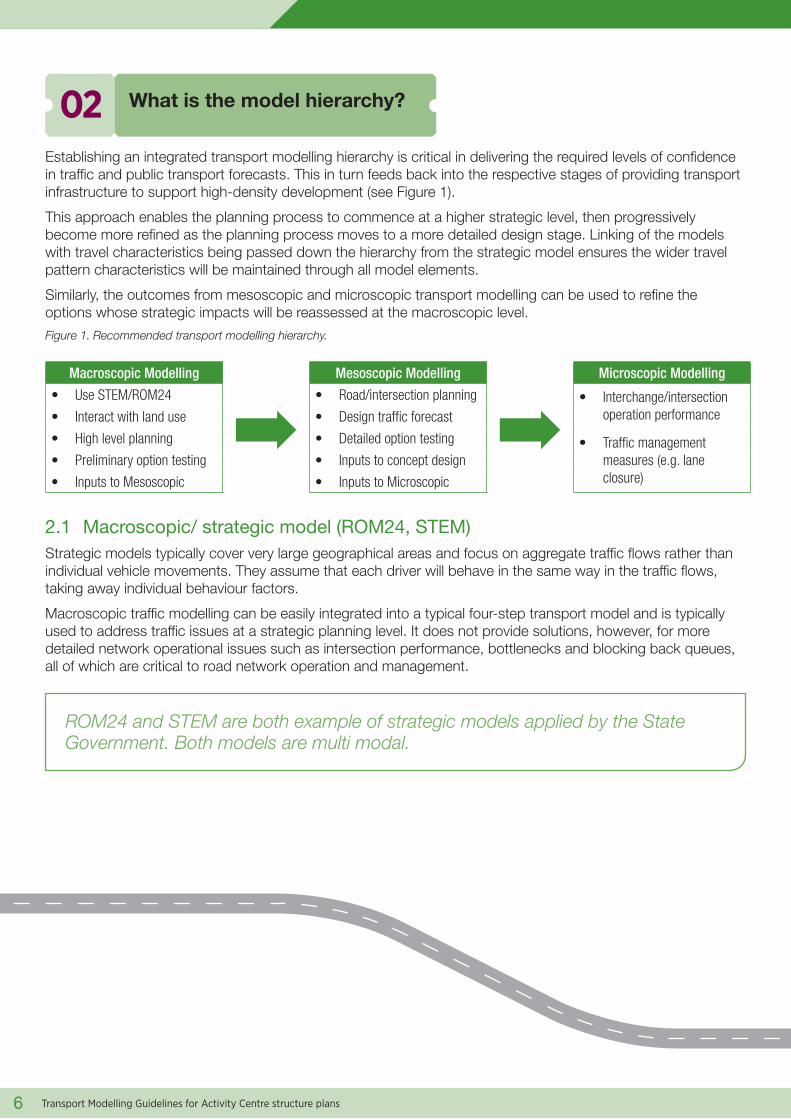
Establishing an integrated transport modelling hierarchy is critical in delivering the required levels of confidence in traffic and public transport forecasts. This in turn feeds back into the respective stages of providing transport infrastructure to support high-density development (see Figure 1).
This approach enables the planning process to commence at a higher strategic level, then progressively become more refined as the planning process moves to a more detailed design stage. Linking of the models with travel characteristics being passed down the hierarchy from the strategic model ensures the wider travel pattern characteristics will be maintained through all model elements.
Similarly, the outcomes from mesoscopic and microscopic transport modelling can be used to refine the options whose strategic impacts will be reassessed at the macroscopic level.
Figure 1. Recommended transport modelling hierarchy.
Macroscopic Modelling
➡Mesoscopic Modelling
➡Microscopic Modelling
• Use STEM/ROM24 • Road/intersection planning • Interchange/intersection operation performance• Interact with land use • Design traffic forecast
• High level planning • Detailed option testing • Traffic management measures (e.g. lane closure)
• Preliminary option testing • Inputs to concept design
• Inputs to Mesoscopic • Inputs to Microscopic
2.1 Macroscopic/ strategic model (ROM24, STEM)Strategic models typically cover very large geographical areas and focus on aggregate traffic flows rather than individual vehicle movements. They assume that each driver will behave in the same way in the traffic flows, taking away individual behaviour factors.
Macroscopic traffic modelling can be easily integrated into a typical four-step transport model and is typically used to address traffic issues at a strategic planning level. It does not provide solutions, however, for more detailed network operational issues such as intersection performance, bottlenecks and blocking back queues, all of which are critical to road network operation and management.
ROM24 and STEM are both example of strategic models applied by the State Government. Both models are multi modal.
Transport Modelling Guidelines for Activity Centre structure plans
7
2.2 Mesoscopic modellingMesoscopic transport modelling fills the gap between the upper level strategic model and the lower level microscopic models. This also means that mesoscopic modelling techniques can be based on either incorporating finer details into macroscopic modelling or simplifying microscopic modelling. Mesoscopic models have less computational demands than microscopic simulation models and hence have faster run times over larger areas, allowing the testing of more scenarios over a shorter period of time, whilst providing much more detail than a typical strategic model.
It should be noted that there is, in parallel, an emerging need for mesoscopic level transport modelling especially as a tool for modelling congestion management strategies, in the context of real time traffic management. Mesoscopic models excel in this area because they provide a comprehensive tool by which route diversion over a wide area in dynamic conditions (e.g. emergency lane closures) can be evaluated, whilst reasonable run times that allow traffic system operators the ability to respond near real time are maintained.
In summary, mesoscopic transport modelling is considered to be an effective traffic operational assessment tool for a sizable network where macroscopic modelling is too coarse, and microscopic transport modelling is too costly and inefficient.
The developed mesoscopic transport model is typically calibrated and validated to the observed travel conditions (in terms of both traffic counts and travel times) in the base year. The objective for such a transport model is to provide more reliable forecasts of link and turn volumes for input to option assessment and concept design. It will also provide inputs such as traffic origin / destination (O-D) matrices and turning movements for microsimulation modelling and/or intersection analysis using tools like SIDRA.
2.3 Microscopic modellingRather than assessing general traffic flow as a whole, as is the case with macroscopic transport modelling, these models simulate movements of individual vehicles on a given road network.
Microsimulation has become increasingly popular for more detailed operational analysis of a transport interchange, a section of road corridor or a small network with limited route choices. It can provide a better understanding of the causes of bottlenecks and congestion - particularly those caused by driver behaviour such as lane changing, merge/diverge - and then provide a tool to test a variety of treatments that may improve the efficiency of travel through the area.
Whilst the level of detail obtained is the advantage of microsimulation, it also becomes the disadvantage in certain situations. Simulating individual vehicles and tracking their movements across the network requires significant time, money and data. In addition to the requirement for more detailed network presentation and more disaggregate traffic demand profiles, it can be very time consuming to calibrate / validate a microsimulation model with large number of variables.
Modelling of route choice is a known weakness of microscopic models because the route choices determined by microscopic transport models can be either unstable (overly sensitive) or unrealistic. It requires a significant transport modelling effort to ensure realistic route choices when model runs finally converge. Therefore, microscopic transport modelling is not recommended for large networks.
Transport Modelling Guidelines for Activity Centre structure plans
8 Transport Modelling Guidelines for Activity Centre structure plans
Transport Planning Process
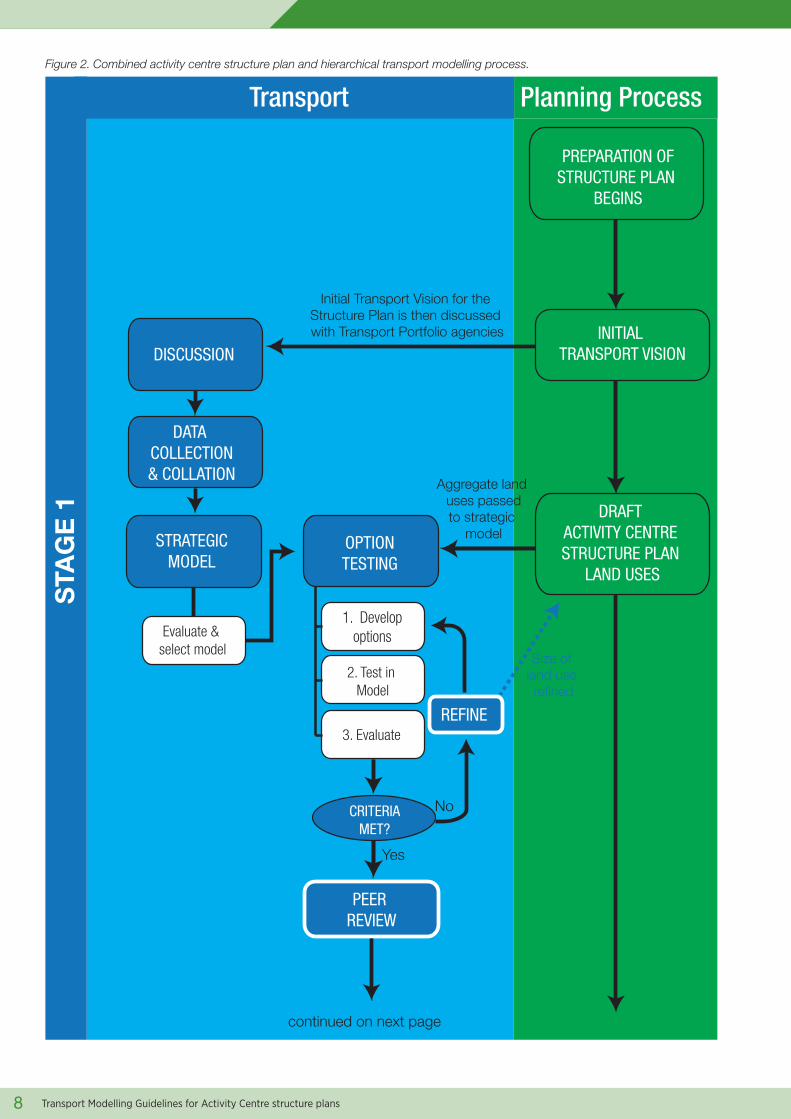
DISCUSSION
DATA COLLECTION& COLLATION
STRATEGICMODEL
Evaluate & select model
OPTIONTESTING
1. Develop options
2. Test in Model
3. Evaluate
Yes
REFINE
No
Aggregate land uses passedto strategic
model
Initial Transport Vision for the Structure Plan is then discussed with Transport Portfolio agencies
PEER REVIEW
STA
GE
1
continued on next page
CRITERIAMET?
Size of land use refined
PREPARATION OFSTRUCTURE PLAN
BEGINS
INITIAL TRANSPORT VISION
DRAFT ACTIVITY CENTRE STRUCTURE PLAN
LAND USES
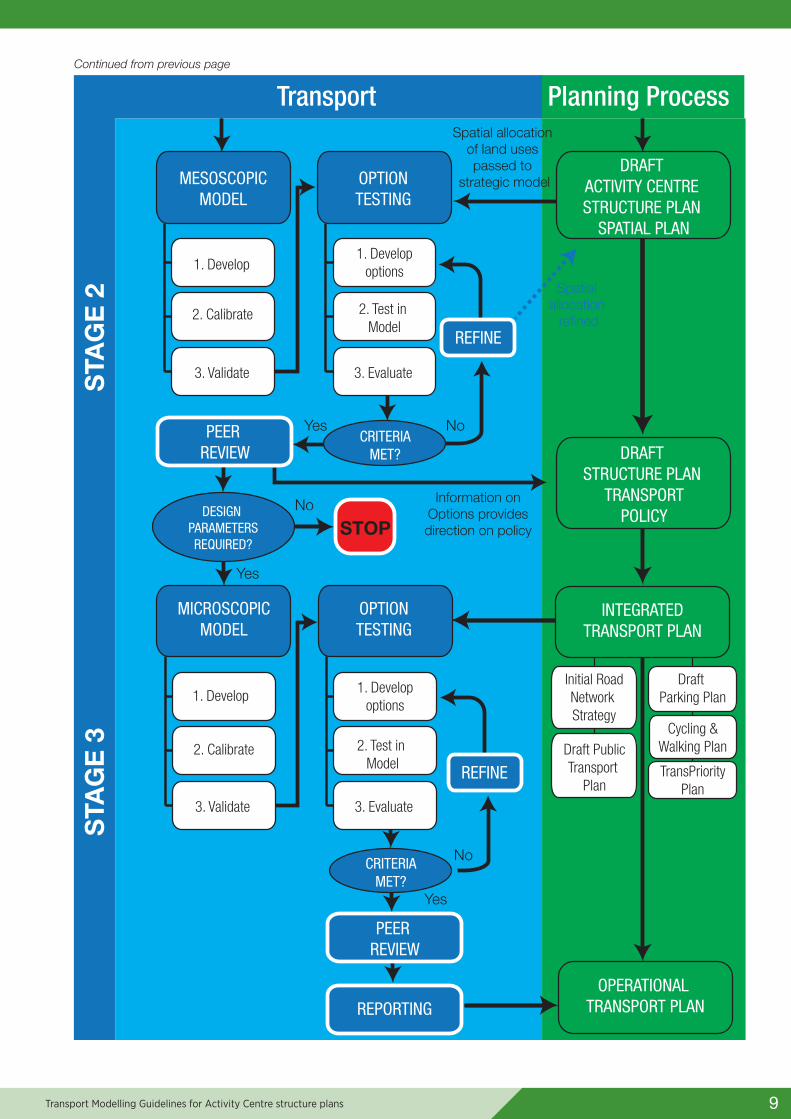
Figure 2. Combined activity centre structure plan and hierarchical transport modelling process.
9
DRAFT ACTIVITY CENTRE STRUCTURE PLAN
SPATIAL PLAN
MESOSCOPICMODEL
1. Develop
2. Calibrate
3. Validate
OPTIONTESTING
1. Developoptions
2. Test in Model
3. Evaluate
Yes
REFINE
NoPEER REVIEW
STOP
CRITERIAMET?
DESIGN PARAMETERSREQUIRED?
No
Yes
MICROSCOPICMODEL
1. Develop
2. Calibrate
3. Validate
OPTIONTESTING
1. Developoptions
3. Evaluate
2. Test in Model
REFINE
CRITERIAMET?
PEER REVIEW
REPORTING
Yes
No
DRAFT STRUCTURE PLAN
TRANSPORTPOLICY
INTEGRATEDTRANSPORT PLAN
Initial RoadNetwork Strategy
Draft Parking Plan
Draft PublicTransport
Plan
Cycling &Walking Plan
TransPriorityPlan
OPERATIONAL TRANSPORT PLAN
Information onOptions providesdirection on policy
Transport Planning ProcessS
TAG
E 2
STA
GE
3
Spatial allocation
refined
Spatial allocation of land uses passed to
strategic model
Continued from previous page
Transport Modelling Guidelines for Activity Centre structure plans
10
03 Strategic transport planning phase
3.1 Stakeholder discussionPrior to any transport modelling discussion, the preliminary transport vision for the Activity Centre should be defined with input from the Transport portfolio (comprised of DoT, PTA, and MRWA) and other key agencies. This vision should identify the key elements (preceding any transport modelling effort) such as:
à What is the hierarchy of users within the Centre, on various roads, at a given time period?
à How is the demand going to be managed?
à Where, if anywhere, would additional capacity in the form of infrastructure or service provision be provided?
à How would any additional infrastructure be funded?
The scope of the model and the scope of the data collection that is required should be established by a representative of the developer’s consulting team at a scoping meeting with representation from the Transport Portfolio, the DoP and a representative from the relevant local government(s). In particular, the Major Urban Centres Branch of the DoT and the MRWA Planning Branch should be consulted.
It is recognised that getting representation from all of these agencies may be difficult. Therefore, the applicant should liaise with each and identify and agree a point/s of co-ordination and leadership across all agencies (referred to herein as the Agency Leader). It is important that these agencies work together.
As part of the upfront discussion, the following components of the transport modelling should be established and agreed upon:
à evaluation criteria for each stage of transport modelling (refer to Tables 2, 5 and 8);
à the spatial scope of the transport models at the strategic and tactical levels;
à the time periods that the transport models represent; and
à an appropriate auditor1 to assist with the entire transport modelling process.
3.2 Data collation and collectionThere are a number of broad survey types that can be collected to assist in transport model development such as:
à Data on the transport network, including physical layout, number of lanes, capacities (either road network or public transport), signal timings and public transport routes and frequencies, parking provision and charges;
à Counts of persons at entry points or accessing / egressing public transport or vehicle movements at centre access points, midblock or at intersections;
à Parking occupancy and length of stay data;
à Journey times (either public transport, pedestrian or general vehicle);
à Origin destination surveys; and
à Interview surveys, in which transport users describe their travel behaviour (either that they have made or would make) through household travel diaries, intercept surveys or web-based surveys.
1 An auditor is someone who checks the model and its parameters to verify if any erroneous inputs have been used. A peer reviewer is someone who reviews the methodology and outcomes, assessing risks, rather than specific inputs into the model (as opposed to an auditor). Depending upon the size and scope of the project it may be appropriate for the auditor and peer reviewer to be one and the same person.
Transport Modelling Guidelines for Activity Centre structure plans
11
The first four data types can be collected in relatively large quantities from a range of sources at relatively little cost. However, the data is limited because it does not provide the relevant information that informs the weakest inputs into the model, such as trip purpose, destination choice, mode choice, and time of departure choice. As such, more comprehensive and expensive data collection is often required to develop more robust transport models, such as targeted electronic surveys and in person interviews. These are discussed in more detail below:
Electronic surveys - In some activity centres, travel to mandatory computer based activities (ie. white collar work, education purposes) can often be surveyed most cost effectively and timely through email based surveys where employee lists are available. For example, most universities have access to all emails of employees and students.
Previous studies have suggested that these surveys can achieve above 10 per cent sample rate within three days of issue of emails.
The negative of this survey approach is that it may have significant sample bias.
In person interviews - In retail focused activity centres, door intercept or car parking surveys can be used to capture (and disaggregate) the travel patterns of both mandatory and discretionary travel. These surveys are best undertaken as interview surveys as experienced and persuasive interviewers can often achieve reasonable sample rates and are not so exposed to sample bias.
A potentially cheaper alternative is to use a survey hand out with a link to a mail and/or web-based return mechanism. This approach requires some incentive to obtain a high sample rate, and again may suffer sample bias depending on the return mechanism and the incentive.
The significant benefits of both survey types described are that they can expose both revealed preference and stated preference data about trip purpose, destination choice, mode choice and time of departure choice. Stated preference data should be collected in instances where mitigation options not currently available may be implemented.
For example, a shopping centre that does not currently have a car parking pricing policy may use a series of stated preference questions to test the willingness to pay for particular schemes.
3.3 Strategic model setupStrategic models are designed to project changes in travel demand based upon changes in land use, highway/arterial road network and broad public transport network characteristics.
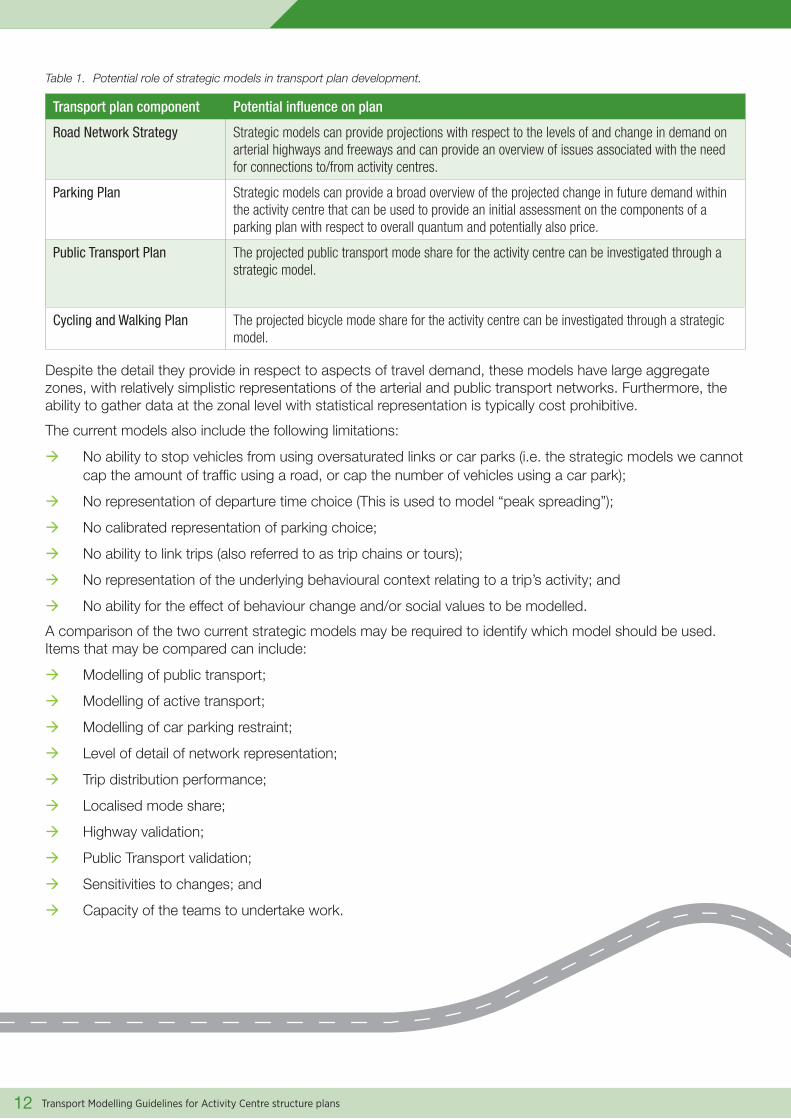
Strategic models typically provide broad-brush information with respect to changes in demand associated with particular land use choice, highway network and major public transport infrastructure provision. Table 1 lists the aspects that strategic models can potentially assist with.
At the time of writing, there are two strategic transport models available via the Transport Portfolio – ROM24 and STEM.
Because of their emphasis on modelling demand, these models have parameters that have been calibrated associated with reflecting observed values in the following areas:
à trip generation at a household level;
à trip length frequency across the Metropolitan Perth and Peel; and
à mode choice across the Metropolitan Perth and Peel.
Transport Modelling Guidelines for Activity Centre structure plans
12
Table 1. Potential role of strategic models in transport plan development.
Transport plan component Potential influence on plan
Road Network Strategy Strategic models can provide projections with respect to the levels of and change in demand on arterial highways and freeways and can provide an overview of issues associated with the need for connections to/from activity centres.
Parking Plan Strategic models can provide a broad overview of the projected change in future demand within the activity centre that can be used to provide an initial assessment on the components of a parking plan with respect to overall quantum and potentially also price.
Public Transport Plan The projected public transport mode share for the activity centre can be investigated through a strategic model.
Cycling and Walking Plan The projected bicycle mode share for the activity centre can be investigated through a strategic model.
Despite the detail they provide in respect to aspects of travel demand, these models have large aggregate zones, with relatively simplistic representations of the arterial and public transport networks. Furthermore, the ability to gather data at the zonal level with statistical representation is typically cost prohibitive.
The current models also include the following limitations:
à No ability to stop vehicles from using oversaturated links or car parks (i.e. the strategic models we cannot cap the amount of traffic using a road, or cap the number of vehicles using a car park);
à No representation of departure time choice (This is used to model “peak spreading”);
à No calibrated representation of parking choice;
à No ability to link trips (also referred to as trip chains or tours);
à No representation of the underlying behavioural context relating to a trip’s activity; and
à No ability for the effect of behaviour change and/or social values to be modelled.
A comparison of the two current strategic models may be required to identify which model should be used. Items that may be compared can include:
à Modelling of public transport;
à Modelling of active transport;
à Modelling of car parking restraint;
à Level of detail of network representation;
à Trip distribution performance;
à Localised mode share;
à Highway validation;
à Public Transport validation;
à Sensitivities to changes; and
à Capacity of the teams to undertake work.
Transport Modelling Guidelines for Activity Centre structure plans
13
3.4 Option testingBefore undertaking any future traffic or public transport projections, a number of options would need to first be identified for testing. At a strategic level, ideally a range of options are chosen that elicit the sensitivity of changes in demand drivers (land uses, parking price, parking restraint, etc.) and major transport infrastructure.
Such things may include:
à changes in highways or primary arterials, their mid-block capacities and their associated connections; and
à new rail connections or high frequency on road public transport.
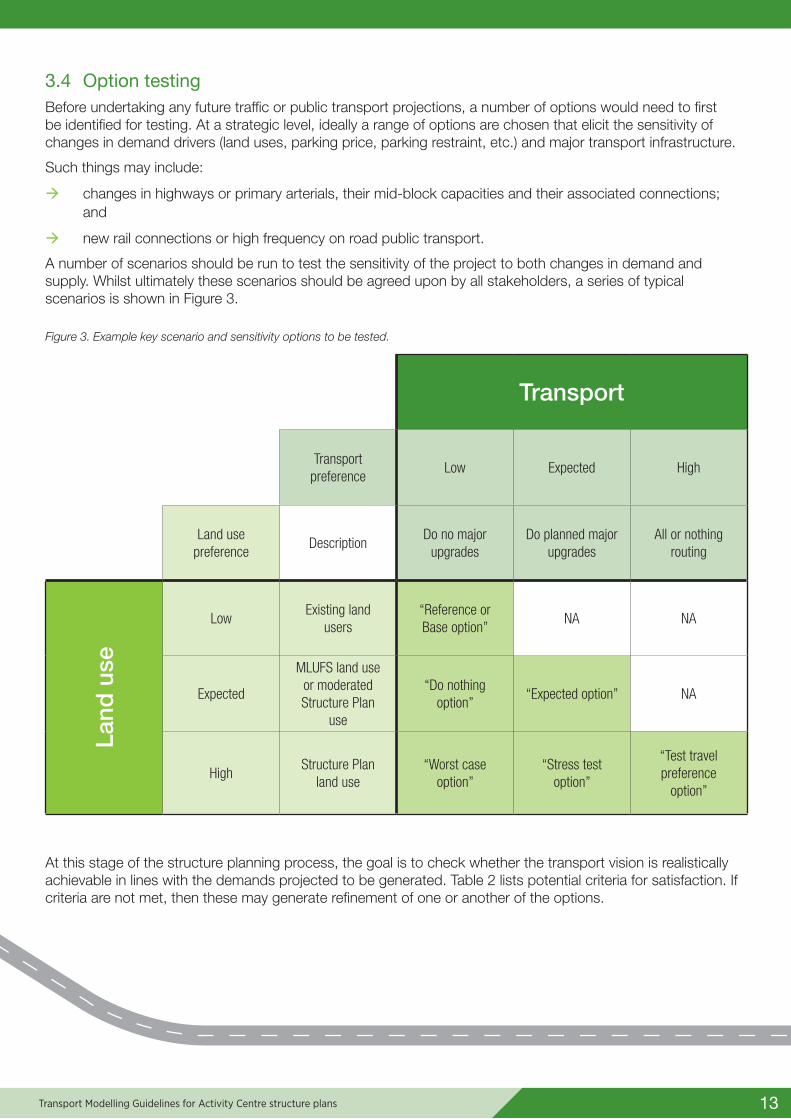
A number of scenarios should be run to test the sensitivity of the project to both changes in demand and supply. Whilst ultimately these scenarios should be agreed upon by all stakeholders, a series of typical scenarios is shown in Figure 3.
Figure 3. Example key scenario and sensitivity options to be tested.
Transport
Transport preference
Low Expected High
Land use preference
DescriptionDo no major
upgradesDo planned major
upgradesAll or nothing
routing
Land
use
LowExisting land
users“Reference or Base option”
NA NA
Expected
MLUFS land use or moderated Structure Plan
use
“Do nothing option”
“Expected option” NA
HighStructure Plan
land use“Worst case
option”“Stress test
option”
“Test travel preference
option”
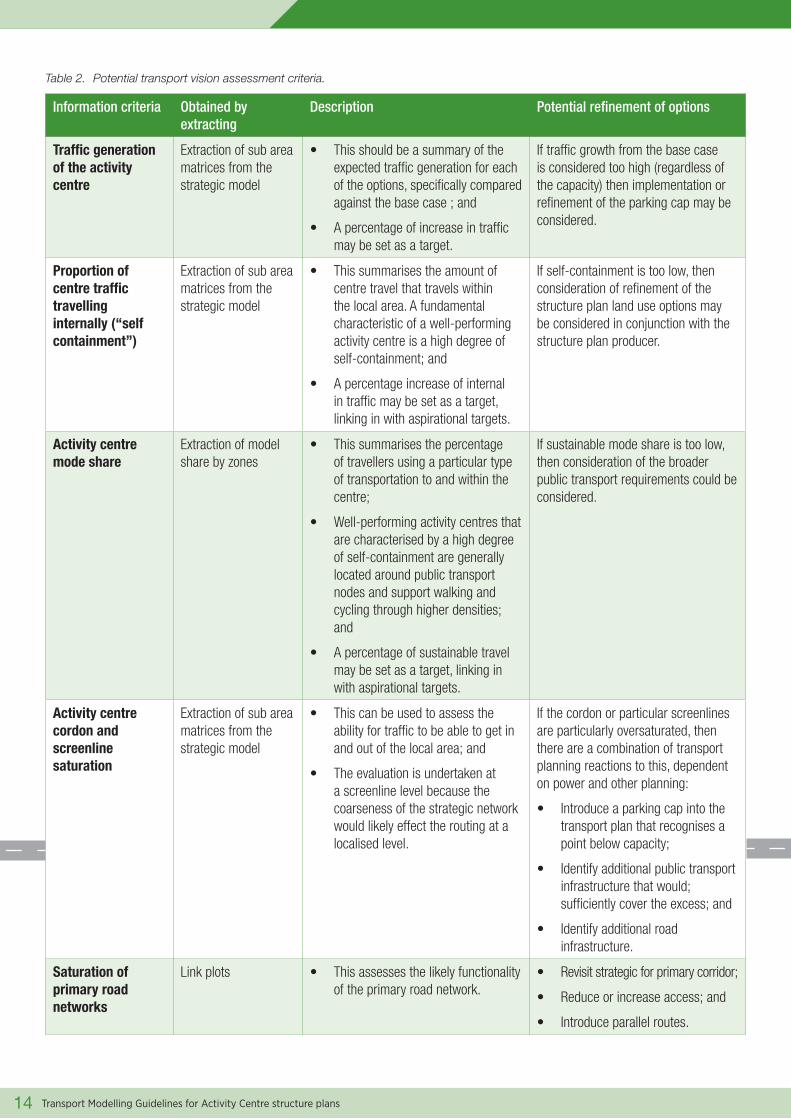
At this stage of the structure planning process, the goal is to check whether the transport vision is realistically achievable in lines with the demands projected to be generated. Table 2 lists potential criteria for satisfaction. If criteria are not met, then these may generate refinement of one or another of the options.
Transport Modelling Guidelines for Activity Centre structure plans
14
Table 2. Potential transport vision assessment criteria.
Information criteria Obtained by extracting
Description Potential refinement of options
Traffic generation of the activity centre
Extraction of sub area matrices from the strategic model
• This should be a summary of the expected traffic generation for each of the options, specifically compared against the base case ; and
• A percentage of increase in traffic may be set as a target.
If traffic growth from the base case is considered too high (regardless of the capacity) then implementation or refinement of the parking cap may be considered.
Proportion of centre traffic travelling internally (“self containment”)
Extraction of sub area matrices from the strategic model
• This summarises the amount of centre travel that travels within the local area. A fundamental characteristic of a well-performing activity centre is a high degree of self-containment; and
• A percentage increase of internal in traffic may be set as a target, linking in with aspirational targets.
If self-containment is too low, then consideration of refinement of the structure plan land use options may be considered in conjunction with the structure plan producer.
Activity centre mode share
Extraction of model share by zones
• This summarises the percentage of travellers using a particular type of transportation to and within the centre;
• Well-performing activity centres that are characterised by a high degree of self-containment are generally located around public transport nodes and support walking and cycling through higher densities; and
• A percentage of sustainable travel may be set as a target, linking in with aspirational targets.
If sustainable mode share is too low, then consideration of the broader public transport requirements could be considered.
Activity centre cordon and screenline saturation
Extraction of sub area matrices from the strategic model
• This can be used to assess the ability for traffic to be able to get in and out of the local area; and
• The evaluation is undertaken at a screenline level because the coarseness of the strategic network would likely effect the routing at a localised level.
If the cordon or particular screenlines are particularly oversaturated, then there are a combination of transport planning reactions to this, dependent on power and other planning:
• Introduce a parking cap into the transport plan that recognises a point below capacity;
• Identify additional public transport infrastructure that would; sufficiently cover the excess; and
• Identify additional road infrastructure.
Saturation of primary road networks
Link plots • This assesses the likely functionality of the primary road network.
• Revisit strategic for primary corridor;
• Reduce or increase access; and
• Introduce parallel routes.
Transport Modelling Guidelines for Activity Centre structure plans
15
As suggested in Table 2, left, significant issues identified through abnormal criteria may flag refinement of the options. It is recommended that the project owner consider how likely this is to be, as typically model developers will stipulate a set number of iterations.
A peer review should be undertaken (and a report provided) to provide a sense check on the validity of the key assumptions that have been made and the reasonableness of the model outcomes.
In particular, the following should be considered:
à the reasonableness of the travel generation;
à the reasonableness of the distribution to/from accesses;
à any assumptions or modelling with respect to changes associated with demand management measures; and
à any other innovative ideas that should be considered.
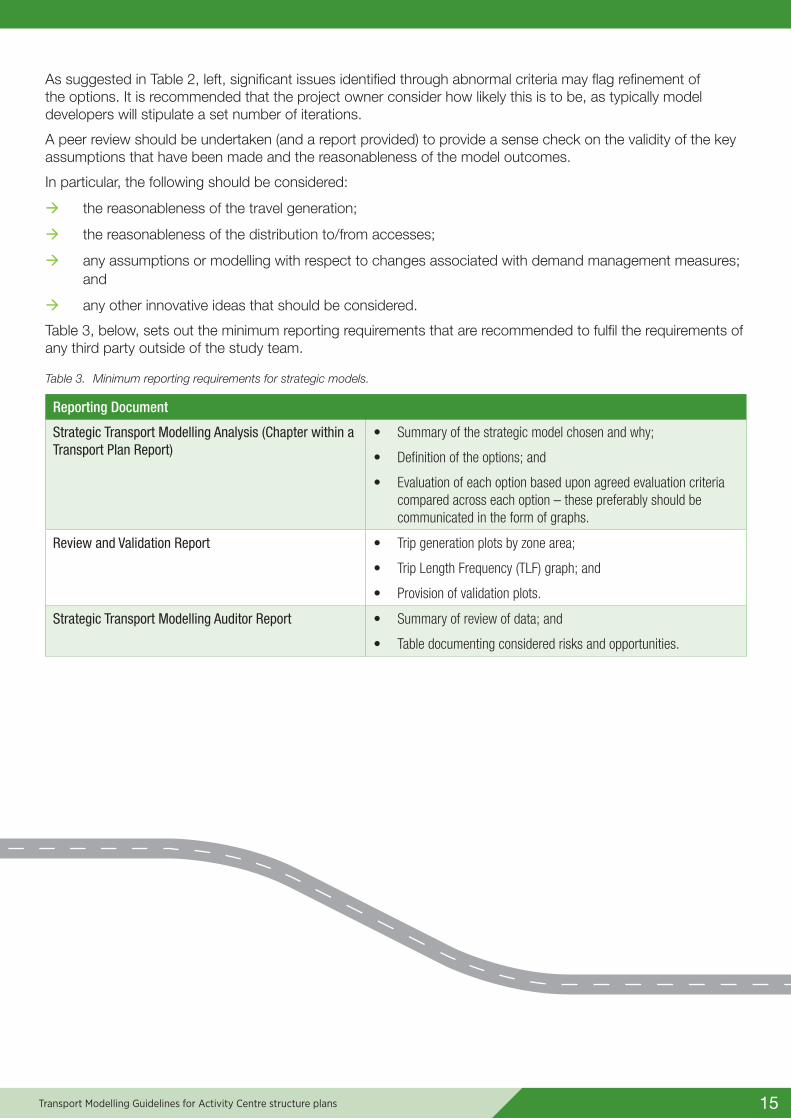
Table 3, below, sets out the minimum reporting requirements that are recommended to fulfil the requirements of any third party outside of the study team.
Table 3. Minimum reporting requirements for strategic models.
Reporting Document
Strategic Transport Modelling Analysis (Chapter within a Transport Plan Report)
• Summary of the strategic model chosen and why;
• Definition of the options; and
• Evaluation of each option based upon agreed evaluation criteria compared across each option – these preferably should be communicated in the form of graphs.
Review and Validation Report • Trip generation plots by zone area;
• Trip Length Frequency (TLF) graph; and
• Provision of validation plots.
Strategic Transport Modelling Auditor Report • Summary of review of data; and
• Table documenting considered risks and opportunities.
Transport Modelling Guidelines for Activity Centre structure plans
16
04 Tactical transport planning phase
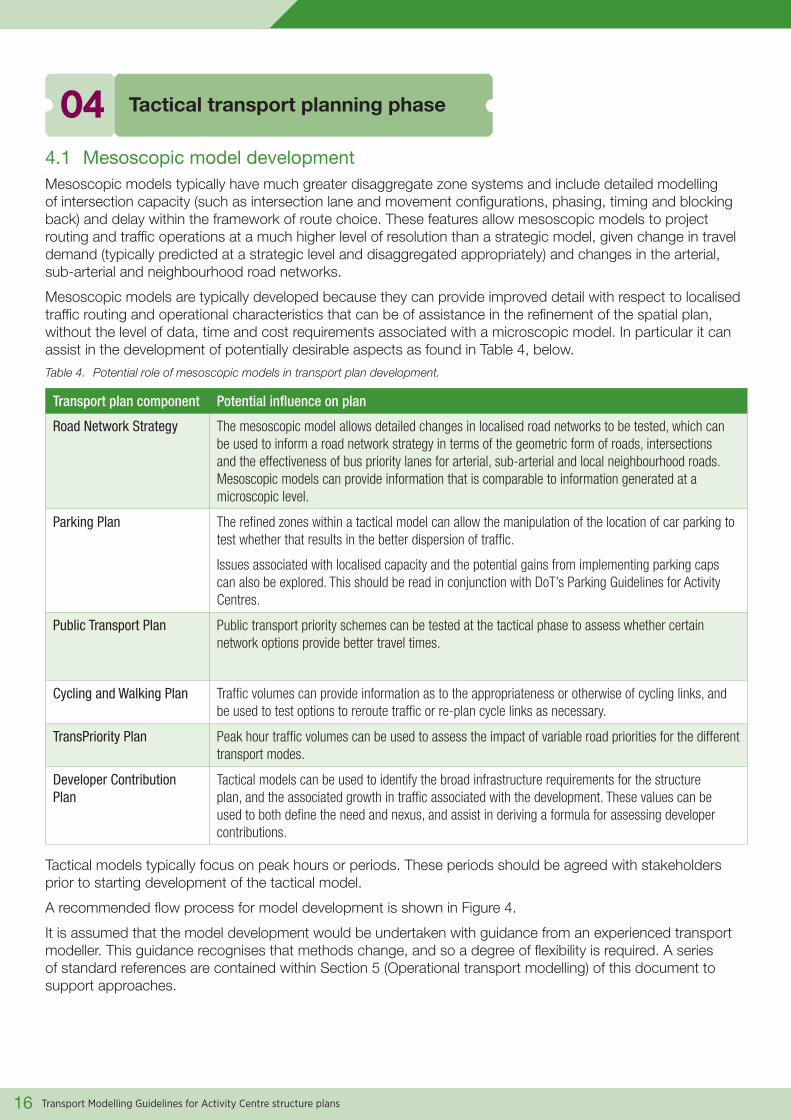
4.1 Mesoscopic model developmentMesoscopic models typically have much greater disaggregate zone systems and include detailed modelling of intersection capacity (such as intersection lane and movement configurations, phasing, timing and blocking back) and delay within the framework of route choice. These features allow mesoscopic models to project routing and traffic operations at a much higher level of resolution than a strategic model, given change in travel demand (typically predicted at a strategic level and disaggregated appropriately) and changes in the arterial, sub-arterial and neighbourhood road networks.
Mesoscopic models are typically developed because they can provide improved detail with respect to localised traffic routing and operational characteristics that can be of assistance in the refinement of the spatial plan, without the level of data, time and cost requirements associated with a microscopic model. In particular it can assist in the development of potentially desirable aspects as found in Table 4, below.
Table 4. Potential role of mesoscopic models in transport plan development.
Transport plan component Potential influence on plan
Road Network Strategy The mesoscopic model allows detailed changes in localised road networks to be tested, which can be used to inform a road network strategy in terms of the geometric form of roads, intersections and the effectiveness of bus priority lanes for arterial, sub-arterial and local neighbourhood roads. Mesoscopic models can provide information that is comparable to information generated at a microscopic level.
Parking Plan The refined zones within a tactical model can allow the manipulation of the location of car parking to test whether that results in the better dispersion of traffic.
Issues associated with localised capacity and the potential gains from implementing parking caps can also be explored. This should be read in conjunction with DoT’s Parking Guidelines for Activity Centres.
Public Transport Plan Public transport priority schemes can be tested at the tactical phase to assess whether certain network options provide better travel times.
Cycling and Walking Plan Traffic volumes can provide information as to the appropriateness or otherwise of cycling links, and be used to test options to reroute traffic or re-plan cycle links as necessary.
TransPriority Plan Peak hour traffic volumes can be used to assess the impact of variable road priorities for the different transport modes.
Developer Contribution Plan
Tactical models can be used to identify the broad infrastructure requirements for the structure plan, and the associated growth in traffic associated with the development. These values can be used to both define the need and nexus, and assist in deriving a formula for assessing developer contributions.
Tactical models typically focus on peak hours or periods. These periods should be agreed with stakeholders prior to starting development of the tactical model.
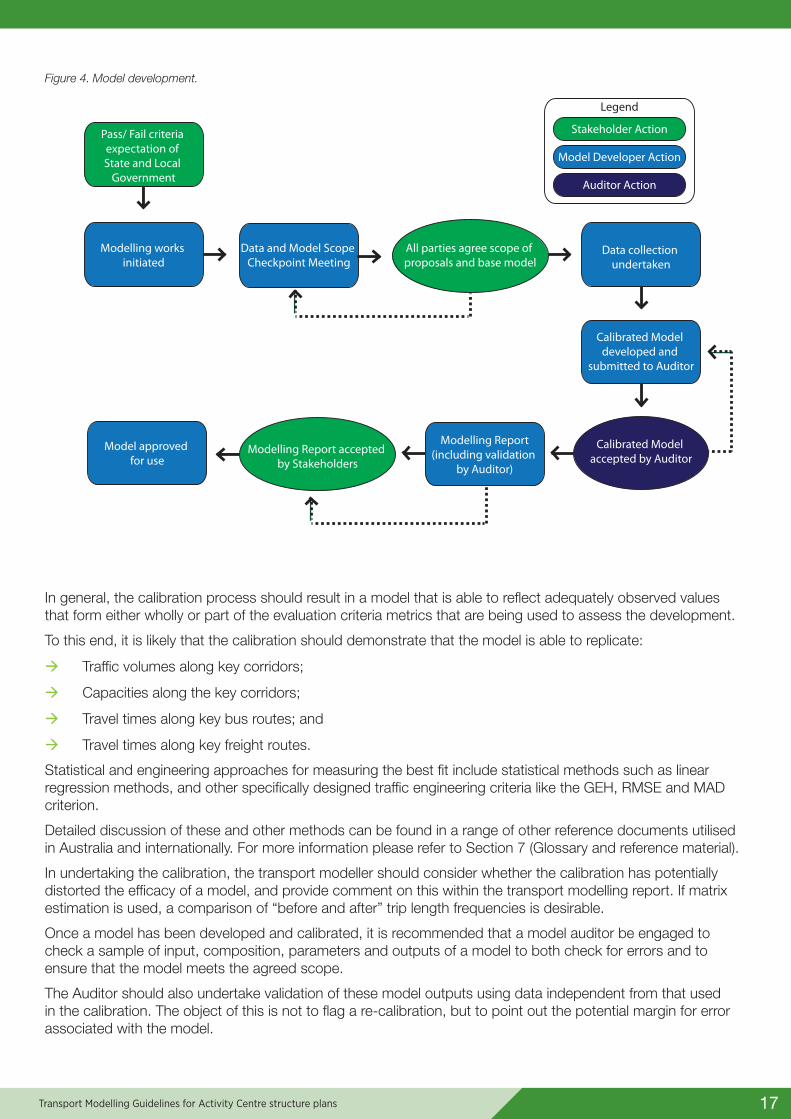
A recommended flow process for model development is shown in Figure 4.
It is assumed that the model development would be undertaken with guidance from an experienced transport modeller. This guidance recognises that methods change, and so a degree of flexibility is required. A series of standard references are contained within Section 5 (Operational transport modelling) of this document to support approaches.
Transport Modelling Guidelines for Activity Centre structure plans
17
Figure 4. Model development.
Pass/ Fail criteria expectation of State and Local
Government
Modelling works initiated
Data and Model Scope Checkpoint Meeting
All parties agree scope of proposals and base model
Data collection undertaken
Calibrated Model developed and
submitted to Auditor
Calibrated Model accepted by Auditor
Modelling Report(including validation
by Auditor)
Modelling Report accepted by Stakeholders
Model approved for use
Legend
Stakeholder Action
Model Developer Action
Auditor Action
Legend
Stakeholder Action
Model Developer Action
Peer Review Action
1. Preliminary Modelling
for the Options
2. Proposed OptionsCheckpoint Meeting
All parties agree scope of proposals and base model
3. Proposed Options Modelling submitted
for Peer Review
Proposed Options Models accepted
4. Proposed OptionsModelling Report
In general, the calibration process should result in a model that is able to reflect adequately observed values that form either wholly or part of the evaluation criteria metrics that are being used to assess the development.
To this end, it is likely that the calibration should demonstrate that the model is able to replicate:
à Traffic volumes along key corridors;
à Capacities along the key corridors;
à Travel times along key bus routes; and
à Travel times along key freight routes.
Statistical and engineering approaches for measuring the best fit include statistical methods such as linear regression methods, and other specifically designed traffic engineering criteria like the GEH, RMSE and MAD criterion.
Detailed discussion of these and other methods can be found in a range of other reference documents utilised in Australia and internationally. For more information please refer to Section 7 (Glossary and reference material).
In undertaking the calibration, the transport modeller should consider whether the calibration has potentially distorted the efficacy of a model, and provide comment on this within the transport modelling report. If matrix estimation is used, a comparison of “before and after” trip length frequencies is desirable.
Once a model has been developed and calibrated, it is recommended that a model auditor be engaged to check a sample of input, composition, parameters and outputs of a model to both check for errors and to ensure that the model meets the agreed scope.
The Auditor should also undertake validation of these model outputs using data independent from that used in the calibration. The object of this is not to flag a re-calibration, but to point out the potential margin for error associated with the model.
Transport Modelling Guidelines for Activity Centre structure plans
18
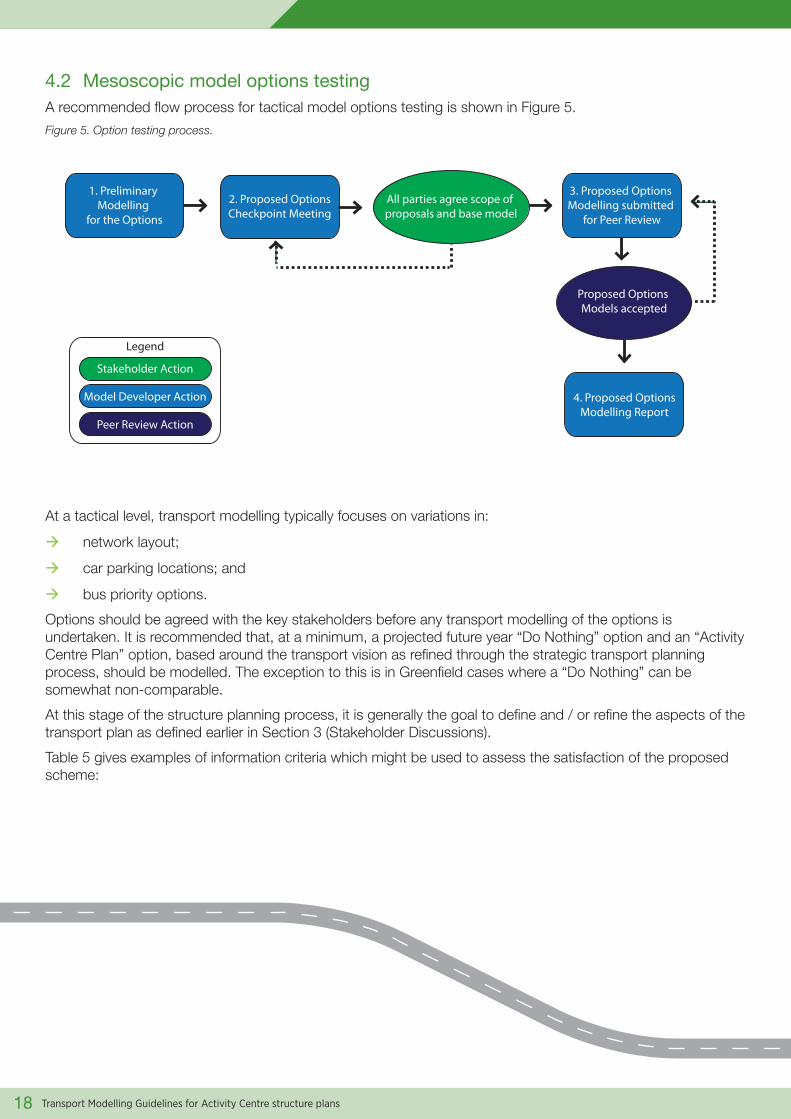
4.2 Mesoscopic model options testingA recommended flow process for tactical model options testing is shown in Figure 5.
Figure 5. Option testing process.
Pass/ Fail criteria expectation of State and Local
Government
Modelling works initiated
Data and Model Scope Checkpoint Meeting
All parties agree scope of proposals and base model
Data collection undertaken
Calibrated Model developed and
submitted to Auditor
Calibrated Model accepted by Auditor
Modelling Report(including validation
by Auditor)
Modelling Report accepted by Stakeholders
Model approved for use
Legend
Stakeholder Action
Model Developer Action
Auditor Action
Legend
Stakeholder Action
Model Developer Action
Peer Review Action
1. Preliminary Modelling
for the Options
2. Proposed OptionsCheckpoint Meeting
All parties agree scope of proposals and base model
3. Proposed Options Modelling submitted
for Peer Review
Proposed Options Models accepted
4. Proposed OptionsModelling Report
At a tactical level, transport modelling typically focuses on variations in:
à network layout;
à car parking locations; and
à bus priority options.
Options should be agreed with the key stakeholders before any transport modelling of the options is undertaken. It is recommended that, at a minimum, a projected future year “Do Nothing” option and an “Activity Centre Plan” option, based around the transport vision as refined through the strategic transport planning process, should be modelled. The exception to this is in Greenfield cases where a “Do Nothing” can be somewhat non-comparable.
At this stage of the structure planning process, it is generally the goal to define and / or refine the aspects of the transport plan as defined earlier in Section 3 (Stakeholder Discussions).
Table 5 gives examples of information criteria which might be used to assess the satisfaction of the proposed scheme:
Transport Modelling Guidelines for Activity Centre structure plans
19
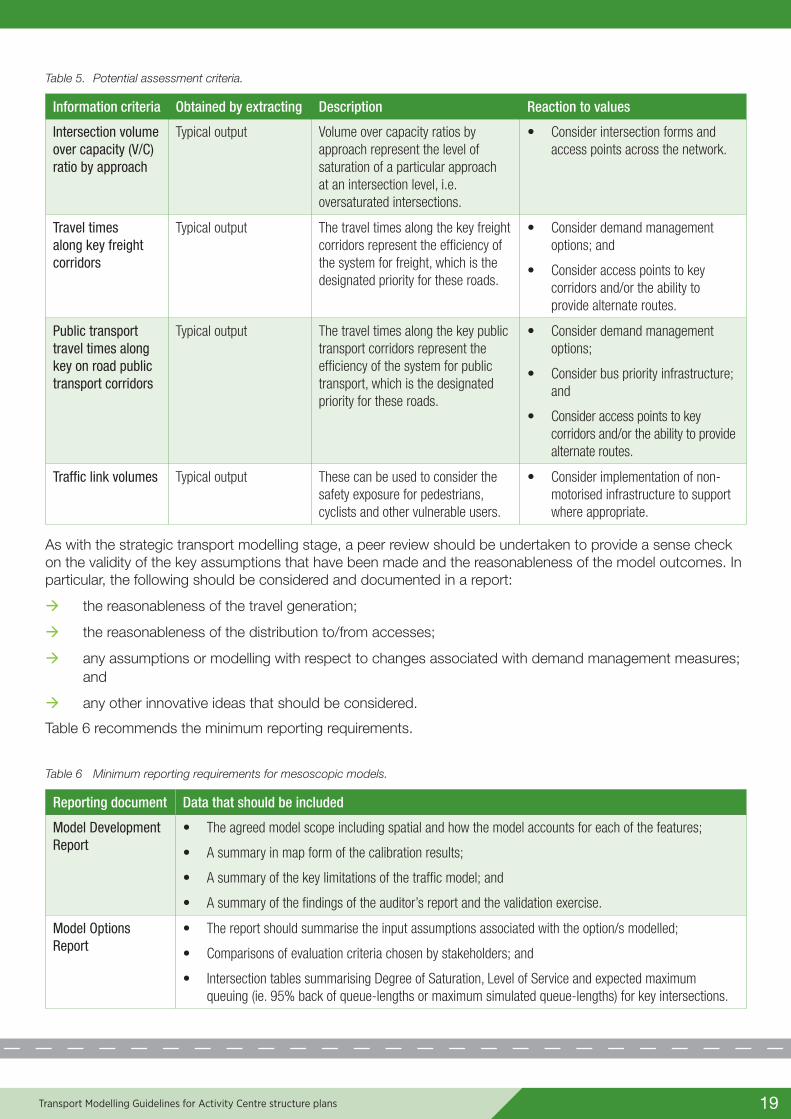
Table 5. Potential assessment criteria.
Information criteria Obtained by extracting Description Reaction to values
Intersection volume over capacity (V/C) ratio by approach
Typical output Volume over capacity ratios by approach represent the level of saturation of a particular approach at an intersection level, i.e. oversaturated intersections.
• Consider intersection forms and access points across the network.
Travel times along key freight corridors
Typical output The travel times along the key freight corridors represent the efficiency of the system for freight, which is the designated priority for these roads.
• Consider demand management options; and
• Consider access points to key corridors and/or the ability to provide alternate routes.
Public transport travel times along key on road public transport corridors
Typical output The travel times along the key public transport corridors represent the efficiency of the system for public transport, which is the designated priority for these roads.
• Consider demand management options;
• Consider bus priority infrastructure; and
• Consider access points to key corridors and/or the ability to provide alternate routes.
Traffic link volumes Typical output These can be used to consider the safety exposure for pedestrians, cyclists and other vulnerable users.
• Consider implementation of non-motorised infrastructure to support where appropriate.
As with the strategic transport modelling stage, a peer review should be undertaken to provide a sense check on the validity of the key assumptions that have been made and the reasonableness of the model outcomes. In particular, the following should be considered and documented in a report:
à the reasonableness of the travel generation;
à the reasonableness of the distribution to/from accesses;
à any assumptions or modelling with respect to changes associated with demand management measures; and
à any other innovative ideas that should be considered.
Table 6 recommends the minimum reporting requirements.
Table 6 Minimum reporting requirements for mesoscopic models.
Reporting document Data that should be included
Model Development Report
• The agreed model scope including spatial and how the model accounts for each of the features;
• A summary in map form of the calibration results;
• A summary of the key limitations of the traffic model; and
• A summary of the findings of the auditor’s report and the validation exercise.
Model Options Report
• The report should summarise the input assumptions associated with the option/s modelled;
• Comparisons of evaluation criteria chosen by stakeholders; and
• Intersection tables summarising Degree of Saturation, Level of Service and expected maximum queuing (ie. 95% back of queue-lengths or maximum simulated queue-lengths) for key intersections.
Transport Modelling Guidelines for Activity Centre structure plans
20
05 Operational transport modelling
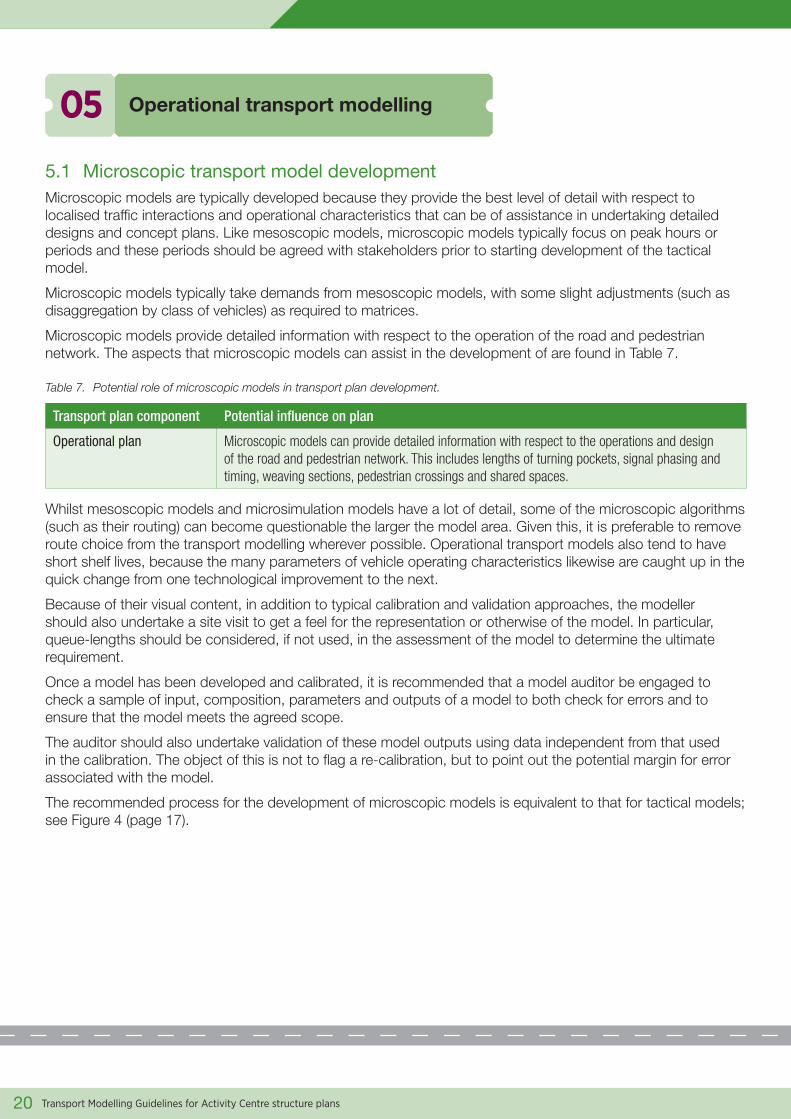
5.1 Microscopic transport model developmentMicroscopic models are typically developed because they provide the best level of detail with respect to localised traffic interactions and operational characteristics that can be of assistance in undertaking detailed designs and concept plans. Like mesoscopic models, microscopic models typically focus on peak hours or periods and these periods should be agreed with stakeholders prior to starting development of the tactical model.
Microscopic models typically take demands from mesoscopic models, with some slight adjustments (such as disaggregation by class of vehicles) as required to matrices.
Microscopic models provide detailed information with respect to the operation of the road and pedestrian network. The aspects that microscopic models can assist in the development of are found in Table 7.
Table 7. Potential role of microscopic models in transport plan development.
Transport plan component Potential influence on plan
Operational plan Microscopic models can provide detailed information with respect to the operations and design of the road and pedestrian network. This includes lengths of turning pockets, signal phasing and timing, weaving sections, pedestrian crossings and shared spaces.
Whilst mesoscopic models and microsimulation models have a lot of detail, some of the microscopic algorithms (such as their routing) can become questionable the larger the model area. Given this, it is preferable to remove route choice from the transport modelling wherever possible. Operational transport models also tend to have short shelf lives, because the many parameters of vehicle operating characteristics likewise are caught up in the quick change from one technological improvement to the next.
Because of their visual content, in addition to typical calibration and validation approaches, the modeller should also undertake a site visit to get a feel for the representation or otherwise of the model. In particular, queue-lengths should be considered, if not used, in the assessment of the model to determine the ultimate requirement.
Once a model has been developed and calibrated, it is recommended that a model auditor be engaged to check a sample of input, composition, parameters and outputs of a model to both check for errors and to ensure that the model meets the agreed scope.
The auditor should also undertake validation of these model outputs using data independent from that used in the calibration. The object of this is not to flag a re-calibration, but to point out the potential margin for error associated with the model.
The recommended process for the development of microscopic models is equivalent to that for tactical models; see Figure 4 (page 17).
Transport Modelling Guidelines for Activity Centre structure plans
21
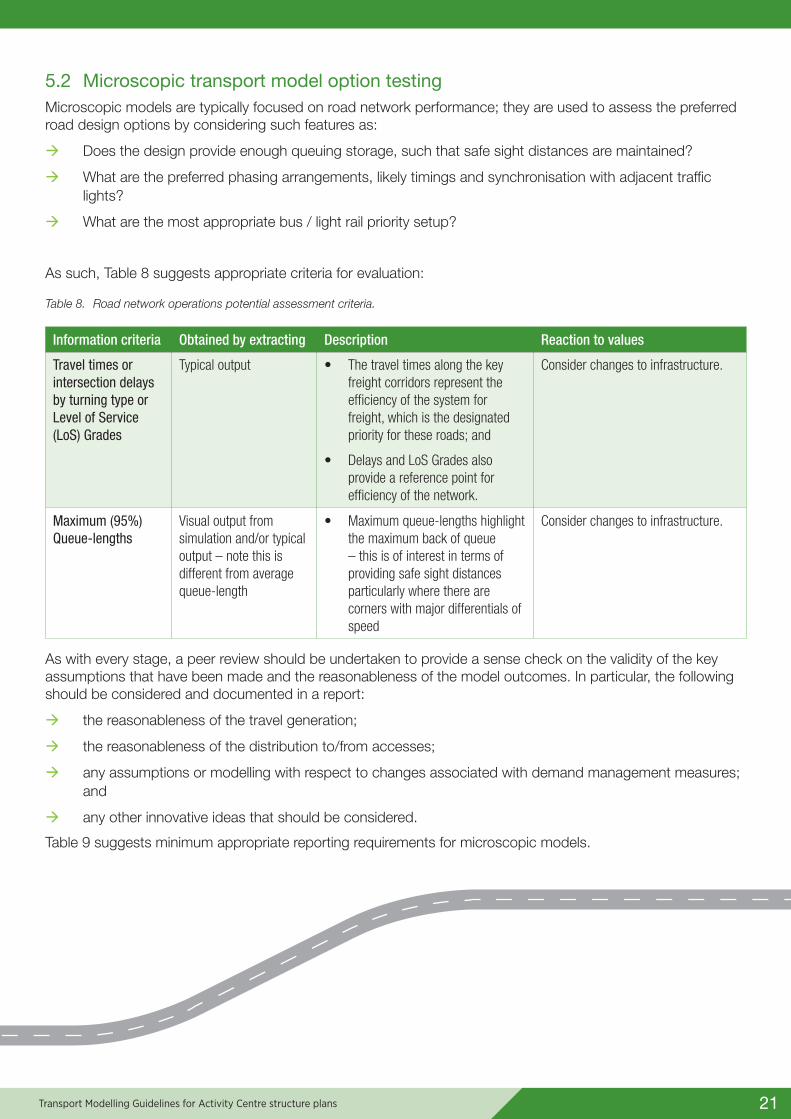
5.2 Microscopic transport model option testingMicroscopic models are typically focused on road network performance; they are used to assess the preferred road design options by considering such features as:
à Does the design provide enough queuing storage, such that safe sight distances are maintained?
à What are the preferred phasing arrangements, likely timings and synchronisation with adjacent traffic lights?
à What are the most appropriate bus / light rail priority setup?
As such, Table 8 suggests appropriate criteria for evaluation:
Table 8. Road network operations potential assessment criteria.
Information criteria Obtained by extracting Description Reaction to values
Travel times or intersection delays by turning type or Level of Service (LoS) Grades
Typical output • The travel times along the key freight corridors represent the efficiency of the system for freight, which is the designated priority for these roads; and
• Delays and LoS Grades also provide a reference point for efficiency of the network.
Consider changes to infrastructure.
Maximum (95%) Queue-lengths
Visual output from simulation and/or typical output – note this is different from average queue-length
• Maximum queue-lengths highlight the maximum back of queue – this is of interest in terms of providing safe sight distances particularly where there are corners with major differentials of speed
Consider changes to infrastructure.
As with every stage, a peer review should be undertaken to provide a sense check on the validity of the key assumptions that have been made and the reasonableness of the model outcomes. In particular, the following should be considered and documented in a report:
à the reasonableness of the travel generation;
à the reasonableness of the distribution to/from accesses;
à any assumptions or modelling with respect to changes associated with demand management measures; and
à any other innovative ideas that should be considered.
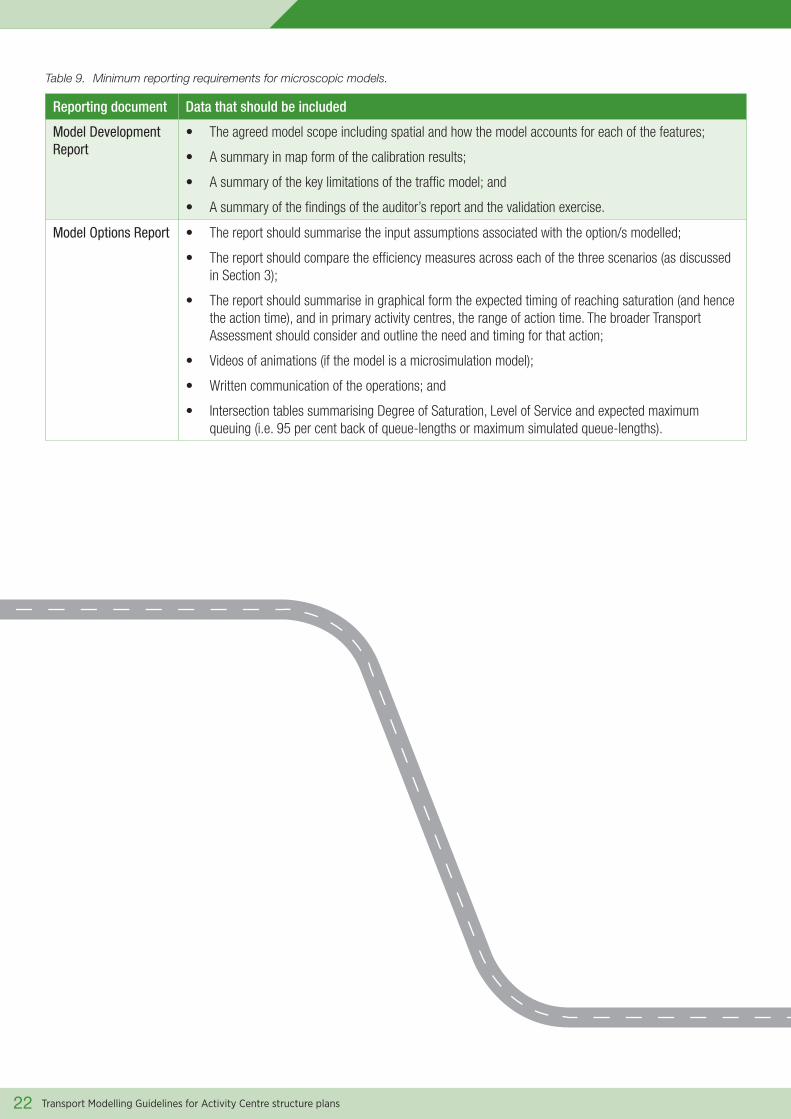
Table 9 suggests minimum appropriate reporting requirements for microscopic models.
Transport Modelling Guidelines for Activity Centre structure plans
22
Table 9. Minimum reporting requirements for microscopic models.
Reporting document Data that should be included
Model Development Report
• The agreed model scope including spatial and how the model accounts for each of the features;
• A summary in map form of the calibration results;
• A summary of the key limitations of the traffic model; and
• A summary of the findings of the auditor’s report and the validation exercise.
Model Options Report • The report should summarise the input assumptions associated with the option/s modelled;
• The report should compare the efficiency measures across each of the three scenarios (as discussed in Section 3);
• The report should summarise in graphical form the expected timing of reaching saturation (and hence the action time), and in primary activity centres, the range of action time. The broader Transport Assessment should consider and outline the need and timing for that action;
• Videos of animations (if the model is a microsimulation model);
• Written communication of the operations; and
• Intersection tables summarising Degree of Saturation, Level of Service and expected maximum queuing (i.e. 95 per cent back of queue-lengths or maximum simulated queue-lengths).
Transport Modelling Guidelines for Activity Centre structure plans
23
06 Timing and cost
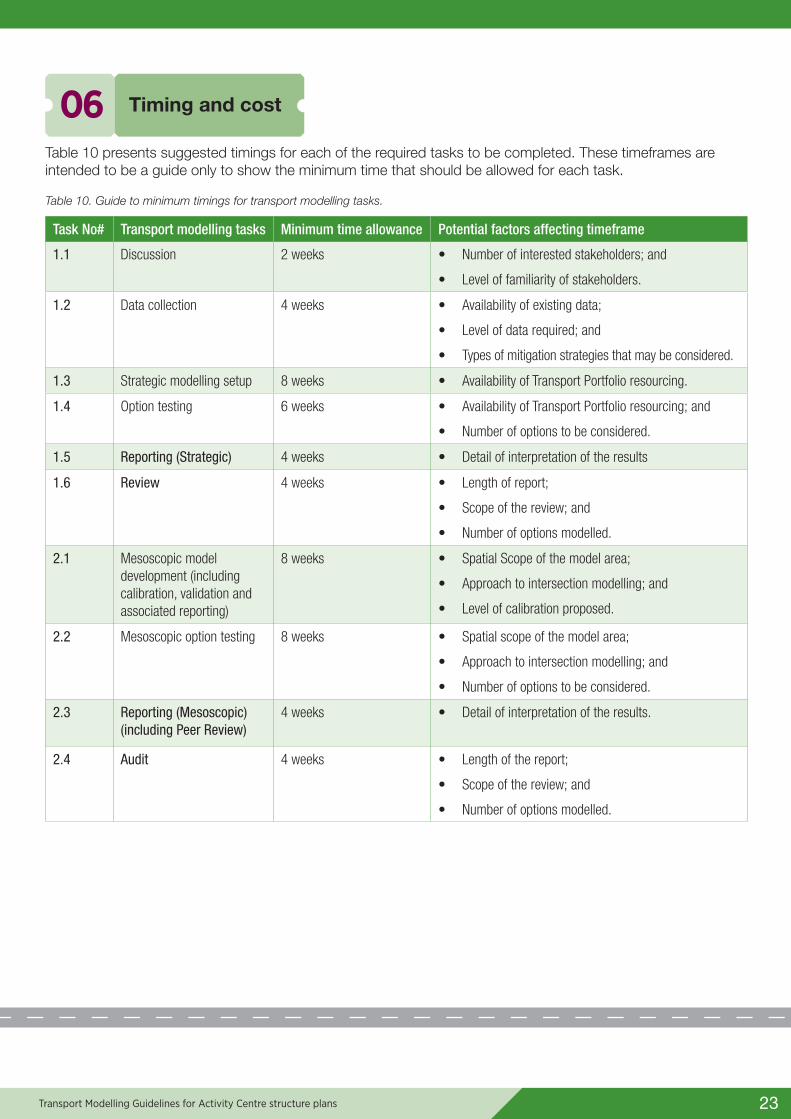
Table 10 presents suggested timings for each of the required tasks to be completed. These timeframes are intended to be a guide only to show the minimum time that should be allowed for each task.
Table 10. Guide to minimum timings for transport modelling tasks.
Task No# Transport modelling tasks Minimum time allowance Potential factors affecting timeframe
1.1 Discussion 2 weeks • Number of interested stakeholders; and
• Level of familiarity of stakeholders.
1.2 Data collection 4 weeks • Availability of existing data;
• Level of data required; and
• Types of mitigation strategies that may be considered.
1.3 Strategic modelling setup 8 weeks • Availability of Transport Portfolio resourcing.
1.4 Option testing 6 weeks • Availability of Transport Portfolio resourcing; and
• Number of options to be considered.
1.5 Reporting (Strategic) 4 weeks • Detail of interpretation of the results
1.6 Review 4 weeks • Length of report;
• Scope of the review; and
• Number of options modelled.
2.1 Mesoscopic model development (including calibration, validation and associated reporting)
8 weeks • Spatial Scope of the model area;
• Approach to intersection modelling; and
• Level of calibration proposed.
2.2 Mesoscopic option testing 8 weeks • Spatial scope of the model area;
• Approach to intersection modelling; and
• Number of options to be considered.
2.3 Reporting (Mesoscopic) (including Peer Review)
4 weeks • Detail of interpretation of the results.
2.4 Audit 4 weeks • Length of the report;
• Scope of the review; and
• Number of options modelled.
Transport Modelling Guidelines for Activity Centre structure plans
24
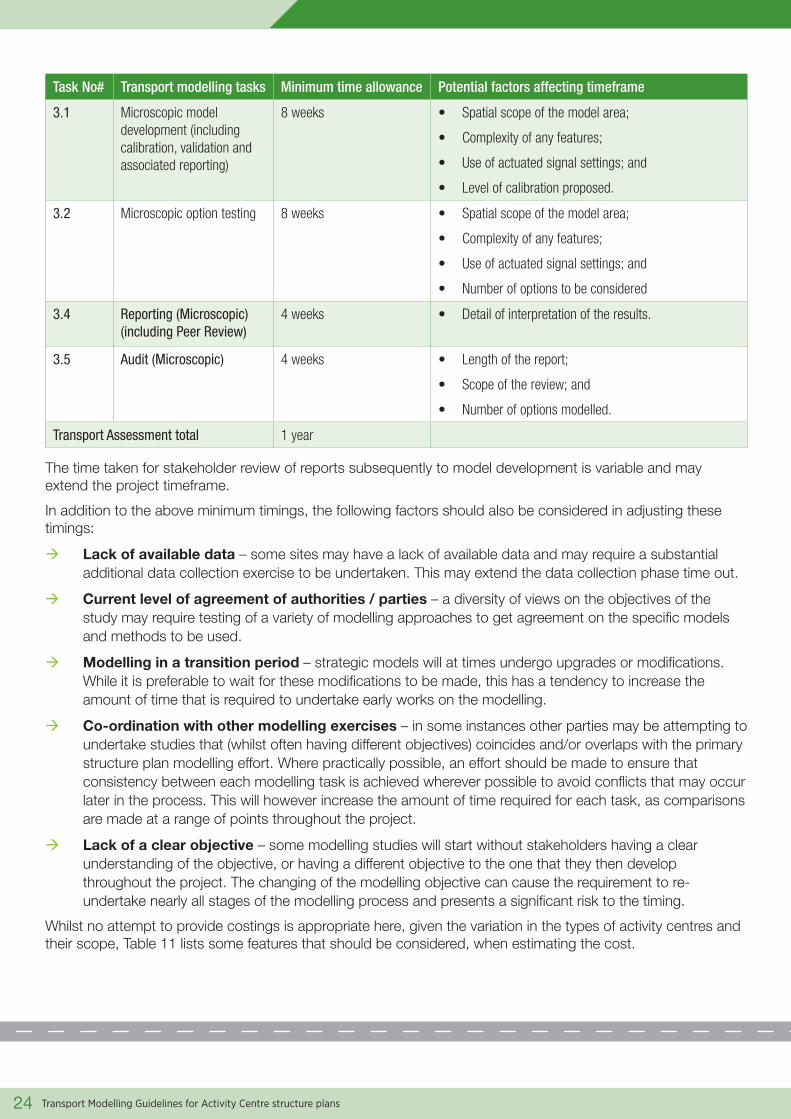
Task No# Transport modelling tasks Minimum time allowance Potential factors affecting timeframe
3.1 Microscopic model development (including calibration, validation and associated reporting)
8 weeks • Spatial scope of the model area;
• Complexity of any features;
• Use of actuated signal settings; and
• Level of calibration proposed.
3.2 Microscopic option testing 8 weeks • Spatial scope of the model area;
• Complexity of any features;
• Use of actuated signal settings; and
• Number of options to be considered
3.4 Reporting (Microscopic) (including Peer Review)
4 weeks • Detail of interpretation of the results.
3.5 Audit (Microscopic) 4 weeks • Length of the report;
• Scope of the review; and
• Number of options modelled.
Transport Assessment total 1 year
The time taken for stakeholder review of reports subsequently to model development is variable and may extend the project timeframe.
In addition to the above minimum timings, the following factors should also be considered in adjusting these timings:
à Lack of available data – some sites may have a lack of available data and may require a substantial additional data collection exercise to be undertaken. This may extend the data collection phase time out.
à Current level of agreement of authorities / parties – a diversity of views on the objectives of the study may require testing of a variety of modelling approaches to get agreement on the specific models and methods to be used.
à Modelling in a transition period – strategic models will at times undergo upgrades or modifications. While it is preferable to wait for these modifications to be made, this has a tendency to increase the amount of time that is required to undertake early works on the modelling.
à Co-ordination with other modelling exercises – in some instances other parties may be attempting to undertake studies that (whilst often having different objectives) coincides and/or overlaps with the primary structure plan modelling effort. Where practically possible, an effort should be made to ensure that consistency between each modelling task is achieved wherever possible to avoid conflicts that may occur later in the process. This will however increase the amount of time required for each task, as comparisons are made at a range of points throughout the project.
à Lack of a clear objective – some modelling studies will start without stakeholders having a clear understanding of the objective, or having a different objective to the one that they then develop throughout the project. The changing of the modelling objective can cause the requirement to re-undertake nearly all stages of the modelling process and presents a significant risk to the timing.
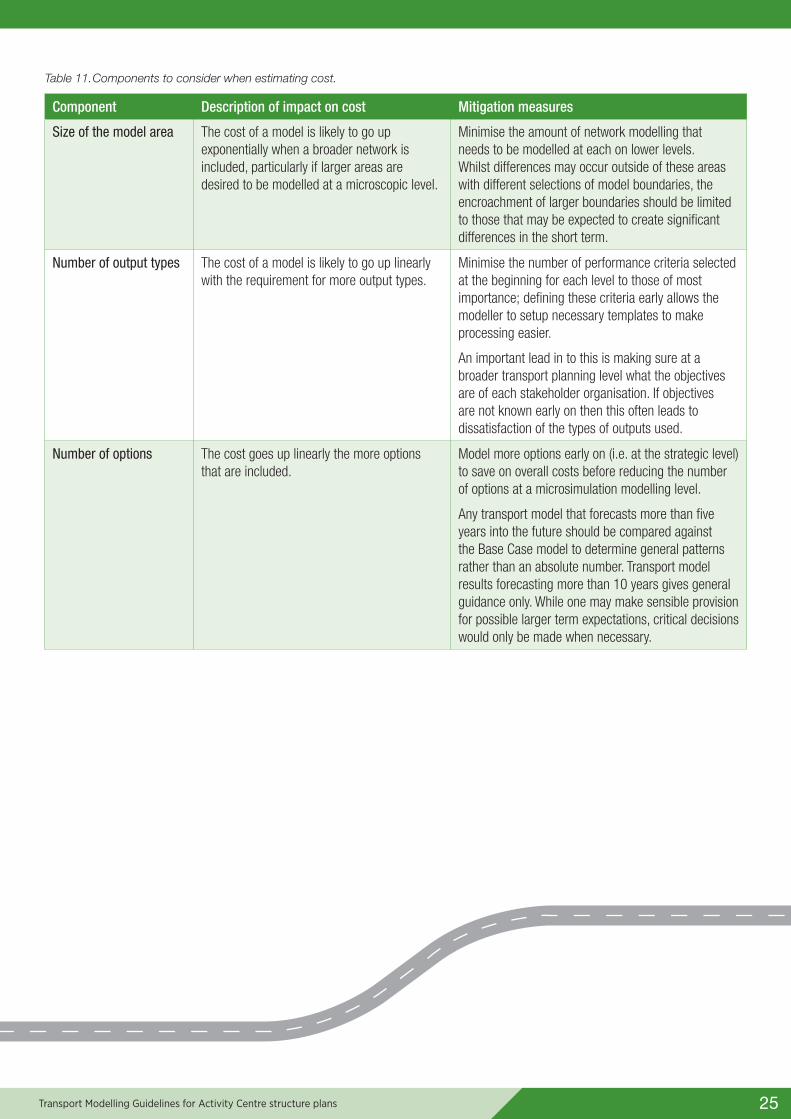
Whilst no attempt to provide costings is appropriate here, given the variation in the types of activity centres and their scope, Table 11 lists some features that should be considered, when estimating the cost.
Transport Modelling Guidelines for Activity Centre structure plans
25
Table 11. Components to consider when estimating cost.
Component Description of impact on cost Mitigation measures
Size of the model area The cost of a model is likely to go up exponentially when a broader network is included, particularly if larger areas are desired to be modelled at a microscopic level.
Minimise the amount of network modelling that needs to be modelled at each on lower levels. Whilst differences may occur outside of these areas with different selections of model boundaries, the encroachment of larger boundaries should be limited to those that may be expected to create significant differences in the short term.
Number of output types The cost of a model is likely to go up linearly with the requirement for more output types.
Minimise the number of performance criteria selected at the beginning for each level to those of most importance; defining these criteria early allows the modeller to setup necessary templates to make processing easier.
An important lead in to this is making sure at a broader transport planning level what the objectives are of each stakeholder organisation. If objectives are not known early on then this often leads to dissatisfaction of the types of outputs used.
Number of options The cost goes up linearly the more options that are included.
Model more options early on (i.e. at the strategic level) to save on overall costs before reducing the number of options at a microsimulation modelling level.
Any transport model that forecasts more than five years into the future should be compared against the Base Case model to determine general patterns rather than an absolute number. Transport model results forecasting more than 10 years gives general guidance only. While one may make sensible provision for possible larger term expectations, critical decisions would only be made when necessary.
Transport Modelling Guidelines for Activity Centre structure plans
26
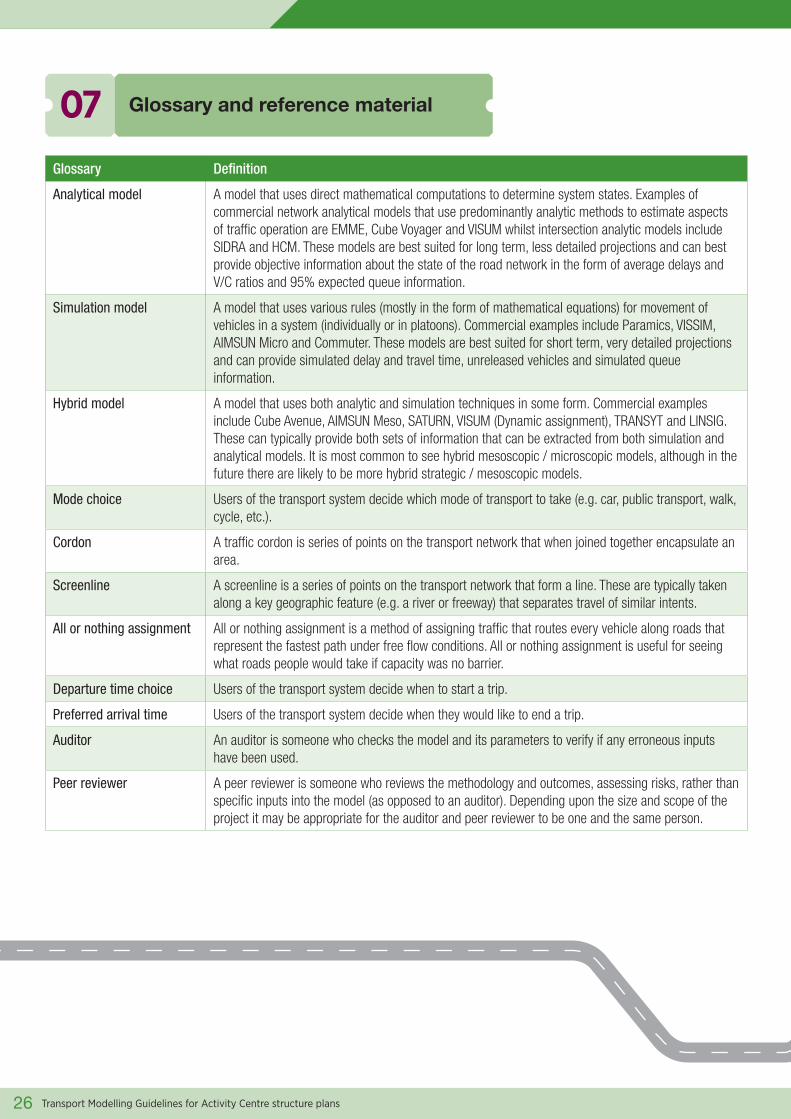
07 Glossary and reference material
Glossary Definition
Analytical model A model that uses direct mathematical computations to determine system states. Examples of commercial network analytical models that use predominantly analytic methods to estimate aspects of traffic operation are EMME, Cube Voyager and VISUM whilst intersection analytic models include SIDRA and HCM. These models are best suited for long term, less detailed projections and can best provide objective information about the state of the road network in the form of average delays and V/C ratios and 95% expected queue information.
Simulation model A model that uses various rules (mostly in the form of mathematical equations) for movement of vehicles in a system (individually or in platoons). Commercial examples include Paramics, VISSIM, AIMSUN Micro and Commuter. These models are best suited for short term, very detailed projections and can provide simulated delay and travel time, unreleased vehicles and simulated queue information.
Hybrid model A model that uses both analytic and simulation techniques in some form. Commercial examples include Cube Avenue, AIMSUN Meso, SATURN, VISUM (Dynamic assignment), TRANSYT and LINSIG. These can typically provide both sets of information that can be extracted from both simulation and analytical models. It is most common to see hybrid mesoscopic / microscopic models, although in the future there are likely to be more hybrid strategic / mesoscopic models.
Mode choice Users of the transport system decide which mode of transport to take (e.g. car, public transport, walk, cycle, etc.).
Cordon A traffic cordon is series of points on the transport network that when joined together encapsulate an area.
Screenline A screenline is a series of points on the transport network that form a line. These are typically taken along a key geographic feature (e.g. a river or freeway) that separates travel of similar intents.
All or nothing assignment All or nothing assignment is a method of assigning traffic that routes every vehicle along roads that represent the fastest path under free flow conditions. All or nothing assignment is useful for seeing what roads people would take if capacity was no barrier.
Departure time choice Users of the transport system decide when to start a trip.
Preferred arrival time Users of the transport system decide when they would like to end a trip.
Auditor An auditor is someone who checks the model and its parameters to verify if any erroneous inputs have been used.
Peer reviewer A peer reviewer is someone who reviews the methodology and outcomes, assessing risks, rather than specific inputs into the model (as opposed to an auditor). Depending upon the size and scope of the project it may be appropriate for the auditor and peer reviewer to be one and the same person.
Transport Modelling Guidelines for Activity Centre structure plans
27Transport Modelling Guidelines for Activity Centre structure plans
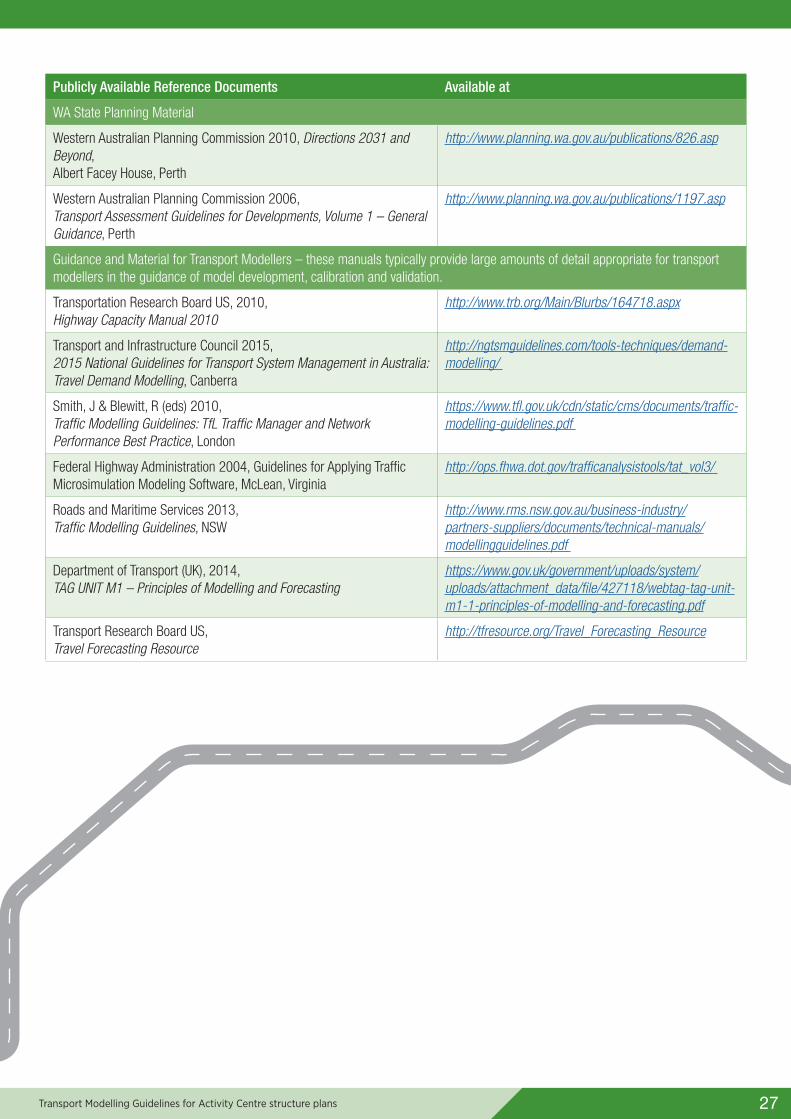
Publicly Available Reference Documents Available at
WA State Planning Material
Western Australian Planning Commission 2010, Directions 2031 and Beyond, Albert Facey House, Perth
http://www.planning.wa.gov.au/publications/826.asp
Western Australian Planning Commission 2006, Transport Assessment Guidelines for Developments, Volume 1 – General Guidance, Perth
http://www.planning.wa.gov.au/publications/1197.asp
Guidance and Material for Transport Modellers – these manuals typically provide large amounts of detail appropriate for transport modellers in the guidance of model development, calibration and validation.
Transportation Research Board US, 2010, Highway Capacity Manual 2010
http://www.trb.org/Main/Blurbs/164718.aspx
Transport and Infrastructure Council 2015, 2015 National Guidelines for Transport System Management in Australia: Travel Demand Modelling, Canberra
http://ngtsmguidelines.com/tools-techniques/demand-modelling/
Smith, J & Blewitt, R (eds) 2010, Traffic Modelling Guidelines: TfL Traffic Manager and Network Performance Best Practice, London
https://www.tfl.gov.uk/cdn/static/cms/documents/traffic-modelling-guidelines.pdf
Federal Highway Administration 2004, Guidelines for Applying Traffic Microsimulation Modeling Software, McLean, Virginia
http://ops.fhwa.dot.gov/trafficanalysistools/tat_vol3/
Roads and Maritime Services 2013, Traffic Modelling Guidelines, NSW
http://www.rms.nsw.gov.au/business-industry/partners-suppliers/documents/technical-manuals/modellingguidelines.pdf
Department of Transport (UK), 2014, TAG UNIT M1 – Principles of Modelling and Forecasting
https://www.gov.uk/government/uploads/system/uploads/attachment_data/file/427118/webtag-tag-unit-m1-1-principles-of-modelling-and-forecasting.pdf
Transport Research Board US, Travel Forecasting Resource
http://tfresource.org/Travel_Forecasting_Resource
CONTACTDepartment of Transport 140 William Street Perth WA 6000 Telephone: (08) 6551 6000Email: [email protected] Website: www.transport.wa.gov.au
The information contained in this publication is provided in good faith and believed to be accurate at time of publication. The State shall in no way be liable for any loss sustained or incurred by anyone relying on the information. 0616
DoT 14980520


![Passenger Transport Modelling [T1] · 2014-12-19 · Draft for Stakeholder Comment – Passenger Transport Modelling [T1] Transport and Infrastructure Council | 2014 National Guidelines](https://img.pdfslide.us/doc/110x75/5e797bbdaa4c0b0f3e2b526a/passenger-transport-modelling-t1-2014-12-19-draft-for-stakeholder-comment-a.jpg)


![Travel Demand Modelling [T1] - · PDF fileDraft for Stakeholder Consultation – Travel Demand Modelling Transport and Infrastructure Council | National Guidelines for Transport System](https://img.pdfslide.us/doc/110x75/5a8750017f8b9ad30c8db0eb/travel-demand-modelling-t1-for-stakeholder-consultation-travel-demand-modelling.jpg)