Embed Size (px)
Citation preview

1
Annual Business Plan 2019
Prepared under the guidance and supervision of Mr. Zaigham Uddin Azam
Ambassador of Pakistan to Viet Nam & Laos
Authored by
Ms. Vu Minh Phuong, Trade Development Officer
Edited by Qamar Abbas Khokhar Deputy Head of Mission
Commercial Section, Embassy of Pakistan, Ha Noi, Viet Nam

1
Table of Contents
1. Introduction of Viet Nam’s Economy and Trade .................................................. 3 1.1. Economic and Trade Profile of Viet Nam .......................................................... 3 1.2. Major Export and Import Commodities of Viet Nam ......................................... 5
2. Pakistan-Viet Nam Bilateral Trade Relations ....................................................... 7 2.1. Institutional Framework of Pakistan-Viet Nam Economic & Trade Relations .... 8 2.2. Bilateral Trade in Figures .................................................................................. 8 2.2.1. Pakistan’s Exports to Viet Nam ......................................................................... 9 2.2.2. Import (Exports of Viet Nam) .......................................................................... 11 2.3. Bilateral Investment Profile ............................................................................. 11
3. SWOT Analysis of Potential Sectors for Increasing Bilateral Trade ................. 12 3.1. Seafood............................................................................................................ 12 3.2. Cotton .............................................................................................................. 14 3.3. Yarn ................................................................................................................ 15 3.4. Fabrics ............................................................................................................. 16 3.5. Leather ............................................................................................................ 18 3.6. Fruits (Citrus) and Vegetables ......................................................................... 20 3.7. Wheat and Flour .............................................................................................. 22 3.8. Software and IT-related services ...................................................................... 23 3.9 Engineering Goods .......................................................................................... 25
3.9.1 Pharmaceutical Products .............................................................................. 25 3.9.2 Surgical Goods ............................................................................................. 26 3.9.3 Cutlery ......................................................................................................... 27 3.9.4 Sports Goods ................................................................................................ 28
3.10 Tobacco Materials ........................................................................................... 30 3.11 Beef ................................................................................................................. 31
4. Important Issues and Recommendations ............................................................. 33 4.1. Sectors for export development........................................................................ 33 4.2. Participation in Trade Fairs .............................................................................. 37 4.3. Vietnamese Delegations to Pakistan ................................................................ 38 4.4. Networking with buyers/importers ................................................................... 38

2
4.5. Effective Marketing Campaign for Pakistan’s participation in trade fairs ......... 39 4.6. Registration of Pakistani agri and animal products with the National Agro-Forestry-Fisheries Quality Assurance Department (NAFIQAD) of Viet Nam ............. 39 4.7. Registration of Pakistani Pharmaceutical & Surgical Products with the Ministry of Health of Viet Nam (MOH).................................................................................... 40
5. Request for Assistance from the MoC & TDAP .................................................. 43 5.1. Statistics .......................................................................................................... 43 5.2. Visit of Delegations ......................................................................................... 43 5.3. Follow up on the decisions of the Joint Ministerial Commission (JMC) and the Joint Trade Commission (JTC) ................................................................................... 43 5.4. Wheat Export ................................................................................................... 44 5.5 Citrus Export ................................................................................................... 44
Conclusion .................................................................................................................... 46

1
Executive Summary Viet Nam is one of the fastest growing economies of the world. As an export based economy, Viet Nam’s economic prospects for the next two year look very positive, as the international community is acknowledging the country’s role and responsibility in integrating with the rest of the world and implementing international economic commitments. Viet Nam’s GDP in the first nine months of 2018 grew at almost 7% as compared to the same period last year. This is the highest rate of growth achieved by Viet Nam since 2011. In the first nine months of 2018, Viet Nam’s exports reached US$ 178.91 billion, a rise of 15.4% compared to last year. Its imports were worth US$ 173.52 billion, moving up by 11.8% from the same period last year. Expanding production, a stable macro-economic condition and controlled inflation are likely to help Vietnamese economy to grow further in the coming years. Bilateral trade between Pakistan and Viet Nam has continuously been increasing for the last five years. As per figures received from Pakistan, bilateral trade in the Fiscal Year 2017-18 grew to reach the level of $743 million (Data source PRAL Pakistan Customs), highest ever trade volume with Pakistan’s exports increasing to $313 million, with a year on year increase of $36 million (17.2%). Pakistan and Viet Nam have a potential to cooperate with each other in many areas including trade and investment, textiles & garments, energy, infrastructure development, automobiles, industry, agriculture, food processing, chemicals, information technology, pharmaceuticals, gems & jewelry, sports goods, education & health, air & sea connectivity, banking, seafood and fish farming and IT. Vietnam is a high profile manufacturing country that needs raw materials to cater to demands of its growing manufacturing sector. The two countries should make joint efforts to identify impediments in two-way trade and take measures to increase bilateral trade to $1 billion. The Embassy of Pakistan is proactively working to promote, develop and facilitate trade relations between Pakistan and Viet Nam as well as the Laos, accredited country. The Embassy facilitates both Pakistani and Vietnamese businesspersons in making connections with their counterparts. This Annual Business Plan is a roadmap devised to boost our trade with Viet Nam and Laos which is divided into five parts:
Ø Introduction of Viet Nam’s economy and Trade

2
Ø Pakistan - Viet Nam Bilateral Trade Relations Ø SWOT Analysis of Potential Sectors for Increasing Pakistan’s Exports Ø Important Issues and Recommendations Ø Request for Assistance from the MOC & TDAP
The plan will help to achieve long term and short term objectives of the Embassy as envisioned by the Ministry of Commerce under the guidance of the Ambassador of Pakistan. Pakistan and Vietnam have huge trade potential in areas of textile, leather, seafood, food products like beef, fruits especially citrus, IT products etc. Vietnam has a trade advantage due to production of highly advanced IT products. The Korean and Japanese investment and business partnerships have opened the market in Vietnam for raw materials and semi-processed goods for which Pakistan can be a good source. There was a huge increase in imports of electrical machinery and equipment; coffee, tea, mate and spices and man-made filaments from Vietnam to Pakistan in the period 2017-18 that Pakistan should consider increasing the import duty on these products to balance the trade. Apart from traditional export items, Pakistan should also focus on non-traditional items including cutlery, sports goods, food stuff (especially beef), fruits (especially citrus) and vegetables, tobacco materials to maximize the export growth in the upcoming years. Viet Nam is the 19th largest export destination for Pakistan. The Embassy is of the view that with little bit of support from the Ministry of Commerce, the Trade Development Authority and other relevant departments of the government of Pakistan as well as private business bodies, Viet Nam could become one of the top twelve export destinations of Pakistan.

3
1. Introduction of Viet Nam’s Economy and Trade
Viet Nam’s development record over the past 25 years is remarkable. Economic and political reforms under Đổi Mới (restructuring and renewal) launched in 1986 have spurred rapid economic growth and development and transformed Viet Nam from one of the world’s poorest countries to a lower middle-income country. Since 1990, Viet Nam’s GDP growth has been among the fastest in the world, averaging 6.4 percent a year in last two decades. Viet Nam’s economy continued to strengthen in 2017, with a GDP growth rate of 6.81 percent and in the first nine months of 2018 at almost 7%, highest since 2011.
The East Asian Crisis of late 1990s turned into an economic miracle for some countries like Viet Nam, which controlled poverty and expanded export-based infrastructure through sound economic policies. Vietnamese exports from 1995 to 2018 increased from single digit to triple digits in terms of billion dollars. The rise in export and a positive trade balance could not have been possible without sound policies introduced by the Vietnamese government. Since the early 1990s, Viet Nam has experienced a spectacular decrease in poverty. The percentage of the Vietnamese population living below the poverty line fell from 58% in 1993 to 9.8% in 2018. 72% of the poor belong to the ethnic minorities living in the mountainous regions; the government is focusing on their economic development.
Viet Nam is largely an agricultural country, with more than two-thirds of the workforce employed by the agriculture sector. However, it is fast becoming an industrial economy with rapid development in its infrastructure and industrial base. Since the economic reforms undertaken by the government, Viet Nam has continued to be fully integrated in the international economic system. Currently, Viet Nam has diplomatic relations with 170 countries, having trade and co-operation relations with more than 100 ones and trade agreements with about 60 countries and territories in the world. The economy has grown in terms of productive forces, production relations and international economic integration. Living standard of the Vietnamese people has greatly improved in the last three decades. 1.1. Economic and Trade Profile of Viet Nam
Viet Nam is the 27th largest export economy in the world. In 2017, Viet Nam exported goods worth $213.77 Billion and imported $211.1 Billion, resulting in a positive trade balance of $2.67 Billion. In 2017, the GDP of Viet Nam was $223 Billion and its GDP per capita was $2,385. In the first nine months of 2018, Viet Nam’s GDP grew at 6.98 per cent as compared to the same period last year, the

4
highest rate since 2011. The Vietnamese economy was on track to fulfill the Government’s growth target of 6.7 per cent for the year.
Fig: Map showing Viet Nam Port Network
Source: United Nations Website
Viet Nam borders China, Cambodia and Laos by land and Indonesia,
Malaysia, the Philippines and Thailand by sea.

5
1.2. Major Export and Import Commodities of Viet Nam
Viet Nam is one of the leading exporters of the world however its imports are also high. In the following pages, major imports and exports of Viet Nam in the year 2017 are mentioned: Table 1: Export Commodities of Viet Nam 2017 Value (USD Million) Telephones, mobile phones and parts thereof 45,272 Textiles and garments 26,038 Computers, electrical products, spare parts and components thereof 25,942 Footwear 14,652 Machine, Equipment, tools and instruments 12,770 Other products 9,802 Fishery Products 8,315 Wood and wooden products 7,659 Other means of transportation, parts and accessories thereof 6,991 Still image, video cameras and part thereof 3,801 Yarn 3,593 Cashew nut 3,517 Fruits and vegetables 3,502 Handbags, purses, suitcases, headgear and umbrellas 3,285 Coffee 3,244 Iron and steel 3,148 Crude oil 2,875 Rice 2,616 Plastic products 2,522 Iron and steel products 2,303 Rubber 2,249 Other base metals and other base metal products 1,802 Textile, leather and footwear materials and auxiliaries 1,709 Insulated wires and cables 1,406 Chemicals 1,269 Toys and sports requisites; parts and accessories thereof 1,241 Pepper 1,118 Petroleum products 1,035 Manioc and manioc products 1,029 Glass and glassware 1,028 Furniture of other materials, other than of wood 931 Chemicals products 887 Paper and paper products 736 Clinker and cement 705 Animal fodders and animal fodder materials 610 Rubber products 597 Pastrycooks, sweets and cereal products 596

6
Precious stones, precious metal and articles thereof 556 Plastics 514 Ceramic products 466 Tyre cord fabrics and other fabrics for technical use 457 Coal 287 Bamboo and rattan products 269 Fertilizers 264 Tea 228 Ores and other minerals product 183
Table 2: Import Commodities of Viet Nam 2017 Value (USD Million) Computers, electrical products, spare parts and components thereof 37,706 Machine, Equipment, tools and instruments 33,673 Telephones, mobile phones and parts thereof 16,327 Fabrics 11,366 Other products 9,306 Iron and steel 9,013 Plastics 7,315 Petroleum products 7,037 Other base metals 5,428 Textile, leather and footwear materials and auxiliaries 5,420 Plastic products 5,379 Chemicals products 4,546 Chemicals 4,088 Animal fodders and animal fodder materials 3,209 Parts and accessories of motor vehicles 3,167 Iron and steel products 3,079 Pharmaceutical products 2,819 Cashew nut 2,533 Motor vehicles 2,237 Wood and wooden products 2,176 Still image, video cameras and part thereof 2,170 Yarn 1,814 Electric consumer products and parts thereof 1,721 Paper 1,668 Fruits and vegetables 1,547 Coal 1,520 Maize (corn) 1,504 Fishery Products 1,440 Fertilizers 1,230 Insulated wires and cables 1,205 Rubber 1,090 Glass and glassware 1,030 Wheat 994 Insecticides, rodenticides and materials 979

7
Other base metal products 888 Milk and milk products 865 Other petroleum products 851 Other means of transportation, parts and accessories thereof 830 Rubber products 802 Animal, vegetable fats and oils 761 Liquefied petroleum gases (LPG) 711 Soya beans 708 Ores and other minerals product 692 Paper products 682 Essential oils and resinoids; perfumery, cosmetic or toilet preparations 680 Other edible food preparations 630 Precious stones, precious metal and articles thereof 609 Crude oil 477 Motorcycles and parts, accessories thereof 446 Pharmaceutical materials 375 Tobacco materials 307 Pastry cooks, sweets and cereal products 303
Table 3: Top export markets of Viet Nam USD billion USA 34.8 China 19.6 Japan 13.3 South Korea 10.4
During the last five years the exports of Viet Nam have increased due to the
increase in exports of equipment and cell phones. In Viet Nam, over 85 percent of FDI is from regional countries in South East Asia while in Pakistan only 18 percent comes from the region (China). FDI from neighboring countries results in formation of efficient regional production networks.
Viet Nam is one of the world’s most interesting business and marketing places. A prosperous future of Viet Nam is not just in the imagination of optimistic Vietnamese. External assessments and analyses provide same conclusion. Moody’s (Ba3), S&P (BB-), and Fitch (BB) have given Viet Nam high credit ratings. Goldman Sachs predicts that the Vietnamese economy will be the 17th largest in the world by 2020. 2. Pakistan-Viet Nam Bilateral Trade Relations

8
Before analyzing the economic and trade relations between Pakistan and Viet Nam, it would be in the fitness of things at the institutional framework governing the bilateral economic and trade relations.
2.1. Institutional Framework of Pakistan-Viet Nam Economic & Trade
Relations
So far, the two countries have signed a series of agreements and MoUs which are the legal basis for economic and trade activities and investment cooperation:
• Bilateral Trade Agreement (May 2001), • MoU on the establishment of Viet Nam Pakistan Joint Trade Commission
(April 2002); • Agreements on avoidance of double taxation (March 2004); • MoU on cooperation between the State Bank of Viet Nam and the Central
Bank of Pakistan (March 2004). • Agreements for Development Cooperation on fisheries and aquatic
environments (June 2006); • MoU on the establishment of Joint Business Forum (JBF) between Viet Nam
Chamber of Commerce and Industry (VCCI) and the Federation of Pakistan Chambers of Commerce and Industry (FPCCI) (December 2014).
• MoU on cooperation for trade promotion between the Viet Nam Trade Promotion Agency (VIETRADE) and Trade Development Authority of Pakistan (TDAP) (April 2015).
2.2. Bilateral Trade in Figures
No substantial trade took place in 80’sand 90’s. Bilateral trade has improved significantly in the recent years. In the year 2013-14, bilateral trade was $300 million only. However, due to hectic efforts by the Mission and other organs of the Government of Pakistan, bilateral trade has more than doubled. In the year 2017-18, bilateral trade continued its upward trajectory, reaching the highest ever total volume of US$743 million.
Pakistan’s exports to Viet Nam have reasonably improved in the last fiscal
year. During the fiscal year 2017-18, Pakistan’s exports to Viet Nam reached the highest ever level of US$313 million, which was US$46 million more than the fiscal year 2016-17. However, the trade balance is in the favor of Viet Nam as shown in table 4 data from Pakistan Customs (PRAL).

9
2.2.1. Pakistan’s Exports to Viet Nam Table 5: Pakistan Exports to Viet Nam (Increasing Commodities) Product 2016-2017 2017-2018 USD Million USD Million
1. Fish and Fish Prep. 110 123 2. Cotton cloth 36.3 36.3 3. Leather 25.6 26 4. Beef 11 15 5. Paper and paperboard 10 16 6. Raw cotton 9 13 7. Wheat 6.9 - 8. Feeding stuff for animals 4 12 9. Crude animal material 2 5 10. Sugar refined 1.2 1.5 11. Plastic materials 0.7 1.5
Data source: Statistics by Trade Development Authority of Pakistan (TDAP)
As is apparent in table 6, there was a remarkable increase in export volume of traditional (seafood, cotton cloth, cotton, and leather) and non-traditional items (food stuff, paper and paperboard, sugar refined and plastic materials) of Pakistan to Viet Nam between 2016-17 and 2017-18.
Leather, Pharmaceutical, Fisheries and Surgical Instruments are traditional sectors with higher export potential. In order to further boost export in these sectors,
Table 4: Pakistan- Viet Nam Trade Exchange from 2013-2018 Year Total Trade Import Export (million USD) (million USD) (million USD) 2013-2014 300 94 206 2014-2015 345 122 223 2015-2016 579 329 250 2016-2017 602 335 267 2017-2018 743 430 313 Source: Pakistan Customs (PRAL) *July-June Data

10
initiatives need to be undertaken including improvement of product design, fulfillment of drug registration process and innovations in productions.
Based on export surplus, potential of growth and increasing demand of Viet
Nam, the Mission is of the view that, for short to medium term export enhancement, the following products need to be focused: meat and meat products (especially beef), wheat, fruits and vegetables (citrus fruit especially kinnow, potato, onion and fresh vegetables). Table 6: Pakistan Exports to Viet Nam (Decreasing Commodities) Product 2016-2017 2017-2018 USD Million USD Million
1. Pharmaceutical Products 14 9 2. Cotton yarn 10 6 3. Oil seeds and Oleaginous, fruits 4.9 4.3 4. Surgical goods, medical 2.1 1.5 5. Fruits 2.9 0.9
Data source: Statistics by Trade Development Authority of Pakistan (TDAP)
Based on table 6 above, although Pakistan cotton yarn exported to Viet Nam witnessed a sharp decline during 2017-18 as compared to the same period 2016-17, Viet Nam market is highly dependent on raw materials for its garment and textile industry, therefore the export turnover of cotton yarn will be improved.
Fruits exported from Pakistan to Viet Nam had a big loss as Pakistan has yet
to fulfill the requirements for Plant & Plant- Products/Plant Origin by the Plant Protection Department, Ministry of Agriculture and Rural Development of Viet Nam. The issue needs attention of the Plant Protection Department, Ministry of National Food Security and Research of Pakistan. The Embassy has been repeatedly reminding on the issue.
Pharmaceutical products and Surgical Goods experienced a downward trend
in exports to Viet Nam during 2017-2018 as compared to the same period in 2016-17 due to Vietnamese registration regulations on healthcare sector. However, Viet Nam desires to modernize the healthcare system which should generate plenty of business in the upcoming years. In addition to new hospitals, opportunities also exist in relation to healthcare products and more specifically medical equipment and drugs. Almost, 80% of the pharmaceutical products and 90% of medical devices are imported. Viet Nam represents a potentially large healthcare and medical equipment

11
market. The Vietnamese government encourages import of medical equipment because local production cannot meet demands of the healthcare system. A national master plan to develop the healthcare network for the years up to 2020 requires increased level of Medical equipment and Pharmaceuticals imports. 2.2.2. Import (Exports of Viet Nam) Table 7: Pakistan Imports from Viet Nam 2016-2017 2017-2018 USD
Million USD Million
1. Electrical Machinery and Equipment 127 156 2. Coffee, tea, mate and spices 83 89 3. Man-made filaments 25 47 4. Fish and Crustaceans 19 15 5. Boilers and Machinery 14 15 6. Rubber and articles thereof 10 14 7. Chemical Products 8 9 8. Miscellaneous manufactured articles 5 8 9. Vehicles other than railway or tramway 5 7 10. Articles of Apparel and Clothing 3 6 Data source: Pakistan Customs/PRAL
Pakistan Customs showed huge imports of electrical machinery and equipment; coffee, tea, mate and spices and man-made filaments from Vietnam to Pakistan in the period 2017-18 as compared to the same period last year. Pakistan should increase the import duty on these products to balance the trade. Moreover, there was a declining trend in Pakistani import of coffee, tea, mate and spices due to more strict hygiene regulations imposed by Pakistan. However, Pakistan remained Viet Nam’s largest tea importer in the last few years. 2.3. Bilateral Investment Profile
Viet Nam currently receives high volume of Foreign Direct Investment. Investors from Pakistan have 12 investment projects in Viet Nam with a total registered investment capital of nearly 2 million USD. Pakistan ranks 79 out of 101 countries and territories investing in Viet Nam. Pakistan’s projects in Viet Nam are mostly small scale with average capital of 166,000 USD per project, mainly in the field of processing and manufacturing industry; counseling and import and export.

12
A typical investment project is the establishment of Blue Horizon Co., Ltd. with total registered investment capital of 1 million USD.
At present, Viet Nam does not have any project investing in Pakistan. For that matter, Vietnamese investments abroad are very small and are limited to mainly the two neighboring countries of Cambodia and the Lao PDR. It is highly unlikely that the Vietnamese companies will invest in the projects in Pakistan in the near future. However, the Mission keeps on promoting Pakistan as a potential market for excess capital of Vietnamese companies. 3. SWOT Analysis of Potential Sectors for Increasing Bilateral Trade
Vietnam is high-profile manufacturing country. Pakistan needs to concentrate
on export of raw material and non-traditional items. The imports of Vietnam in 2017 were 213 billion USD which is a huge destination for our export. Pakistan and Viet Nam have huge trade potential in areas of textile, leather, seafood, food products and IT etc. The Embassy has selected the following products for the long to medium term plan to achieve the maximum export growth objectives, including Seafood, Cotton, Yarn, Fabrics, Wheat and Flour, Fruits (Citrus) and Vegetables, Leather, Engineering Goods, Tobacco Materials and Beef. 3.1. Seafood
The total import of seafood of Viet Nam in 2017 was USD 1,440 Million from countries such as India, Norway, Taiwan, Japan and China. Pakistan seafood export to Viet Nam increased at a slow growth rate in the year 2017 as compared to the year 2016. One of the reasons is high import duty on imported seafood from Pakistan to Viet Nam and registration requirements for Pakistani seafood exporting companies by the National Agro-Forestry-Fisheries Quality Assurance Department (NAFIQAD), Ministry of Agriculture and Rural Development.
Data of Pakistan seafood exports to Viet Nam and duty on import as compared to its competitors is shown in the table on the next page (Data from January to December):
Table 8: Imports Seafood in Viet Nam - Pakistan comparison with other countries

13
Description Pakistan Competitors
2016 2017 India Norway China Taiwa
n Japan
Import Value 4.1 4.2 357 122 112 103 84
Market share (%) 0.29% 24.8% 8.5% 7.8% 7.2% 5.83%
Tariff 15%- 20%
10%- 18%-22.5%
5.5%-13% 0%
Source: General Department of Viet Nam Customs SWOT Analysis of Seafood
Strength Weaknesses Opportunities Threats
§ Significant export potential with a wider range of fish and fishery products.
§ Two fishing seasons: the August to November season for catching shrimp, and October to June season for catching Fish.
§ Marine fisheries account for about 60 percent of the total production, including both fish and shrimps.
§ Pakistani fish and fishery products are processed and exported to over
§ Viet Nam is an exporter of seafood with the exports of $8.3 billion in 2017, up 18% compared to the year 2016.
§ Leading importers of Viet Nam’s seafood products: US, Japan, China and Korea.
§ Key export items: tuna, squid and octopus and marine fish.
§ Turbulent weather hit the Mekong Delta region and environmental disaster 200 kilometers along from Viet Nam’s central coastline.
§ Drought, salinity intrusion
§ High price of material production
§ Material shortage for export processing
§ High demand for imports of raw materials (shrimp, tuna,
§ Strong competition from the biggest seafood exporters to Viet Nam are India; Norway; Taiwan; Japan and China.
§ High FDI flows in seafood industry of Viet Nam.

14
50 countries including Viet Nam, UAE, Thailand, Sri Lanka, Japan, China, Malaysia, Korea, Egypt and Saudi Arabia.
squid, octopus, and sea fishes) to create stability and competitiveness.
3.2. Cotton
The total import of cotton of Viet Nam in 2017 was USD 2,356 Million from countries such as USA, Brazil, Australia and India. Pakistan cotton exported to Viet Nam in 2017 was USD 13.8 Million with an increase of 70.6 % compared to the year 2016.
Data of Pakistan cotton exports to Viet Nam and duty on import as compared to its competitors is shown in the below table (Data from January to December):
Table 9: Imports Cotton in Viet Nam - Pakistan comparison with other countries
Description Pakistan Competitors
2016 2017 USA Australia India Brazil
Import Value 8.09 13.8 1,178 296 278 226 Market share (%) 0.59% 50% 12.6% 11.8% 9.6% Tariff 0% Source: General Department of Viet Nam Customs
SWOT Analysis of Cotton
Strength Weaknesses Opportunities Threats § Pakistan is the
fourth largest producer of cotton in the world and holds the third largest spinning
§ Inconsistency in yield of cotton crop.
§ Lack of latest means of production and falling
§ Viet Nam relies heavily on imported cotton to feed its growing spinning industry
§ Viet Nam cotton buyers are
§ Strong competition from biggest suppliers such as USA,

15
capacity in Asia after China and India.
§ High self-sufficiency in raw material
§ Abundant supply of indigenous cotton
§ Competitiveness from availability of cheap raw material.
§ Abundant use of cotton resources has made the Textile industry of Pakistan move towards the era of industrialization.
cotton crop output.
§ Lower production caused by damaging outbreaks of whitefly.
§ Lack of quality control
diversifying the importing markets.
§ Viet Nam’s cotton planted area is very small; Domestic cotton supply is less than 1% of the market demand.
§ Investment from Korea and Japan flows into cotton manufacturing units in Viet Nam.
Brazil, Australia and India, making up to 80% of the share of cotton.
3.3. Yarn
The total import of yarn of Viet Nam in 2017 was USD 1,814 Million from countries including China, Taiwan, Korea, Thailand and India. Pakistan yarn exports to Viet Nam decreased remarkably in the year 2017 as compared to the year 2016. However, in the short to medium term, Pakistan could improve its exports to Viet Nam by yarn quality as well as stable supply of yarn.
Data of Pakistan yarn exports to Viet Nam and duty on import as compared to its competitors is shown in the below table (Data from January to December):
Table 10: Imports Yarn in Viet Nam - Pakistan comparison with other countries
Description Pakistan Competitors 2016 2017 China Taiwan Korea Thailand India
Import Value 9.7 7.74 858 307 179 113 90

16
Market share (%) 0.43% 47.3% 16.9% 9.9% 6.2% 5%
Tariff 5% 0% 0% 2% Source: General Department of Viet Nam Customs
SWOT Analysis of Yarn
Strength Weaknesses Opportunities Threats § Self-
sufficiency in raw material.
§ Technology of biotechnology and genetic engineering to increase the quality and quantity of yarn production.
§ No geographic proximity
§ Less competitive cost
§ Pakistan has a disadvantage of higher Tariffs.
§ Rising charges of the energy sector increases the cost of production, making it difficult to compete with the other regional rivals.
§ Viet Nam has strong demand for cotton yarn at an estimated rate of 10%.
§ Viet Nam also imports yarn for its weaving and knitting industry.
§ FDI flows into the spinning sector have increased its spinning capacity, including 100 spinning mills with about 8 million spindles equivalent to 1.55 million tons of cotton-based and man-made yarn in 2016 likely expanded to over 2 million tons of yarns in 2017.
§ Improvement of domestic cotton yarns supply in Viet Nam.
3.4. Fabrics

17
The total import of fabrics of Viet Nam in 2017 was USD 11,366 Million from countries such as China, Korea, Japan, Thailand and India. Pakistan fabric exports to Viet Nam increased from 33.3 million USD in 2016 to 34.9 million USD in 2017.
Data of Pakistan fabrics exports to Viet Nam and the duty on import as compared to its competitors is shown in the table given below (Data from January to December):
Table 11: Imports Fabrics in Viet Nam - Pakistan comparison with other countries
Description Pakistan Competitors
2016 2017 China Korea Japa
n Thailan
d India
Import Value 33.3 34.9 6,077 2,040 659 251 61 Market share (%) 0.31% 53.5
% 17.95
% 5.8% 2.21% 0.54%
Tariff 10%-12% 0% 0% 0% 5% Source: General Department of Viet Nam Customs
SWOT Analysis of Fabrics
Strength Weaknesses Opportunities Threats
§ Cultural diversity and rich heritage, designers come up with new different and attractive designs which are appreciated worldwide.
§ Booming in fabric factories and manufacturing units means more supply.
§ No geographic proximity
§ Less competitive cost
§ Pakistan has a disadvantage of higher Tariffs.
§ Low Pakistani textile competitiveness due to poor quality standards and inability to timely
§ Almost 86% of fabric is imported by Viet Nam to cater the local textile-garment industry.
§ Vietnamese-made fabrics still below the standards of foreign markets lead to increased
§ Strong competition from China, Korea, Japan, Thailand and India.
§ Chinese fabric manufacturers gain almost 52% of the market share because of low price and more designs.

18
§ Increasing funds on textile sector to double the exports of textiles and clothing from the existing 13 billion dollars to 26 billion dollars by the year 2019.
§ Pakistan Textile City in Port Qasim, Karachi to meet the global competitiveness and challenges and as to provide value added textile industrial zone.
modernize the equipment, machinery and quality of labour
§ High costs, low labour productivity and inefficient production processes.
demand for fabric imports.
§ Demand of imported fabric will continue to grow as Viet Nam is focusing on made ups and their export to the US and the EU.
3.5. Leather
Total Import of Viet Nam for Textile, Leather and Footwear Materials and Auxiliaries in 2017 was 5,420 million (an increase of 7.14% compared to the year 2016 at 5,059 million USD) from the countries such as China, Korea, Taiwan, USA, Japan and India etc.
Data of Pakistan leather exports to Viet Nam and duty on imports as compared to its competitors is shown in the below table (Data from January to December):
Table 12: Import Value of Textile, Leather and Footwear Materials and Auxiliaries
Description Pakistan Competitors
2016 2017 China Korea Taiwan USA Japa
n Indi
a Import Value 25 22.4 2,048 753 483 356 250 105.
4

19
Market share (%)
0.49%
0.41% 37.8% 13.9% 8.9% 6.6% 4.6% 1.94
%
Tariff Leather
materials: 3%-5%-10%
0-15% 0-10%
0%-1%-2%-5%-9%
Source: General Department of Viet Nam Customs
SWOT Analysis of Leather
Strength Weaknesses Opportunities Threats § Up to the year
2017, there are nearly 600,000 workers working in the industry, consisting 6.5% from the whole industry sector labor force.
§ The main labor forces of the industry are mainly at lower level of skill, and are frequently moving.
§ The variety of labor force was very high since late 2017 to early 2018, in some particular
§ Most of companies are operating at the processing contract; therefore they have less interests as well as dynamics.
§ Value - addition of leather particularly in footwear is still at low rate (less than 40%).The incomprehensive development between raw material production and footwear production. A lot of raw materials still have to import, especially materials for the upper shoes „
§ The demand of leather footwear from most of countries in the world is now highly increasing because of the living conditions improving.
§ The ratio of products exported to the US market has been increasing since 2012. There are many companies focusing their production on this potential market, especially FDI and joint
§ Competitive capacity of footwear enterprises is at low level. Therefore they have to face a lot of difficulties with stronger competitors from the region and China. The main reason could be understood as lacking resources of raw materials and low price of products from other competitive countries.
§ Staffs for leather shoes designing and

20
companies this rate was at 35- 40%. „
§ The main part of labor force was trained in the production line. Most of them are women - 85%.
§ Immigrant employments take the ratio of 70% from the whole labor force of enterprise.
§ Facing with pressure from labor force: lacking, unstable, low level of skill and technique, lack of high tech workers, engineers, and management staff
§ Infrastructure and service works still limited, not all meeting requirement of importers and consumers
§ Dealing with competition in term of products price, processing cost are narrowed when high input cost (cost of materials, other issues as: production cost, transportation cost, etc.)
venture companies.
§ The government issues, policies on promoting to speed up export and production, giving more advantages to the leather and footwear companies, specially exporting companies.
§ Non trade barriers will create more favorable conditions for business on products of industry.
product development are also limited. Companies don’t have enough talented and skilled staff for its production management as well as to develop the potential markets.
§ Advantage of Viet Nam regarding labour force is still a factor of competition.
3.6. Fruits (Citrus) and Vegetables

21
The total import of fruits and vegetables of Viet Nam in 2017 was USD 1547 Million from top biggest markets such as Thailand, China, USA, Australia and New Zealand.
Data of Pakistan fruits and vegetables export to Viet Nam and duty on import as compared to its competitors is shown in table on the next page.
Table 13: Import Value of Fruits and Vegetables of Viet Nam
Description
Pakistan Competitors
2016 2017 Thailand
China
USA
Australia
New Zealan
d Import Value - - 410 219 85 42 22
Market share (%) - - 44.3% 23.7
% 9.2% 4.54% 2.4%
Tariff 13%-15%-17%-20%-25%-27%-
30%-40% 0% 0% 0%-5%
Source: General Department of Viet Nam Customs SWOT Analysis
Strength Weaknesses Opportunities Threats
Fruits § Abundant source
for export of fruits such as Kinnow and Mango. Main export markets are European countries, i.e. Afghanistan, Bahrain, Dubai, Kuwait, Saudi Arabia, United Kingdom,
§ Sophisticated procedure for registration from National Agro-Forestry- Fisheries Quality Assurance Department, Ministry of Agriculture and Rural Development of Viet Nam.
§ Increasing demand for the imports of fresh vegetables and fruits in Viet Nam with a year-on-year increase of 54.7 per cent.
§ Viet Nam has preferable demand of imported fresh
§ Strong competition from Thailand, China, USA, Australia and New Zealand.
§ Trend of consuming organic and home-planted fresh fruits

22
France, Malaysia and Singapore.
§ High production and quality of dates around 535,000 tons per year.
§ Pakistan ranked second biggest pine nuts exporter after China. Main export markets: Germany, France and Middle East.
Vegetables § Onion, Potato,
mushroom and dry chillies, cabbage, lettuce etc exported to many countries.
§ Longer distance from Pakistan to Viet Nam than Thailand, China causes high charges for temperature control and storage.
§ Low quality and standards of fresh and processed vegetables and fruits.
food and vegetables.
and vegetables in Viet Nam.
3.7. Wheat and Flour
The total import of wheat & flour of Viet Nam in 2017 was USD 994 Million from top biggest markets such as Australia, Russia, Canada, Brazil and the United State of America.
Data of competitors of Pakistan in export of wheat & flour to Viet Nam and duty on import is shown in the table below:
Table 14: Import Value of Wheat and Flour
Description Pakistan Competitors
2016 2017-18* Australia Canada Russia Brazil USA
Import Value - 6.8 424 197 141 21 14

23
Market share (%) 37.7% 1.57% 2.36% 7.7%
Tariff 5%-10%-15%-20% 0%-5%
Source: General Department of Viet Nam Customs *July-June Data from Trade Development Authority of Pakistan (TDAP)
SWOT Analysis
Strength Weaknesses Opportunities Threats
§ Pakistan is the Asia’s third-largest producer with a surplus to export.
§ Good growing conditions have led to an increase in Pakistan’s wheat production in 2017-18, up 800,000 tons to 26.3 million tons.
§ There is a trend of shifting towards more dairy, meat, and other higher-value food products in their diet.
§ High demand for import of wheat in Viet Nam (around 4.66 million tons of wheat valuing 994 million USD in 2017).
§ Rising population and increased dependence on wheat and wheat-based food products resulting in an increase in imports.
§ Strong competition from the biggest wheat exporters to Viet Nam were Australia, USA, Russia, Canada.
§ Strict standards and requirements from Ministry of Agriculture and Rural Development of Viet Nam for wheat import.
3.8. Software and IT-related services
In 2017, Vietnam imports on IT were at $6.4 billion, with software and
services representing 4.6 percent and 6.6 percent of the total imports. Major players in the software market include suppliers from the U.S, Germany, China, and Russia. Increased spending to upgrade IT infrastructure to improve the operational efficiency and business competitiveness of Vietnamese enterprises reveals an opportunity for export of Pakistani software and IT-related services to Vietnam. SWOT Analysis

24
Strength Weaknesses Opportunities Threats
§ The total size of the software sector is approximately $6.5 billion, a steady growth of 4%.
§ During FY 2017-18, Pakistan’s software exports were approximately $5 billion, up 8% higher than the previous year.
§ Major international software brands from the United States, the United Kingdom, Germany, Spain, and China have already established a strong presence in Pakistan.
§ Knowledge-base of start-ups;
§ Access to a trained HR base
§ Access to Venture Capital funds.
§ IT/ITeS Sector is the fastest growing sector of Pakistan contributing about 1% of GDP of Pakistan at about 3 billion USD. IT sector exports have grown 30% YOY in the last 5 years.
§ Startups like careem, daraz and their success is bringing investment into Pakistan as evident from the recent acquisition of daraz and easypaisa by AliBaba. Traditional investors from other Pakistani sectors like textile, fertilizers are also taking special interest in the startup ecosystem.
§ Strong competition from the biggest IT products exporters to Viet Nam were South Korea, China, Taiwan, Japan and USA which were favored of 0% import duty.

25
3.9 Engineering Goods 3.9.1 Pharmaceutical Products
The total import of Pharmaceutical products of Vietnam in 2017 was 2,819 million USD from top biggest markets such as France (342 million USD), Germany (316 million USD), India (283 million USD), Korea (188 million USD) and Italy (179 million USD) (Statistics released by the General Department of Vietnam Customs). Data of Pakistan pharmaceutical products export to Vietnam as compared to its competitors is shown in the below table: Pharmaceutical Products Pakistan Competitors
2016 2017* France Germany India Korea Italy Import Value 22.63 14 342 316 283 188 179 Market share (%) 0.88% 0.5% 12.1% 11.2% 10% 6.7% 6.3%
Tariff 0-3-5-8-10% 0-3-5-7%
Data Source: General Department of Vietnam Customs
SWOT Analysis of Pharmaceutical Products
Strength Weaknesses Opportunities Threats § Progressive
growth of Pakistan pharmaceutical industry over the years.
§ Capacity to manufacture a variety of product ranging from simple pills to sophisticated biotech,
§ No geographic proximity
§ Less competitive cost
§ Less effective marketing strategies for pharmaceutical sector
§ Low R & D expenditure leads to insufficient
§ Huge demand of quality healthcare, an increasing healthcare expenditure and even a growing industry to cater the medical devices and pharmaceuticals in Vietnam.
§ Strong competition from France, Germany, India, Korea, Italy with a large proportion of share in Vietnam market.
§ Pakistan needs to fulfil the complex procedure of Registration of Company and Pharmaceutical Goods/Drugs/Materials.

26
oncology and value -added Generic compounds.
§ Quality producers and many units approved by regulatory authorities all over the world.
§ High-quality essential drugs at affordable prices to millions.
§ Pakistani medicines are competitive price-wise and are of good quality.
research on the newly emerging diseases in Vietnam.
§ Pakistan has a disadvantage of higher Tariffs.
§ 80% of the pharmaceutical products imported.
§ Local production cannot meet demands of the healthcare system.
3.9.2 Surgical Goods
In 2017, Vietnam imported Surgical Goods worth 562 million USD, a steady growth of 29% per annum according to ITC calculations based on UN COMTRADE statistics. However, in 2017-18, Pakistan exported surgical goods worth 1.5 million USD to Vietnam, a decrease of 0.6 million USD (28.6%) as compared to the period 2016-17 (Statistics by Trade Development Authority of Pakistan).
SWOT Analysis of Surgical Goods
Strength Weaknesses Opportunities Threats

27
§ Production of over 150 million pieces a year (around Rs 22 billion), 95% out of the total production is exported.
§ Special capabilities to penetrate high income markets such as Germany, USA, France, Belgium etc.
§ Competitive price than more sophisticated producers such as Germany and France.
§ No geographic proximity
§ Less competitive cost
§ Lack of product diversification
§ Inadequate shift out of low value disposable instruments to high value sophisticated products and uncertain business environment.
§ Ineffective distribution channels.
§ Huge demand of quality healthcare.
§ Increased healthcare expenditure.
§ Imported surgical goods face low import duties and no quota restrictions.
§ Strong competition from superior technologically for innovation and better materials for manufacturing countries like USA, Germany, Italy, Korea and Japan.
3.9.3 Cutlery
In 2017, Vietnam imported Cutlery worth 61 million USD from South Korea, China, Taiwan, Japan, Germany, USA and Thailand etc (statistics released by UN COMTRADE). Pakistan has exported Cutlery to Vietnam at a modest rate which was 0.6 million USD during 2017-18. SWOT Analysis of Cutlery Strength Weaknesses Opportunities Threats § An installed
annual production capacity of
§ Lack of expertise in design and quality of raw materials.
§ 90% consumer goods are mainly imported to cater
§ Strong competition from countries like USA, Germany,

28
around 10-12 million pieces.
§ The cutlery industry contributes 0.11% to the country’s GDP and has a share of 0.25% and 6.5% in total exports and engineering exports respectively.
§ Available and abundant of raw materials used include stainless steel sheet, re-melted metals, brass sheets, densified wood, camel bones, steel wire and plastics. Among different grades of steel being used for cutlery is Damascus steel which yields best finish for the products.
§ Due to low-tech production methods, manufacturers do not want to hire technically qualified and highly skilled workers, leading to professional and operational deficiencies in the labour market.
increasing population and higher standard of living.
§ Vietnamese consumers tend to buy more imported products than local ones.
§ The local production does not meet the domestic demand.
Thailand, Korea and Japan with higher quality, better design and diversification.
3.9.4 Sports Goods

29
In 2017, Vietnam imported Sports Goods worth 546 million USD from China, Netherlands, Japan, Italy, USA etc. Pakistan exported Sports Goods (Hs code 9506 including Articles and equipment for general physical exercise, gymnastics, athletics, other sports, etc) with the amount of 113,000 USD in 2016 released by UN COMTRADE statistics. SWOT Analysis of Sports Goods Strength Weaknesses Opportunities Threats § Exported
sports goods worth $332.516 million during 2017-18 against the trade of $308.361 million during July-June (2016-17), showing growth of 7.83 percent
§ Exports of footballs increased by 9.38 percent by going up from $152.565 million last year to $166.881 million.
§ Pakistan exports sports goods to more than 90 countries.
§ Less use of technology in sports goods industry § Insufficient sources of energy to meet the energy requirements/ demand of Pakistani industrial sector. § Lack of labour force in the industry.
§ Vietnam is predominantly a Sports loving country.
§ Considerable demand of products specifically HS Code 950691 (Articles and equipment for general physical exercise, gymnastics or athletics); HS Code 950699 (Articles and equipment for sport and outdoor games; swimming and paddling pools); HS Code 950659 (Badminton and similar rackets, whether or not strung (other than tennis
§ Strong competition from China, Netherland, Japan, Italy, USA and Taiwan etc where the imports are favoured with lower import duty or 0%.

30
§ A wider range of Sports goods.
§ Pakistani footballs used in the FIFA World Cup.
rackets and table-tennis etc.); HS Code 950662 (Inflatable balls); HS Code 950669 (Balls excluding inflatable, tennis balls, golf balls, and table-tennis balls); HS Code 950632 (Golf balls) and HS Code 950651 (Tennis rackets, whether or not strung excluding table-tennis bats).
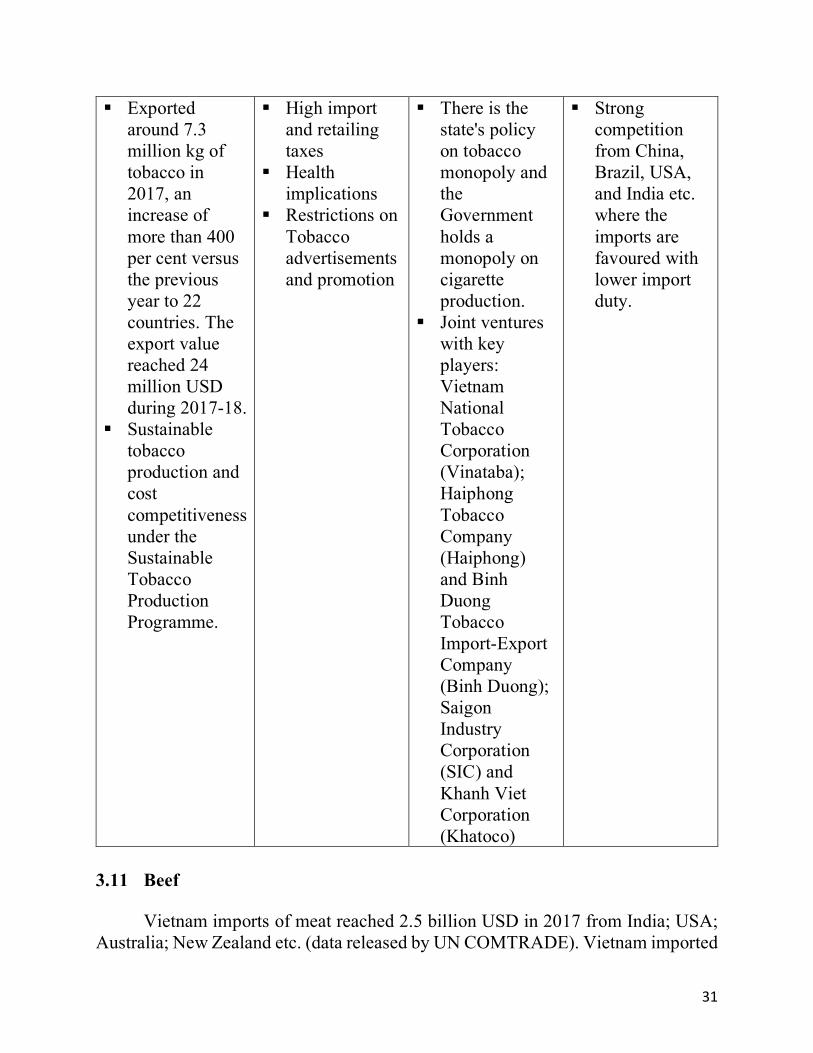
3.10 Tobacco Materials
Vietnam imports of tobacco materials reached 318 million USD from China (96 million USD); Brazil (90 million USD); USA (23 million USD); India (19 million USD) etc. (data by the General Department of Vietnam Customs. Pakistani exports of tobacco to Vietnam are still at a modest rate while Pakistan’s exports to the world reached 26 million USD during 2017-18 based on data by the Trade Development Authority of Pakistan. SWOT Analysis of Tobacco Materials Strength Weaknesses Opportunities Threats
31
§ Exported around 7.3 million kg of tobacco in 2017, an increase of more than 400 per cent versus the previous year to 22 countries. The export value reached 24 million USD during 2017-18.
§ Sustainable tobacco production and cost competitiveness under the Sustainable Tobacco Production Programme.
§ High import and retailing taxes
§ Health implications
§ Restrictions on Tobacco advertisements and promotion
§ There is the state's policy on tobacco monopoly and the Government holds a monopoly on cigarette production.
§ Joint ventures with key players: Vietnam National Tobacco Corporation (Vinataba); Haiphong Tobacco Company (Haiphong) and Binh Duong Tobacco Import-Export Company (Binh Duong); Saigon Industry Corporation (SIC) and Khanh Viet Corporation (Khatoco)
§ Strong competition from China, Brazil, USA, and India etc. where the imports are favoured with lower import duty.
3.11 Beef
Vietnam imports of meat reached 2.5 billion USD in 2017 from India; USA; Australia; New Zealand etc. (data released by UN COMTRADE). Vietnam imported

32
262,321 live cattle and nearly 42,000 tonnes of meat (mainly beef with bone) worth a total of 410 million USD in 2017.
While Pakistan exported beef worth 179 million USD during 2017-18 (data
by the Trade Development Authority of Pakistan). There is huge potential for beef exporting from Pakistan to Vietnam. SWOT Analysis of Beef Strength Weaknesses Opportunities Threats § Pakistan is
ranked 14th of the largest exporters of beef in the world, accounting for 0.62% of the world total export.
§ Competitive advantage
§ Wider ranges of meat exports comprising beef, mutton, lamb and their products.
§ Limited market access process,
§ Lower prices and uneven order placements.
§ Pakistan Halal Authority certification process is a bit slow
§ Meat processing and packaging in Pakistan is not catching up fast with that of advanced nations like the US, Australia and New Zealand.
§ A rising trend in demand for meat, especially beef (fresh, frozen, or chilled) to cater the rising population of 95 million people in Vietnam.
§ Huge changes in food consumption that Vietnamese people nowadays prefer beef to pork and chicken. In 2017, domestic demand for beef had a year-on-year increase of 4-5 per cent to about 260,000 tonnes.
§ Strong competition from India, USA, Australia, New Zealand etc. where the imports are favoured with lower import duty or 0%.

33
4. Important Issues and Recommendations
In order to increase the bilateral trade up to $1 billion in the coming years, the two countries should cooperate in diversified sectors such as energy (electricity, oil and gas, transmission tower, utility pole and other electrical construction), textile & garment, chemical, leather & footwear, IT & telecom, auto & machinery (engine & industrial equipment, instruments & agricultural machinery, auto & motorbike), cutlery and surgical goods, pharmaceuticals, sports goods, gems and jewelry, food processing and infrastructure development. The two countries should explore the possibilities of cooperation in the seafood sector such as setting up joint ventures in shrimp farming and seafood processing sector.
Moreover, Pakistan and Viet Nam should enhance bilateral trade cooperation through further exchange of business delegations, participation in trade fairs and exhibitions, and increased cooperation among their respective chambers of commerce and industry and trade promotion organizations. Such activities would help increase volume of trade between Viet Nam and Pakistan.
The importance of the removal of trade barriers in the process of expanding
trade ties between the two countries cannot be overstated. The two countries need to work for a mutually beneficial trade agreement i.e. a Preferential Trade Agreement (PTA) leading to Free Trade Agreement (FTA). 4.1. Sectors for export development
In the following table, the Mission makes some suggestions for increasing exports of Pakistan in the key sectors with potential of export.
Products Increase/Decrease
Reason for Increase/Decline of
Product/Exports
Recommendations for Increasing
Exports/Imports Seafood Increase Upgraded cold storage
facilities and phytosanitary standards. Increased the possibilities of cooperation in seafood sector through setting
Strong competition from the biggest seafood exporters to Viet Nam are India; Norway; Taiwan; Japan and China. High FDI inflows in seafood industry of Viet Nam.

34
up joint ventures in shrimp farming and processing.
The required seafood from Pakistan includes cuttlefish and squids. Pakistani seafood companies should also diversify range of seafood product, increase the production and upgrade the storage technique to meet the increasing demand of seafood industry of Viet Nam. Both countries should work on PTA to reduce import duty on imported seafood from Pakistan to Viet Nam and sophisticated registration requirements for Pakistani seafood exporting companies by the National Agro-Forestry- Fisheries Quality Assurance Department (NAFIQAD), Ministry of Agriculture and Rural Development.
Surgical Goods
Decrease Surgical Goods are subject to regulations and licensing requirements set by the Ministry of Health (MOH). By regulation, only companies with a legal business entity registered in Viet Nam and that have an import license are eligible to distribute in Viet Nam.
To fulfil the requirements, foreign suppliers often sell their products through local distributors or agents. Good representatives provide immediate access to an established marketing network and in-depth knowledge of pertinent regulations. Also, Pakistani surgical goods companies should register their catalogues with the Ministry of Health and compete for

35
tenders given by the Vietnamese authorities.
Pharmaceutical Products
Decrease For Pharmaceutical Products, Viet Nam follows the ASEAN region drug and company registration procedures. The registration takes up to three years, therefore there is declining trend of exports from Pakistan.
For increase of Pharmaceutical Products exports, following certifications may be obtained by the pharmaceutical companies: - PICS certification - Euro GMP certification - WHO certification - FDA certification Moreover, Pakistani companies should study the complex procedure of Registration of Company and Pharmaceutical Goods/Drugs and submit the required documents with the Drug Administration of Viet Nam, Ministry of Health, Viet Nam
Raw Cotton Increase There is fluctuation in demand for cotton/cotton yarn/cotton cloth as strong competition from biggest suppliers such as USA, Brazil, Australia and India, making up to 80% of the share of cotton. Moreover, Pakistan’s crop in the year 2017/18 did not meet the requirements (humidity and trash) and standards of the textile industry in Viet Nam.
Viet Nam market is highly dependent on raw materials for its garment and textile industry imported from almost China, Bangladesh, India, Italy, Korea, Japan and Pakistan. Viet Nam has imported high proportion of raw cotton, cotton yarn and fabrics from Pakistan to feed its growing spinning industry. Also, Viet Nam cotton buyers are diversifying the imported markets. Pakistan cotton, cotton yarn and fabrics should be qualified in bulk quantity.
Cotton Yarn Decrease Cotton Cloth Increase

36
Leather Increase Viet Nam is highly dependent upon raw material import from China, India, Italy and Pakistan. Manufacturing and processing units in Viet Nam need raw materials with large quantity as Viet Nam mainly exports to USA, EU. Pakistan produces excellent quality raw hides which are required for Viet Nam’s multi-billion-dollar footwear/apparel exports.
Viet Nam’s exports of Footwear however have been increasing considerably ever since its relationship with US began to improve. The main drivers of exports of footwear exports are FDI in Viet Nam. More than 50% of industry is based on FDI and Joint Ventures since 2004. Most of the production destined for exports is done by these companies. Pakistan leather keeps controlling the quality of leather materials to export to Viet Nam.
Wheat Increase The rising population of around 97 million and increased dependence on wheat and wheat-based food products.
Viet Nam is potential market to explore for export of wheat. However, the trend of Viet Nam’s imports is on the rise with increased dependence on Australia, Brazil and USA because of high quality products. Pakistani wheat exporters should focus on the quality and diversification.
Beef Increase Viet Nam serves as a huge market for processed and unprocessed food products due to its growing economy, increasing purchasing power and population of around 97 million.
Ministry of National Food Security & Research should take steps to access Vietnamese market for our products and fulfill the requirements of the Circular No.25/2010 Guidance on food hygiene and safety control for imported foodstuff of animal origin by National Agro-Forestry-

37
Fisheries Quality Assurance Department (NAFIQAD) (copy attached), Ministry of Agriculture and Rural Development of Viet Nam.
Citrus Pakistan has yet to fulfil the requirements for Plant & Plant- Products/Plant Origin and therefore not registered in Vietnam.
Support needed from Competent Authority to fulfil the requirements of Plant Quarantine & Food Safety to register Pakistan in the registered exporting country list for export of citrus to Vietnam.
4.2. Participation in Trade Fairs The following trade fairs are proposed for participation in the year 2019:
a) The 21st International Shoes & Leather Exhibition- Viet Nam a. Tanners b. Leather – finished and unfinished goods
b) Viet Nam Textile & Garment Industry Expo- (SaigonTex 2019) a. Cotton, yarn, fabrics b. Textile Products
c) Viet Nam Fisheries International Exhibition (VIETFISH 2018) a. Fishery products: shrimp, octopus etc.
d) The 17th International Viet Nam Trade Fair- Viet Nam Expo 2019 at Saigon Exhibition and Convention Center (SECC), Ho Chi Minh City
a. Home Textiles/Furniture/Handicrafts b. Food c. Engineering Goods d. Sports Goods e. Cutlery
e) Viet Nam Food Expo 2019 a. Food and Foodstuff

38
b. Fruits and Vegetables c. Wheat
The most effective strategy for establishing and promoting buyer-seller contacts is by promoting the meetings of Vietnamese buyers with the Pakistani suppliers on the leading trade fairs held in Viet Nam. These exhibitions are Viet Nam’s leading fairs in their respective product categories and serve as the best platform for the buyers to meet with Pakistani suppliers exhibiting at these fairs. The commercial wing will motivate the importers/buyers to participate in these fairs, thus providing an opportunity to ensure maximum exposure of Pakistani products to the business community. 4.3. Vietnamese Delegations to Pakistan
The Mission has proposed the delegation from Viet Nam Chamber of Commerce and Industry to have meetings with Federation Pakistan Chamber of Commerce and Industry (FPCCI) in Pakistan under the umbrella of Joint Business Council in April, 2019. Viet Nam Chamber of Commerce and Industry has already been approached for formation of the delegation.
The Mission has also proposed the delegations of Vietnamese buyers to visit
Pakistan during the 2nd edition of Texpo Pakistan in April, 2019. The promotional materials of Texpo Pakistan 2019 are under process by the Trade Development Authority of Pakistan (TDAP). 4.4. Networking with buyers/importers
The Section intends to keep a good networking/relationship with the existing buyers and use them as references for other buyers to source from Pakistan. The Mission will also get in touch with those buyers who are not importing from Pakistan already or importing some product categories but have the potential to source other products also to Pakistan. The Mission will take the following actions for networking with the ultimate objective of enhancing bilateral trade:
• Provide the businesspersons with necessary facilitation e.g. visa facilitation and
hospitality in Pakistan (through TDAP) during their visits to Pakistan • Meetings with the CEOs & sourcing managers of the brands/chain stores

39
• Invitations to the national day and other occasions • Gifts of Pakistani products on important occasions • Greeting messages on important events like Tet, Vietnamese new year • Meetings with Chambers of Commerce • Meetings with Associations 4.5. Effective Marketing Campaign for Pakistan’s participation in trade
fairs
A professional marketing campaign for each fair will be designed and executed in coordination with the TDAP. The campaign will include the following tools: • Direct Mailing – dispatch of information brochures and letters to the buyers • E-Blasts – a professionally designed stream of email messages to be sent to the
buyers • Telemarketing – telephone calls to the leading buyers by the Commercial
Secretary and the Trade Development Officer • Institutional support – securing support of the relevant associations and
chambers of commerce • Meetings/Personal Selling – Commercial Secretary’s meetings with the leading
buyers
Besides arranging the logistics of the Pakistan Pavilion on professional lines, the main focus of trade fair participation will be a professionally designed marketing plan for attracting the trade visitors/buyers to the Pakistan Pavilion. The marketing plan will include the tools for: Pre-event marketing – to attract the buyers, both potential and existing buyers of relevant Pakistani products to visit the subject trade fair (and Pakistan Pavilion) On-site marketing – to attract the buyers, already on the show floor, to visit the Pakistan Pavilion. 4.6. Registration of Pakistani agri and animal products with the National
Agro-Forestry-Fisheries Quality Assurance Department (NAFIQAD) of Viet Nam
The Pakistani food products of meat, fruit, and vegetables origin have to be registered in Viet Nam. Viet Nam is one of the largest importers of food and

40
foodstuff from the world. Unfortunately, Pakistani food products like orange, meat (beef/mutton) are yet to be registered in Viet Nam.
Pakistan has yet to fulfill the requirements for Plant & Plant- Products/Plant Origin and Meat and Meat Products/Animal Origin:
Plant Quarantine for Citrus: To initiate the PRA process, the National Plant Protection Organization of Pakistan needs to provide Ministry of Agriculture and Rural Development of Viet Nam with the technical information package for the fresh fruits specified in the Annex 1 of the Circular 36/2014/TT-BNNPTNT dated 31st October 2014 (copy attached) for conducting PRA. Based on the results of the PRA report, PPD will develop Phytosanitary import requirements before issuing Phytosanitary import permit for the results.
Food Safety: For Food Safety approvals in Viet Nam, Pakistan’s Plant Protection Department should contact the National Agro-Forestry-Fisheries Quality Assurance Department of Viet Nam (NAFIQAD) for support. TDAP may take up the matter with the Plant Protection Department of Viet Nam to register Pakistan in the importable countries list of Viet Nam.
Animal Quarantine: For import of meat and meat products the requirement as laid down in Circular 25/2010/TT-BNNPTNT of Ministry of Agriculture and Rural Development of Viet Nam are to be met.
The Embassy of Pakistan has been working with Plant Protection Department of Viet Nam, Ministry of Agriculture and Rural Development, and Ministry of Industry and Trade of Viet Nam for the registration process. However, the Embassy would need the support of the Ministry of Commerce and other relevant departments of the Government of Pakistan to complete all the requirements of NAFIQAD to increase exports of Pakistan in these vital sectors. 4.7. Registration of Pakistani Pharmaceutical & Surgical Products with the
Ministry of Health of Viet Nam (MOH)
Viet Nam follows the ASEAN region drug and company registration procedures. A new drug takes almost five years to enter the Vietnamese market. The

41
registration alone could take up to three years. There is a declining trend of exports from Pakistan as most of the Pakistani pharmaceutical companies are not registered in Vietnam in the recent years.
Viet Nam uses a grading system to divide companies into different groups that decide how much they can be involved in bidding; a grade of 1 provides the most freedom and 5 the least. Grade 1:
• Countries that are part of the International Conference on Harmonization (ICH); or
• Pharmaceutical companies that are based in Australia; or • Manufacturers certified by PIC/S GMP or EU GMP; or • Manufacturers that have won the World Health Organization’s (WHO) GMP
certification given by the Vietnamese government and sell their products to members of ICH.
Grade 2: Companies must be part of the European Union CMP or certified with GMP by PIC/S. Grade 3: Pharmaceutical producers who have achieved WHO’s FMP awarded by the Vietnamese government. Grade 4: The products must have gone through the bioequivalence Grade 5: All other drugs. Most of the Pakistani companies exporting to Viet Nam market fall in the Grade 5 criterion and are therefore competing with a host of local and foreign companies who haven’t got any grading. The Mission recommends that the pharmaceutical sector of Pakistan may kindly be urged to get itself certified with PIC/S GMP (Pharmaceutical Inspection Co-operation Scheme Good Manufacturing Practice) or EU GMP. The companies that have these certifications may be asked to register their products in Viet Nam for their export. Surgical Goods
Viet Nam imports medical equipment worth almost a billion dollar per annum. However, most of this equipment is hi-tech like ultrasound machines, x-ray

42
machines, endoscopy equipment, blood pressure/ECG monitors, patient monitors etc. For details, please see figure below:
Pakistani surgical exporters are mainly exporting items that fall in the category of Other, which is 44% of the total market. Still this is a sizeable market if the surgical goods exporters could market their products properly in the Vietnamese market. At the moment, most of the surgical products are supplied in the Vietnamese market by the ‘product carriers’, who fly into Viet Nam with their bags full of surgical instruments.
Surgical Goods are subject to regulations and licensing requirements set by the Ministry of Health (MOH). By regulation, only companies with a legal business entity registered in Viet Nam and that have an import license are eligible to distribute in Viet Nam. To fulfil this requirement, foreign suppliers often sell their products through local distributors or agents or maintain an office in Viet Nam. Good representatives provide immediate access to an established marketing network and in-depth knowledge of pertinent regulations.
The Embassy recommends that the surgical goods manufacturing companies may be asked to register their catalogues with the Ministry of Health and compete for tenders given by the Vietnamese authorities as still, 90% of the health sector comprises of government operated hospitals and clinics. The Embassy shall be happy to share the details of tenders, provided the companies from Pakistan are registered with the Ministry of Health of Viet Nam. Relevant information required for registration of products is given below.

43
5. Request for Assistance from the MoC & TDAP
The Mission needs support of the Ministry of Commerce and TDAP in the following areas: 5.1. Statistics For trade data, there is a discrepancy between the statistics of Viet Nam Customs and Pakistan Customs. The Ministry of Commerce and the TDAP are requested to kindly analyze the two data sets shared in this business plan and advise on the reasons for discrepancy in the two data sources. The Mission also requests that the MoC and TDAP may kindly share the accurate data in a timely fashion so that the Mission could keep track of the trends of increase and decrease in the bilateral trade of both countries for comprehensive analysis and subsequent suggestions. 5.2. Visit of Delegations
In order to ensure professional/effective execution of the marketing campaign, the Mission requires the following information from TDAP, 2-3 months in advance for each fair.
• The final list of exhibitors from Pakistan subsidized by TDAP • The final list of all the exhibitors from Pakistan (including those outside the
TDAP-sponsored group) along with their product line details and manufacturing capabilities.
• Copy of brochure for Pakistan pavilion (if available) • Publicity material on the related product(s)
5.3. Follow up on the decisions of the Joint Ministerial Commission (JMC)
and the Joint Trade Commission (JTC) In the follow up of the decisions of the Fourth Sessions of Pakistan- Viet Nam Joint Ministerial Commission and Joint Trade Commission, the Ministry of Commerce and TDAP may kindly support the Mission in deepening cooperation under the MoU signed between TDAP and VIETRADE.

44
The Ministry of Commerce is also requested to propose a draft Preferential Trade
Agreement leading to Free Trade Agreement so that the same could be negotiated with the Government of Viet Nam.
The government of Pakistan may also kindly activate the Joint Working Group
in the field of Agriculture for increasing cooperation in this vital sector. 5.4. Wheat Export
Viet Nam is a huge market for export of wheat. The quota of export set by the Government should be extended for the upcoming years to maximize the export turnover. The Pakistan Flour Mills Association may form a delegation to visit Viet Nam along with samples of wheat produced in Pakistan. The Mission will provide assistance to arrange business to business meetings in Viet Nam with wheat importers and associations. 5.5 Citrus Export Citrus is one of the popular fruits in Vietnam. The production capacity of Vietnam for orange/mandarin reached 772.6 thousand tons in 2017, up 20.4 % over the previous year (Statistics from General Statistics Office of Vietnam). However, domestic production is much less than the local demand, mainly because of the occurrence of several diseases. The imports of Citrus rose very rapidly from 24 million USD in 2016 up to 305 million USD in 2017 (based on UN COMTRADE statistics). Citrus was imported from China, Australia, USA, and South Africa as shown in below table 16 (UN COMTRADE statistics released till 2016).
Table 16: List of supplying markets for Citrus imported by Vietnam Unit: USD Million
Exporters Imported value in 2014
Imported value in 2015
Imported value in 2016
China 15.7 13 14 Australia 2 1.1 4.7 USA 2.4 1.9 3 South Africa 1.9 2.7 1.4

45
Data source: UN COMTRADE statistics
Pakistan is amongst the top citrus producing countries of the world and its ‘Kinnow’ is acknowledged for its delicious taste and nutritional value. Vietnam can be an ideal destination for Pakistani Kinnow because of huge demand. Especially, the consumption of oranges/mandarin increases in the months of January and February which coincide with Tet Festival (Vietnamese New Year).
To promote Pakistani Kinnow, the Embassy of Pakistan, Hanoi with the help
of Trade Development Authority of Pakistan in close coordination with the local organizations held a Pakistan Food Tasting Festival at AEON Mall Long Bien, Hanoi to promote the Oranges (Kinnows) during the Tet season (Vietnamese New Year- Tet Nguyen Dan).
The Pakistani Kinnow has still not made it to the Vietnamese market due to
registration requirements (Circular 12/2015 as attached). The issue is pending with the Department of Plant Protection, Pakistan. The Mission pursued the matter of obtaining waiver with the Plant Protection Department (PPD) of the Ministry of Agriculture and Rural Development, Ministry of Industry and Trade and General Department of Vietnam Customs. However, the Mission received a response from the DPP, the fresh Oranges (Kinnows) from Pakistan are not analyzed with pest risk in accordance with the regulations, therefore, the Plant Quarantine Waiver/License may not be issued to import Pakistani Oranges (Kinnows) into Vietnam for import of samples. The Mission also approached the General Department of Vietnam Customs to ascertain the importability of Oranges into Vietnam for sampling and distribution. The Customs Department clarified that the Diplomatic Goods are freely importable without any requirements. For customs clearance, the Mission also approached Directorate of the State Protocol, Ministry of Foreign Affairs for the approval of the release of the Diplomatic Consignment.
During the Food Festival arranged by the Embassy, Oranges (Kinnows) were distributed for tasting and sampling among the stakeholders and visitors coming to AEON Mall Long Bien, Hanoi every day for food shopping. The number of visitors to AEON Mall during the weekdays and weekends, the number of visitors is up to 60,000-80,000. A small survey was conducted to obtain feedbacks from Vietnamese

46
tasters of Oranges (Kinnows). 80% of the tasters were of the view that Pakistan Oranges (Kinnows) are juicier and easy to peel than the imported oranges available in Vietnamese market.
Importantly, during the Tet season (Vietnamese New Year- Tet Nguyen Dan)
in January-February each year, 95 million-strong Vietnamese population exchanges citrus as gift to each other. Moreover, our hope is that we export citrus to all countries and Vietnam could be a huge consuming destination for our Kinnow.
The Mission is of the view that documentation under Circular 12/2015 to
register Pakistan as a fruit exporting country should be initiated by the concerned departments in Pakistan. If the requirements of the Circular 12 are not met, Pakistan would not be able to export its leading products like citrus, mangoes, other fresh fruits to Vietnam. The matter is urgent and important. We also need to contend the duty structure. Conclusion Viet Nam’s economy is expected to continue its robust growth pattern, which it has been maintaining for over last ten years. Industrial manufacturing is the backbone of Viet Nam’s economy, which is growing at the rate of over 10% in 2018. The country needs raw materials to cater to the sustainable growth of its manufacturing industry and its exports.
Pakistan and Vietnam should make joint efforts to identify impediments in two-way trade and take measures to further promote trade relations. Encouraging frequent exchange of business delegations and increasing cooperation among their respective business communities and trade promotion bodies should be given more focus to improve two-way trade up to the real potential of both countries and to achieve the target of $1 billion of bilateral trade in the minimum possible time.
Pakistan and Vietnam have huge potential to cooperate with each other in many areas including trade and investment, textiles & garments, energy, infrastructure development, automobiles, industry, agriculture, food processing, chemicals, information technology, pharmaceuticals, gems & jewelry, sports goods, education & health, air & sea connectivity, & banking, seafood and fish farming.

47
Pakistan can focus on the export of raw materials and non-traditional export items for increasing the volume of Pakistan’s exports to Viet Nam.
In order to address the trade deficit with Viet Nam, it may be highlighted that
there was a huge increase in imports of electrical machinery and equipment; coffee, tea, mate and spices and man-made filaments from Vietnam to Pakistan in the period 2017-18 as compared to the same period last year. Pakistan should consider increasing the import duty on these products to balance the trade.