Embed Size (px)
Citation preview
January 2017
2016 Annual Incentive Plan Report
i© 2016 FW Cook
2016 ANNUAL INCENTIVE PLAN REPORT
Table of ContentsIntroduction 1
Executive Summary 3
Annual Incentive Award Pool Funding 4
Non-Discretionary Annual Incentive Plans
Financial Measures 6
Non-Financial Measures 8
Performance Modifiers 9
Weighting of Measures 10
Annual and Long-Term Overlapping Measures 12
Discretionary Annual Incentive Plans 13
Other Annual Incentive Practices
Annual Incentive Payout Leverage (Maximum Payout Opportunity) 14
Actual Annual Incentive Payouts 14
Foreign Currency Adjustments 15
Appendix – Companies Included in the 2016 Annual Incentive Plan Report 16
Company Profile & Authors 19
1© 2016 FW Cook
INTRODUCTION
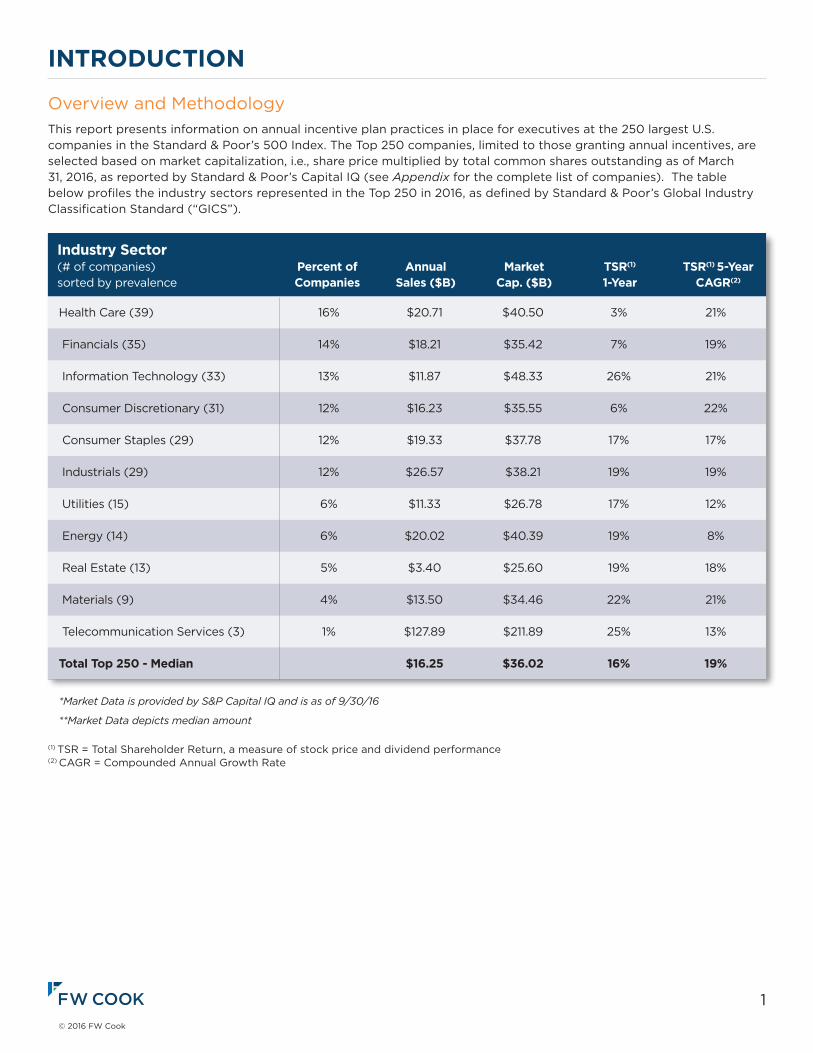
Overview and MethodologyThis report presents information on annual incentive plan practices in place for executives at the 250 largest U.S. companies in the Standard & Poor’s 500 Index. The Top 250 companies, limited to those granting annual incentives, are selected based on market capitalization, i.e., share price multiplied by total common shares outstanding as of March 31, 2016, as reported by Standard & Poor’s Capital IQ (see Appendix for the complete list of companies). The table below profiles the industry sectors represented in the Top 250 in 2016, as defined by Standard & Poor’s Global Industry Classification Standard (“GICS”).
(1) TSR = Total Shareholder Return, a measure of stock price and dividend performance (2) CAGR = Compounded Annual Growth Rate
Health Care (39) 16% $20.71 $40.50 3% 21%
Financials (35) 14% $18.21 $35.42 7% 19%
Information Technology (33) 13% $11.87 $48.33 26% 21%
Consumer Discretionary (31) 12% $16.23 $35.55 6% 22%
Consumer Staples (29) 12% $19.33 $37.78 17% 17%
Industrials (29) 12% $26.57 $38.21 19% 19%
Utilities (15) 6% $11.33 $26.78 17% 12%
Energy (14) 6% $20.02 $40.39 19% 8%
Real Estate (13) 5% $3.40 $25.60 19% 18%
Materials (9) 4% $13.50 $34.46 22% 21%
Telecommunication Services (3) 1% $127.89 $211.89 25% 13%
Total Top 250 - Median $16.25 $36.02 16% 19%
*Market Data is provided by S&P Capital IQ and is as of 9/30/16
**Market Data depicts median amount
Industry Sector (# of companies) Percent of Annual Market TSR(1) TSR(1) 5-Yearsorted by prevalence Companies Sales ($B) Cap. ($B) 1-Year CAGR(2)
2© 2016 FW Cook
INTRODUCTION
Survey ScopeThis report covers the following topics:
• Annual incentive award pool funding
• Annual incentive measure design features, including number of measures, types of measures, weighting of measures,
performance modifiers and the prevalence of annual incentive measures that overlap with long-term incentive
measures
• Annual incentive maximum payout opportunities
• Actual annual incentive payouts for the CEO for the latest fiscal year
• Performance measure adjustments for the impact of foreign currency fluctuations in annual incentive plans
Source of DataAll information was obtained from public documents filed with the Securities and Exchange Commission (“SEC”), including proxy statements and 8-K filings.
3© 2016 FW Cook
EXECUTIVE SUMMARYAnnual incentive plans play a key role in motivating and focusing employees on a company’s short-term goals. Key considerations for designing an annual incentive plan are selecting the appropriate performance measures and deciding how they should be weighted. Effective annual incentive measures will provide a clear line-of-sight to the overall strategy of the company and/or a participant’s impact on performance. Although there are many ways to structure annual incentive plans, some common themes in annual incentive design among the Top 250 companies are observed:
• Eighty-three percent of companies in the Top 250 use at least one specific financial measure to determine annual
incentive payouts, of which 75% use two or more financial measures.
• Non-financial measures (e.g. strategic and individual performance) are also common and are used as a stand-alone
measure by 52% of companies with non-discretionary plans.
• Profitability measures are not only the most prevalent annual incentive measures (utilized by 92% of companies with
non-discretionary plans), but profitability measures also carry the heaviest weighting among the companies that use
them (on average, comprise 59% of the weighting of annual incentive plans among those that use them).
• Among companies with heads of business units reported in their proxy statements, the dominant practice is to
emphasize corporate over business unit results for these officers.
• Sixty-two percent of companies in the Top 250 provide a maximum annual incentive payout opportunity of 200% of
target, with the remainder divided approximately equally above and below 200%.
Although company strategy plays a large role in shaping annual incentive plan design, external forces are also playing an increasingly important role. As proxy advisory firms and institutional investors continue to emphasize a pay-for-performance philosophy, companies face scrutiny when annual incentive payouts do not align with company performance. We see this manifested in plan design through the use of a portfolio of measures and the convergence around 200% of target as the standard maximum payout opportunity. However, despite outside pressure to transparently link pay directly to financial and/or stock price performance, over half of Top 250 companies use one or more non-financial measures in their annual incentive plans and 17% of companies maintain a plan that is determined entirely on a discretionary basis. Investors also remain focused on the rigor of performance goals in annual incentive plans, as the median actual annual incentive payout was 120% of target for the Chief Executive Officer (“CEO”) during the latest reported fiscal year (generally 2015).
Regulation has also impacted annual incentive plan design, most notably through the use of “plan-within-a-plan” funding approaches (disclosed at 42% of the Top 250 companies) as a way to comply with requirements under Internal Revenue Code (“IRC”) Section 162(m).
4© 2016 FW Cook
ANNUAL INCENTIVE AWARD POOL FUNDING
While annual incentive plan design can be very specific to a particular company and its culture, in many cases, regulation also influences it. A notable example of this is in the use of a “plan-within-a-plan” approach for the funding of annual incentive plan awards or pools. This approach is typically used to provide some flexibility in determining individual annual incentive award payouts while maintaining compliance with IRC Section 162(m) restrictions that would otherwise limit deductibility of compensation to certain executive officers if specific requirements are not met (in particular, if the award is non-performance based or non-formulaic).
42% of the Top 250 companies disclose that they utilize a “plan-within-a-plan” funding approach, in which the maximum incentive award or pool funding is determined first under what is often referred to as the
“umbrella plan”, and then the actual award payout is determined through the Board’s or Compensation Committee’s (“Committee”) use of “negative discretion.” “Negative discretion” is often exercised by applying the company’s formulaic annual incentive plan design (30% of companies) or, the “inside plan,” but can also be based solely on the Committee’s discretion (12% of companies). It is important to note that the prevalence of a “plan-within-a-plan” approach may be understated as companies generally tend to focus their proxy statement CD&A disclosure on their operative plan that actually drives incentive award payouts.
0%
10%
20%
30%
40%
50%
60%
Threshold/Gate
Formula
Method
Other
Prevalence of "Plan-Within-A-Plan" MethodsAnnual Incentive Pool Funding
49%
Per
cent
of
"Pla
n-W
ithi
n-A
-Pla
ns"
Bottom-Up58%
"Plan-Within-A-Plan"42%
45%
16%
5© 2016 FW Cook
ANNUAL INCENTIVE AWARD POOL FUNDINGThe two main methods that companies use to determine the funding under an “umbrella plan” for a “plan-within-a-plan” approach are (1) a threshold/gate and (2) a formula.
• Forty-nine percent of companies that use a “plan-within-a-plan” use a threshold/gate method, in which companies
set a minimum level of objective performance as the basis to fund the maximum payout level for participants. If the
threshold is not met, no annual incentive awards are earned under the plan. As such, the threshold/gate is often set at
a level that is substantially uncertain at the time of establishment but has a reasonable likelihood of achievement, with
more challenging goals that are directly tied to the company’s financial, operational or strategic priorities set under
the “inside plan”.
• Forty-five percent of companies that use a “plan-within-a-plan” use a formula mechanism, in which the maximum
payout level is determined as a fixed percentage of profit, either for each individual participant (e.g., 1% of net income
for each executive officer) or in total for all participants (e.g., pool equal to 5% of net income, with allocation such that
the sum of all participant awards cannot exceed 100% of the pool).
• Sixteen percent of companies that use a “plan-within-a-plan” use a mechanism other than the threshold/gate or
formula methods to determine annual incentive pool funding. For example, some companies use a “sliding scale,”
in which the maximum payout level can range along a scale of dollar amounts based on corresponding levels of
performance achievement.
• Eight percent of companies use more than one of the above methods in their “plan-within-a-plans.” For instance, a
company might set a threshold level of performance that must be achieved before any incentive awards can be paid
(i.e. threshold/gate method), after which a percent of profit formula is used to determine the maximum payouts
(i.e. formula method).
The remainder of companies that do not disclose the use of a “plan-within-a-plan” (58%) use a “bottom-up” approach to determine annual incentive funding, that is the funding is a function of the sum of individual awards and the “inside plan” is the only operative plan for both IRC Section 162(m) and actual incentive award payout purposes. The remainder of this report focuses on the design features of the operative, “inside plans” for the Top 250 companies.
6© 2016 FW Cook
NON-DISCRETIONARY ANNUAL INCENTIVE PLANS
Financial Measures
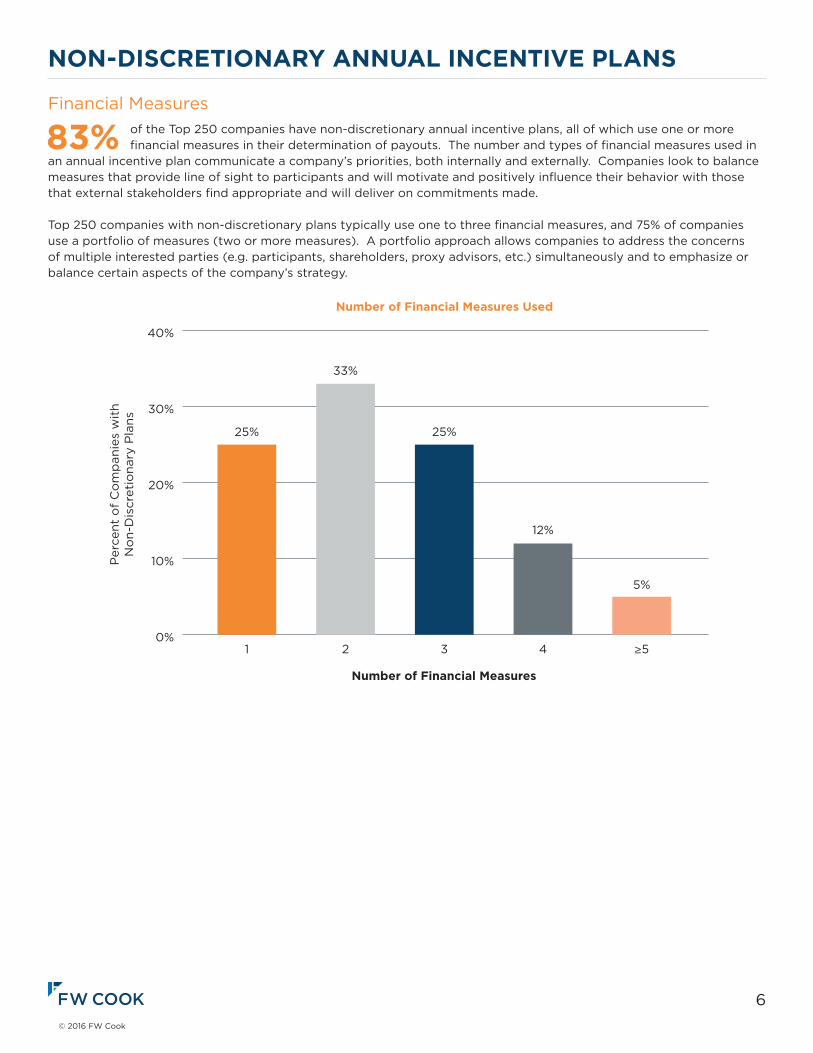
83% of the Top 250 companies have non-discretionary annual incentive plans, all of which use one or more financial measures in their determination of payouts. The number and types of financial measures used in
an annual incentive plan communicate a company’s priorities, both internally and externally. Companies look to balance measures that provide line of sight to participants and will motivate and positively influence their behavior with those that external stakeholders find appropriate and will deliver on commitments made.
Top 250 companies with non-discretionary plans typically use one to three financial measures, and 75% of companies use a portfolio of measures (two or more measures). A portfolio approach allows companies to address the concerns of multiple interested parties (e.g. participants, shareholders, proxy advisors, etc.) simultaneously and to emphasize or balance certain aspects of the company’s strategy.
Number of Financial Measures Used
Financial Measure Type Prevalence
Per
cent
of
Co
mp
anie
s w
ith
No
n-D
iscr
etio
nary
Pla
ns
0%
10%
20%
30%
40%
4
12%
3
25%
2
33%
0%
20%
40%
60%
80%
100%
1
25%
≥5
5%
Per
cent
of
Co
mp
anie
s w
ith
No
n-D
iscr
etio
nary
Pla
ns
Number of Financial Measures
Measure Type
Revenue
46%
Cash Flow
25%
Other Financial*
21%
Profit
92%
Returns
17%
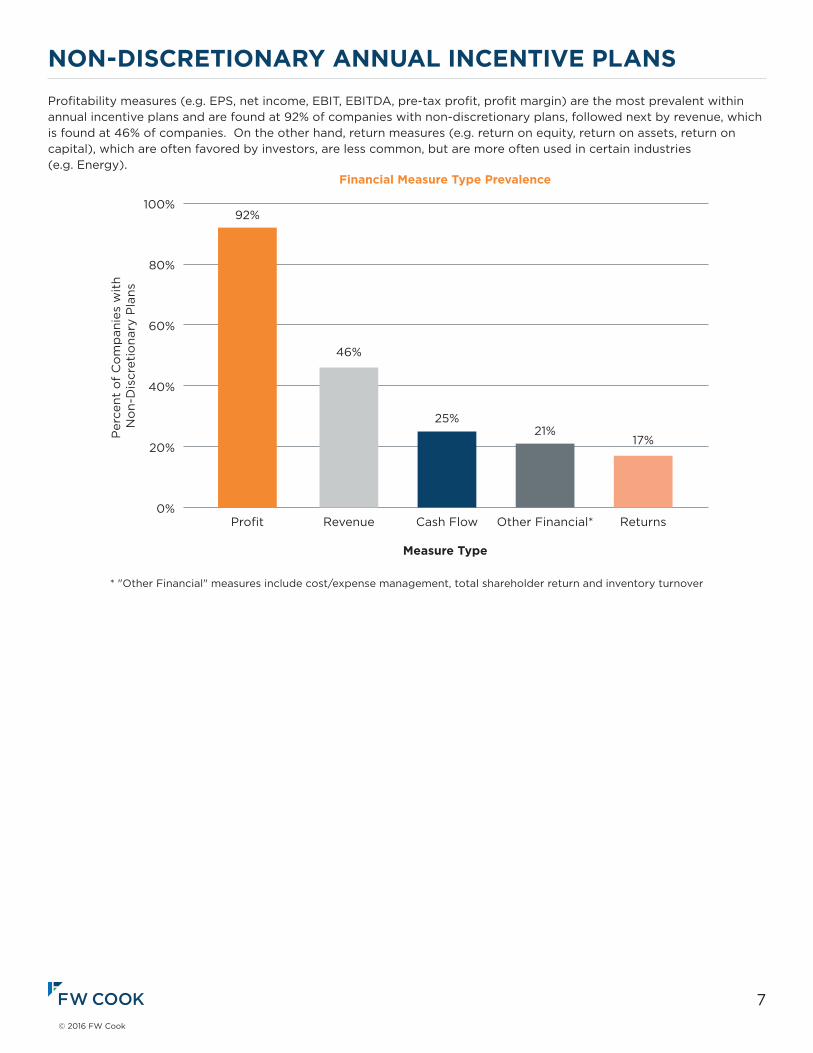
* "Other Financial" measures include cost/expense management, total shareholder return and inventory turnover
7© 2016 FW Cook
NON-DISCRETIONARY ANNUAL INCENTIVE PLANS Profitability measures (e.g. EPS, net income, EBIT, EBITDA, pre-tax profit, profit margin) are the most prevalent within annual incentive plans and are found at 92% of companies with non-discretionary plans, followed next by revenue, which is found at 46% of companies. On the other hand, return measures (e.g. return on equity, return on assets, return on capital), which are often favored by investors, are less common, but are more often used in certain industries (e.g. Energy).
Number of Financial Measures Used
Financial Measure Type Prevalence
Per
cent
of
Co
mp
anie
s w
ith
No
n-D
iscr
etio
nary
Pla
ns
0%
10%
20%
30%
40%
4
12%
3
25%
2
33%
0%
20%
40%
60%
80%
100%
1
25%
≥5
5%
Per
cent
of
Co
mp
anie
s w
ith
No
n-D
iscr
etio
nary
Pla
ns
Number of Financial Measures
Measure Type
Revenue
46%
Cash Flow
25%
Other Financial*
21%
Profit
92%
Returns
17%
* "Other Financial" measures include cost/expense management, total shareholder return and inventory turnover
8© 2016 FW Cook
NON-DISCRETIONARY ANNUAL INCENTIVE PLANS
0%
10%
20%
30%
40%
50%
Prevalence of Non-Financial Measures
Per
cent
of
Co
mp
anie
s w
ith
No
n-D
iscr
etio
nary
Pla
ns
Type of Measures
Individual
38%
Strategic
42%
Discretionary
12%
Non-Financial Measures
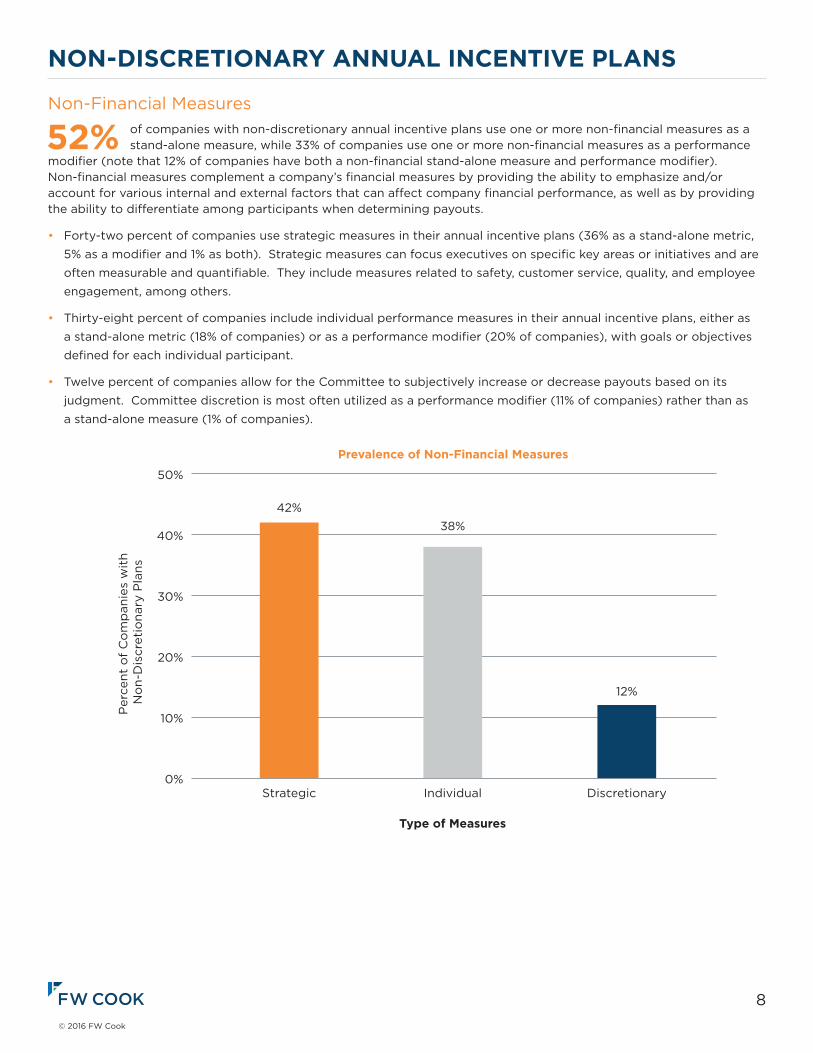
52% of companies with non-discretionary annual incentive plans use one or more non-financial measures as a stand-alone measure, while 33% of companies use one or more non-financial measures as a performance
modifier (note that 12% of companies have both a non-financial stand-alone measure and performance modifier). Non-financial measures complement a company’s financial measures by providing the ability to emphasize and/or account for various internal and external factors that can affect company financial performance, as well as by providing the ability to differentiate among participants when determining payouts.
• Forty-two percent of companies use strategic measures in their annual incentive plans (36% as a stand-alone metric,
5% as a modifier and 1% as both). Strategic measures can focus executives on specific key areas or initiatives and are
often measurable and quantifiable. They include measures related to safety, customer service, quality, and employee
engagement, among others.
• Thirty-eight percent of companies include individual performance measures in their annual incentive plans, either as
a stand-alone metric (18% of companies) or as a performance modifier (20% of companies), with goals or objectives
defined for each individual participant.
• Twelve percent of companies allow for the Committee to subjectively increase or decrease payouts based on its
judgment. Committee discretion is most often utilized as a performance modifier (11% of companies) rather than as
a stand-alone measure (1% of companies).
9© 2016 FW Cook
NON-DISCRETIONARY ANNUAL INCENTIVE PLANS
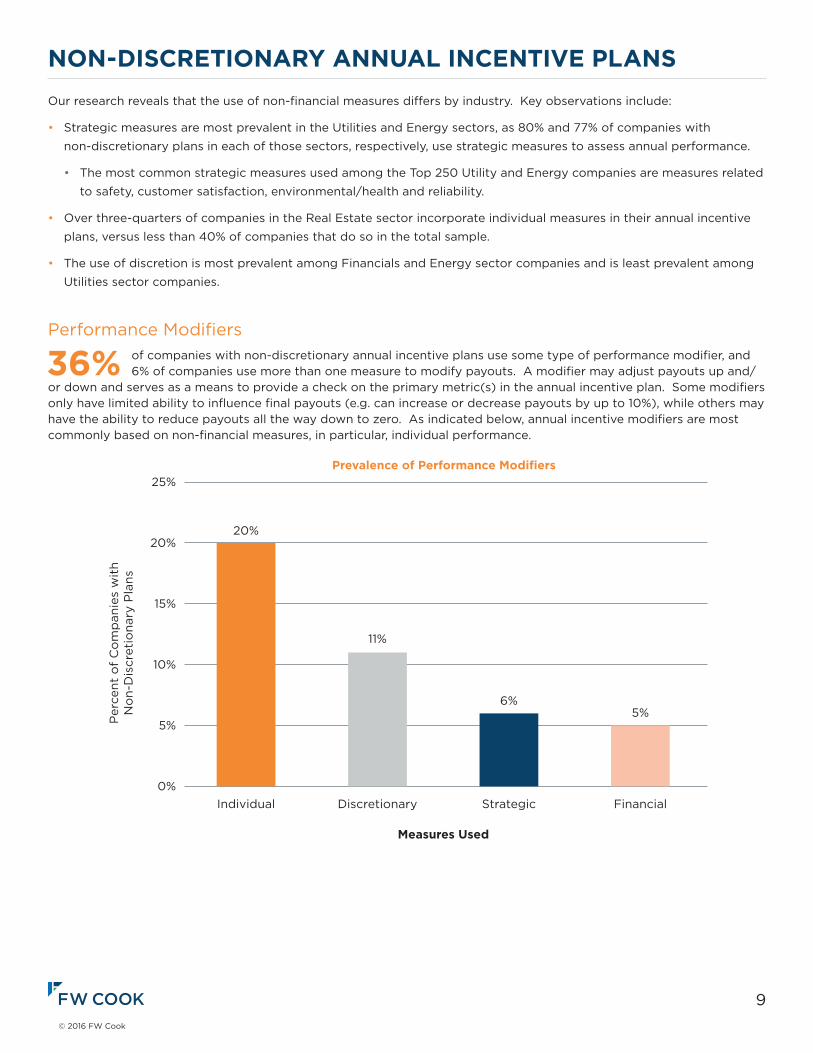
Performance Modifiers
36% of companies with non-discretionary annual incentive plans use some type of performance modifier, and 6% of companies use more than one measure to modify payouts. A modifier may adjust payouts up and/
or down and serves as a means to provide a check on the primary metric(s) in the annual incentive plan. Some modifiers only have limited ability to influence final payouts (e.g. can increase or decrease payouts by up to 10%), while others may have the ability to reduce payouts all the way down to zero. As indicated below, annual incentive modifiers are most commonly based on non-financial measures, in particular, individual performance.
Prevalence of Performance Modifiers
Per
cent
of
Co
mp
anie
s w
ith
No
n-D
iscr
etio
nary
Pla
ns
Measures Used
Financial
5%
0%
5%
10%
15%
20%
25%
Strategic
6%
Discretionary
11%
Individual
20%
Our research reveals that the use of non-financial measures differs by industry. Key observations include:
• Strategic measures are most prevalent in the Utilities and Energy sectors, as 80% and 77% of companies with
non-discretionary plans in each of those sectors, respectively, use strategic measures to assess annual performance.
• The most common strategic measures used among the Top 250 Utility and Energy companies are measures related
to safety, customer satisfaction, environmental/health and reliability.
• Over three-quarters of companies in the Real Estate sector incorporate individual measures in their annual incentive
plans, versus less than 40% of companies that do so in the total sample.
• The use of discretion is most prevalent among Financials and Energy sector companies and is least prevalent among
Utilities sector companies.
10© 2016 FW Cook
NON-DISCRETIONARY ANNUAL INCENTIVE PLANS
Weighting of MeasuresOn average, companies with non-discretionary plans allocate 82% of annual incentive plan performance to financial measures and 18% to non-financial measures. Including companies with 100% discretionary plans, the allocation is 68% to financial measures and 32% to non-financial measures or discretion, on average.
Profitability measures are typically the predominant focus in annual incentive plans, as profitability is not only the most prevalent annual incentive measure, but profitability measures carry the most weighting among the companies that use them. On average, companies that use a profitability measure allocate 59% of their annual incentive target opportunity to that measure (or measures). Meanwhile, other measures typically carry less weighting (26% to 34%, on average, as indicated below).
Average Weighting: Financial vs. Non-Financial
Non-Discretionary Plans Only Discretionary and Non-Discretionary Plans
Non-Financial18%
Financial82%
Non-Financial32%
Financial68%
0%
10%
20%
30%
40%
50%
60%
70%
Average Weighting of Metrics
Avg
. Wei
ght
ing
Am
ong
Co
mp
anie
s T
hat
Use
Met
ric
Measure Type
CashFlow
26%
Individual
27%
OtherFinancial
27%
Returns
27%
Revenue
31%
Strategic
34%
Profit
59%
11© 2016 FW Cook
NON-DISCRETIONARY ANNUAL INCENTIVE PLANS
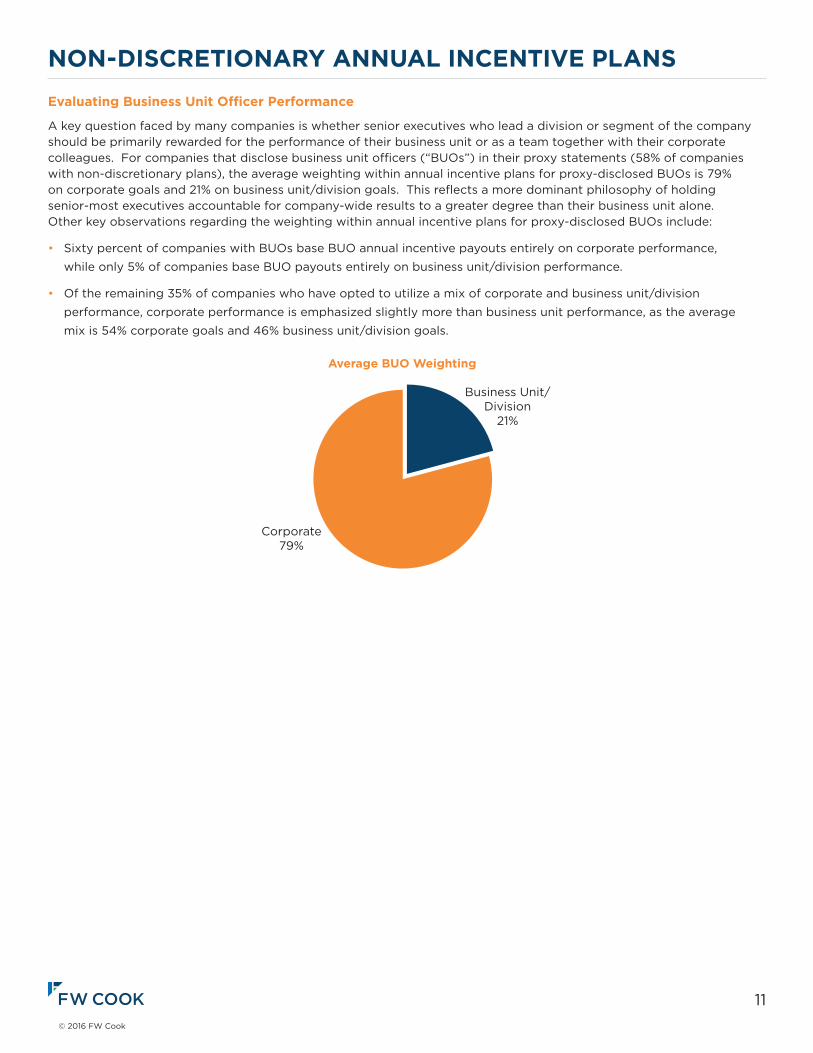
Evaluating Business Unit Officer Performance
A key question faced by many companies is whether senior executives who lead a division or segment of the company should be primarily rewarded for the performance of their business unit or as a team together with their corporate colleagues. For companies that disclose business unit officers (“BUOs”) in their proxy statements (58% of companies with non-discretionary plans), the average weighting within annual incentive plans for proxy-disclosed BUOs is 79% on corporate goals and 21% on business unit/division goals. This reflects a more dominant philosophy of holding senior-most executives accountable for company-wide results to a greater degree than their business unit alone. Other key observations regarding the weighting within annual incentive plans for proxy-disclosed BUOs include:
• Sixty percent of companies with BUOs base BUO annual incentive payouts entirely on corporate performance,
while only 5% of companies base BUO payouts entirely on business unit/division performance.
• Of the remaining 35% of companies who have opted to utilize a mix of corporate and business unit/division
performance, corporate performance is emphasized slightly more than business unit performance, as the average
mix is 54% corporate goals and 46% business unit/division goals.
Average BUO Weighting
Corporate79%
Business Unit/Division
21%
12© 2016 FW Cook
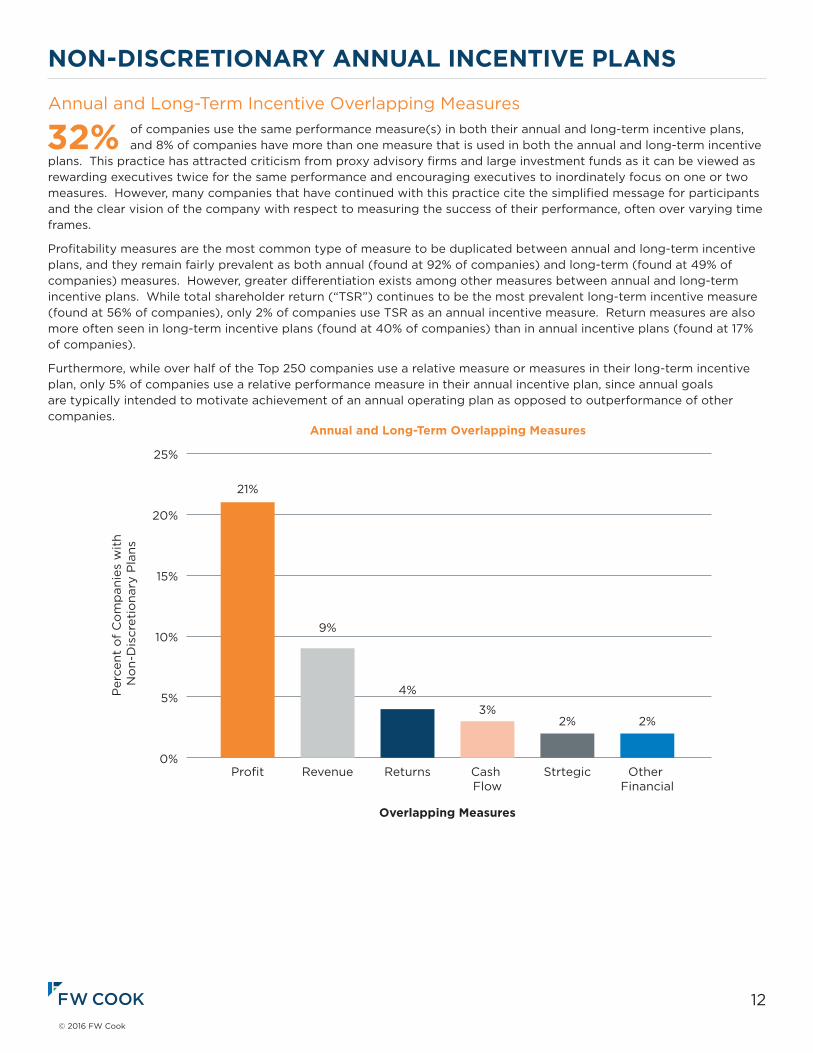
Annual and Long-Term Incentive Overlapping Measures
32% of companies use the same performance measure(s) in both their annual and long-term incentive plans, and 8% of companies have more than one measure that is used in both the annual and long-term incentive
plans. This practice has attracted criticism from proxy advisory firms and large investment funds as it can be viewed as rewarding executives twice for the same performance and encouraging executives to inordinately focus on one or two measures. However, many companies that have continued with this practice cite the simplified message for participants and the clear vision of the company with respect to measuring the success of their performance, often over varying time frames.
Profitability measures are the most common type of measure to be duplicated between annual and long-term incentive plans, and they remain fairly prevalent as both annual (found at 92% of companies) and long-term (found at 49% of companies) measures. However, greater differentiation exists among other measures between annual and long-term incentive plans. While total shareholder return (“TSR”) continues to be the most prevalent long-term incentive measure (found at 56% of companies), only 2% of companies use TSR as an annual incentive measure. Return measures are also more often seen in long-term incentive plans (found at 40% of companies) than in annual incentive plans (found at 17% of companies).
Furthermore, while over half of the Top 250 companies use a relative measure or measures in their long-term incentive plan, only 5% of companies use a relative performance measure in their annual incentive plan, since annual goals are typically intended to motivate achievement of an annual operating plan as opposed to outperformance of other companies.
NON-DISCRETIONARY ANNUAL INCENTIVE PLANS
Annual and Long-Term Overlapping Measures
Per
cent
of
Co
mp
anie
s w
ith
No
n-D
iscr
etio
nary
Pla
ns
Overlapping Measures
0%
5%
10%
15%
20%
25%
Strtegic
2%
Other Financial
2%
Cash Flow
3%
Returns
4%
Revenue
9%
Profit
21%
13© 2016 FW Cook
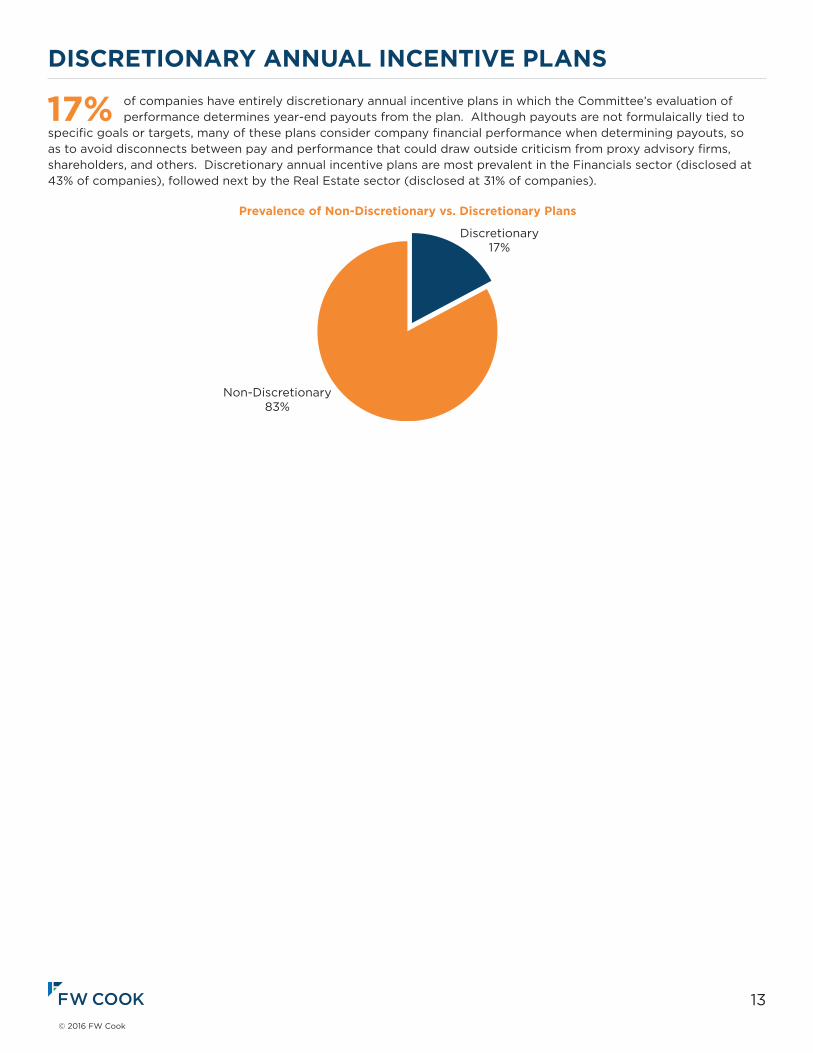
17% of companies have entirely discretionary annual incentive plans in which the Committee’s evaluation of performance determines year-end payouts from the plan. Although payouts are not formulaically tied to
specific goals or targets, many of these plans consider company financial performance when determining payouts, so as to avoid disconnects between pay and performance that could draw outside criticism from proxy advisory firms, shareholders, and others. Discretionary annual incentive plans are most prevalent in the Financials sector (disclosed at 43% of companies), followed next by the Real Estate sector (disclosed at 31% of companies).
DISCRETIONARY ANNUAL INCENTIVE PLANS
Prevalence of Non-Discretionary vs. Discretionary Plans
Non-Discretionary83%
Discretionary17%
14© 2016 FW Cook
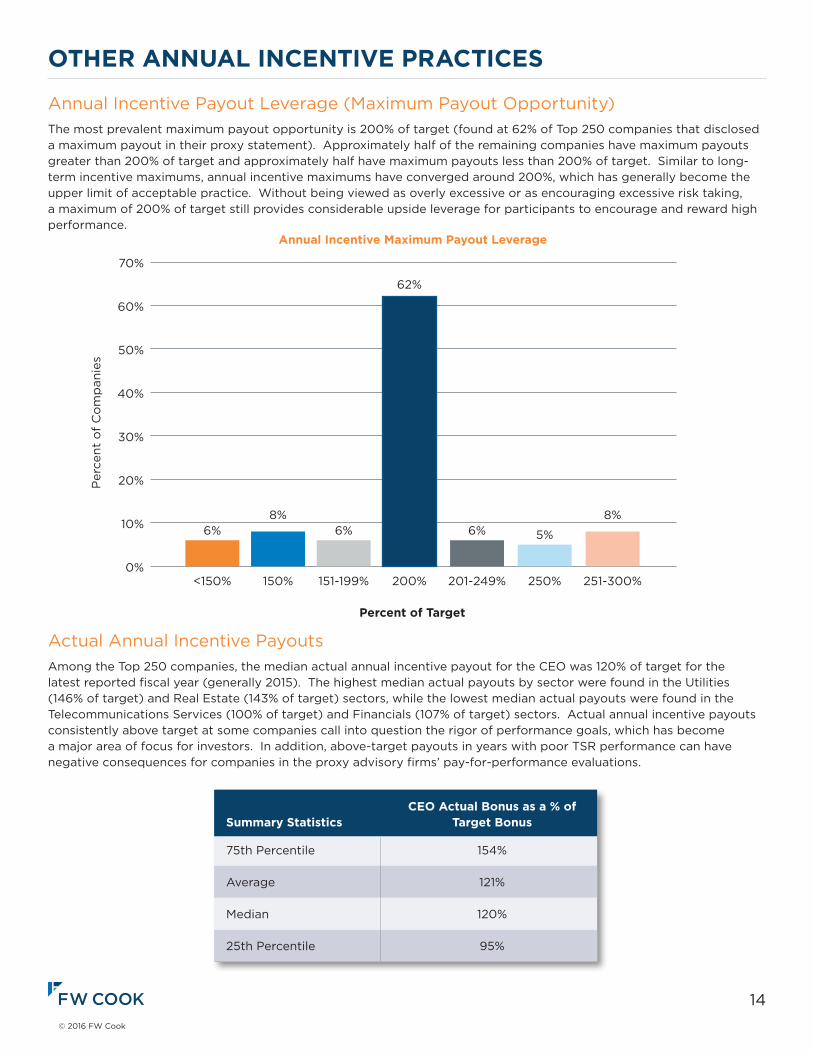
Annual Incentive Payout Leverage (Maximum Payout Opportunity)The most prevalent maximum payout opportunity is 200% of target (found at 62% of Top 250 companies that disclosed a maximum payout in their proxy statement). Approximately half of the remaining companies have maximum payouts greater than 200% of target and approximately half have maximum payouts less than 200% of target. Similar to long-term incentive maximums, annual incentive maximums have converged around 200%, which has generally become the upper limit of acceptable practice. Without being viewed as overly excessive or as encouraging excessive risk taking, a maximum of 200% of target still provides considerable upside leverage for participants to encourage and reward high performance.
Actual Annual Incentive PayoutsAmong the Top 250 companies, the median actual annual incentive payout for the CEO was 120% of target for the latest reported fiscal year (generally 2015). The highest median actual payouts by sector were found in the Utilities (146% of target) and Real Estate (143% of target) sectors, while the lowest median actual payouts were found in the Telecommunications Services (100% of target) and Financials (107% of target) sectors. Actual annual incentive payouts consistently above target at some companies call into question the rigor of performance goals, which has become a major area of focus for investors. In addition, above-target payouts in years with poor TSR performance can have negative consequences for companies in the proxy advisory firms’ pay-for-performance evaluations.
OTHER ANNUAL INCENTIVE PRACTICES
Annual Incentive Maximum Payout Leverage
Per
cent
of
Co
mp
anie
s
Percent of Target
200%
62%
0%
10%
20%
30%
40%
50%
60%
70%
251-300%
8%
250%
5%
201-249%
6%
151-199%
6%
150%
8%
<150%
6%
CEO Actual Bonus as a % ofSummary Statistics Target Bonus
75th Percentile 154%
Average 121%
Median 120%
25th Percentile 95%
15© 2016 FW Cook
Annual incentives are predominantly paid in cash only; however, 9% of companies require executives to receive a portion of annual incentive payouts in stock and an additional 2% of companies give executives the option of receiving a portion of payouts in stock in lieu of cash. This practice is most common in the Financials sector, as Financials companies make up approximately half of the companies in our sample that award stock in lieu of cash for annual incentive payouts. This reflects a common incentive compensation structure among Financials companies whereby annual performance determines the amount of total incentive compensation, a portion of which is deferred and paid in stock.
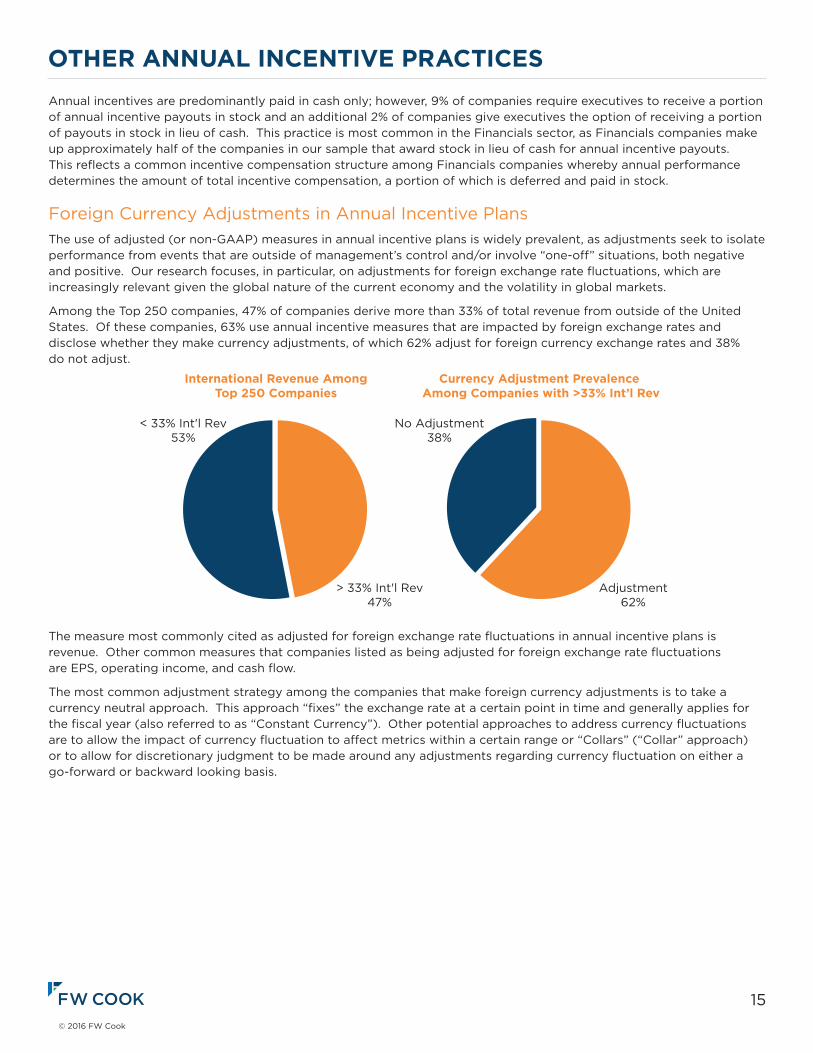
Foreign Currency Adjustments in Annual Incentive PlansThe use of adjusted (or non-GAAP) measures in annual incentive plans is widely prevalent, as adjustments seek to isolate performance from events that are outside of management’s control and/or involve “one-off” situations, both negative and positive. Our research focuses, in particular, on adjustments for foreign exchange rate fluctuations, which are increasingly relevant given the global nature of the current economy and the volatility in global markets.
Among the Top 250 companies, 47% of companies derive more than 33% of total revenue from outside of the United States. Of these companies, 63% use annual incentive measures that are impacted by foreign exchange rates and disclose whether they make currency adjustments, of which 62% adjust for foreign currency exchange rates and 38% do not adjust.
The measure most commonly cited as adjusted for foreign exchange rate fluctuations in annual incentive plans is revenue. Other common measures that companies listed as being adjusted for foreign exchange rate fluctuations are EPS, operating income, and cash flow.
The most common adjustment strategy among the companies that make foreign currency adjustments is to take a currency neutral approach. This approach “fixes” the exchange rate at a certain point in time and generally applies for the fiscal year (also referred to as “Constant Currency”). Other potential approaches to address currency fluctuations are to allow the impact of currency fluctuation to affect metrics within a certain range or “Collars” (“Collar” approach) or to allow for discretionary judgment to be made around any adjustments regarding currency fluctuation on either a go-forward or backward looking basis.
OTHER ANNUAL INCENTIVE PRACTICES
International Revenue AmongTop 250 Companies
Currency Adjustment Prevalence Among Companies with >33% Int’l Rev
< 33% Int'l Rev53%
> 33% Int'l Rev47%
No Adjustment38%
Adjustment62%
16© 2016 FW Cook
APPENDIX – COMPANIES INCLUDED IN THE 2016 ANNUAL INCENTIVE PLAN REPORTConsumer Discretionary (31 Companies) AutoZone Inc. Lowe’s Companies Inc. Target Corp.Carnival Corp. Marriott International Inc. Time Warner Cable Inc.CBS Corp. McDonald’s Corp. Time Warner Inc.Comcast Corp. Netflix Inc. TJX Companies Inc.Delphi Automotive PLC NIKE Inc. Twenty-First Century Fox Inc.Dollar General Corp. Omnicom Group Inc. Under Armour Inc.Dollar Tree Inc. O’Reilly Automotive Inc. V.F. Corp.Ford Motor Co. Priceline Group Inc. Walt Disney Co.General Motors Co. Ross Stores Inc. Yum! Brands Inc.Home Depot Inc. Royal Caribbean Cruises Ltd. L Brands Inc. Starbucks Corp.
Consumer Staples (29 Companies) Altria Group Inc. Estée Lauder Companies Inc. Monster Beverage Corp.Archer-Daniels-Midland Co. General Mills Inc. Pepsico Inc.Brown-Forman Corp. Hershey Co. Philip Morris International Inc.Campbell Soup Co. Hormel Foods Corp. Procter & Gamble Co.Coca-Cola Co. Kellogg Co. Reynolds American Inc.Colgate-Palmolive Co. Kimberly-Clark Corp. Sysco Corp.ConAgra Foods Inc. Kraft Heinz Co. Tyson Foods Inc.Constellation Brands Inc. Kroger Co. Walgreens Boots Alliance Inc.Costco Wholesale Corp. Molson Coors Brewing Co. Wal-Mart Stores Inc.CVS Health Corp. Mondelez International Inc.
Energy (14 Companies) Anadarko Petroleum Corp. Exxon Mobil Corp. Pioneer Natural Resources Co.Apache Corp. Halliburton Co. Schlumberger Ltd.Chevron Corp. Marathon Petroleum Corp. Spectra Energy Corp.ConocoPhillips Occidental Petroleum Corp. Valero Energy Corp.EOG Resources Inc. Phillips 66
Financials (35 Companies) Aflac Inc. Citigroup Inc. PNC Financial Services Group Inc.Allstate Corp. CME Group Inc. Progressive Corp.American Express Co. Discover Financial Services Prudential Financial Inc.American International Group Inc. Franklin Resources Inc. S&P Global Inc.Aon PLC Goldman Sachs Group Inc. State Street Corp.Bank of America Corp. Hartford Financial Services Group Inc. SunTrust Banks Inc.Bank of New York Mellon Corp. Intercontinental Exchange Inc. Synchrony FinancialBB&T Corp. JPMorgan Chase & Co. T. Rowe Price Group Inc.BlackRock Inc. Marsh & McLennan Companies Inc. Travelers Companies Inc.Capital One Financial Corp. MetLife Inc. U.S. BancorpCharles Schwab Corp. Moody’s Corp. Wells Fargo & Co.Chubb Ltd. Morgan Stanley
17© 2016 FW Cook
Healthcare (39 Companies) Abbott Laboratories Celgene Corp. McKesson Corp.AbbVie Inc. Cerner Corp. Medtronic PLCAetna Inc. Cigna Corp. Merck & Co. Inc.Alexion Pharmaceuticals Inc. Danaher Corp. Mylan N.V.Allergan PLC Edwards Lifesciences Corp. Perrigo Co. PLCAmerisourceBergen Corp. Eli Lilly & Co. Pfizer Inc.Amgen Inc. Express Scripts Holding Co. Regeneron Pharmaceuticals Inc.Anthem Inc. Gilead Sciences Inc. Stryker Corp.Becton, Dickinson & Co. HCA Holdings Inc. Thermo Fisher Scientific Inc.Biogen Inc. Humana Inc. UnitedHealth Group Inc.Boston Scientific Corp. Illumina Inc. Vertex Pharmaceuticals Inc.Bristol-Myers Squibb Co. Intuitive Surgical Inc. Zimmer Biomet Holdings Inc.Cardinal Health Inc. Johnson & Johnson Zoetis Inc.
Industrials (29 Companies) 3M Co. FedEx Corp. PACCAR Inc.American Airlines Group Inc. General Dynamics Corp. Raytheon Co.Boeing Co. General Electric Co. Roper Technologies Inc.Caterpillar Inc. Honeywell International Inc. Southwest Airlines Co.CSX Corp. Illinois Tool Works Inc. Union Pacific Corp.Cummins Inc. Johnson Controls Inc. United Continental Holdings Inc.Deere & Co. Lockheed Martin Corp. United Parcel Service Inc.Delta Air Lines Inc. Nielsen Holdings PLC United Technologies Corp.Eaton Corp. PLC Norfolk Southern Corp. Waste Management Inc.Emerson Electric Co. Northrop Grumman Corp.
Information Technology (33 Companies) Accenture PLC Electronic Arts Inc. Microsoft Corp.Adobe Systems Inc. EMC Corp. NVIDIA Corp.Analog Devices Inc. Facebook Inc. Oracle Corp.Apple Inc. Fidelity National Info. Services Inc. Paychex Inc.Applied Materials Inc. Fiserv Inc. PayPal Holdings Inc.Automatic Data Processing Inc. Hewlett Packard Enterprise Co. QUALCOMM Inc.Broadcom Ltd. HP Inc. salesforce.com inc.Cisco Systems Inc. Intel Corp. TE Connectivity Ltd.Cognizant Technology Solutions Corp. Intl. Business Machines Corp. Texas Instruments Inc.Corning Inc. Intuit Inc. Visa Inc.eBay Inc. MasterCard Inc. Yahoo! Inc.
Materials (9 Companies) Air Products & Chemicals Inc. Ecolab Inc. PPG Industries Inc.Dow Chemical Co. LyondellBasell Industries N.V. Praxair Inc.E. I. du Pont de Nemours & Co. Monsanto Co. Sherwin-Williams Co.
APPENDIX – COMPANIES INCLUDED IN THE 2016 ANNUAL INCENTIVE PLAN REPORT
18© 2016 FW Cook
Real Estate (13 Companies) American Tower Corp. Equity Residential Ventas Inc.Avalonbay Communities Inc. General Growth Properties Inc Welltower Inc.Boston Properties Inc. Prologis Inc. Weyerhaeuser Co.Crown Castle International Corp. Public Storage Equinix Inc. Simon Property Group Inc.
Telecommunication Services (3 Companies) AT&T Inc. Level 3 Communications Inc. Verizon Communications Inc.
Utilities (15 Companies) American Electric Power Co. Inc. Eversource Energy Public Service Enterprise Group Inc.Consolidated Edison Inc. Exelon Corp. Sempra EnergyDominion Resources Inc. NextEra Energy Inc. Southern Co.Duke Energy Corp. PG&E Corp. WEC Energy Group Inc.Edison International PPL Corp. Xcel Energy Inc.
APPENDIX – COMPANIES INCLUDED IN THE 2016 ANNUAL INCENTIVE PLAN REPORT
19© 2016 FW Cook
FW COOK COMPANY INFORMATIONFW Cook is an independent consulting firm specializing in executive and director compensation and related corporate governance matters. Formed in 1973, our firm has served more than 3,000 organizations in a wide variety of industries from our offices in New York, Chicago, Los Angeles, San Francisco, Atlanta, Houston and Boston. We currently serve as the independent advisor to the compensation committees at a substantial number of the most prominent companies in the U.S.
Our office locations:
Web Site: www.fwcook.com
AuthorsThis report was authored by Shannon Disbrow and James Garriga. Kathryn Neel and other FW Cook consultants also assisted with this report. Questions and comments should be directed to Ms. Disbrow in our Chicago office at [email protected] or (312) 894-0078.
New York685 Third Avenue28th FloorNew York, NY 10017212-986-6330
Chicago190 LaSalle StreetSuite 2120Chicago, IL 60603312-332-0910
Los Angeles11100 Santa Monica Blvd. Suite 300Los Angeles, CA 90025310-277-5070
San Francisco135 Main StreetSuite 1750San Francisco, CA 94105415-659-0201
AtlantaOne Securities Centre3490 Piedmont Road NE Suite 550Atlanta, GA 30305404-439-1001
HoustonTwo Allen Center1200 Smith StreetSuite 1100Houston, TX 77002713-427-8300
Boston34 Washington StreetSuite 230Wellesley Hills, MA 02481781-591-3400