Embed Size (px)
Citation preview
Report: No. 789
CORFIDENTIAL
INTERNATIONAL BANK FOR RECONSTRUCTION AND DEVELOPMENT
PROJECT PERFORMANCE AUDIT REPORT
on
SINGAPORE DFC PROJECT (Loan 658-SI)
June 24, 1975
Operations Evaluation Department
Pub
lic D
iscl
osur
e A
utho
rized
Pub
lic D
iscl
osur
e A
utho
rized
Pub
lic D
iscl
osur
e A
utho
rized
Pub
lic D
iscl
osur
e A
utho
rized

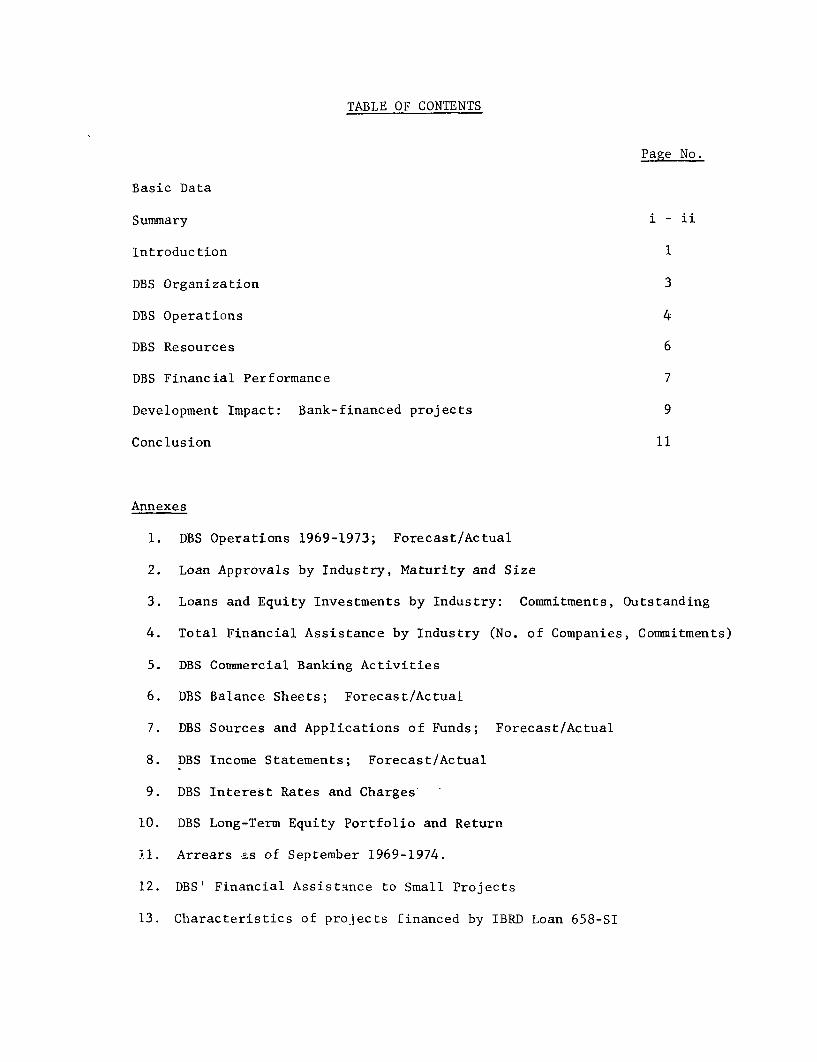
TABLE OF CONTENTS
Page No.
Basic Data
Summary -i1
Introduction 1
DBS Organization 3
DBS Operations 4
DBS Resources 6
DBS Financial Performance 7
Development Impact: Bank-financed projects 9
Conclusion 11
Annexes
1. DBS Operations 1969-1973; Forecast/Actual
2. Loan Approvals by Industry, Maturity and Size
3. Loans and Equity Investments by Industry: Commitments, Outstanding
4. Total Financial Assistance by Industry (No. of Companies, Commitments)
5. DBS Commercial Banking Activities
6. DBS Balance Sheets; Forecast/Actual
7. DBS Sources and Applications of Funds; Forecast/Actual
8. DBS Income Statements; Forecast/Actual
9. DBS Interest Rates and Charges
10. DBS Long-Term Equity Portfolio and Return
).. Arrears as of September 1969-1974.
12. DBS' Financial Assistance to Small Projects
13. Characteristics of projects financed by IBRD Loan 658-SI
PROJECT PERFORMANCE AUDIT
SINGAPORE DEVELOPMENT FINANCE COMPANY (Loan 658-SI)
BASIC DATA
Borrower: Development Bank of Singapore Ltd.
Loan Amount: US$ 5 million
Amount Disbursed: US$ 4.11 million (US$ 0.89 million cancelled)
Date of Loan: February 25, 1970
Effective Date: May 28, 1970
Closing Date: Original - June 30, 1973Final - June 30, 1973
Terms of Loan: Amortization parallel to sum of amortizations of6 sub-projects - Interest rate: 7% p.a.
Fiscal Year: January 1 to December 31
Appraisal Report: DB-55a; December 29, 1969
Appraisal Missions: November 1968 and August 1969
Supervision Missions: February 1971
July 1973
August 1974
PREFACE
This report presents the results of a performance audit of the
Bank's only DFC project in Singapore - Loan 658-SI to the Development Bankof Singapore (DBS), signed in February 1970 and closed on schedule in
June 1973, with cancellation of the 18% of the loan then remaining in theloan account.
The report is based principally on review of the Bank's relevantfiles and documents, including in particular a Project Completion Report
prepared by the East Asia and Pacific Regional Office in September 1974, anda visit to Singapore in November 1974.
The assistance provided by the Singapore authorities, andparticularly by the DBS, is gratefully acknowledged.
Abbreviations and Acronyms
DBS - Development Bank of Singapore
EDB - Economic Development Board of SingaporeADB - Asian Development Bank
KfW - Kreditanstalt fIr Wiederaufbau
Currency Equivalents (Singapore Dollar)
Through Nov..1971: US$ 1.00 - S$3.06
Dec. 1971 - Jan. 1973: US$ 1.00 - S$2.82
Feb. 1973 - June 1973: US$ 1.00 = S$2.54
Since July 1973 the S$ has been floating; currently (May 1975)US$ 1.00 = S$2.25
SUMMARY
Loan 658-SI of US$ 5 million was made to the Development Bank of
Singapore (DBS) in February 1970. DBS was established in 1968 by theGovernment, which has owned about 49% of its equity, to replace the Economic
Development Board (EDB) as Singapore's major institutional source of long-
term industrial finance, and DBS took over from EDB a sound portfolio of
56 industrial loans totalling 0$ 45.6 million. DBS started its operationswith substantial assistance on organization and procedures from the Kreditan-
stalt fur Wiederaufbau (KfW). In late 1968 a Bank mission proposed thata loan of US$ 10 million be made to DBS once it had issued a Policy Statement
stating its objectives, policies and procedures and made satisfactory
arrangements with the Government to cover the foreign exchange risk on a
foreign currency loan. DBS' Policy Statement was modified in 1969, at
the Bank's recommendation, with regard to eligible sectors for on-lending,DBS' maximum debt/equity ratio, and DBS' maximum exposure in a single enter-
prise. DBS received in July 1969 a loan of US$ 10 million from the AsianDevelopment Bank (ADB), and the Government agreed to assume against a fee
the foreign exchange risk on foreign currency loans. During negotiations
with the Bank, the loan amount was cut down to US$ 5 million, representing
6% of DBS' foreseen requirements of funds for development financing in
1970 and 1971, because DBS wished to minimize its liability for the commit-
ment fees charged on Bank loans. The loan became effective in May 1970and was closed in June 1973 as scheduled, after cancellation of US$ 0.89million.
DBS' evolution into a broadly based and diversified financial insti-tution with considerable influence over investments in Singapore has exceeded
any expectations of the Bank and has occurred independently of the Bank.Rather than restricting its commercial banking operations to its term-
finance clients as stated in its original share prospectus and at negotia-
tions, DBS expanded and diversified these operations rapidly after 1971by raising fixed deposits, opening accounts and letters of credit Andgranting working capital loans and overdrafts. It established 6 subsi-
diaries to offer a wider variety of banking services (e.g. merchant bank-ing, leasing). DBS developed also its relationships and operations,(mutual deposits and loans) with Singapore's commercial banks. The resulting
increase in DBS' short-term resources was used to finance part of thedisbursements on its development banking operations in 1969-1971.
DBS' long-term lending lagged behind forecast in 1969-1971 and pickedup thereafter; during 1969-1973 DBS approved 262 loans totalling S$ 687million and disbursed S$ 574 million (as compared to-forecasts of S$ 578and 498 million respectively). By end of 1973, DBS' equity investmentstotalled over S$ 100 million in 62 companies. DBS has also issued guaran-tees, with a total outstanding at about S$ 90 million by the end of 1973,and made in 1972 and 1973 some 28 loans in Asian dollars financed outof its resources from the Asian dollar market. Total DBS developmentfinancial assistance amounted to over S$ I billion during 1969-1973 andwent to 241 companies; 60% of it went to the manufacturing sector, where itencouraged foreign participations and new technologies, and the remainder to
- ii -
profitable service activities. DBS financed about 16% of total industrialinvestment in Singapore over the period 1969-1971.
Financial resources of DBS came essentially from short- and long-term debt (term loans from the Government mainly); DBS floated on theAsian dollar market in late 1971 a US$ 10 million bond issue which was apioneering development of this market for long-term funds. Funds raised bythe commercial banking operations have frequently played a large part inmeeting resource needs of other sectors of activity, particularly long-termlending. Total debt/equity ratio rose to 9.7:1, and long-term debt/equityratio to 4.2:1 by the end of 1973; the Bank agreed to raise the limit statedin the Loan Agreement and finally waived the corresponding provision. DBS'overall financial performance has been closely in line with appraisal reportprojections. Profitability has been low, due to a narrow and decreasingspread. However, DBS' return on average equity increased due to increasedleverage, and prices of DBS' shares on the stock exchange have fluctuated widelyabove par-value. DBS' portfolio has been sound, and provisions appearsufficient to cover past and likely write-offs. Profit-center analysis showsthat the commercial banking services have made the most contribution to profitsin recent years.
According to available data the allocation of DBS' and Bank'sresources to Singapore's manufacturing sector has been efficient and hasmet the Government's industrial policy objectives; the return to equity ofa sample of 50 clients average 16% in 1972/73, with more than half perform-ing satisfactorily. The Bank loan was used to finance 11.5% of the totalcost of 6 projects which seem to have been economically attractive. Thesuccess of DBS, which measures its own impact in terms of overall economicdevelopment, is reflected in the diversification and rapid development ofSingapore's economy.
Loan 658-SI to DBS was made primarily because the Bank wished totransfer resources to accelerate Singapore's development and DBS wishedto have the Bank on its list of creditors. The Bank has provided a minutepart of DBS' resources and had practically no opportunity to play aninstitution-building role, because of the quality and dynamism of DBS'management, although it did help with arrangements for Government coverageof exchange risk, which have been useful for other loans from foreigninstitutions. The Bank was flexible enough to acknowledge DBS' specialnature.and consequently did not exercise a control which could have beenonly formal. DBS' evolution as both a mixed development/commercial bankand an independent financing arm for Government industrialization policy maybe considered exemplary to other well developed DFC's but it is clear thatthe Bank had only a very small role in it although one appreciated by theSingapore authorities. In retrospect, the Bank's overhead on the operationhas been high relative tothe small size of the loan and its limited effects,but this commitment of budgetary resources appears to have been reasonablegiven the prospects at that time that DBS might need prolonged Bank financing.


PROJECT PERFORMANCE AUDIT REPORT
SINGAPORE DFC PROJECT (Loan 658-SI)
Introduction
1.01 Between 1960 and 1967, Singapore's GDP in real terms increased
by 9% p.a., and further by 12% p.a. in 1967-1968. The major factors inthis boom had been a sharp increase in tourism, a surge of exports and a
sizeable increase of private investments in manufacturing from S$ 30 million
in 1961 to S$ 150 million in 1968. Manufacturing value added had increasedfrom 8.1% of GDP to 16.8% of GDP over the same period. Valued by foreign
investors for its stability, trained labor, financial services, stable
currency and investment incentivesl/ Singapore was expecting greater accom-
plishments from its dynamic manufacturing sector.
1.02 The Economic Development Board (EDB), a Government multi-purposeagency responsible for Singapore's industrialization program, had been theprincipal institutional source of long-term industrial finance; the stockmarket had also channelled new equity finance to industries in increasing
amounts, and commercial banks had on occasion extended term loans. TheStock Exchange had 226 companies listed by June 1969 and the market was veryactive. There were in 1969 some 35 commercial banks operating in Singapore.including 21 foreign banks. Well-established firms used to finance their
medium- or even long-term requirements by rolling over their overdraftsfrom the banks, wh.ch were fairly liquid. Singapore had also 88 insurancecompanies, and many finance companies (most of them subsidiaries of commer-cial banks).
1.03 In 1967, the Government decided that the financing activity ofEDB should be taken over by a specialized agency. In 1968, a 49% Government-owned DFC, the Development Bank of Singapore (DBS), was established. EDB
stopped financing industries and transferred most of its portfolio and
some of its staff to DBS.
1.04 The 1968 Bank economic mission confirmed the need of further in-
dustrialization of Singapore and the key role DBS could play therein. TheBank sent in late 1968 a pre-appraisal mission which reported that DBS was
receiving from the Kreditanstalt fur Wiederaufbau (KfW) assistance on
organization, policies and procedures2 /, that DBS was well organized, and
1/ Incentives have included: 5-year tax holidays for pioneer industries, alow tax rate (4%) on profits on exports for 15 years at least, accelerated
depreciation (up to 100%), duty-free import of equipment and raw materials,free repatriation of profits and capital, firancial assistance and tech-
nical services, and in some cases tariff protection.
2/ A staff member of KfW was engaged as Executive Vice-President by DBS in
1969 under a two-year contract. KfW also helped DBS to sell S$ 3 millionof its shares (3% o- total) in Europe.

- 2 -
that the Bank's role would likely be much smaller than usual with other DFC's;it recommended a loan of US$ 10 million to be made in late 1969 after somemeasures had been taken. The main measures expected were the following:
i. issue by DBS, as recommended also by KfW, of a Policy Statementdefining its objectives, investment policy and financing procedures; and
ii. special arrangements for coverage of the foreign exchange riskinvolved i a Bank loan, due to the free convertibility of Singaporecurrencyl
1.05 The Bank insisted on some changes to DBS' drafts of its PolicyStatement regarding the definition of eligible sub-borrowers, its debt/equity ratio, and its maximum exposure in a single enterprise (see below).These points and the coverage of the foreign exchange risk were furtherexamined by a Bank appraisal mission with DBS and the Government in mid-1969.It was finally agreed, and confirmed, before and during negotiations, that:
a. DBS would primarily provide long-term finance to privateenterprises for economically and financially viable projects, in the formof loans and equity participations;
b. DBS would not lend to the public sector, and the Government-sponsored projects would be financed by DBS out of separate specialpublic funds;
c. DBS would normally extend its commercial banking services to,and accept deposits from, its term borrowers only, and commercial bankingactivities would be financed out of deposits;
d. Bank loan could be used for financing hotels and supply indus-tries for oil exploration, but not office buildings. It could alsofinance sound economic ventures promoted by foreign sponsors, especiallyif made jointly with Singapore interests, but to a minimum extent;
e. The maximum limit of DBS financial assistance to a singlefirm, i.e. 25% of DBS' net worth, would cover not only long-term loans,equity participation and guarantees but also overdraft and workingcapital facilities;2
f. DBS' debt/equity ratio would be limited to 3:12/ and the Bankwould agree to an appropriate increase in the limit when it should become
1/ This free convertibility has made sub-borrowers reluctant to borrow inforeign exchange.
2/ A condition of effectiveness of the Loan was that DBS would amend itsPolicy Statement accordingly.
3/ in accordance with DBS' Articles of Association and Policy Statement.
- 3 -
necessary for DBS expansion, provided that the quality of DBS' assets and
its financial prospects at that time justified it;
g. In the definition of the debt/equity ratio, the debt should
include fixed term deposits exceeding one year; and,
h. The Government had agreed with DBS to assume the foreign ex-
change risk on the Loan for a fee of % p.a.1/
1.06 DBS had received from the Asian Development Bank (ADB) in July1969 a loan of US$ 10 million. The IBRD offered a loan of US$ 10 million.
Because DBS could not predict accurately the scale of its commitments during
the next 18 months and wished to minimize the commitment fees payable on
the Bank loan2/, the loan amount was cut down to US$ 5 million at DBS' request,representing 6% of DBS' foreseen requirements of funds for development
financing in 1970 and 1971. Loan 658-SI was signed in February 1970 andbecame effective in May 1970.
DBS Organization
2.01 The Government had subscribed 49 million of DBS' 100 million shares(par value of S$l each) and the remainder was allocated, after over-
subscription, between financial institutions (33.5 million) and the public
(17.5 million); many of the public subscribers invested thinking in terms of
a capital gain. DBS shares are listed on the Stock Exchange and have been
very speculative. Ownership by the various groups has not changed much.
DBS' Chairman/President is appointed by the Government, as are five other
Directors, the remaining five being bankers, including two foreigners from
foreign banks operating in Singapore. The four-man Executive Committee of
the Board has included one representative of the public shareholders (from
a large borrowing enterprise) and has met at least once a month.
2.02 A major reorganization in 1973 resulted in a regrouping of DBS'
divisions3/ into 4 major Departments: Operations, Commercial and Interna-tional Banking, Investments, and Properties. DBS expanded its wholly-ownedsubsidiaries from one in 1969 (DBS Realty) to six today, to increase its
profitability (para. 5.01). Five of these are "paper" companies (DBSRealty, DBS Finance, DBS Nominees, Singapore Tourist Industry, and RafflesCenter) with regular DBS staff serving as executive officers, and the sixth-- Singapore Factory Development Ltd. (SFDL) -- is a separate corporateentit37.
1/ This form of arrangement had been suggested by the Bank in respolse toDBS' quest for feasible solutions.
2/ A standard commitment fee of 3/4% p.a. was charged to the full Loan amount.On the ADB loan, the commitment fee was not charged until funds were cre-dited to the loan account upon approval of sub-projects, and thus DBS didnot have to pay for delays in committing ADB's funds to sub-projects.
3/ DBS' Executive Vice-President retained the direct responsibility for theadministration, finance, economics, follow-up and control (renamed "Controlsand Systems") divisions.
-4-
DBS Operations
3.01 Development Banking: In September 1968 DBS inherited from EDB
a sound portfolio of S$ 43.4 million large loans to 56 industries and a
further S$ 2.2 million in several small loans. DBS projected in 1969 an
annual increase of 5%-10% in its approvals for loans, depending largelyon DBS involvement in large projects then discussed in Singapore and on
its success in mobilizing local resources (see para. 4.02). Lending
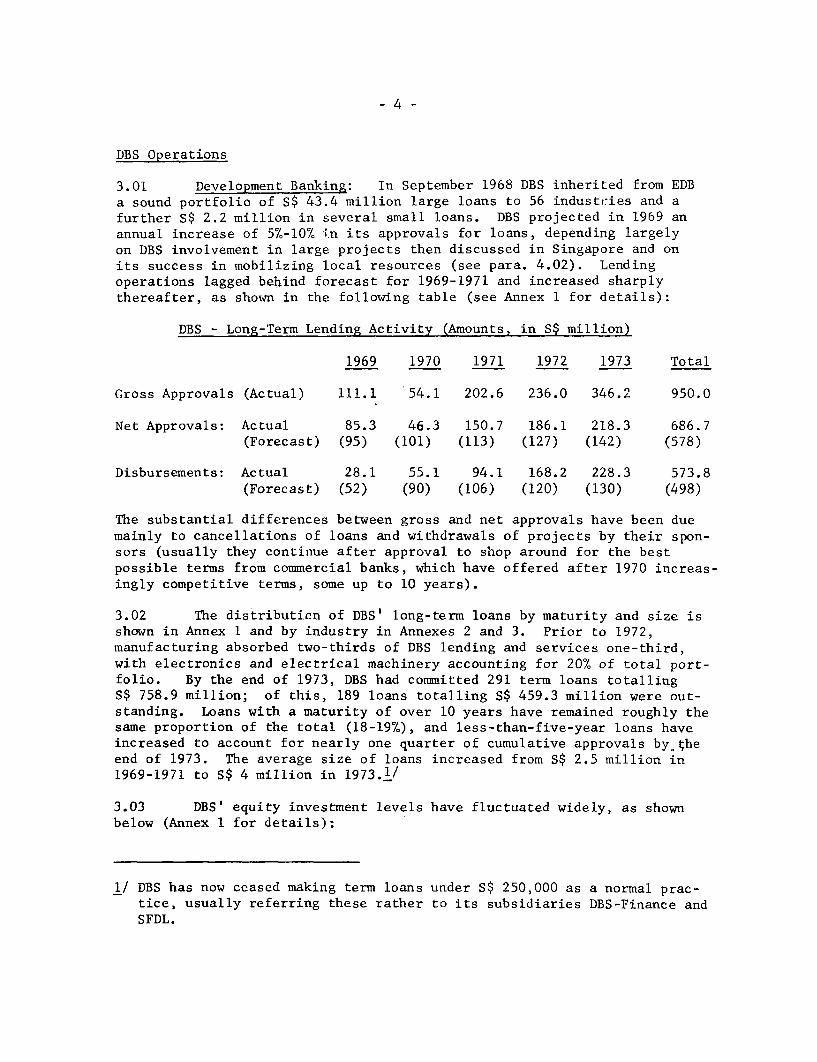
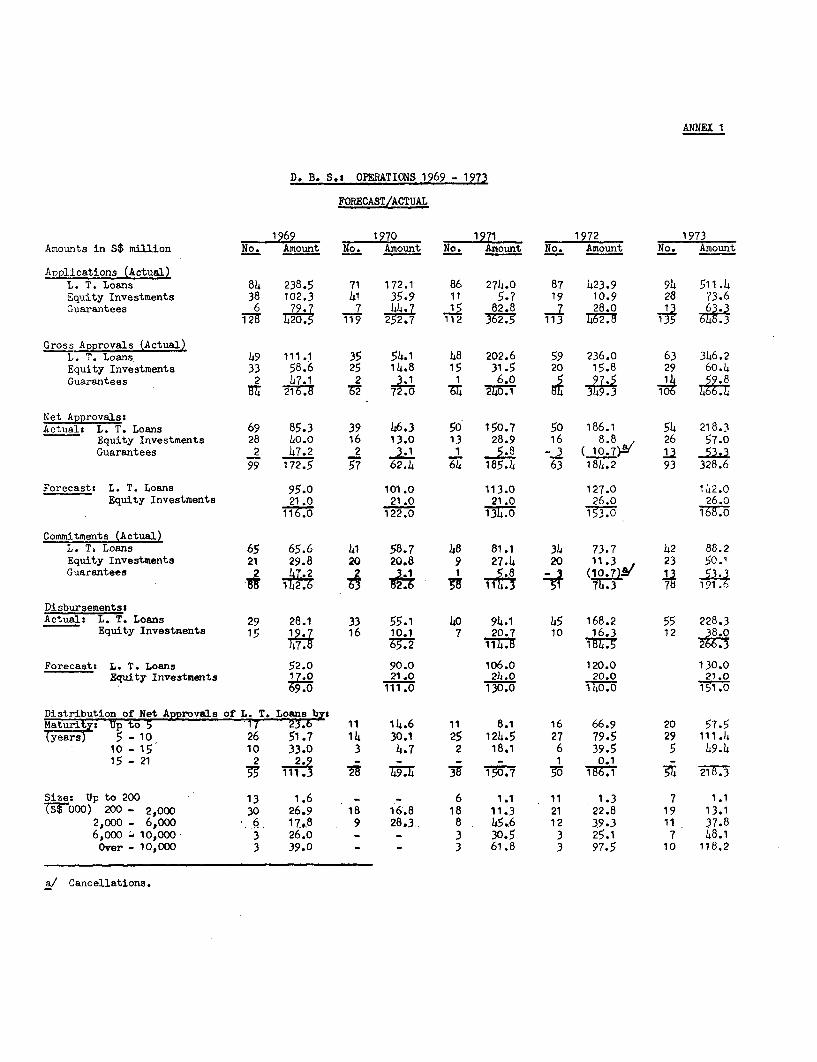
operations lagged behind forecast for 1969-1971 and increased sharplythereafter, as shown in the following table (see Annex 1 for details):
DBS - Long-Term Lending Activity (Amounts, in S$ million)
1969 1970 1971 1972 1973 Total
Gross Approvals (Actual) 111.1 54.1 202.6 236.0 346.2 950.0
Net Approvals: Actual 85.3 46.3 150.7 186.1 218.3 686.7(Forecast) (95) (101) (113) (127) (142) (578)
Disbursements: Actual 28.1 55.1 94.1 168.2 228.3 573.8(Forecast) (52) (90) (106) (120) (130) (498)
The substantial differences between gross and net approvals have been due
mainly to cancellations of loans and withdrawals of projects by their spon-sors (usually they continue after approval to shop around for the best
possible terms from commercial banks, which have offered after 1970 increas-ingly competitive terms, some up to 10 years).
3.02 The distributinn of DBS' long-term loans by maturity and size isshown in Annex 1 and by industry in Annexes 2 and 3. Prior to 1972,manufacturing absorbed two-thirds of DBS lending and services one-third,with electronics and electrical machinery accounting for 20% of total port-folio. By the end of 1973, DBS had committed 291 term loans totallingS$ 758.9 million; of this, 189 loans totalling S$ 459.3 million were out-standing. Loans with a maturity of over 10 years have remained roughly thesame proportion of the total (18-19%), and less-than-five-year loans haveincreased to account for nearly one quarter of cumulative approvals by.theend of 1973. The average size of loans increased from S$ 2.5 million in1969-1971 to S$ 4 million in 1973.1/
3.03 DBS' equity investment levels have fluctuated widely, as shownbelow (Annex 1 for details):
1/ DBS has now ceased making term loans under S$ 250,000 as a normal prac-tice, usually referring these rather to its subsidiaries DBS-Finance andSFDL.
- 5 -
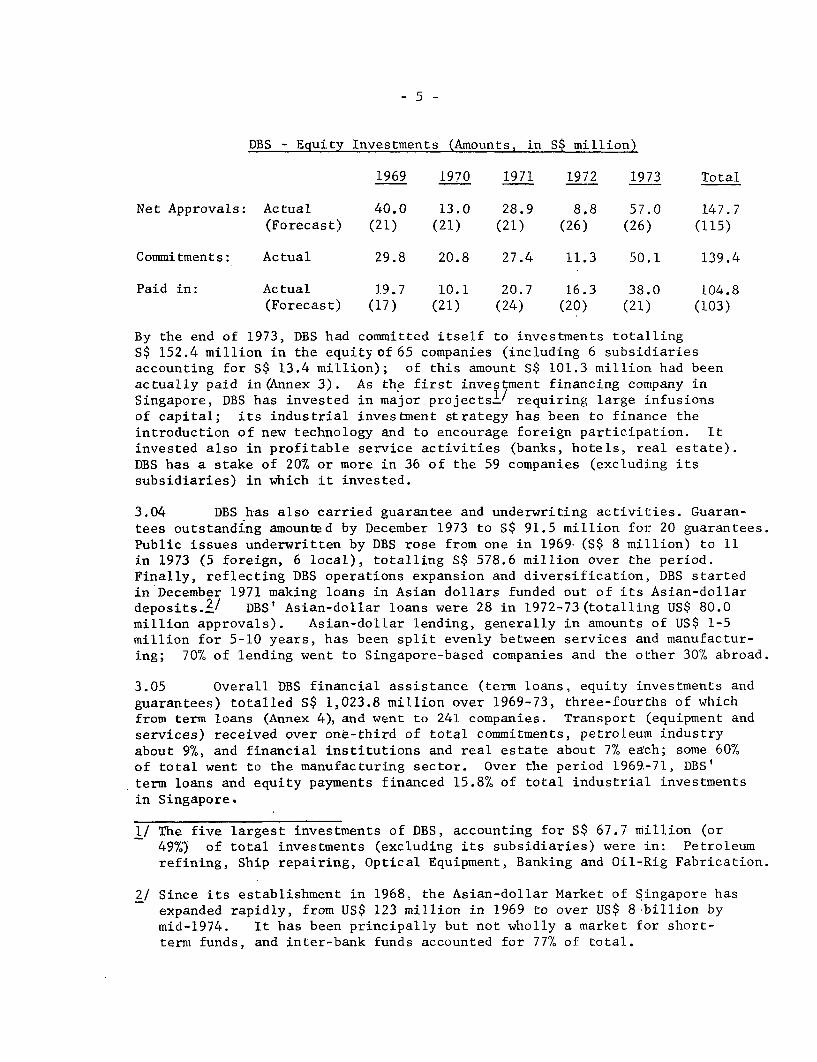
DBS - Equity Investments (Amounts, in S$ million)
1969 1970 1971 1972 1973 Total
Net Approvals: Actual 40.0 13.0 28.9 8.8 57.0 147.7(Forecast) (21) (21) (21) (26) (26) (115)
Commitments: Actual 29.8 20.8 27.4 11.3 50.1 139.4
Paid in: Actual 19.7 10.1 20.7 16.3 38.0 104.8(Forecast) (17) (21) (24) (20) (21) (103)
By the end of 1973, DBS had committed itself to investments totallingS$ 152.4 million in the equityof65 companies (including 6 subsidiariesaccounting for S$ 13.4 million); of this amount S$ 101.3 million had beenactually paid in (Annex 3). As the first investment financing company inSingapore, DBS has invested in major projectsil requiring large infusionsof capital; its industrial investment strategy has been to finance theintroduction of new technology and to encourage foreign participation. Itinvested also in profitable service activities (banks, hotels, real estate).DBS has a stake of 20% or more in 36 of the 59 companies (excluding itssubsidiaries) in which it invested.
3.04 DBS has also carried guarantee and underwriting activities. Guaran-tees outstanding amounted by December 1973 to S$ 91.5 million for 20 guarantees.Public issues underwritten by DBS rose from one in 1969.(S$ 8 million) to 11in 1973 (5 foreign, 6 local), totalling S$ 578.6 million over the period.Finally, reflecting DBS operations expansion and diversification, DBS startedin December 1971 making loans in Asian dollars funded out of its Asian-dollardeposits.2/ DBS' Asian-dollar loans were 28 in 1972-73(totalling US$ 80.0million approvals). Asian-dollar lending, generally in amounts of US$ 1-5million for 5-10 years, has been split evenly between services and manufactur-ing; 70% of lending went to Singapore-based companies and the other 30% abroad.
3.05 Overall DBS financial assistance (term loans, equity investments and
guarantees) totalled S$ 1,023.8 million over 1969-73, three-fourths of whichfrom term loans (Annex 4),and went to 241 companies. Transport (equipment and
services) received over one-third of total commitments, petroleum industryabout 9%, and financial institutions and real estate about 7% each; some 60%of total went to the manufacturing sector. Over the period 1969-71, DBS'term loans and equity payments financed 15.8% of total industrial investmentsin Singapore.
1/ The five largest investments of DBS, accounting for S$ 67.7 million (or49%) of total investments (excluding its subsidiaries) were ,in: Petroleumrefining, Ship repairing, Optical Equipment, Banking and Oil-Rig Fabrication.
2/ Since its establishment in 1968, the Asian-dollar Market of Singapore has
expanded rapidly, from US$ 123 million in 1969 to over US$ 8 billion bymid-1974. It has been principally but not wholly a market for short-
term funds, and inter-bank funds accounted for 77% of total.
- 6 -
3.06 Commercial Banking: When DBS had sought financial institutions'
participation in its original equity it had explicitly made the point that
it did not envisage competing with them at the short-term end of the market.It was projected during appraisal that current and fixed deposits with DBSwould increase from S$ 32 million in 1969 to S$ 138 million in 1973, and thatoverdrafts would be atout 20% of deposits held. DBS started its commercialbanking operations in mid-1969 and in the event chose to expand them rapidly,L/
rather than to remain a specialized term-lending institution faced withaggressive competitors. Restrictions on short-term operations were removedin March 1972, and DBS' Policy Statement was amended accordingly2/; sincethen, DBS has offered a wide variety of banking facilities to its term-financeclients and also to others (DBS opened its first branch in December 1972).DBS' deposits and overdrafts increased rapidly to reach S$ 474 and 291 millionrespectively by June 1974; they represented in 1972 about 5% and 4%respectively of total commercial banks' deposits and overdrafts (Annex 5).DBS has also been active in short-money market operations and Asian-dollaroperations; total deposits with and advances to DBS increased to S$ 252million in June 1974, of which 96% were Asian dollars (Annex 5). DBS' depositsrepresented 1.4% of the total Asian-dollar market.
DBS Resources
4.01 The increasing importance of commercial banking in DBS' operationsis reflected in DBS' Balance Sheets and Cash Flow Statements given in Annexes6 and 7. Total assets grew from S$ 235.7 million at end of 1969 to S$ 1,241.1million at end of 1973 against S$ 749 million forecast. By December 1973,current assets accounted for 50% of total assets (compared to 22% forecast),and for 50% of the increase in total assets over 1969-1973, as compared to 14%forecast. Outstanding term loans and investments were lower than forecastup to end of 1971 and picked up thereafter, almost reaching forecast by 1973.
4.02 DBS' expanded operations were financed by a rapid increase in debt.It was foreseen during appraisal that DBS would have to raise about S$ 164million in Singapore in 1970-71, and the prospects for raising such anamount were considered unclear despite strong Government support. Totaldebt increased from S$ 134 million by end of 1969 to S$ 1,125 million by endof 1973, including S$ 635 million current liabilities. Long-term debt out-standing increased from S$ 62.3 million in 1969 to S$ 491 million in 1973,comprising3/ S$378 million from the Government, / ADB's 1969 Loan, IBRD Loan
1/ Singapore banking community was initially suspicious, if not nervous, aboutpossible unfair competition from Government-sponsored DBS in traditionalareas. Relations were good after 1970.
2/ At that date, DBS' Policy Statement was also amended to allow it to engagein stock market operations.
3/ excluding a KfW loan of DM 10 million (S$ 8.3 million) made in 1970 andprepaid in September 1972.
4/ which has been giving DBS a practically open line of credit every year.

- 7 -
658-SI, a S$ 30 million loan made in 1973 by Singapore's Post Office SavingsBank, and a US$ 10 million bond issue repayable over 10 yea s which DBS success-
fully floated in December 1971 on the Asian-dollar market.' In 1974, DBSreceived dollar loans totalling US$ 36.5 million, including a further US$ 10million from ADB. By June 1974, DBS' long-term resources totalled S$ 1,034million, including S$ 120 million equity, S$ 769 million other domestic currencyresources and S$ 145 mi.llion foreign currency resources. Total debt/equityratio rose from 1.3:1 in 1969 to 3.3:1 in 1971 and 9.7:1 in 1973, whilstlong-term debt/equity rose from 2:1 in 1972 to 4.2:1 in 1973. DBS' Articlesof Association and Policy Statement were modified, with Bank approval, in
1970 and 1974 to raise the limit on this ratio from 3:1 to 5:1 and to 10:1;
in February 1974, the Bank waived the corresponding provision of the Loan
Agreement (cf. para. 1.05) because of its small involvement in DBS and unlike-
lihood of further lending to DBS.2/
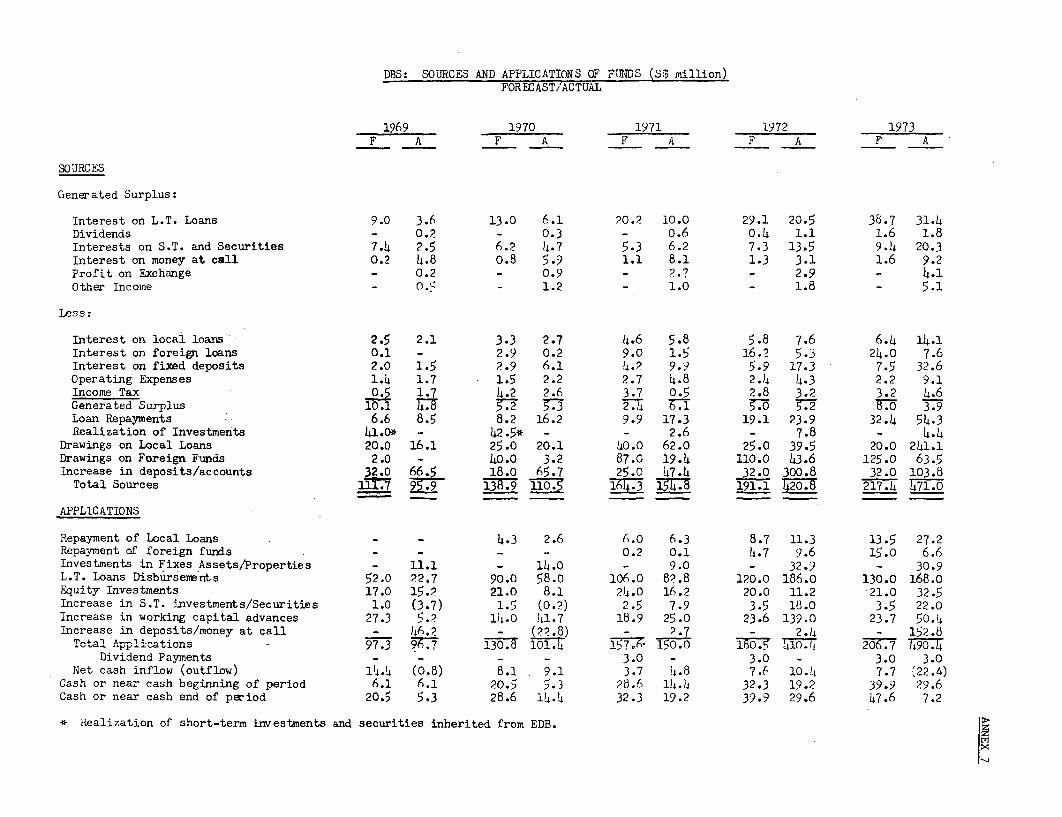
4.03 The statement of sources and applications of funds (Annex 7) indi-
cates that deposits were a major source of funds. In 1969-1971, about 40% of
disbursements on development banking operations were financed cut of short-
term resources (net increase in deposits); in 1972-73 however, largely
reflecting the sharp rise in short-term relative to long-term interest ratestowards the end of the period, most short-term resources were used for DBS'expanded commercial banking operations (para. 3.06), as shown in the following:
DBS - Flow of Funds 1969-1971 and 1972-1973
1969-1971 1972-1973S$ Million % S$ Million %
Internal Cash Generation 16.1 6.8 9.1 2.0Realization of Investments 2.6 1.1 12.2 2.6
Loan Collections 42.0 17.7 78.2 16.9Drawings on L.T. Borrowings 120.8 50.9 387.7 84.0Less: L.T. Debt Repayment (9.0) (3.8) (54.7) (11.9)Increase in deposits/accounts 179.6 75.7 404.6 87.7Less: increase in S.T. advances/
investments (102.0) (43.0) (384.6) (83.3)
Total Sources 250.2 105.5 452.5 98.0
Applications
Fixed Assets/Properties 34.1 14.4 63.8 13.8Loans/E4uity Disbursements 203.0 85.6 397.7 86.2
Total Applications 237.1 100.0 461.5 100.0
Net Cash Inflow 13.2 5.5 (9.0) (2.0)
DBS Financial Performance
5.01 DBS' profits before tax increased from S$ 5.6 million in 1969 toS$ 11.2 million in 1973; in relation to average total assets, they decreased
1/ This was the first attempt to tap the Asian-dollar market for long-termdevelopment funds and it was a commendable achievement. In 1972, DBSco-managed a US$ 20 million bond issue floated by the Government.
2/ Long-term debt/equity ratio is limited to 7:1 under the Loan Agreementbetween ADB and DBS.
- 8 -
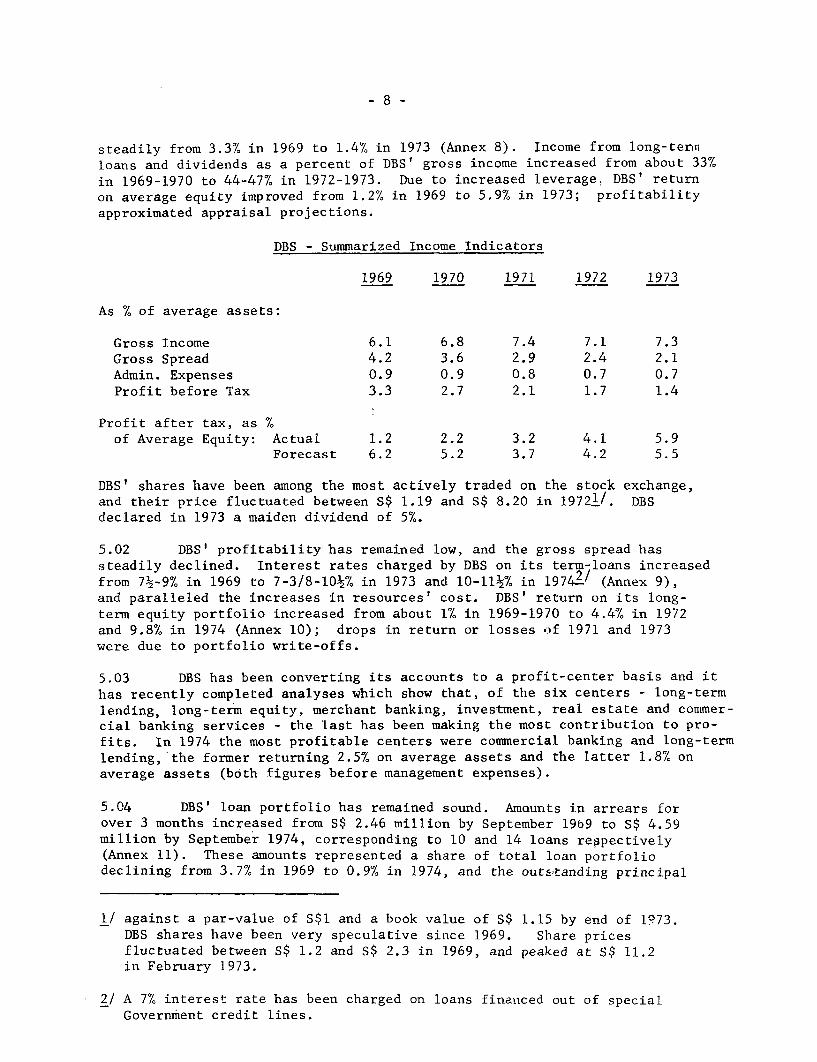
steadily from 3.3% in 1969 to 1.4% in 1973 (Annex 8). Income from long-terinloans and dividends as a percent of DBS' gross income increased from about 33%
in 1969-1970 to 44-47% in 1972-1973. Due to increased leverage. DBS' return
on average equity improved from 1.2% in 1969 to 5.9% in 1973; profitabilityapproximated appraisal projections.
DBS - Summarized Income Indicators
1969 1970 1971 1972 1973
As % of average assets:
Gross Income 6.1 6.8 7.4 7.1 7.3Gross Spread 4.2 3.6 2.9 2.4 2.1Admin. Expenses 0.9 0.9 0.8 0.7 0.7Profit before Tax 3.3 2.7 2.1 1.7 1.4
Profit after tax, as %of Average Equity: Actual 1.2 2.2 3.2 4.1 5.9
Forecast 6.2 5.2 3.7 4.2 5.5
DBS' shares have been among the most actively traded on the stock exchange,and their price fluctuated between S$ 1.19 and S$ 8.20 in 19721/. DBSdeclared in 1973 a maiden dividend of 5%.
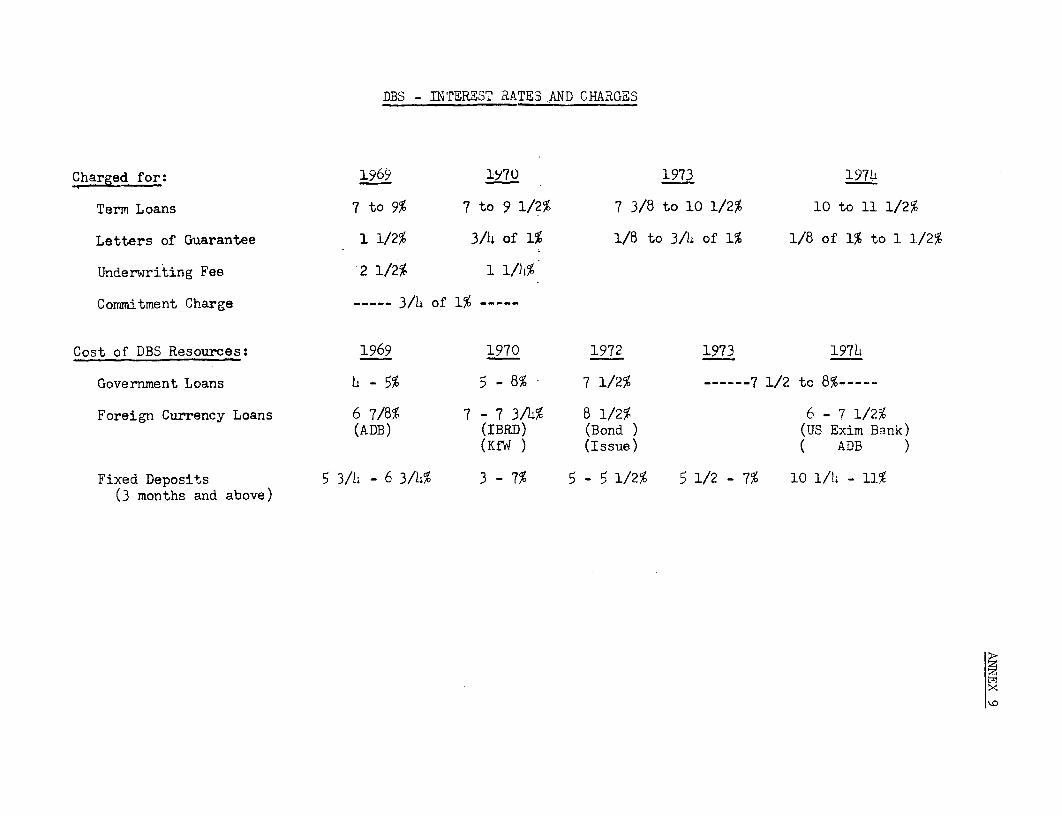
5.02 DBS' profitability has remained low, and the gross spread hassteadily declined. Interest rates charged by DBS on its term-loans increasedfrom 7 -9% in 1969 to 7-3/8-101% in 1973 and 10-11 % in 19742/ (Annex 9),and paralleled the increases in resources' cost. DBS' return on its long-term equity portfolio increased from about 1% in 1969-1970 to 4.4% in 1972and 9.8% in 1974 (Annex 10); drops in return or losses o.f 1971 and 1973were due to portfolio write-offs.
5.03 DBS has been converting its accounts to a profit-center basis and it
has recently completed analyses which show that, of the six centers - long-term
lending, long-term equity, merchant banking, investment, real estate and commer-cial banking services - the last has been making the most contribution to pro-fits. In 1974 the most profitable centers were commercial banking and long-termlending, the former returning 2.5% on average assets and the latter 1.8% onaverage assets (both figures before management expenses).
5.04 DBS' loan portfolio has remained sound. Amaunts in arrears forover 3 months increased from S$ 2.46 million by September 19b9 to S$ 4.59million by September 1974, corresponding to 10 and 14 loans respectively(Annex 11). These amounts represented a share of total loan portfoliodeclining from 3.7% in 1969 to 0.9% in 1974, and the outstanding principal
1/ against a par-value of S$l and a book value of S$ 1.15 by end of 1973.DBS shares have been very speculative since 1969. Share pricesfluctuated between S$ 1.2 and S$ 2.3 in 1969, and peaked at S$ 11.2in February 1973.
2/ A 7% interest rate has been charged on loans financed out of specialGovernment credit lines.

-9-
of loans infected declined from 9.4% of total portfolio in 1969 to 2.3% in1974. DBS reviewed in detail its portfolio at the end of 1973 and foresees
the possibility of a S$ 2.0 million loss on 4 loans; accumulated provisionsl/
of S$ 8 million by mid-1974 appear ample. An analysis carried out by DBSindicated that, of DBS' 62 equity investments totalling S$ 101.4 million atend of 1973, 33 were operating profitably, 11 were under construction or ini-
tial operation, 16 were operating at loss and 2 were in liquidation; only 9companies yielded dividends in 1973. DBS has written off equity investmentstotalling about S$ 3.5 million in 3 companies; accumulated provisions/
after write-offs amounted to S$ 3.9.million by mid-1974 (3.9% of equityportfolio).
Development Impact; Bank-financed projects
6.01 Little information is presently available on economic rates ofreturn or other partial indicators for the projects financed by DBS, whichmeasures its own developmental impact in terms of Singapore's overalleconomic development. It has accounted for about 80% of the long-termfinancing market3 / and as the principal development financing agent ofthe Government, its financing has supported EDB's priorities for industrialinvestment (see para. 6.03), although it has not of course financed projects,even when they had Government support, which it expected not to be commer-cially profitable. The success of its efforts is reflected in the diver-sification and rapid development of Singapore's economy.4L The manufac-turing and services sectors, which DBS has supported extensively andresponsively, with versatility and some amount of initiative, have beenthe cornerstones of growth and have been responsible for reversing theemployment problem-5/ of the mid-sixties and establishing Singapore as thesecond most developed nation in Asia (GNP per capita increased fromUS$ 600 in 1967 to US$ 1,600 in 1973).
1/ DBS has maintained a general provision for long-term loans at 1% of loanportfolio over and above the amounts specifically provided for doubtfulloans.
2/ In addition to specific provisions for doubtful investments, DBS hasmade a general provision of 2% of the equity portfolio.
3/ The share of DBS' term-loans outstanding in total Bank term-loans out-standing (loans of 3 years and more) was 90% by end of 1972, and 70% byend of 1973.
4/ Economic growth averaged over 12% p.a. in real terms over 1969-1973,and manufacturing contribution to GDP increased from 16.8% in 1968to about 25% in 1973.
5/ Since about 1969, Singapore has had a labor shortage problem. Trendsreversed again in late 1974.
- 10 -
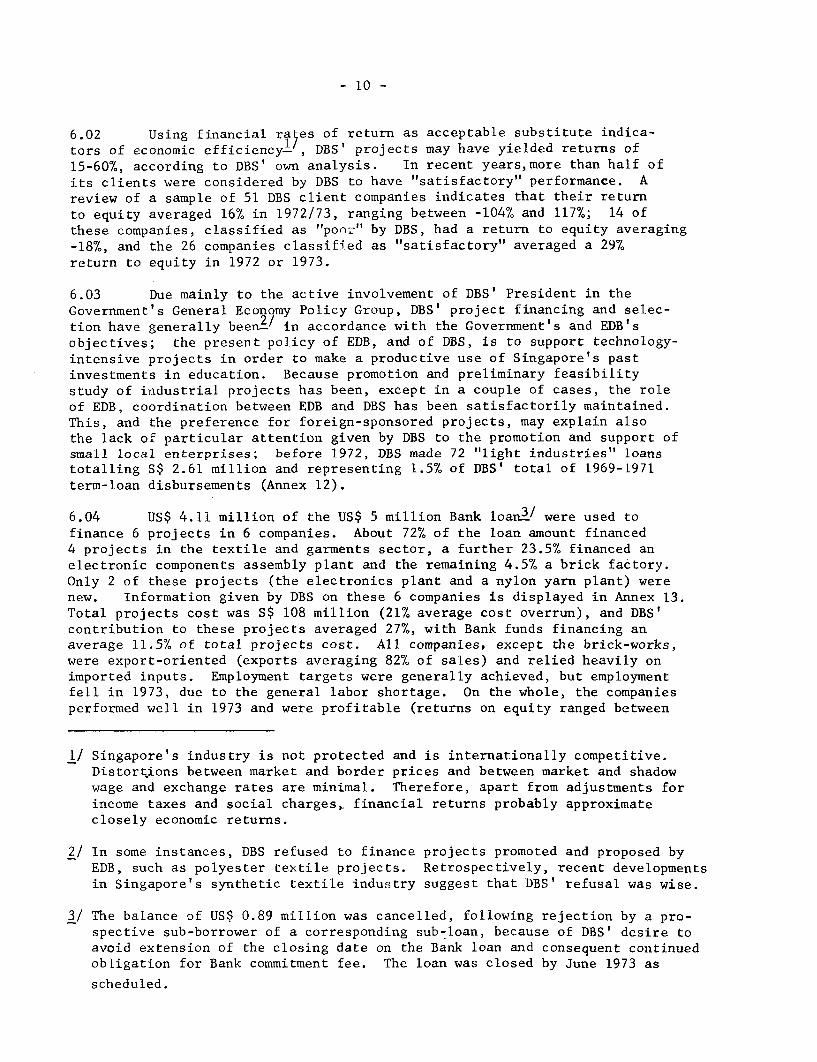
6.02 Using financial rales of return as acceptable substitute indica-
tors of economic efficiency- , DBS' projects may have yielded returns of
15-60%, according to DBS' own analysis. In recent years,more than half of
its clients were considered by DBS to have "satisfactory" performance. A
review of a sample of 51 DBS client companies indicates that their return
to equity averaged 16% in 1972/73, ranging between -104% and 117%; 14 of
these companies, classified as "poor" by DBS, had a return to equity averaging-18%, and the 26 companies classified as "satisfactory" averaged a 29%return to equity in 1972 or 1973.
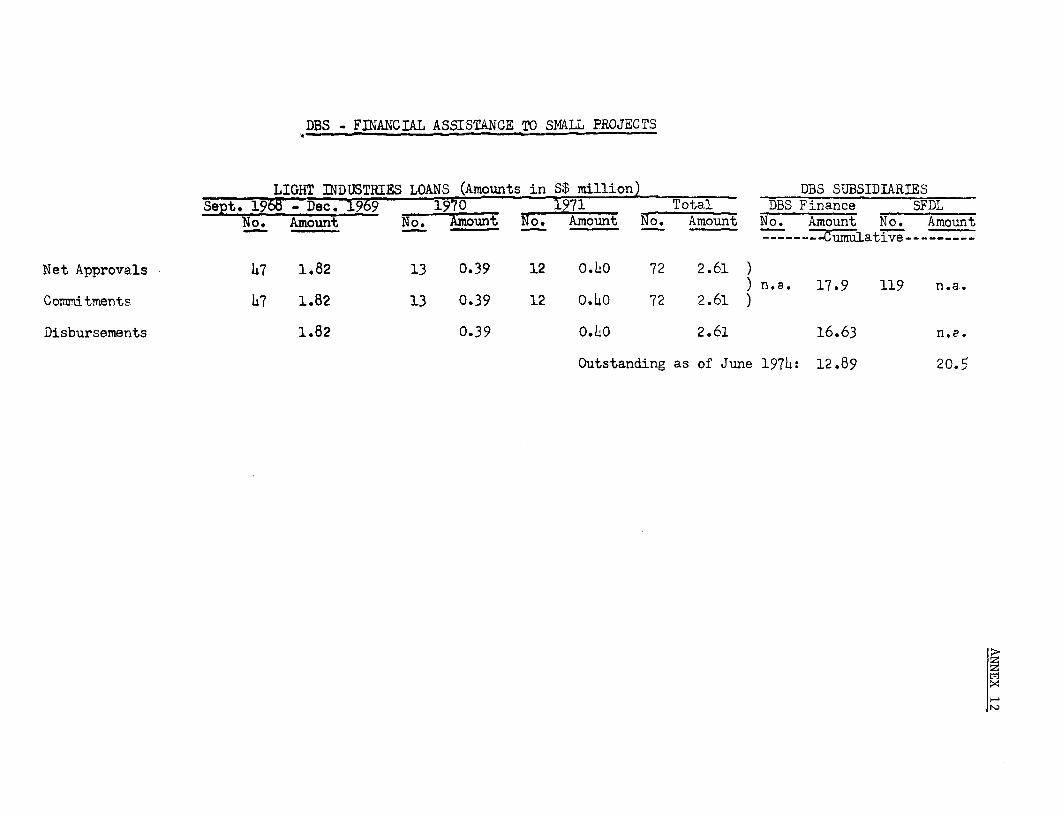
6.03 Due mainly to the active involvement of DBS' President in the
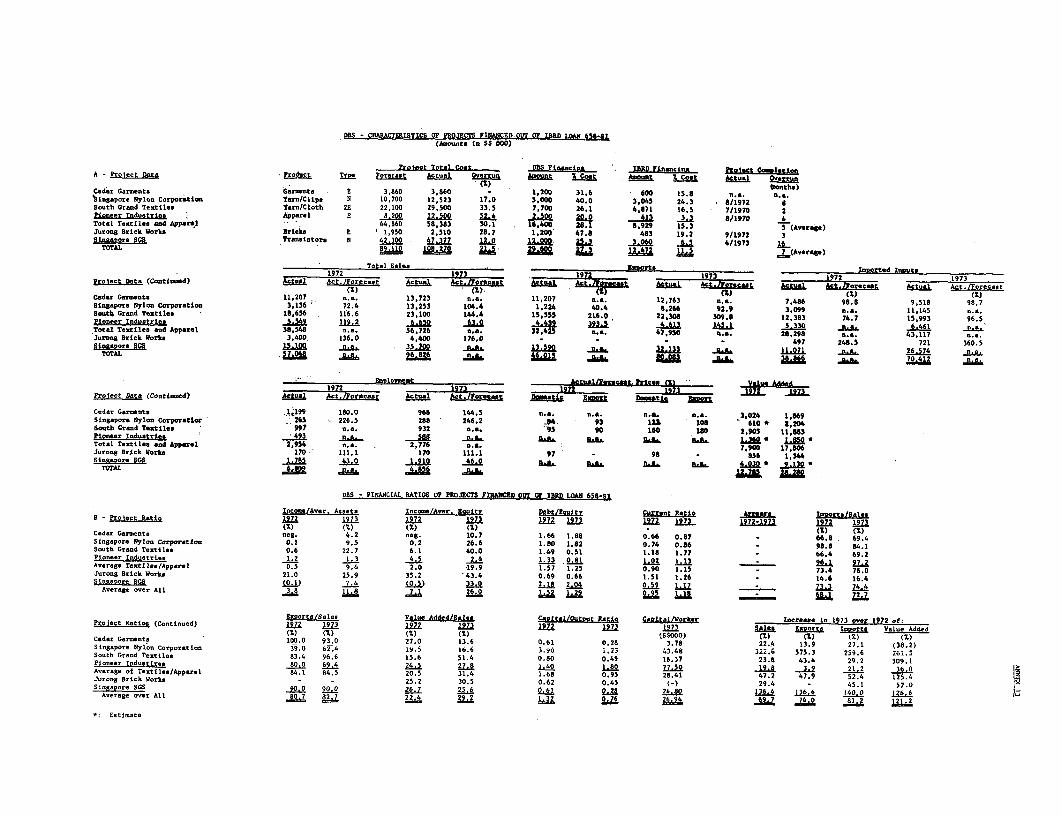
Government's General Economy Policy Group, DBS' project financing and selec-tion have generally been2/ in accordance with the Government's and EDB'sobjectives; the present policy of EDB, and of DBS, is to support technology-intensive projects in order to make a productive use of Singapore's pastinvestments in education. Because promotion and preliminary feasibilitystudy of industrial projects has been, except in a couple of cases, the roleof EDB, coordination between EDB and DBS has been satisfactorily maintained.This, and the preference for foreign-sponsored projects, may explain alsothe lack of particular attention given by DBS to the promotion and support ofsmall local enterprises; before 1972, DBS made 72 "light industries" loanstotalling S$ 2.61 million and representing 1.5% of DBS' total of 1969-1971term-loan disbursements (Annex 12).
6.04 US$ 4.11 million of the US$ 5 million Bank loan2 1 were used tofinance 6 projects in 6 companies. About 72% of the loan amount financed4 projects in the textile and garments sector, a further 23.5% financed anelectronic components assembly plant and the remaining 4.5% a brick factory.Only 2 of these projects (the electronics plant and a nylon yarn plant) werenew. Information given by DBS on these 6 companies is displayed in Annex 13.Total projects cost was S$ 108 million (21% average cost overrun), and DBS'contribution to these projects averaged 27%, with Bank funds financing anaverage 11.5% of total projects cost. All companies, except the brick-works,were export-oriented (exports averaging 82% of sales) and relied heavily onimported inputs. Employment targets were generally achieved, but employmentfell in 1973, due to the general labor shortage. On the whole, the companiesperformed well in 1973 and were profitable (returns on equity ranged between
1/ Singapore's industry is not protected and is internationally competitive.Distort,ions between market and border prices and between market and shadowwage and exchange rates are minimal. Therefore, apart from adjustments forincome taxes and social charges,, financial returns probably approximateclosely economic returns.
2/ In some instances, DBS refused to finance projects promoted and proposed byEDB, such as polyester textile projects. Retrospectively, recent developmentsin Singapore's synthetic textile industry suggest that DBS' refusal was wise.
3/ The balance of US$ 0.89 million was cancelled, following rejection by a pro-spective sub-borrower of a corresponding sub-loan, because of DBS' desire toavoid extension of the closing date on the Bank loan and consequent continuedobligation for Bank commitment fee. The loan was closed by June 1973 as
scheduled.

- 11 -
2.4% and 43.4%, averaging 26%); sales increased by 22% on average in 1973 over1972 (ex luding the new projects commissioned in 1972). None were in arrearsin 19731 . On the basis of available data, it is likely that these projectswere economically attractive, one possibly doubtful case being the electronicsplant which was one of the last projects undertaken with Government approvalto take advantage of cheap labor, and which initially provided no scope forincreasing domestic value-added nor upgrading labor skill requirements.
Conclusion
7.01 The Bank's appraisal of DBS reflected a favorable view of the sound-ness of DBS' management, portfolio and capabilities. The minor weaknessesidentified were: (i) the inadequacy of DBS' technical appraisal of theengineering aspects of projects, and (ii) DBS' insufficient post-appraisalfollow-up, resulting in long time-lags between approvals and commitment offunds; there was also a risk that the good but young and inexperienced staffof DBS and the diversification of DBS' activities might lead to a thin spreadof DBS' top management. There was no need nor room for a significant IBRDinstitution-building role.
7.02 Post-appraisal follow-up with clients has improved substantially,2/
but it has had virtually no effect in reducing the time-lag between approvalsand commitments or in reducing the level of cancellations and withdrawals,which are more the results of the competitive nature of the banking systemin Singapore and the fairly ready availability of funds from different sources.DBS' quality of technical (engineering) appraisal has not improved, with somejustification, because !.n the Singaporean context the projects (generallyjoint-ventures between local entrepreneurs and established foreign partnerswith a proven background in their industry) have generally involved testedequipment and technology. There is no evidence to suggest that the absenceof DBS technical appraisal has resulted in eventual project difficulties.2/DBS' staff, which increased from about 100 in 1969 to 515 presently, .includ-ing 47 and 145 professionals respectively, is presently characterized by thepresence of experienced department directors running relatively young staffand by substantial turnover (30% amongst professional staff-in 1974).
1/ However, the nylon yarn plant and the apparel company were in arrears bySeptember 1974, due to drastic drops in sales and poor markets and prospectsin 1974, particularly the nylon yarn plant.
2/ In particular by monitoring the movements of the clients' current accountsmaintained with DBS.
3/ DBS' appraisal of projects has been quite thorough, and investment deci-sions sound. In view of Singapore's vulnerability to world economic fluc-tuations, project appraisal would usefully comprise a detailed analysisof factors to which each project could be particularly sensitive (changesin market conditions, prices of input or output, stability offoreign partners, advantages of main competitors, etc.).
- 12 -
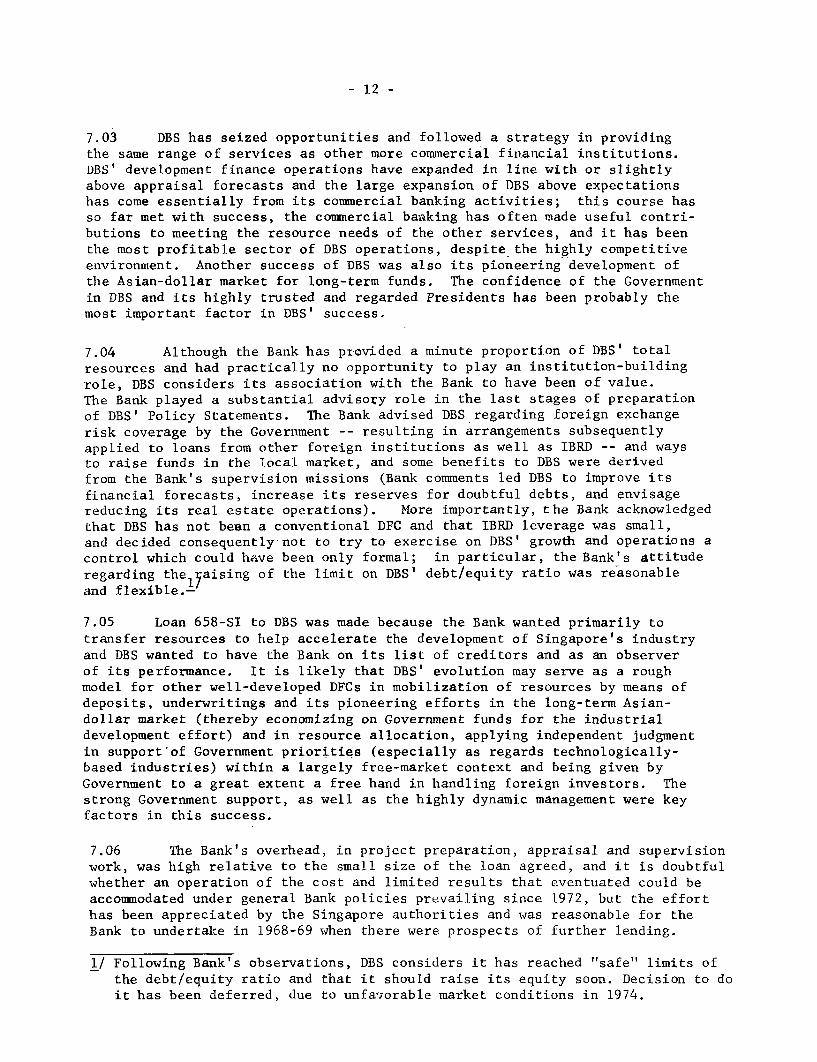
7.03 DBS has seized opportunities and followed a strategy in providingthe same range of services as other more commercial financial institutions.DBS' development finance operations have expanded in line with or slightlyabove appraisal forecasts and the large expansion of DBS above expectationshas come essentially from its commercial banking activities; this course hasso far met with success, the commercial banking has often made useful contri-butions to meeting the resource needs of the other services, and it has beenthe most profitable sector of DBS operations, despite_the highly competitiveenvironment. Another success of DBS was also its pioneering development ofthe Asian-dollar market for long-term funds. The confidence of the Governmentin DBS and its highly trusted and regarded Presidents has been probably themost important factor in DBS' success.
7.04 Although the Bank has provided a minute proportion of DBS' total
resources and had practically no opportunity to play an institution-buildingrole, DBS considers its association with the Bank to have been of value.
The Bank played a substantial advisory role in the last stages of preparationof DBS' Policy Statements. The Bank advised DBS regarding foreign exchangerisk coverage by the Government -- resulting in arrangements subsequentlyapplied to loans from other foreign institutions as well as IBRD -- and waysto raise funds in the local market, and some benefits to DBS were derivedfrom the Bank's supervision missions (Bank comments led DBS to improve itsfinancial forecasts, increase its reserves for doubtful debts, and envisagereducing its real estate operations). More importantly, the Bank acknowledgedthat DBS has not been a conventional DFC and that IBRD leverage was small,and decided consequently not to try to exercise on DBS' growth and operations acontrol which could have been only formal; in particular, the Bank's attituderegarding thelyaising of the limit on DBS' debt/equity ratio was reasonableand flexible.-
7.05 Loan 658-SI to DBS was made because the Bank wanted primarily totransfer resources to help accelerate the development of Singapore's industryand DBS wanted to have the Bank on its list of creditors and as an observerof its performance. It is likely that DBS' evolution may serve as a roughmodel for other well-developed DFCs in mobilization of resources by means ofdeposits, underwritings and its pioneering efforts in the long-term Asian-dollar market (thereby economizing on Government funds for the industrialdevelopment effort) and in resource allocation, applying independent judgmentin support'of Government priorities (especially as regards technologically-based industries) within a largely free-market context and being given byGovernment to a great extent a free hand in handling foreign investors. Thestrong Government support, as well as the highly dynamic management were keyfactors in this success.
7.06 The Bank's overhead, in project preparation, appraisal and supervisionwork, was high relative to the small size of the loan agreed, and it is doubtfulwhether an operation of the cost and limited results that eventuated could beaccommodated under general Bank policies prevailing since 1972, but the efforthas been appreciated by the Singapore authorities and was reasonable for theBank to undertake in 1968-69 when there were prospects of further lending.
1/ Following Bank's observations, DBS considers it has reached "safe" limits ofthe debt/equity ratio and that it should raise its equity soon. Decision to doit has been deferred, due to unfavorable market conditions in 1974.
ANNEX 1
D. B. S.8 OPERATIONS 1969 - 1973
FORECAST/ACTUAL
1969 1970 1971 1972 1973Amounts in S$ million No. Amount No. Amount No. Amount No. Amount No. Amount
Applications (Actual)L. T. Loans 84 238.5 71 172.1 86 274.0 87 423.9 94 511.4Equity Investments 38 102.3 41 35.9 11 5.7 19 10.9 28 73.6Guarantees 6 79.7 7 h 82.8 7 28.0
127 r20. 19 227 112 362. 113 W42 73 -
Gross Approvals (Actual)L. T. Loans, 49 111.1 35 54.1 48 202.6 59 236.0 63 346.2Equity Investments 33 58.6 25 14.8 15 31.5 20 15.8 29 60.4Guarantees 2 47.1 2 1 6. 97. 1 5.8
13 7ZT 7 2177 .7MT? S 393 106 7
Net Approvals:Actual: L. T. Loans 69 85.3 39 46.3 50 150.7 50 186.1 54 218.3
Equity Investments 28 40.0 16 13.0 13 28.9 16 8.8 26 57.0Guarantees 2 47.2 2 3.1 _ 5 -3 ( ) 10.7 il
99 172.5 57 62.4 64 185.4 63 184.2 93 328.6
Forecast: L. T. Loans 95.o 101.0 113.0 127.0 1h2.0Equity Investments 21.0 21.0 21.0 26.0 26.0
116r.0 122.0 13.0
Commitments (Actual)L. Ti Loans 65 65.6 41 58.7 48 81.1 34 73.7 42 88.2Equity Investments 21 29.8 20 20.8 9 27.4 20 11.3 23 50.1Guarantees 2 4Z 1 5.8
Disbursements:Actual: L. T. Loans 29 28.1 33 55.1 40 94.1 45 168.2 55 228.3
Equity Investments 15 19. 16 10.1 7 20. 10 16.3 12 8.0r77 11 . 7 266.3
Forecasts L. T. Loans 52.0 90.0 106.0 120.0 130.0Equity Investments 17.0 21.0 2h.0 20.0 21.0
69.0 111.0 130.0 1140.0 15!10
Distribution of Net Approvals of L. T. Loans bysMaturity: Up to 5 17 23.6 11 11.6 11 8.1 16 66.9 20 57.5(years) 5 - 10 26 51.7 14 30.1 25 124.5 27 79.5 29 111.4
10 - 15 10 33.0 3 4.7 2 18.1 6 39.5 5 49.415 - 21 2 2- - - - 1 0.1 - -
7 111.3 2i .7 -1557 3- 1.1 -5 218.3
Size: Up to 200 13 1.6 - - 6 1.1 11 1.3 7 1.1TS000) 200 - 2,000 30 26.9 18 16.8 18 11.3 21 22.8 19 13.1
2,000 - 6,000 -6. 17,8 9 28.3.. 8 . 45.6 .12 39.3 11 37.86,000 10,000 3 26.0 - - 3 30.5 3 25.1 7 48.1Over - 10,000 3 39.0 - - 3 61.8 3 97.5 10 118.2
a/ Cancellations.
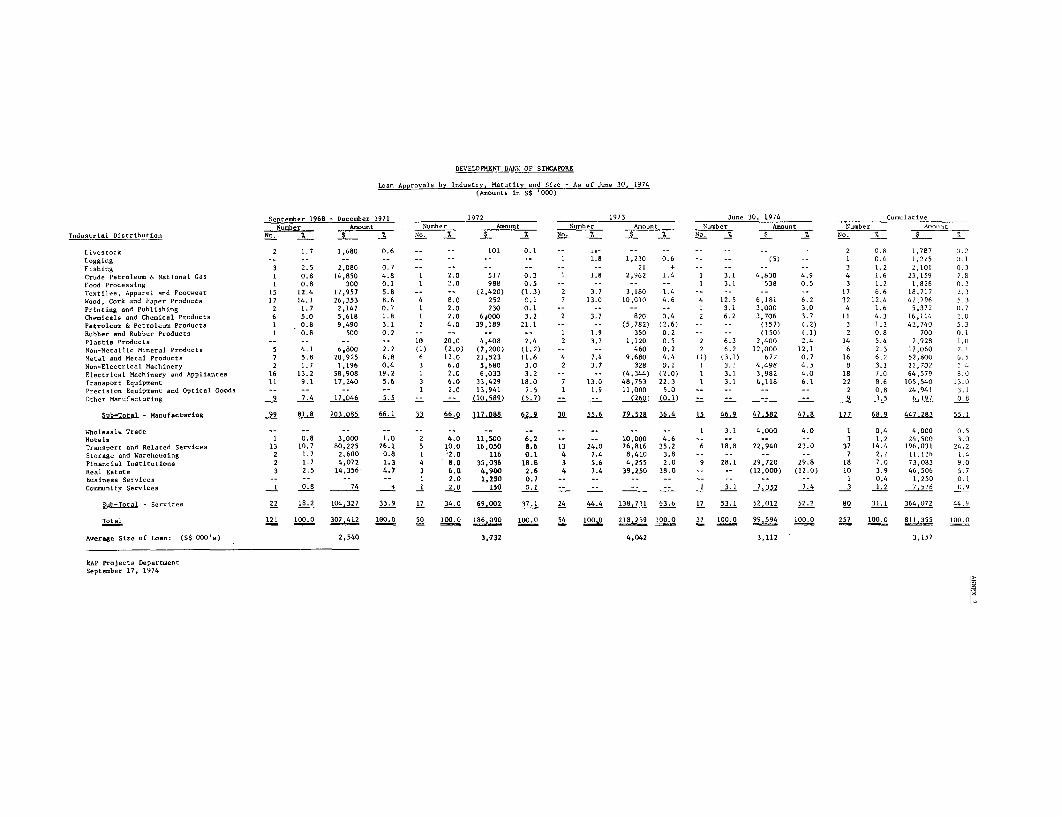
DEVELOPMENT BANK OF SINGAPORE
Loan Approvals by Industry, Maturity and Size - As of June 30, 1974(Amounts in SS '000)
September 1968 - December 1971 1972 1973 June 30, 1974 Cumulative
Noumber Amount AmNumber Amount N-ber Amount Number Amount Number AmountIndustrial Distribution Eo. . $ 7i _No. 7 A_ %. No . 7. E-_ 7. No 7. --/ 0 7
Livestock 2 1.7 1,680 0.6 -- -- 101 0.1 -- - -- -- -- 2 0.8 1,787 0.2Logging . -- -- -- 1 1,8 1,230 0.6 -- (5) -- 1 0.4 1,225 0.1Fishing 3 2.5 2,080 0.7 -- -- -- 21 + -- -- 3 1.2 2,101 0.3Crude Petroleum & National Gas 1 0.8 14,850 4.8 1 2.0 517 0.3 1 1,8 2,962 1.4 1 3.1 4,830 4.9 4 1.6 23,159 ?.8Food Processing 1 0.8 300 0.1 1 2.0 988 0.5 -- -- *- -- 1 3.1 538 0.5 3 1.2 1,826 0.2Textiles, Apparel and Footwear 15 12.4 17,957 5.8 -- -- (2,420) (1.3) 2 3.7 3,180 1.4 -- -- -- 17 6.6 18,717 2.3
Wood, Cork and Paper Products 17 14.1 26,353 8.6 4 8.0 252 0.1 7 13.0 10,010 4.6 4 12.5 6,181 6.2 32 12.4 42,796 5.3Printing and Publishing 2 1.7 2,162 0.7 1 2.0 230 0.1 -- -- -- -- 1 3.1 3,000 3.0 4 1.6 5,372 11.7
Chemicals and Chemical Products 6 5.0 5,618 1.8 1 2.0 6000 3.2 2 3.7 820 0.4 2 6.2 3,706 3.7 11 4.3 16,114 1.0
Petroleum & Petroleum Products 1 0.8 9,490 3.1 2 4.0 39,189 21.1 -- -- (5,782) (2.6) -- -- (157) (.2) 3 1.2 42,740 5.3Rubber and Rubber Products 1 0.8 500 0.2 -- -- -- -- 1 1.9 350 0.2 -- -- (150) (.1) 2 0.8 700 0.1Plastic Products -- -- -- -- 10 20.0 4,408 2.4 2 3.7 1,120 0.5 2 6.3 2,400 2.4 14 5,4 7,928 1.0Non-Metallic Mineral Products 5 4.1 6,800 2.2 (1) (2.0) (2,200) (1.2) -- -- 460 0.2 2 6.2 12,000 12.1 6 2.3 17,060 2.1Metal and Metal Products 7 5.8 20,925 6.8 6 12.0 21,523 11.6 4 7,4 9,680 4.4 (1) (3.1) 672 0.7 16 6.2 52,800 6.5Non-Electrical Machinery 2 1.7 1,196 0.4 3 6.0 5,680 3.0 2 3.7 328 0.1 1 3.1 4,498 4.3 8 3.1 11,702 ] 1Electrinal Machinery and Appliances 16 13.2 58,908 19.2 1 2.0 6,033 3.2 -- -- (4,344) (2.0) 1 3.1 3,982 4.0 18 7.0 64,579 0.0Transport Equipment 11 9.1 17,240 5,6 3 6.0 33,429 18.0 7 13.0 48,753 22.3 1 3.1 6,118 6.1 22 8.6 105,540 13.0Precision Equipment and Optical Goods -- -- -- -- 1 2.0 13,941 7.5 1 1.9 11,000 5.0 -- - -- -- 2 0.8 24,941 3.1Other Manufacturing 9 7.4 17.046 5.5 -- -- GM89) (5.7) -- - (26) (0.1) - -- - 9 3.5 6,197 0.8
Sub-ot.al- Manufacturing 99 81.8 203085 66.1 33 66.0 117088 62 30 55.6 79.528 .4 U 46.9 47582 22 4VLJ 447283 55.J
Wholesale Trade -- -- -- -- -- - -- -- -- -- -- -- 1 3.1 4,000 4.0 1 0.4 4,000 0.5Hotels 1 0.8 3,000 1.0 2 4.0 11,500 6.2 -- -- 10,000 4.6 -- -- - -- 3 1.2 24,500 3.0Transport and Related Services 13 10.7 80,225 26.1 5 10.0 16,050 8.6 13 24.0 76,816 35.2 6 18.8 22,940 23.0 37 14.4 196,031 24.2Storage and Warehousing 2 1.7 2,600 0.8 1 12.0 116 0.1 4 7.4 8,410 3.8 -- -- -- -- 7 2.7 11,126 1.4Financial Institutions 2 1.7 4,072 1.3 4 8.0 35,036 18.8 3 5,6 4,255 2.0 9 28.1 29,720 29.8 18 7.0 73,083 9.0Real Estate 3 2.5 14,356 4.7 3 6.0 4,900 2.6 4 7.4 39,250 18.0 -- -- (12,000) (12.0) 10 3.9 46,506 5.7Business Services -- -- -- -- 1 2.0 1,250 0.7 -- -- -- -- -- -- -- -- 1 0.4 1,250 0.1Community Services 1 0.8 74 + 1 2.0 150 0.1 -- -- 1 3.1 75 7.4 3 1.2 7,576 0.19
Sub-Tocal - Services 22 18.2 I04,327 33.9 17 34.0 69.002 37.1 24 44.4 138,731 63.6 17 53.1 52,012 52.2 80 31.1 36,02 44.9
121 100.0 180.0 54 1000 2168259 100.0 32 100 0 99 594 100.0 257 100.0
Average Size of Loan: (S$ 000's) 2,540 3,732 4,042 3,112 3.157
PAP Projects DepartmentSeptember 17, 1974
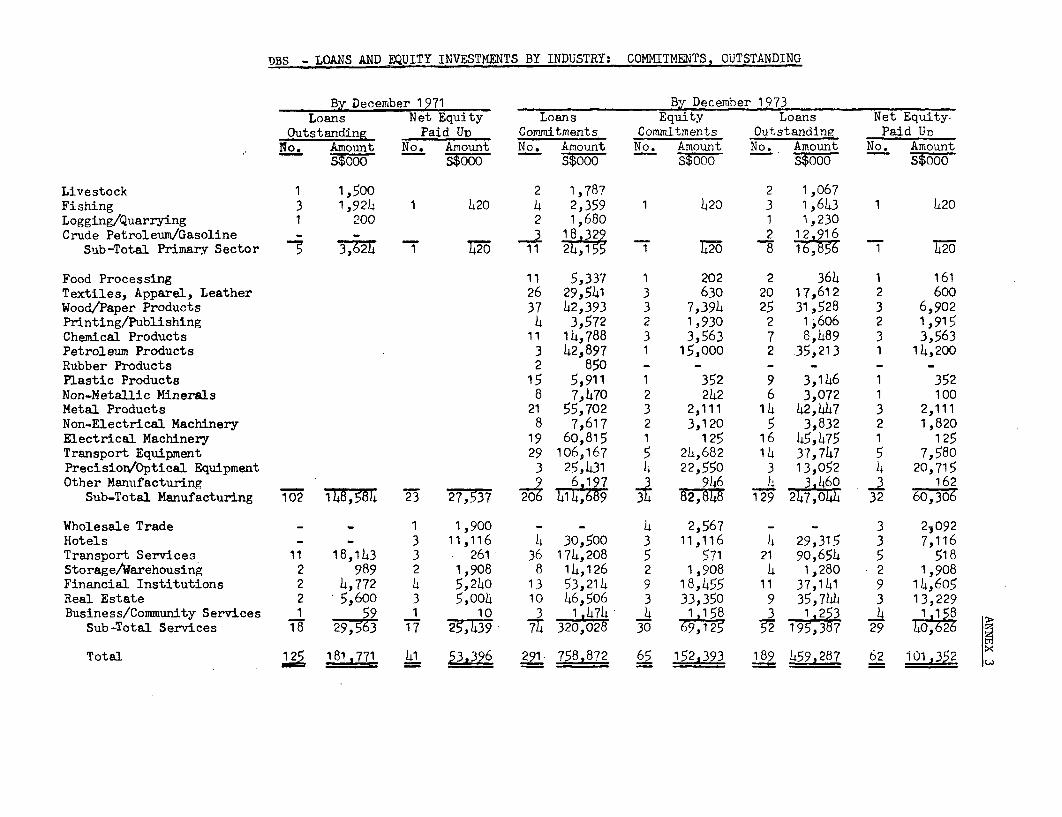
DBS - LOANS AND EQUITY INVESTMENTS BY INDUSTRY: COMMITMENTS, OUTSTANDING
By December 1971 By December 1973Loans Net Equity Loans Equity Loans Net Equity.
Outstanding Paid Up Commitments Commitments Outstanding Paid UrNo. Amount No. Amount No. Amount No. Amount No. Amount No. Amount
S$000 S$000 - S$0001 - S7000 S$000 - ST00
Livestock 1 1,500 2 1,787 2 1,067Fishing 3 1,924 1 h20 4 2,359 1 120 3 1,643 1 420Logging/Quarrying 1 200 2 1,680 1 1,230Crude Petroleum/Gasoline - - 3_ 18 329 2 12 916
Sub-Total Primary Sector 7 3,62) 1 20 11 2,5 1 420 8 1,81 1720
Food Processing 11 5,337 1 202 2 364 1 161Textiles, Apparel, Leather 26 29,541 3 630 20 17,612 2 600Wood/Paper Products 37 42,393 3 7,394 25 31,528 3 6,902Printing/Publishing 4 3,572 2 1,930 2 1,606 2 1,915Chemical Products 11 14,788 3 3,563 7 8,489 3 3,563Petroleum Products 3 42,897 1 15,000 2 35,213 1 14,200Rubber Products 2 850 - - - - - -Plastic Products 15 5,911 1 352 9 3,146 1 352Non-Metallic Minerals 8 7,470 2 242 6 3,072 1 100Metal Products 21 55,702 3 2,111 14 42,447 3 2,111Non-Electrical Machinery 8 7,617 2 3,120 5 3,832 2 1,820Electrical Machinery 19 60,815 1 125 16 45,475 1 125Transport Equipment 29 106,167 5 24,682 14 37,747 5 7,580PrecisiorVOptical Equipment 3 25,431 4 22,550 3 13,052 4 20,715Other Manufacturing _ 9 6 197 3 946 4 31460 3 162
Sub-Total Manufacturing 102 17,7 23 27,777 -206 414,689 3 T2=, 129 247,044 32 60,306
Wholesale Trade - - 1 1,900 - - 4 2,567 - - 3 2.092Hotels - - 3 11,116 4 30,500 3 11,116 4 29,315 3 7,116Transport Services 11 18,143 3 261 36 174,208 5 571 21 90,654 5 518Storage/Warehousing 2 989 2 1,908 8 14,126 2 1,908 4 1,280 2 1,908Financial Institutions 2 4,772 4 5,240 13 53,214 9 18,455 11 37,11 9 14,605Real Estate 2 5,600 3 5,004 10 46,506 3 33,350 9 35,7U6 3 13,229Business/Community Services 1 59 1 10 3 174 1158 3 1,253 j 1 158 >
Sub-Total Services T -97 7 -, 7 320,028 17 69,3 3 195,387 29 14626
Total 181,771 41 396 291 758,872 65 152,393 189 459,287 62 101,352
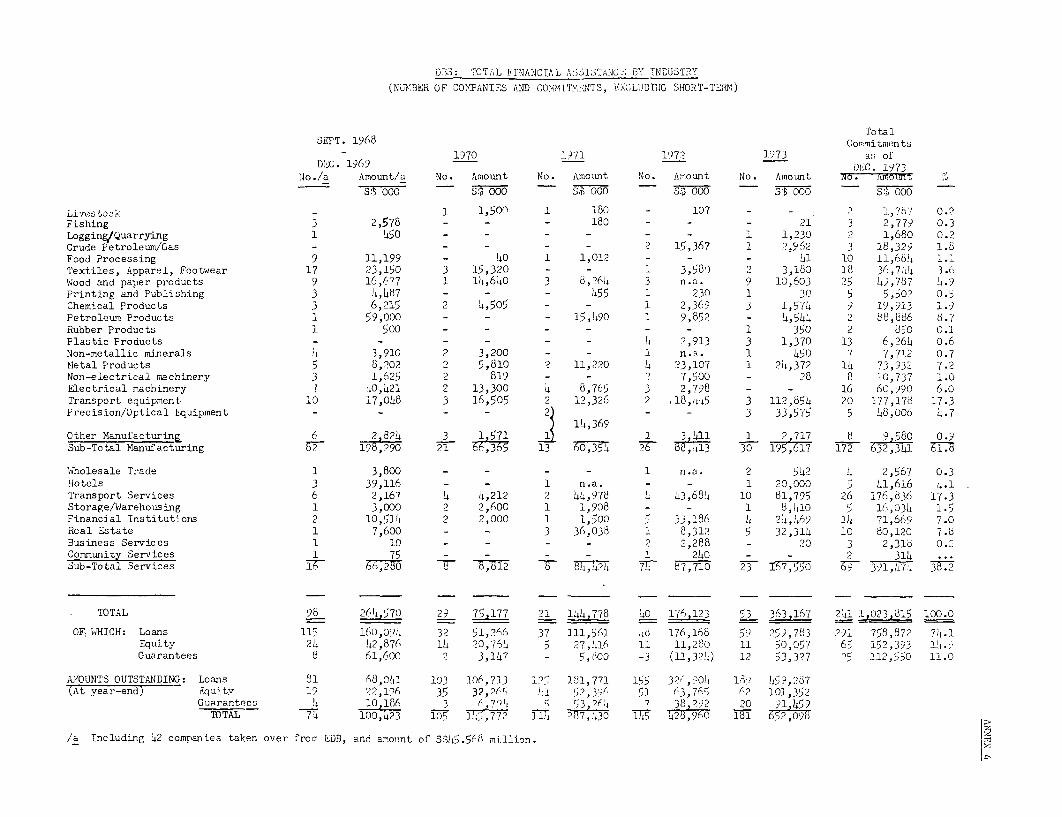
D7S: TOTAL FINANCIAL AS;STANCS BY INDUSTRY(NUK.BER OF COMPANIES AND COMMITMENTS, EXCLUDTBG SHORT-TEfR)
TotalSEPT. 1968 Comitments
1970 1971 1972 1973 as ofDEC. 1969 DEC. 1973
No./a Amount/a No. Amount No. Amount No. Amount No. Amount No. AmnS -0 77' _ S) 000 SW 000 S 000
Livestock -1 1,500 1 160 - 107 - - . 2 1,77 0.2Fishing 3 2,578 - - - 180 - - - 21 3 2,779 0.3Logging/Quarrying 1 650 - - - - - - 1 1,230 2 1,680 0.2Crude Petroleum/Gas -- - - - 2 16,367 1 2,952 3 18,329 1.8Food Processing 9 11,199 - 40 1 1,012 - - - 41 10 11,684 1.1Textiles, Apparel, Footwear 17 23,150 3 15,320 - - 1 3,580 2 3,180 15 36,740 3.Wood and paper products 9 16,677 1 10,640 3 b,?6 3 n.a. 9 10,603 25 49,787 1.9Printing and Publishing 3 4,67 - - - 655 1 230 1 30 5 5,50? 0.5Chemical Products 3 6,215 2 4,505 - - 1 2,369 3 1,570 9 12,913 1.9Petroleum Products 1 59,000 - - - 15,490 1 9,852 - 0,58 2 88,856 6.7Rubber Products 1 500 - - - - - - 1 360 2 d50 0.1Plastic Products - - -- - - ' ,913 3 1,370 13 6,26L 0.6Non-metallic minerals 4 3,910 2 3,200 - - 1 n.'. 1 450 7 7,7i2 0.7Metal Products 5 8,202 2 6,810 2 11,220 1 23,107 1 20,372 10 73,932 7.2Non-electrical machinery 3 1,625 2 819 - - 2 7,500 - 28 8 10,737 1.0Electrical machinery 7 O,421 2 13,300 4 8,766 3 2,798 - - 16 60,990 6.0Transport equipment 10 17,008 3 16,505 2 12,326 2 .18,14 5 3 112,86 20 177,176 17.3Precision/Optical Equipment - - - - 2 - - 3 33,676 6 08,006 0.7
1 6 1,369 - -3 3355 5 4,0 7
Other ManufacturinE 6 2 824 3 1 571 1 1 3 411 1 2 717 8 9 580 0.9Sub-Total Manufacturing 62 12"no 71 -6 13 60,374 2 6811 30 193'61 172 63231 1.
Wholesale Trade 1 3,800 - - - - 1 n.a. 2 542 1 2,567 0.3Hotels 3 39,116 - - 1 n.a. - - 1 20,000 5 01,616 4.1Transport Services 6 2,167 4 4,212 2 04,978 4 43,688 10 81,795 26 176,536 17.3Storage/Warehousing 1 3,000 2 2,600 1 1,908 - - 1 8,10 5 16,034 1.5Financial Institutions 2 10,610 2 2,000 1 1,500 5 33,186 4 2h,06) 10 71,669 7.0Real Estate 1 7,600 - - 3 36,038 1 8,312 5 32,314 10 80,120 7.bBusiness Services 1 10 - - - - 2 2,288 - 20 3 2,31d 0.2Community Services 1 75 - - - - 1 240 - - 2 314 ...Sub-Total Services F T ,2E 8180002T 7 87,710 2 I 391,07r 35.2
TOTAL 98 64,570 29 7,177 21 14O,778 00 1 13 363,167 241 L,023 815 100.0
OF, 'VHICH: Loans 11 160,09), 32 51,266 37 111,561 h1 176,168 59 259,783 2)1 758,872 70.1Equity 24 42,876 14 20,760 5 27,016 11 11,280 11 60,057 65 152,393 1..Guarantees 6 61,600 2 3,1h7 - 5,800 -3 (11,320) 12 53,3?7 DS 112,50 11.0
AMOUNTS OUTSTANDING: Loans 81 68,001 103 106,713 12o 181,771 155 32',)00 189 6 5',267(At year-end) Equity 19 22,126 35 32,2r 41 52,3'6 51 63,7(5 62 101,352
G/arantees r3 , 53o E6D 7 3, 9a2 20 sl 4l9TOTAL T4 100,423' 106 7',772 1, 177,?J 17 ,00 T~ 2T8 1 52316
/a Including 02 companies taken over from EDB, and amoiint of S2J6558 million.
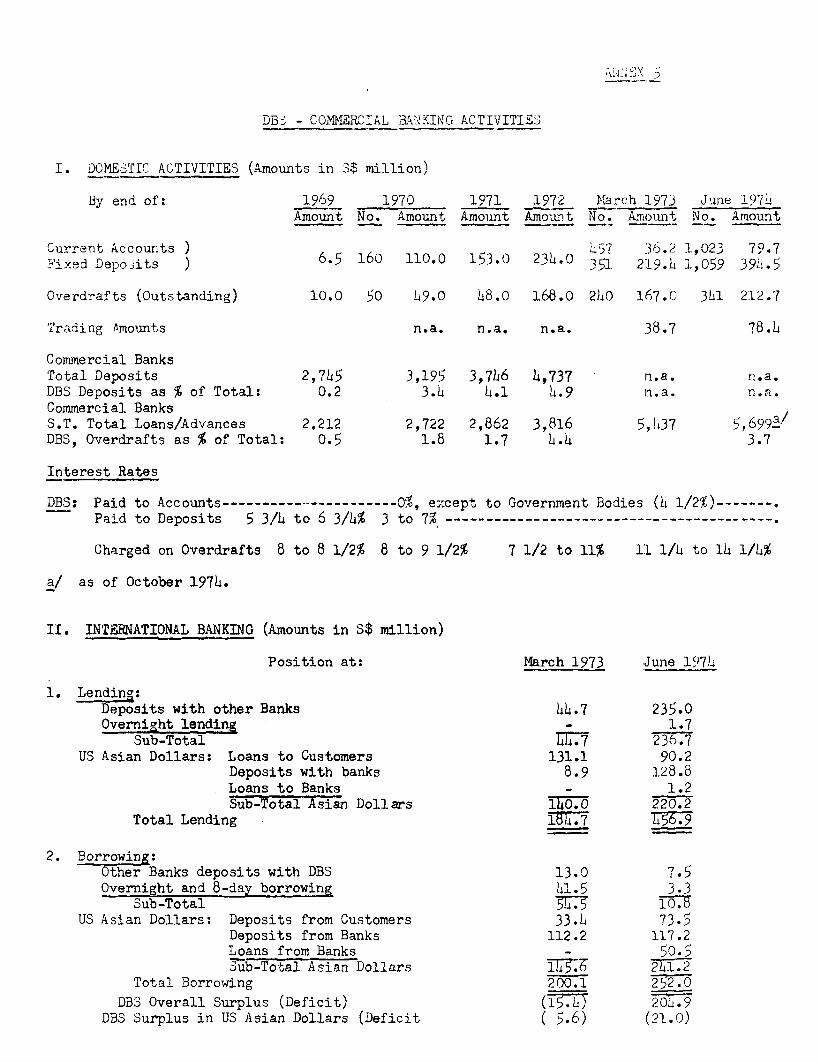
DB" - COMMERCIAL BANKING ACTIVITIES
I. DOMESTIC ACTIVITIES (Amounts in 3$ million)
By end of: 1969 1970 1971 1972 March 1973 Jrne 1971Amount No. Amount Amount Amount No. Amount No. Amount
Current Accounts ) 1557 36.2 1,023 79.7Fixed Depo:sits ) 6.5 160 110.0 153.0 23).0 351 219.b 1,059 39.5
Overdrafts (Outstanding) 10.0 50 L9.0 h8.0 168.0 240 167.0 341 212.7
Trading Amounts n.a. n.a. n.a. 38.7 78.4
Commercial BanksTotal Deposits 2,7h5 3,195 3,7h6 4,737 n.a. n.a.DBS Deposits as % of Total: 0.2 3.4 h.1 1b.9 n.a. n.a.Commercial BanksS.T. Total Loans/Advances 2.212 2,722 2,862 3,816 5,437 5,699DBS, Overdrafts as % of Total: 0.5 1.8 1.7 L.h 3.7
Interest Rates
DBS: Paid to Accounts --------------------- 0%, except to Government Bodies (h 1/2%)--------Paid to Deposits 5 3/h to 6 3/4% 3 to 7% ----------------------------------------
Charged on Overdrafts 8 to 8 1/2% 8 to 9 1/2% 7 1/2 to 11% 11 1/6 to l 1/4%
a/ as of October 1974.
II. INTERNATIONAL BANKING (Amounts in S$ million)
Position at: March 1973 June 197
1. Lending:Deposits with other Banks 44.7 235.0Overnight lending - 1.7
Sub-Total =7 236.7US Asian Dollars: Loans to Customers 131.1 90.2
Deposits with banks 8.9 128.8Loans to Banks - 1.2Sub-Total Asian Dollars 140.0 220.2
Total Lending 17 7-
2. Borrowing:Other Banks deposits with DBS 13.0 7.5Overnight and 8-day borrowing l.5 3.3
Sub-Total 55 10.5US Asian Dollars: Deposits from Customers 33.h 73.5
Deposits from Banks 112.2 117.2Loans from Banks - 50.5Sub-Total Asian Dollars l5.F 21.2
Total Borrowing 200.1 252.70
DBS Overall Surplus (Deficit) (15- .07Y.9DBS Surplus in US Asian Dollars (Deficit ( 5.6) (21.0)
DBS: SOURCES AND APPLICATIONS OF FUNDS (S$ million)FORECAST/ACTUAL
1969 1970 1971 1972 1973F A F A F A F A F A
SOURCES
Generated Surplus:
Interest on L.T. Loans 9.0 3.6 13.0 6.1 20.2 10.0 29.1 20.5 38.7 31.4Dividends - 0.2 - 0.3 - 0.6 0.4 1.1 1.6 1.8Interests on S.T. and Securities 7.4 2.5 6.2 4.7 5.3 6.2 7.3 13.5 9.4 20.3Interest on money at call 0.2 4.8 0.8 5.9 1.1 8.1 1.3 3.1 1.6 9.2Profit on Exchange - 0.2 - 0.9 - 2.7 - 2.9 - 4.1Other Income - 0., - 1.2 - 1.0 - 1.8 - 5.1
Less:
Interest on local loans 2.5 2.1 3.3 2.7 4.6 5.8 5.8 7.6 6.4 14.1Interest on foreign loans 0.1 - 2.9 0.2 9.0 1.5 16.2 5.3 24.0 7.6Interest on fixed deposits 2.0 1.5 2.9 6.1 4).2 9.9 5.9 17.3 7.5 32.6Operating Expenses 1. 1.7 1.5 2.2 2.7 4.8 2. 4.3 2.2 9.1Income Tax 0. 1.7 4.2 2.6 3.7 0.5 2.8 3.2 3.2 4.6Generated Surplus 10.1 70 0 3.9Loan Repayments 6.6 8.5 8.2 16.2 9.9 17.3 19.1 23.9 32.4 54.3Realization of Investments l.0* - 42.5* - - 2.6 - 7.8 - 4.4
Drawings on Local Loans 20.0 16.1 25.0 20.1 4o.0 62.0 25.0 39.5 20.0 241.1Drawings on Foreign Funds 2.0 - 4O.0 3.2 87.0 19.4 110.0 43.6 125.0 63.5Increase in deposits/accounts 32.0 466 18.0 65.7 25.0 47.4 32.0 300.8 32.0 103.8Total Sources i=T7 9 =13- 110. 1.3 15W- 191.1 .209 17.4 771.3
APPLICATIONS
Repayment of Local Loans - - 4.3 2.6 6.0 6.3 8.7 11.3 13.5 27.2Repayment of foreign funds - - - 0.2 0.1 4.7 9.6 15.0 6.6Investments in Fixes Assets/Properties - 11.1 - 14.0 - 9.0 - 32.9 - 30.9L.T. Loans Disbursermnts 52.0 22.7 90.0 58.0 106.0 82.8 120.0 186.0 130.0 168.0Equity Investments 17.0 15.2 21.0 8.1 24.0 16.2 20.0 11.2 21.0 32.5Increase in S.T. investments/Securities 1.0 (3.7) 1.5 (0.2) 2.5 7.9 3.5 18.0 3.5 22.0Increase in working capital advances 27.3 5.2 14.0 l.7 18.9 25.0 23.6 139.0 23.7 50.4Increase in deposits/money at call - 46.2 - (22.8) - 2.7 - 2. 4 - 152.8
Total Applications 97.3 9X.7 135 J-01 o 177, 150.0 7 1_5.7. 206.7 r1907TDividend Payments - - - - 3.0 - 3.0 - 3.0 3.0
Net cash inflow (outflow) 14.4 (0.8) 8.1 9.1 3.7 4.8 7.6 10.4 7.7 (22.4)Cash or near cash beginning of period 6.1 6.1 20.5 5.3 28.6 14.h 32.3 19.2 39.9 29.6Cash or near cash end of period 20.5 5.3 28.6 14.4 32.3 19.2 39.9 29.6 47.6 7.2
* Realization of short-term investments and securities inherited from EDB.

DBS: INCOME STATEMENTS (S$ million)
FOREAST/ACTLL
1969 1970 1971 1972 1973F A F A F A F A F A
Income:
Interest on L.T. Loans 9.0 3.6 13.0 6.2 20.2 10.0 29.1 20.5 38.7 31.4Interest on S.T. Investments 5.3 6.7 3.5 7.8 1.4 10.0 1.7 5.2 2.2 11.5Interest on S.T. loans/advances 2.3 0.5 3.5 2.8 5.0 4.3 6.9 11.3 8.8 17.9Dividend income - 0.2 - 0.3 - 0.6 0.4 1.1 1.6 1.8Other income 0.7 - 2.1 - 4. - 7.4 - 13.0166 17 20. 19.2 26.6 29.0 3 5.5 -13 77.
Expenses:
Administrative expenses 1.4 1.7 1.5 2.6 1.8 3.1 2.2 4.3 2.5 7.1Interest on L.T. Loans 2.5 2.1 3.3 2.7 4.6 5.8 5.8 7.6 6.4 13.3Interest on external/bonds 0.1 - 2.9 0.1 9.0 1.3 16.2 4.2 24.0 7.8Interest on deposits 2.0 1.5 2.9 6.1 4.2 10.0 5.9 17.3 7.5 32.6Other financial charges - - 0.5 1.1 0.3
Profit before tax/provisions 10.6 6.4 9.4 7.7 7.0 8.3 810 11.0 10.9 14.5Provisions for loans * (0.8) (1.0) (0.7) (2.2) (1.6)Provisions for investments * (-) (3.6) (2.2) (-0.1) (1.7)Profit before tax and provisions 10.6 6.4 9.4 7.7 7.0 8.3 8.0 11.0 10.9 14.5Income Tax after adjustments 4.2 4.4 3.7 0.8 2.8 2.0 3.2 4.4 4.4 4.5Profit after tax before provisions 6.4 2.0 _.7 6.9 4.2 6.3 4.8 6.6 6.5 10.0Profit after tax and provisions 1.2 2.3 3.4 .
Appropriations:
Reserves/Provisions * 2.3 1.5 2.6 5.8 3.1 4.7 3.2 h.5 3.4 6.8Dividends - - - - 3.0 - 3.0 - 3.0 3.0Retained earnings 4.1 0.5 3.1 1.1 (1.9) 1.6 (1.4) 2.1 0.1 0.2
Ratios: as $ of average total assets:
Total income 9.2 6.06 7.9 6.81 7.2 7.35 7.3 7.05 7.6 7.30Less: Financial charges 2.5 1.86 3.6 3.16 4.8 4.45 5.4 4.68 5.6 5.20- Gross spread 6.7 4.2 4.3 3.6 2.4 2.9 1.9 2.4 2.0 2.1Less: Administration Expenses 0.8 0.88 0.6 0.92 0.5 0.79 0.4 0.67 0.4 0.69- Profit before tax/provisions 5.9 3.3 3.7 2.7 1.9 2.1 1.5 1.7 1.6 1.4
Net profit after tax/provisionsas % of: average equity 6.2 1.2 5.2 2.2 3.7 3.2 4.2 h.1 5.5 5.9share capital 6,4 1.2 5.7 2.3 4.2 3.4 4.8 4.5 6.5 6.7DBS Share Market Value: Min/Mar 1.17/2.28 1.0/1.73 1.(6/1,37 1.2/E.20 2.63/11.20DBS Shares Turnover \.1 6.5 5.3 18.,0Average Tot,, 1 180.8 193.05 253.15 281.95 368.15 3911.45 519.1 645.55 673.1 1035.75Average equity (= net worth) 103.6 101.00 102.65 102.75 113.10 105.60 114.6 109.60 117.25 113.75
+: Provisions for loans and investments were not forecast as expenditures; thus actualprofits are before provisons.
DBS - INTEREST RATES AND CHARGES
Charged for: 1969 1570 1973 1974
Term Loans 7 to 9% 7 to 9 1/2% 7 3/8 to 10 1/2% 10 to 11 1/2%
Letters of Guarantee 1 1/2% 3/4 of 1% 1/8 to 3/ of 1% 1/8 of 1% to 1 1/2%
Underwriting Fee 2 1/2% 1 1/4%
Commitment Charge 3/h of 1%-----
Cost of DBS Resources: 1969 1970 1972 1973 197
Government Loans 4 - 5% 5 - 8% - 7 1/2% ------ 7 1/2 to 8%-----
Foreign Currency Loans 6 7/8% 7 - 7 3/4% 8 1/2% 6 - 7 1/2%(ADB) (IBRD) (Bond ) (US Exim Bank)
(KfW ) (Issue) ( ADB )
Fixed Deposits 5 3/4 - 6 3/h% 3 - 7% 5- 1/2% 5 1/2 - 7% 10 1/4 - 11%(3 months and above)

ANNEX 10
DBS: LONG-TERM EQUITY PORTFOLIO AND RETURN(S$ million)
1969 1970 1971 1972 1973 1974- - (June)
1. Total Equity Investment:
--Quoted Shares 11.3 15.3 14.o 9.9 12.2 12.6--Unquoted Shares 10.5 14.5 29.L 40.1 69.7 74.1--Total Portfolio at Cost 21.7 29.S 737.5 0. BT,. U.7
2. Net Additional Investment - 8.0 13.6 6.6 31.9 h.8
3. Dividends Received 0.2 0.3 0.6 1.1 1.8 8.5
b. Cumulative Value of Portfolio:
--Quoted Shares (Market) 13.5 12.1 12.2 41.3 26.8 22.8--Unquoted Shares (at Cost) 10.5 1h.5 29.4 4o.1 69.7 74.1--Less: _Specific Provisions (1.0) (2.8) (1.1) (1.3)
--Total Portfolio Value 2t.O 26.7 40.6 75.5 9.7 9-.7
5. Increase in Portfolio Values - 2.6 14.0 38.0 16.8 0.2
6. Shares Sold (in par value) - - 0.19 4.20 0.18 -
7. Gain on Shares:
--Profit on Shares Sold - - 0.07 2.00 0.22 ---Less: Written off
Quoted Shares - - (11 - 0.18) -7.1 Net ain (Loss) - - 1.O7 2.00 0.04 -
--Less: Written offUnquoted Shares - - (100) (0.89) (1.13) -
7.2 Actual Net Gain (Loss) - - (2.07) 1.11 1.09 -
8. Portfolio Rollover, % 0 0 0.4 8.4 0.2 -(6/1)
9. Actual Return on Portfolio, % 0.9 .1.0 (3.) 4.4 0.9 9.8(3 + 7.2/1)
10. Possible Return on Portfolio, % 0.9 (17.1) (0.2) 69.0 (16.2) 4.5(3 + 7.1 + 5 - 2/1)

D. B. S.: ARREARS AS OF SEPTEMBER 30(Amounts in S$000)
No. of Loans Principal/Interests in Arrears Outstanding of Loans in ArrearsTotal Amount 7 Portfolio Amount Portfolio
1969s Up to 3 mont4s 2 17 95 4 0.1 1,946 23 2.93-6 months - - - - -6-12 months- 7 58 1,075 42 1.6 3,534 43 5.2Over 1 year' 3 25 1 389 -. 2.1 2,830 34 h.2
72 10 10___- 8 310 100 12.
1970s Up to 3 months- 5 33 677 20 0.6 4,938 41 4.53-6 months- - - - - - - -6-12 months 5 33 396 12 0.4 3,688 30 3.4Over 1 year" _3 2,352 68 2.1 3 29 3.3
100 "45 . -0 3.1 100- 11.2
1971s Up to 3 months 6 38 457 8 0.3 8,986 53 5.13-6-months- 1 6 10 ... 102 1 0.16-12 months 5 31 3,198 5 1.8 5,647 34 3.2Over 1 year 4 25 2 162 37 1.2 21082 2 1.2
17 10o tL 100 1tt 7 mO_
1972s' Up to 3 months 5 21 1,028 11 0.3 9,022 34 2.63-6 months 2 8 95 1 ... 634 2 0.16-12 months 8 33 2,597 28 0.8 8,465 32 2.5Over 1 year. 42 60 1.6 2.5
2 100, , 4 100 2.7 2& 39100
1973: Up to-3 months 5 36 224 ... 1,767 23 0.43-6 months 2 14 132. 3 ... 739 10 0.16-12 months 1 7 279 6 ... 1,021 13 0.2Over 1 year 6 3 813 86 0.8 4 067 54 0.9
100 tt 100 1.0 794 100 0
197hs Up to 3 months- 13 48 3,373 42 0.7 13,143 54 2.7.3-6 months,. 2 7 62 1 ... 518 2 06-12 months 4 15 2,589 33 0.5 8,595 36 1.8Over 1 year 8 . 1 1937 2 0.4 8 0.4
-00 - ' -0 11 -
DBS - FINANCIAL ASSISTANCE TO SNALL PROJECTS
LIGHT INDUSTRIES LOANS (Amounts in S$ million) DBS SUBSIDIARIESSept. 1968 - Dec. 1969 1970 1971 Total DBS Finance SFDL
No. Amount No. Amount No. Amount No. Amount No. Amount No. Amount--------Cumulative--------
Net Approvals 47 1.82 13 0.39 12 0.40 72 2.61 )) n.a. 17.9 119 n.a.
Commitments 47 1.82 13 0.39 12 0.40 72 2.61 )
Disbursements 1.82 0.39 O.L.0 2.61 16.63 n.a.
Outstanding as of June 1974: 12.89 20.5
DS - CHARACTERISTICS OF PROJECTS VANCED OVI 07 DRD 1NN 658-11(A~onta in S$ 000)
A - Ytojeot DatdDu iffaPia Io Total CÅrt Dwncx IBRD ~gancinrloA - Procect Data Product TY Foricas Actal Overrun k^ . on . % Cost ttual 9_errvzM c~ths
Cedar Garntes Garnents t 3,860 3,860 - 1,200 31.6 600 15.8 n.a. . ahtingapore Rylon Corporation Yarn/Clip* N 10,700 12,523 17.0 5,000 40.0 3,045 24.3 8/1972 8South Grand Textiles Tarn/Cloth 2E 22,100 29,500 33.5 7,700 26.1 4,871 16.5 7/1970 2Pioneer Industries A.ppre 0 ,2. 0 2.0 2a.k ... ZJ ZL0 .. k"É .2.0L2 8/1970 4Total Textiles and Apparel - 44,860 58,383 30.1 16,400 28.1 8,929 15.3 ;(Average)Jurong Brick Work& Bricka E 1,950 2,510 28.7 1,200 47.8 483 19.2 9/1972 3SnAavore SGS Translatorg N 42L300 - 47.377 1 2..0 lå .0 . 4/1973 l.u0
TOTAL 4197ný~~m uluu å_ (Avtragp)
1972 Toal Sale 179937 Imported Inppt1Project Data (Continued) Actual Act./ eca A Actual c. F castA Actual /Foalecast
Cedar Garments 11,207 n.a. 13,723 n.a. 11,207 n.a. 12,763 n.a. 7,486 98.8 9,518 9.7Singapore Nylon Corporation 3,136 72.4 13,253 104.4 1,224 40.4 8,266 92.9 3,099 11,145aote Grand Textilea 18,656 116.6 23,100 144.4 15,355 216.0 22,308 309.8 12,383 74.7 15,993 96.5Plopfur Industrie _..L4 iLI 6.650 JLI _.439 3933 -,,l A 5.330 6.461Total Textiles and Apparel 38,548 n.a. 56,726 n.a. 32,423 6.a. 47,950 n.a. 28,298 n.a. 43.117 n.&.Jurong Brick Workg 3,400, 136.0 4,400 176,0 .97 248.3 721 360.5
Singapore SGS 15.10 _n.. 35.700 -. aBo Ilalt -Haa. 23,Jfl .Aa 112 7TOTAL. 11.07 n.* 968626*.5a1. LUL.i, ~742.0
-"Plon~ opent Actual/erecent. rftcen 'md12 197 1972 1973 .22 9. 1973
Prolect Data (Continued) A.A, re~ Actal Act,/lorat ~aUle i Dsti eCedar Gazmente - .1 199 180.0 968 144.5 Ua. na. n.a.a. 3,026 1,869Singapore Nylon Corporatior 265 226.5 288 246.2 .4. 93 a 108 ~ 610 * 2206South Grand Textilen 997 n.a. 932 n.a. 93 90 160 180 2,905 11,883Pioneor Industries ... 21 .L.. .JA .J*.B . .. S . h. LJ *Total Textilen and Apparel ,954 .a. . 2,776 n.a. 7,900 1,806Jurong Brick Worka 270 111.1 170 111.1 97 . 98 - 856 1,344Singapore BG5 1.785 _43Q _6-0 RLg BAU B. .30
TOME Ja&M .JAa -du£ .J. n 2.
DBS - FINANCIAL, RATIOS OF PRMJCT5 ~8A D0 OUTGF IBRD LO 658-01
Incone/Aver. Asset. Znoe/Aver. EquAty Debt/Esulty Ärrcowp AyrEpt iroertslegB-Prolect RatIn 97 1973 1972 JÎZ2 2 1972-1973 im 1973<(.) <(1)Cedar Garvienta neg. 4.2 neg. 10.7 1.66 1.88 0.66 0.87 - 66.8 69.4Singapore Nylon Corporation 0.1 9.5 0.2 26.6 1.80 1.82 0.74 0.86 - 98.8 84.1South Grand Textileg 0.6 22.7 6.1 40.0 1.49 0.51 1.18 1.77 - 66.4 69.2Pioneer Industrie 1.2 1.3 45 *.4 1.33 0.81 1 0_2 -L 3
Average Textile@/Apparel 0.5 9.4 2.0 19.9 1.57 1.25 0.90 1.15 - 73.4 76.0Jurong Brick Worke 21.0 25.9 35.2 43.4 0.69 0.66 1.51 1.26 - 14.6 16.4Singapore SGS 7.4 Lqw 3 .1 2. 0LU 74.4Average over All 11d2 JU 260 U Id-21 9 L" zu
Cport8/Ses. Valuc Added/Salej Caital/Dutoot Ratia CapitalWorker Increse in 1973 over 1972 of-Profect Ratio. (Continued) 1Z3 1222 1973 § Esports imorts Value AddedCede (a-t. <M <7. M<0000>O (11) M1 M7. (MCedar Grment 100.0 93.0 27.0 13.6 0.61 0.28 3.78 22.4 13.9 27.1 (38.2)Singapore Nylon Corporation 39.0 62.4 19.5 16.6 3.90 1.23 43.48 322.6 575.3 259.6 261.3South Grand Textilen 83.4 96.6 15.6 51.4 0.80 0.49 18.37 23.8 43.4 29.2 309.1Pioneer duoeir/. 8A.0 69.4 ppa rz 1-40 L-82 IWI _IU -w 21.2 360A-~Sel of T..tilta/Appar.I 84.1 94.5 20.5 31.4 1.68 0.95 28.41 47.2 47.9 5. 2.JSrong rck Work, 25.2 30.5 0.62 0.45 (-) 29.4 - 45.1 57.0SI pore 90.0 26.7 2.6 0.61 24.80 136.4 136.4 14.0 126.6Average over All .7 na 22,4 3 269. aä.
*: Estimate