Embed Size (px)
Citation preview

Analytical study on certain drugs which treat brain
agency and deterioration.

This thesis consists of four parts:- PartI:Stability indicating methods for the
determination of Pyritinol dihydrochloride. Part II: Stability indicating colorimetric method for
the determination of piracetam. Part III : Stability indicating colorimetric
method for the determination of meclophenoxate hydrochloride.
Part IV :Stability indicating methods for the determination of vincamine in presence of its degradation product.

Part I :Stability indicating methods for the
determination of Pyritinol dihydrochloride.
This part includes a general introduction about the chemistry of pyritinol dihydrochloride,mode of action.
A review on the reported methods used for pyritinol dihydrochloride quantitative determination.

Section(A): Determination of pyritinol
dihydrochloride in presence of its precursor and its degradation
product by derivative spectrophotometry.
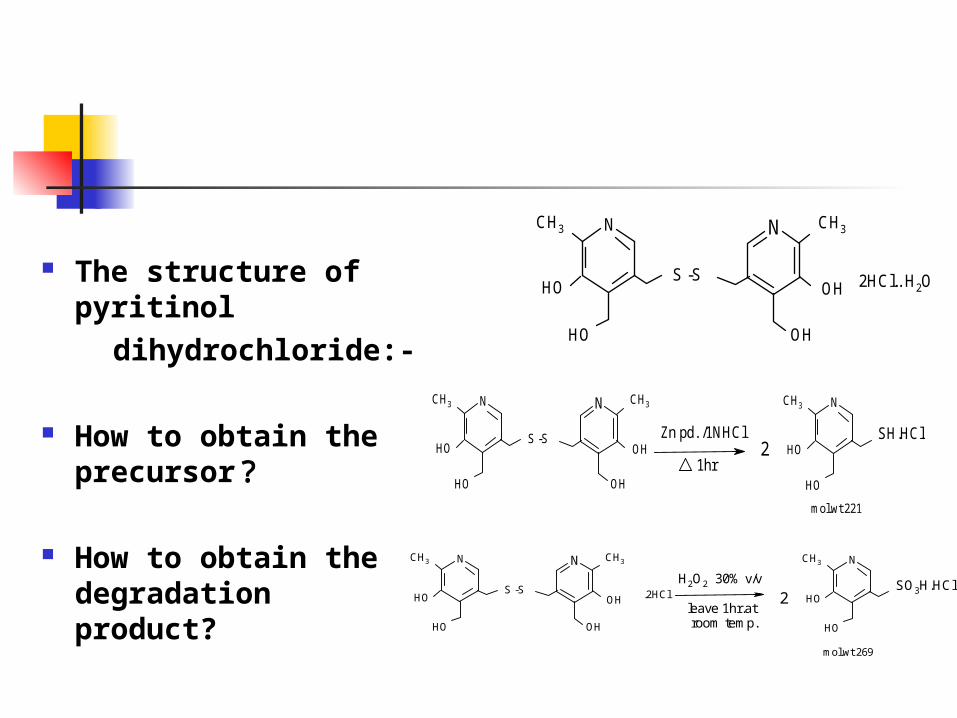
The structure of pyritinol
dihydrochloride:-
How to obtain the precursor ?
How to obtain the degradation product?
N NCH3
HOS -S
CH3
OH
OH
2HCl.. H2O
HO
N N NCH3
HOS -S
CH3
OH
OHHO
CH3
HO
HO
Zn pd. /1NHCl
1hr2
SH.HCl
mol.wt 221
N N NCH3
HOS -S
CH3
.2HCl
OHHO
CH3
HO
HO
H2O2 30% v/v
leave 1hr.at room temp.
2SO3H.HCl
OH
mol.wt 269

I.A.1First derivative spectrophotometric
determination of pyritinol dihydrochloride in presence of its
precursor and its degradation product.

Figure ( 1 ): Absorption spectra of Pyritinol dihydrochloride 20 µg. ml-1 ,)———(
precursor 14 µg. ml-1 (— — — — ) and degradation product 6 µg. ml-1 (--------- ) Using 0.1N hydrochloric acid as a solvent
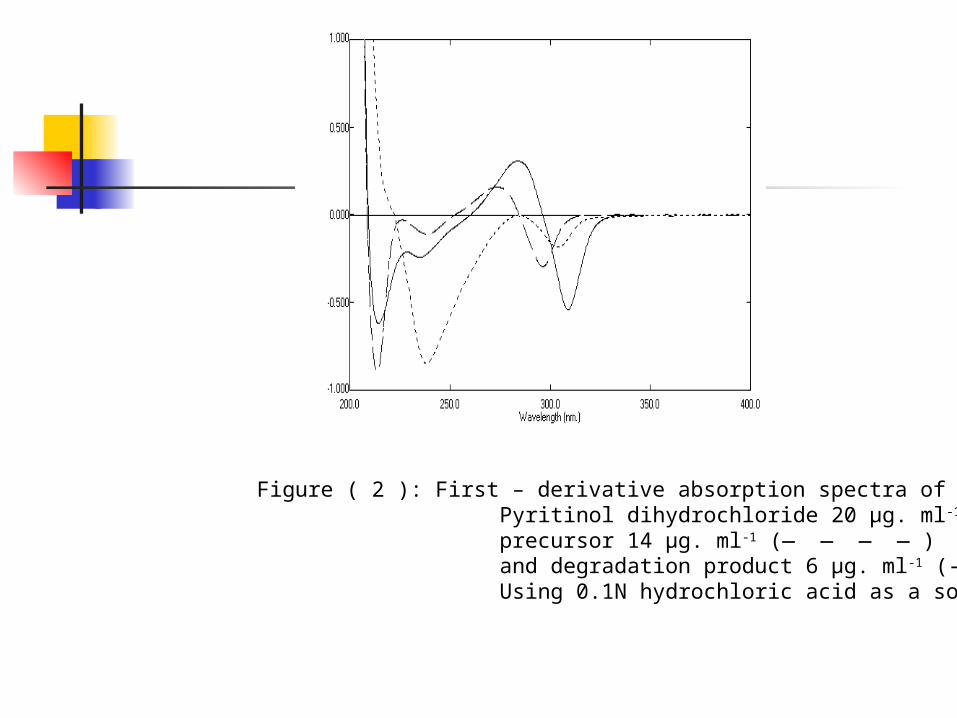
Figure ( 2 ): First – derivative absorption spectra of Pyritinol dihydrochloride 20 µg. ml-1 (———), precursor 14 µg. ml-1 (— — — — ) and degradation product 6 µg. ml-1 (---------- ). Using 0.1N hydrochloric acid as a solvent

Figure ( 3 ): First – derivative absorption spectra of 6-22 µg. ml-1 Pyritinol dihydrochloride

0
0.05
0.1
0.15
0.2
0.25
0.3
0.35
0 5 10 15 20 25
Concenteration g.ml-1
Pe
ak
am
plit
ud
e
Figure (4): Linearity of the peak amplitude of the first derivative at 284.4nm to the corresponding concentration of pyritinoldihydrochloride.
I.A.2.Derivative ratio zero crossing method for the determination of pyritinol dihydrochloride in presence of its
precursor and its degradation product .
A
) pyritinol(/deg.prod.(
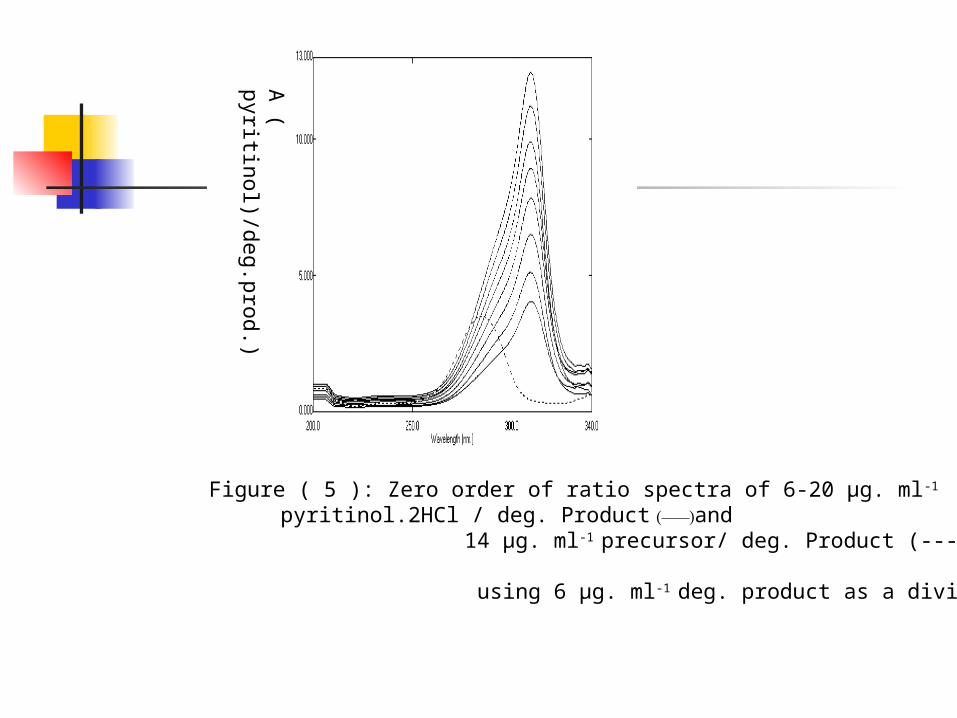
Figure ( 5 ): Zero order of ratio spectra of 6-20 µg. ml-1
pyritinol.2HCl / deg. Product (———)and 14 µg. ml-1 precursor/ deg. Product (-------) using 6 µg. ml-1 deg. product as a divisor.
dA)pyritinol.2H
Cl/ deg. prod.(/dλ
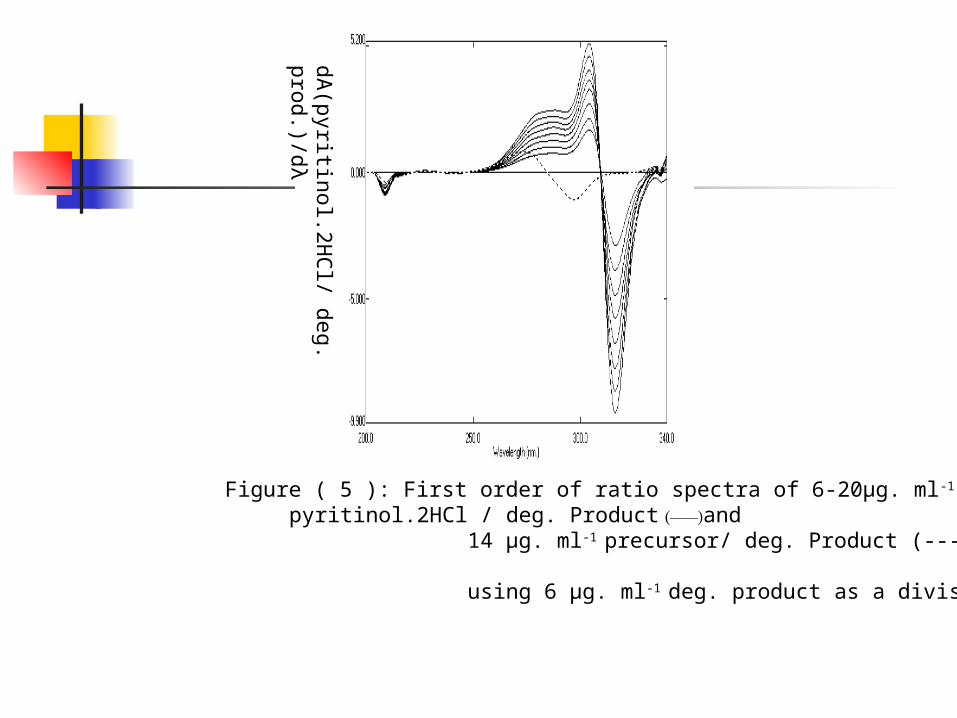
Figure ( 5 ): First order of ratio spectra of 6-20µg. ml-1
pyritinol.2HCl / deg. Product (———)and 14 µg. ml-1 precursor/ deg. Product (-------) using 6 µg. ml-1 deg. product as a divisor.
-12
-10
-8
-6
-4
-2
0
0 5 10 15 20 25
Concenteration g.ml-1
Pea
k am
pli
tud
e
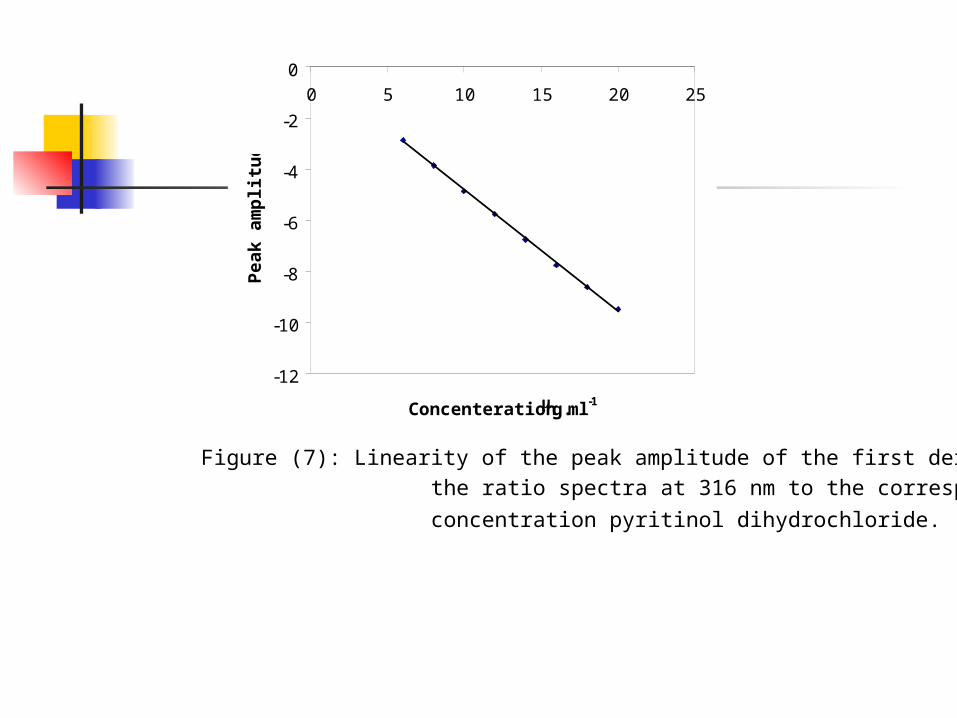
Figure (7): Linearity of the peak amplitude of the first derivative of
the ratio spectra at 316 nm to the corresponding
concentration pyritinol dihydrochloride.
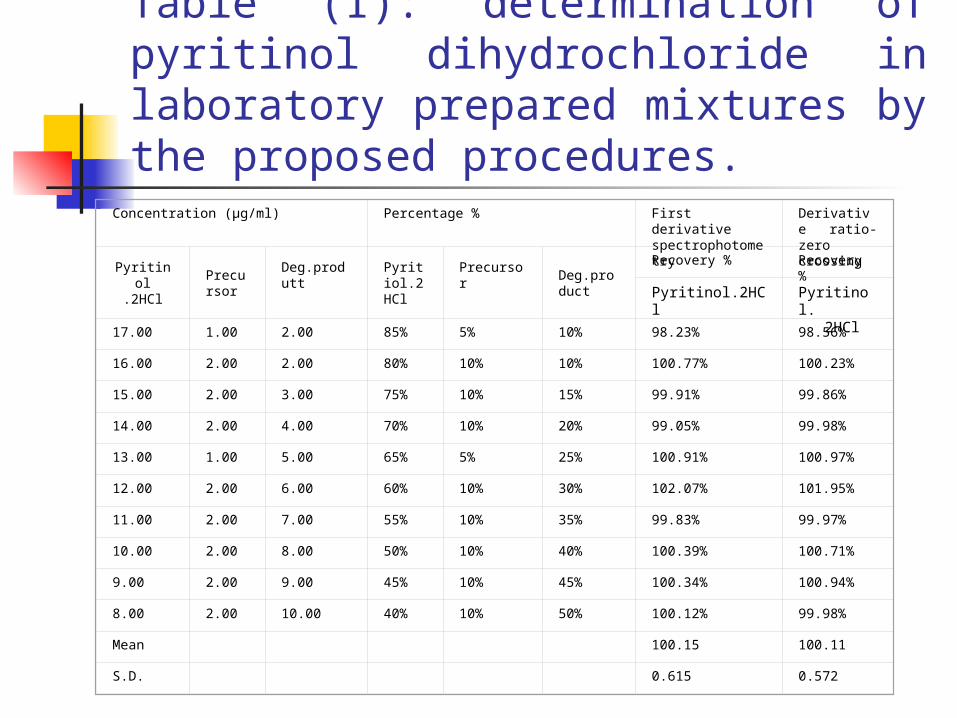
Table (I): determination of pyritinol dihydrochloride in laboratory prepared mixtures by the proposed procedures.
Concentration (µg/ml) Percentage % First derivative spectrophotometry
Derivative ratio- zero crossing
Pyritinol.2HCl
Precursor
Deg.produtt Pyritiol.2HCl
Precursor Deg.product
Recovery % Recovery %
Pyritinol.2HCl Pyritinol. 2HCl
17.00 1.00 2.00 85% 5% 10% 98.23% 98.56%
16.00 2.00 2.00 80% 10% 10% 100.77% 100.23%
15.00 2.00 3.00 75% 10% 15% 99.91% 99.86%
14.00 2.00 4.00 70% 10% 20% 99.05% 99.98%
13.00 1.00 5.00 65% 5% 25% 100.91% 100.97%
12.00 2.00 6.00 60% 10% 30% 102.07% 101.95%
11.00 2.00 7.00 55% 10% 35% 99.83% 99.97%
10.00 2.00 8.00 50% 10% 40% 100.39% 100.71%
9.00 2.00 9.00 45% 10% 45% 100.34% 100.94%
8.00 2.00 10.00 40% 10% 50% 100.12% 99.98%
Mean 100.15 100.11
S.D. 0.615 0.572
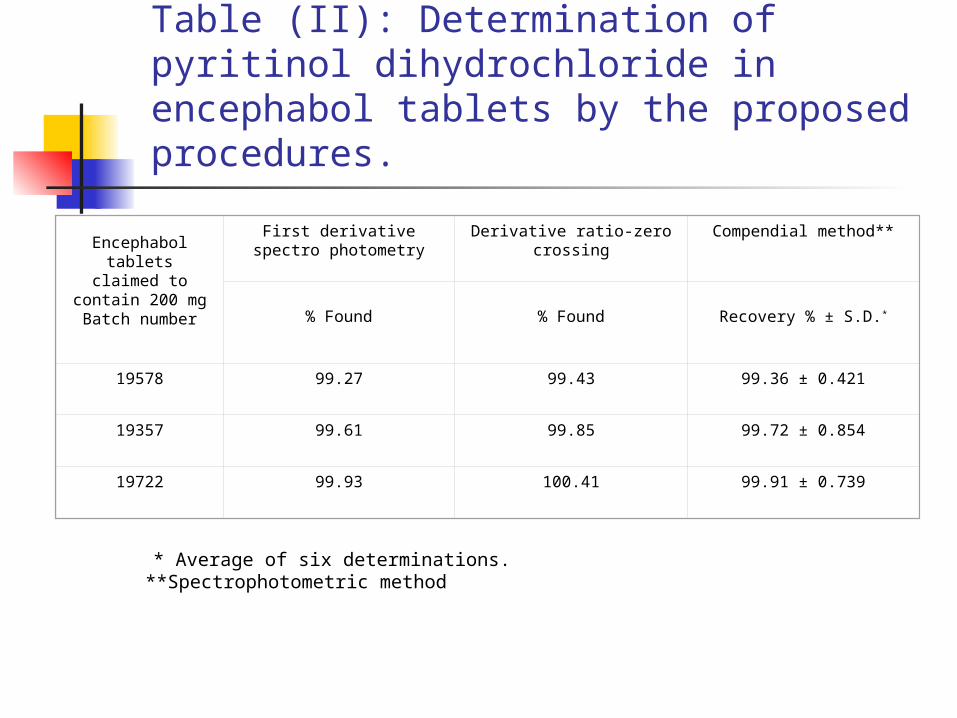
Table (II): Determination of pyritinol dihydrochloride in encephabol tablets by the proposed procedures.
* Average of six determinations. **Spectrophotometric method
Encephabol tablets claimed to contain 200 mgBatch number
First derivative spectro photometry
Derivative ratio-zero crossing
Compendial method**
% Found
% Found
Recovery % ± S.D.*
19578 99.27 99.43 99.36 ± 0.421
19357 99.61 99.85 99.72 ± 0.854
19722 99.93 100.41 99.91 ± 0.739
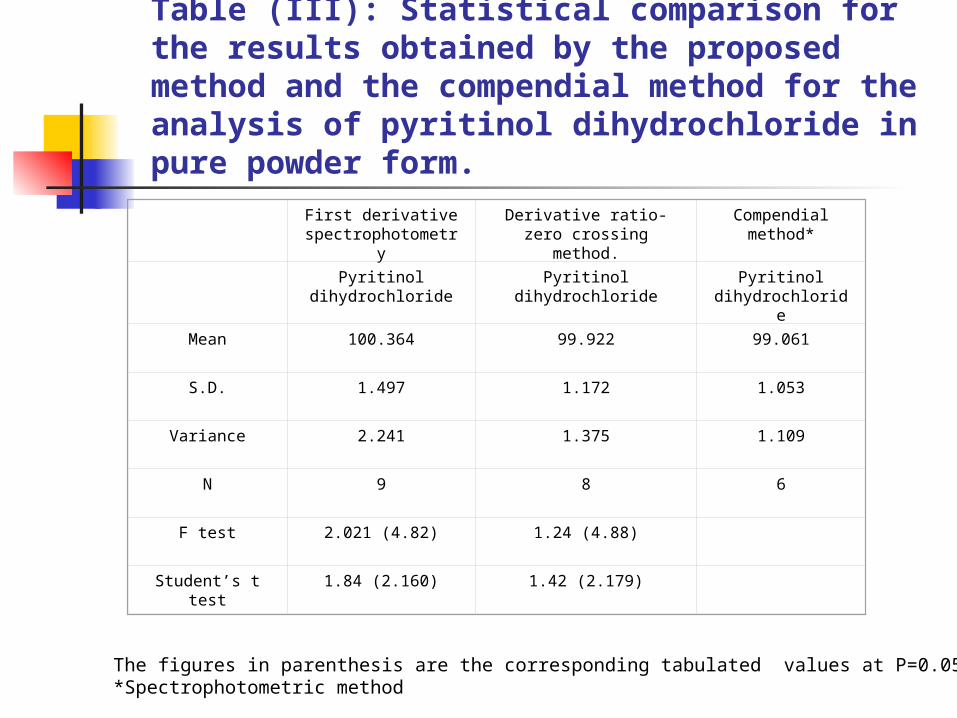
Table (III): Statistical comparison for the results obtained by the proposed method and the compendial method for the analysis of pyritinol dihydrochloride in pure powder form.
The figures in parenthesis are the corresponding tabulated values at P=0.05.*Spectrophotometric method
First derivative spectrophotometry
Derivative ratio- zero crossing method.
Compendial method*
Pyritinol dihydrochloride
Pyritinol dihydrochloride Pyritinoldihydrochloride
Mean 100.364 99.922 99.061
S.D. 1.497 1.172 1.053
Variance 2.241 1.375 1.109
N 9 8 6
F test 2.021 (4.82) 1.24 (4.88)
Student’s t test 1.84 (2.160) 1.42 (2.179)
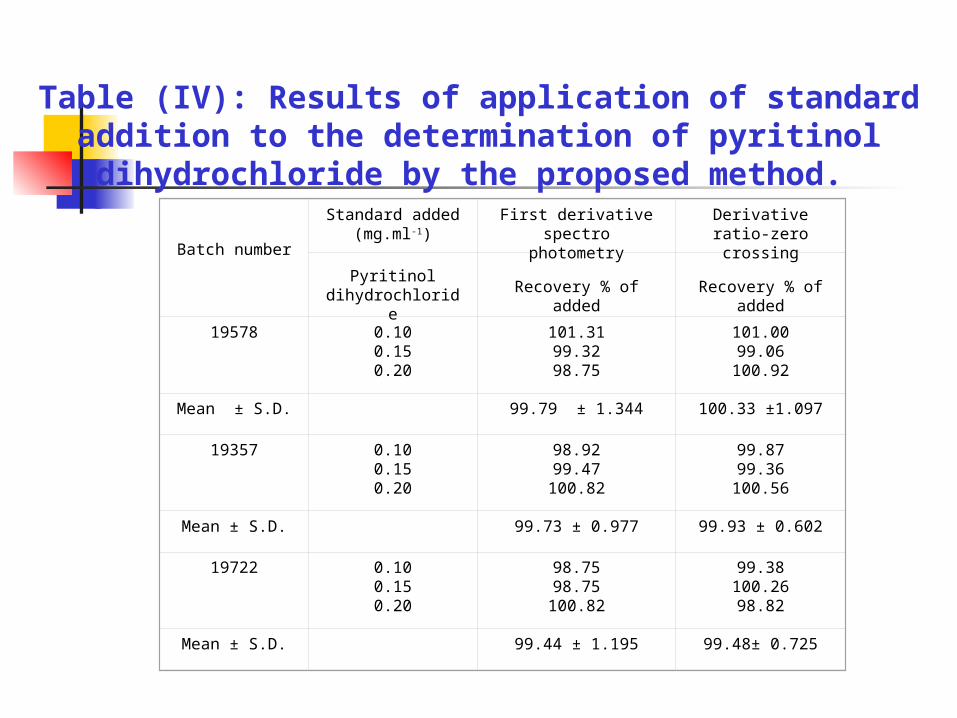
Table (IV): Results of application of standard addition to the determination of pyritinol dihydrochloride by the proposed
method.
Batch number
Standard added(mg.ml-1)
First derivative spectro photometry
Derivative ratio-zero crossing
Pyritinol dihydrochloride
Recovery % of added
Recovery % of
added 19578 0.10
0.150.20
101.3199.3298.75
101.0099.06
100.92
Mean ± S.D. 99.79 ± 1.344 100.33 ±1.097
19357 0.100.150.20
98.9299.47
100.82
99.8799.36
100.56
Mean ± S.D. 99.73 ± 0.977 99.93 ± 0.602
19722 0.100.150.20
98.7598.75
100.82
99.38100.2698.82
Mean ± S.D. 99.44 ± 1.195 99.48± 0.725
Section (B): Determination of pyritinol dihydrochloride in presence of its precursor and its degradation product by
densitometric method.
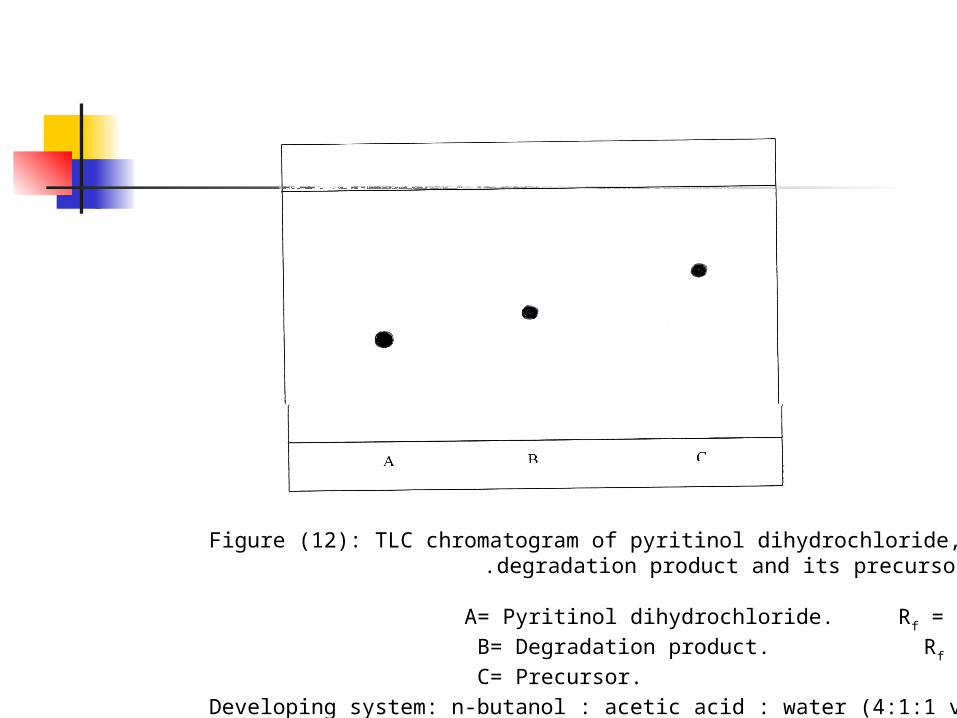
Figure (12): TLC chromatogram of pyritinol dihydrochloride, its degradation product and its precursor .
A= Pyritinol dihydrochloride. Rf = 0.4
B= Degradation product. Rf = 0.5
C= Precursor. Rf = 0.66
Developing system: n-butanol : acetic acid : water (4:1:1 v/v/v).
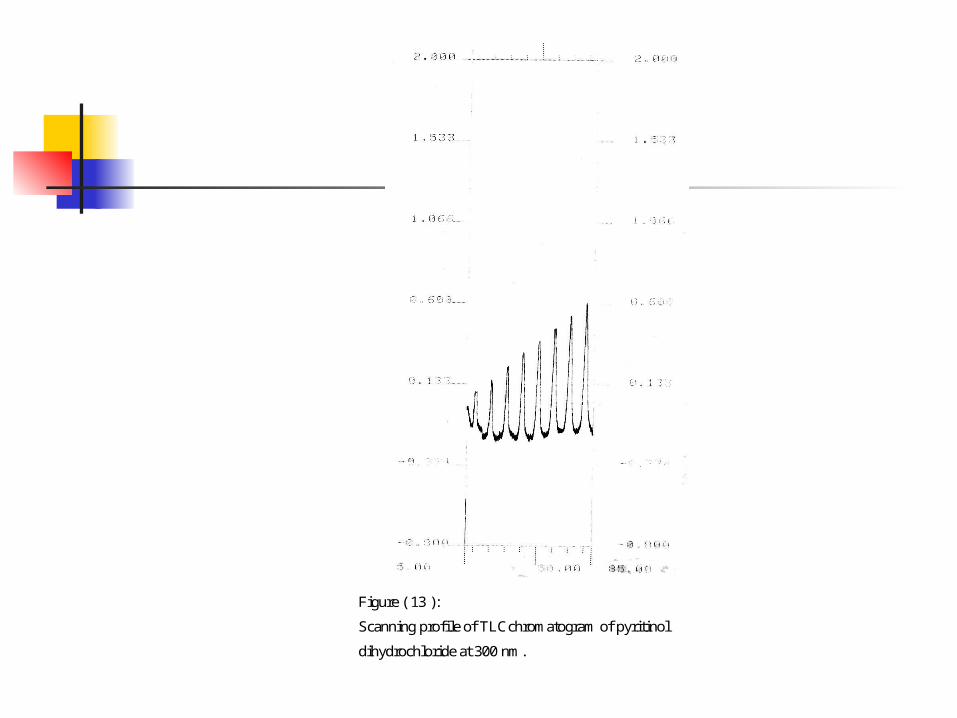
Figure ) 13 (:
Scanning profile of TLCchromatogram of pyritinol
dihydrochloride at 300 nm.
0
1
2
3
4
5
6
7
8
0 5 10 15 20
Concentration g.spot-1
Inte
gra
ted
pe
ak
are
a
( x
10
-4)
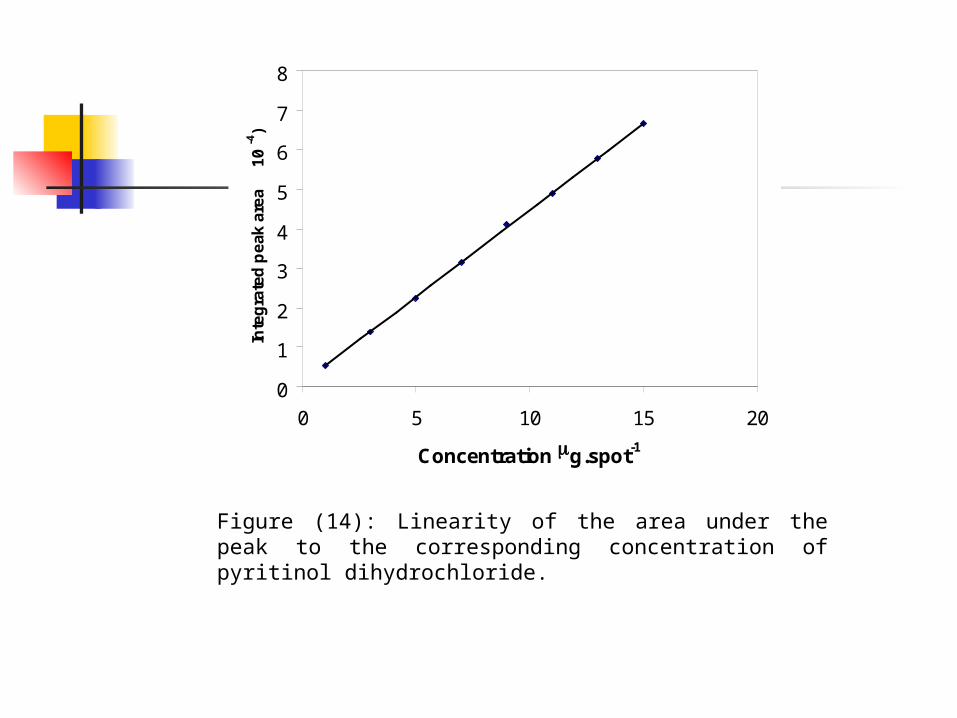
Figure (14): Linearity of the area under the peak to the corresponding concentration of pyritinol dihydrochloride.
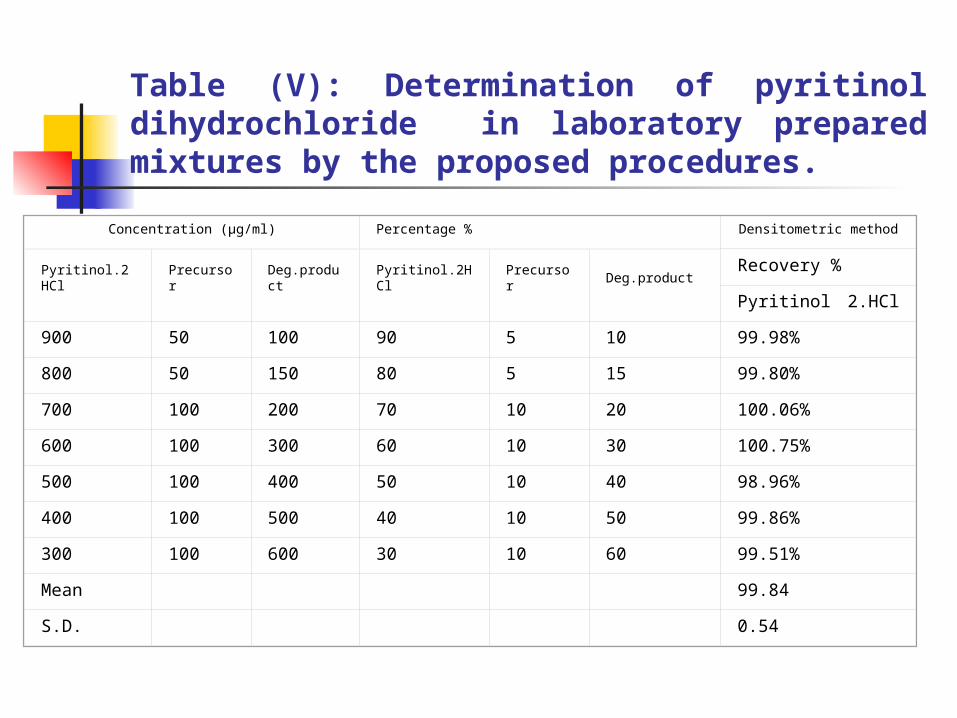
Table (V): Determination of pyritinol dihydrochloride in laboratory prepared mixtures by the proposed procedures.
Concentration (µg/ml) Percentage % Densitometric method
Pyritinol.2HCl Precursor Deg.product Pyritinol.2HCl Precursor Deg.productRecovery %
Pyritinol 2.HCl
900 50 100 90 5 10 99.98%
800 50 150 80 5 15 99.80%
700 100 200 70 10 20 100.06%
600 100 300 60 10 30 100.75%
500 100 400 50 10 40 98.96%
400 100 500 40 10 50 99.86%
300 100 600 30 10 60 99.51%
Mean 99.84
S.D. 0.54
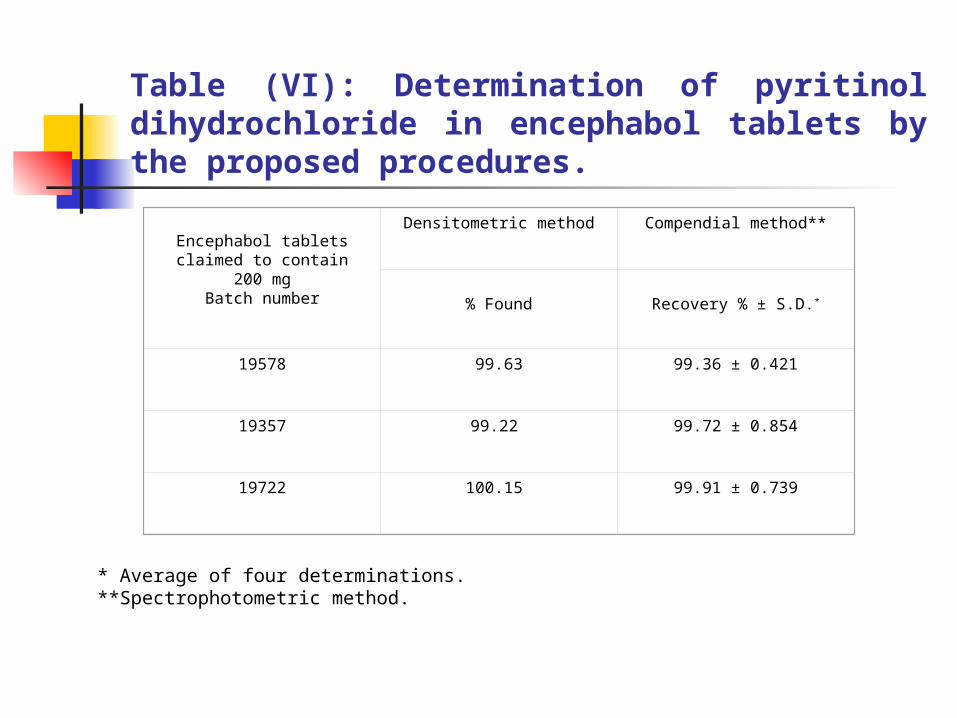
Table (VI): Determination of pyritinol dihydrochloride in encephabol tablets by the proposed procedures.
* Average of four determinations. **Spectrophotometric method.
Encephabol tablets claimed to contain 200 mg
Batch number
Densitometric method Compendial method**
% Found
Recovery % ± S.D.*
19578 99.63 99.36 ± 0.421
19357 99.22 99.72 ± 0.854
19722 100.15 99.91 ± 0.739
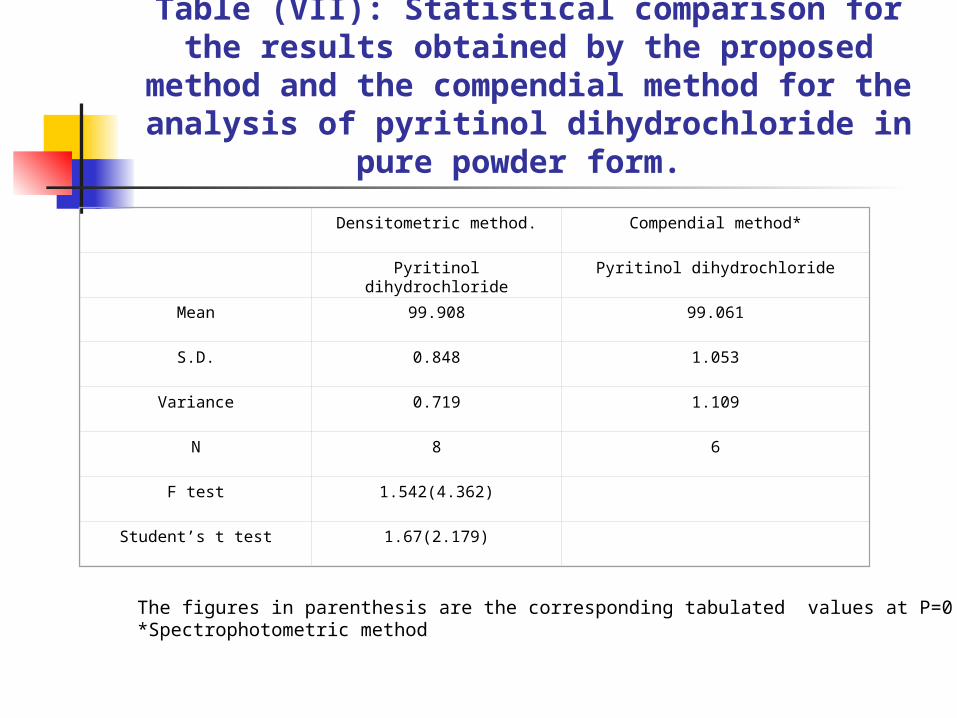
Table (VII): Statistical comparison for the results obtained by the proposed method
and the compendial method for the analysis of pyritinol dihydrochloride in pure powder
form.
The figures in parenthesis are the corresponding tabulated values at P=0.05 (36).*Spectrophotometric method
Densitometric method. Compendial method*
Pyritinol dihydrochloride Pyritinol dihydrochloride
Mean 99.908 99.061
S.D. 0.848 1.053
Variance 0.719 1.109
N 8 6
F test 1.542(4.362)
Student’s t test 1.67(2.179)

Table (VIII): Results of application of standard addition to the determination of pyritinol dihydrochloride by the proposed method.
Batch number
Standard added(mg.ml-1)
Densitometric method
Pyritinol dihydrochloride
Recovery % of added
19578 1.001.502.00
99.51100.3398.79
Mean ± S.D. 99.54± 0.770
19357 1.001.502.00
100.6299.4799.31
Mean ± S.D. 99.80 ± 0.714
19722 1.001.502.00
99.32100.6999.03
Mean ± S.D. 99.68 ± 0.886

Table (IX) : Assay parameters and method validation
* RSD%a , RSD%b the intraday, interday respectively (n=5) relative standard deviation of concentrations ( 12- 14µg/ml) for first derivative and derivative methods, and concentrations ( 7-9µg/spot) for densitometric method.
Parameter First Derivative spectrophotometery
Derivative ratio – zero crossing
Densitometric method
Pyritinol dihydrochloride
Pyritinol dihydrochloride
Pyritinol dihydrochloride
Range (µg.ml-1) 6-22 6-20 1-15 (µg.spot-1)
Slope 0.0143 -0.4751 0.439
Intercept 0.0082 -0.071 0.0844
Mean 100.364 99.922 99.908
S.D. 1.497 1.172 0.848
Variance 2.241 1.375 0.719
Coff. of variation 1.491 1.173 0.848
Correl. Coef.(r) 0.9994 0.9995 0.9998
* RSD%a 0.128- 0.203 0.132 – 0.197 0.378 –0.521
*RSD %b 0.136 –0.184 0.141 –0.175 0.554 –0.673
Section (C): Oxidation – reduction titrimetric method for the determination of pyritinol dihydrochloride in presence of its
degradation product.
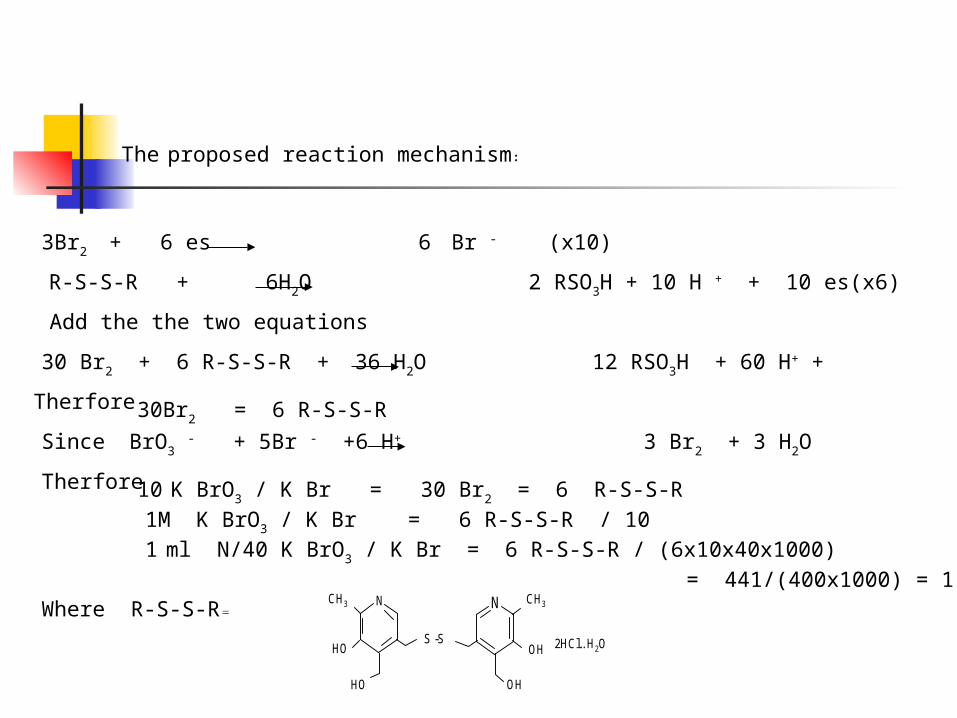
The proposed reaction mechanism :
3Br2 + 6 es 6 Br - (x10)
R-S-S-R + 6H2O 2 RSO3H + 10 H + + 10 es(x6)
Add the the two equations
60 Br -30 Br2 + 6 R-S-S-R + 36 H2O 12 RSO3H + 60 H+ +
Therfore 30Br2 = 6 R-S-S-R
Since BrO3 - + 5Br - +6 H+ 3 Br2 + 3 H2O
Therfore 10 K BrO3 / K Br = 30 Br2 = 6 R-S-S-R
1M K BrO3 / K Br = 6 R-S-S-R / 10
1 ml N/40 K BrO3 / K Br = 6 R-S-S-R / (6x10x40x1000)
= 441/(400x1000) = 1.1025 mg
Where R-S-S-R =
N NCH3
HOS -S
CH3
OH
OH
2HCl.. H2O
HO

Table (XI) : Determination of pyritinol dihydrochloride in laboratory prepared mixtures by the proposed method .
Weight (mg) Percentage Titrimetricmethod
Pyritinol dihydrochlorid
e
Degradation product
Pyritinol dihydrochlorid
e
Degradation product
Recovery %
Pyritinol dihydrochloride
15 5 75% 25% 101.04
10 10 50% 50% 100.12
5 15 25% 75% 101.79
Mean 101.13
S.D. 0.740
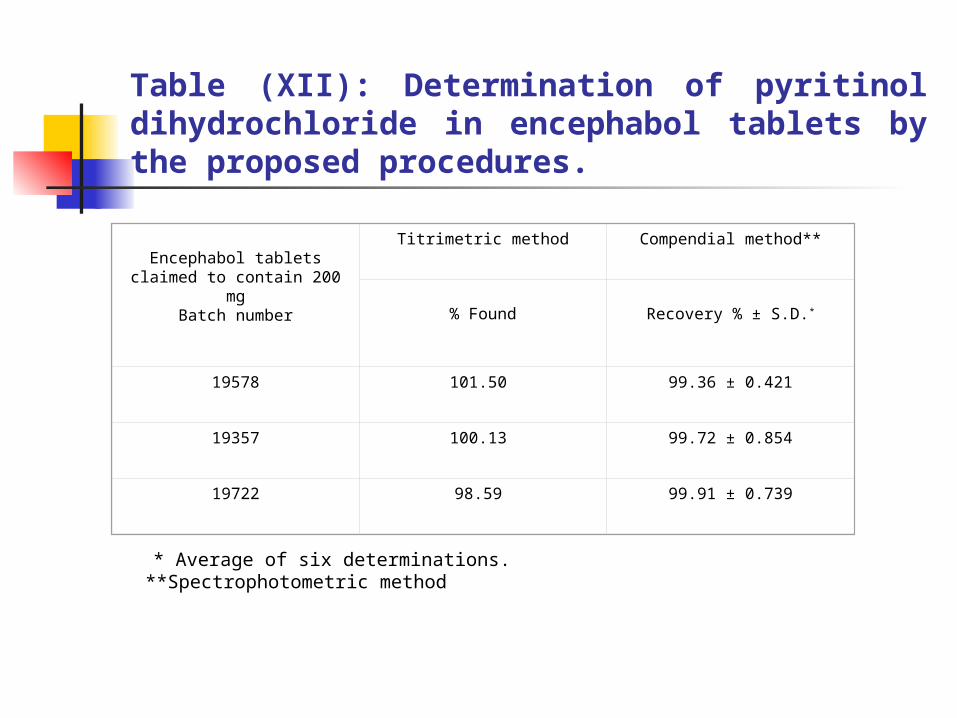
Table (XII): Determination of pyritinol dihydrochloride in encephabol tablets by the proposed procedures.
* Average of six determinations. **Spectrophotometric method
Encephabol tablets claimed to contain 200 mgBatch number
Titrimetric method Compendial method**
% Found
Recovery % ± S.D.*
19578 101.50 99.36 ± 0.421
19357 100.13 99.72 ± 0.854
19722 98.59 99.91 ± 0.739
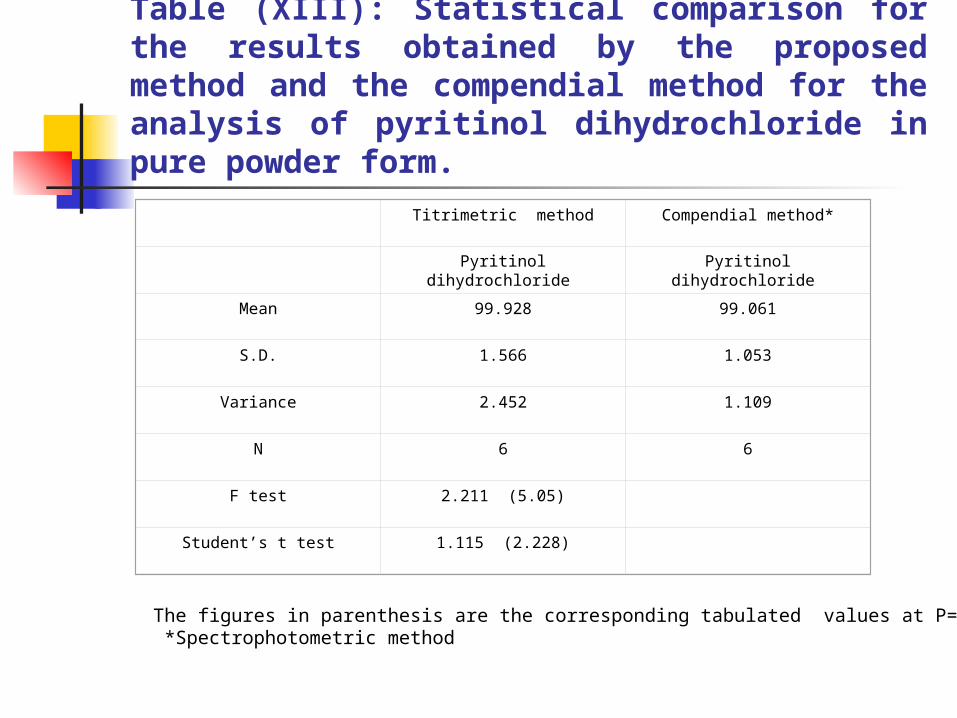
Table (XIII): Statistical comparison for the results obtained by the proposed method and the compendial method for the analysis of pyritinol dihydrochloride in pure powder form.
The figures in parenthesis are the corresponding tabulated values at P=0.05. *Spectrophotometric method
Titrimetric method Compendial method*
Pyritinol dihydrochloride Pyritinol dihydrochloride
Mean 99.928 99.061
S.D. 1.566 1.053
Variance 2.452 1.109
N 6 6
F test 2.211 (5.05)
Student’s t test 1.115 (2.228)
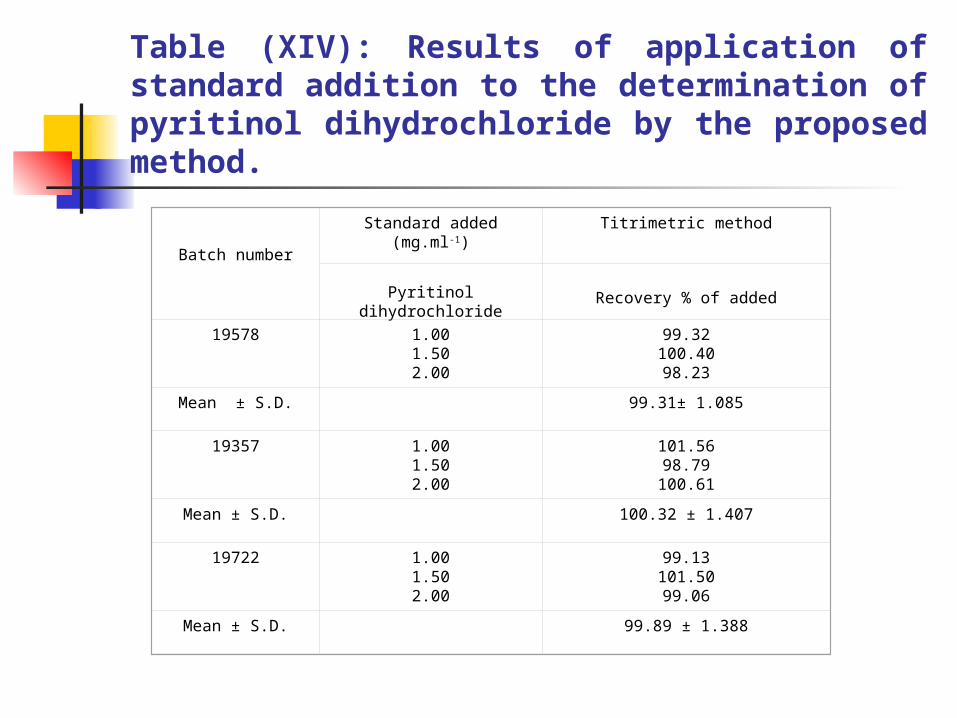
Table (XIV): Results of application of standard addition to the determination of pyritinol dihydrochloride by the proposed method.
Batch number
Standard added(mg.ml-1)
Titrimetric method
Pyritinol dihydrochloride
Recovery % of added
19578 1.001.502.00
99.32100.4098.23
Mean ± S.D. 99.31± 1.085
19357 1.001.502.00
101.5698.79
100.61
Mean ± S.D. 100.32 ± 1.407
19722 1.001.502.00
99.13101.5099.06
Mean ± S.D. 99.89 ± 1.388
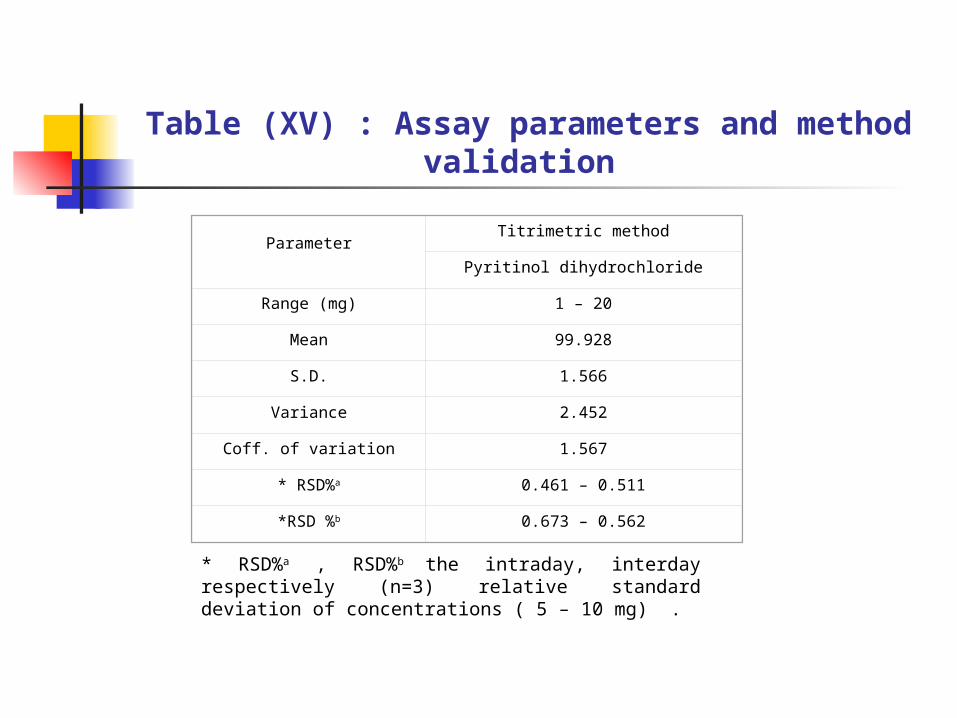
Table (XV) : Assay parameters and method validation
* RSD%a , RSD%b the intraday, interday respectively (n=3) relative standard deviation of concentrations ( 5 – 10 mg) .
ParameterTitrimetric method
Pyritinol dihydrochloride
Range (mg) 1 – 20
Mean 99.928
S.D. 1.566
Variance 2.452
Coff. of variation 1.567
* RSD%a 0.461 – 0.511
*RSD %b 0.673 – 0.562

Part IIStability indicating colorimetric method for the
determination of piracetam.
- This part includes a general introduction about the chemistry and mode of action of piracetam.
- A review on the reported methods for its quantitative determination.
-Stability indicating colorimetric method for the determination of piracetam using ninhydrin reagent.
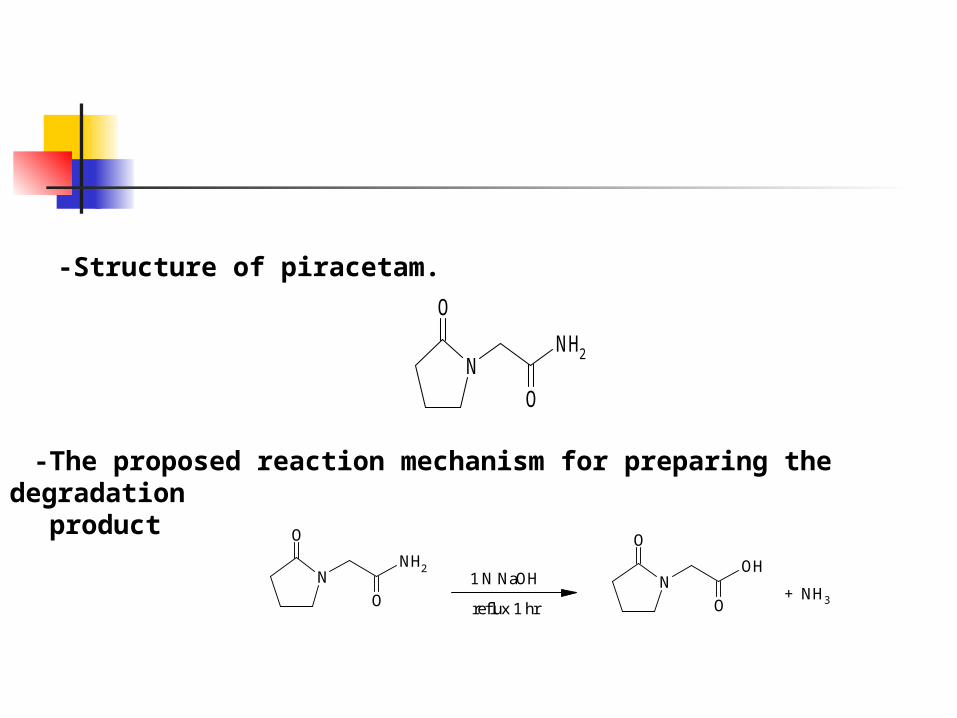
-Structure of piracetam.
N
O
O
NH2
-The proposed reaction mechanism for preparing the degradation product
N
O
O
NH21 N NaOH
reflux 1 hr
N
O
O
OH
+ NH3
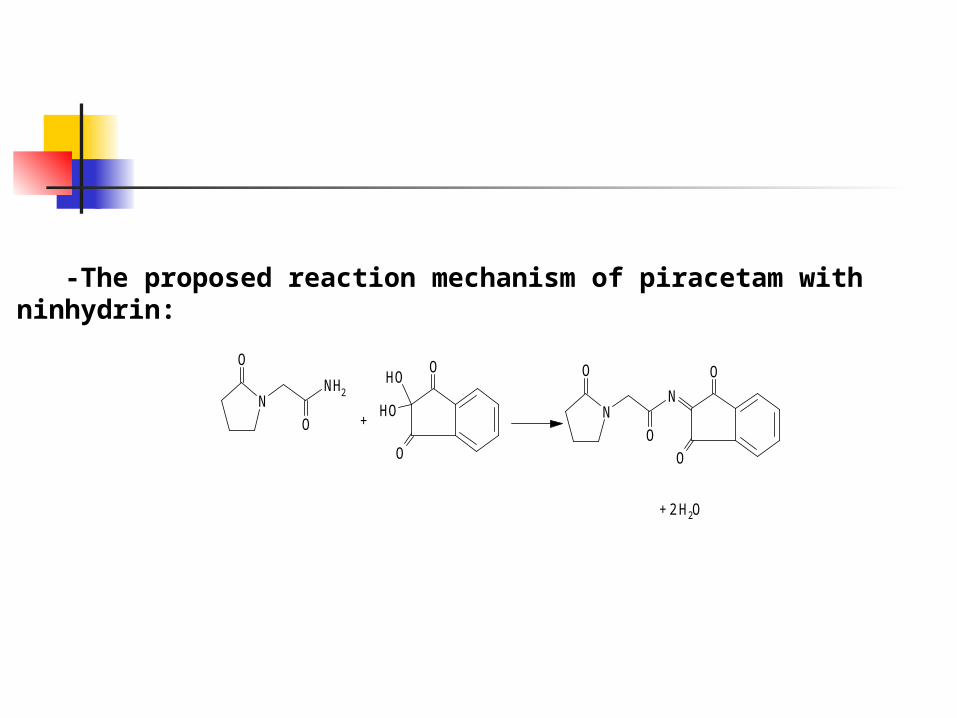
-The proposed reaction mechanism of piracetam with ninhydrin:
N
O
O
NH2
O
OOH
OH N
O
O
N
O
O
+
+ 2 H2O

Figure (15): Absorption spectra of
Piracetam in water 100 µg. ml-1 ).……(
Ninhydrin 4( % _ _ _ _ _ )
Colored product 30 µg. ml-1 (_______.)
0
0.1
0.2
0.3
0.4
0.5
0.6
0.7
0 2 4 6 8 10
Volume (ml) of ninhydrin solution
Ab
so
rba
nc
e
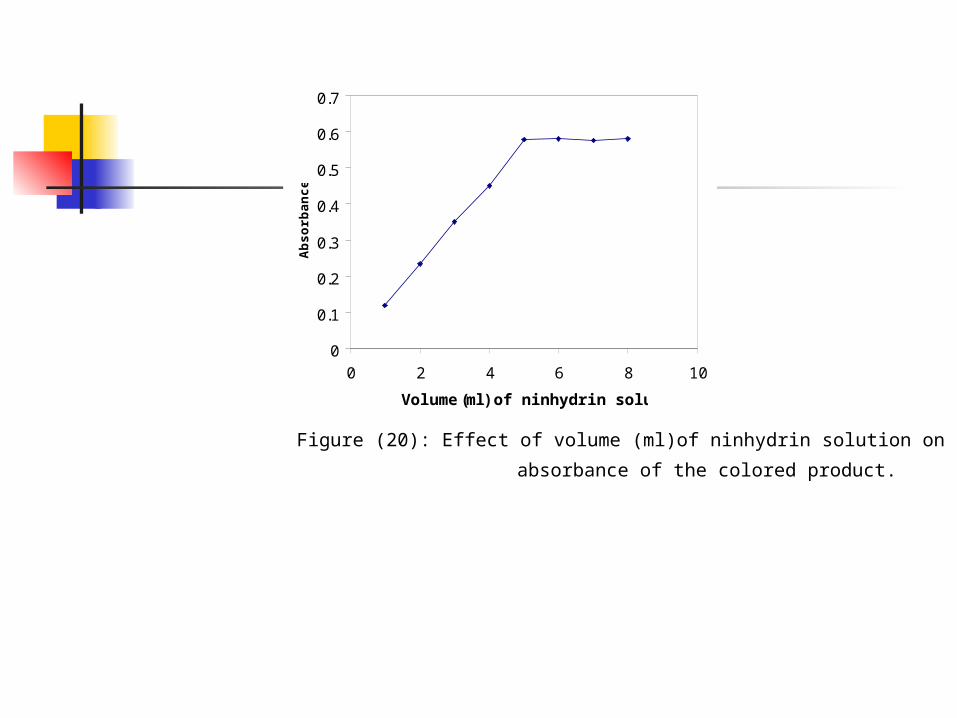
Figure (20): Effect of volume (ml)of ninhydrin solution on the
absorbance of the colored product.
0
0.1
0.2
0.3
0.4
0.5
0.6
0.7
0 2 4 6 8
pH
Ab
so
rba
nc
e
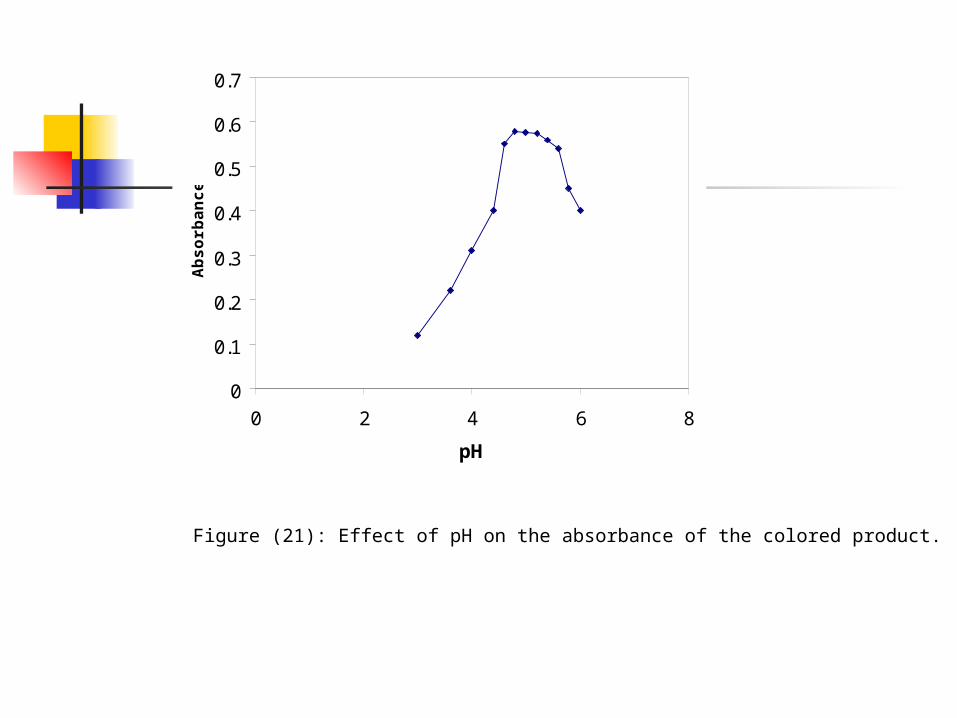
Figure (21): Effect of pH on the absorbance of the colored product.
0
0.1
0.2
0.3
0.4
0.5
0.6
0.7
0 5 10 15 20 25 30
Heating time in min.
Ab
so
rba
nc
e
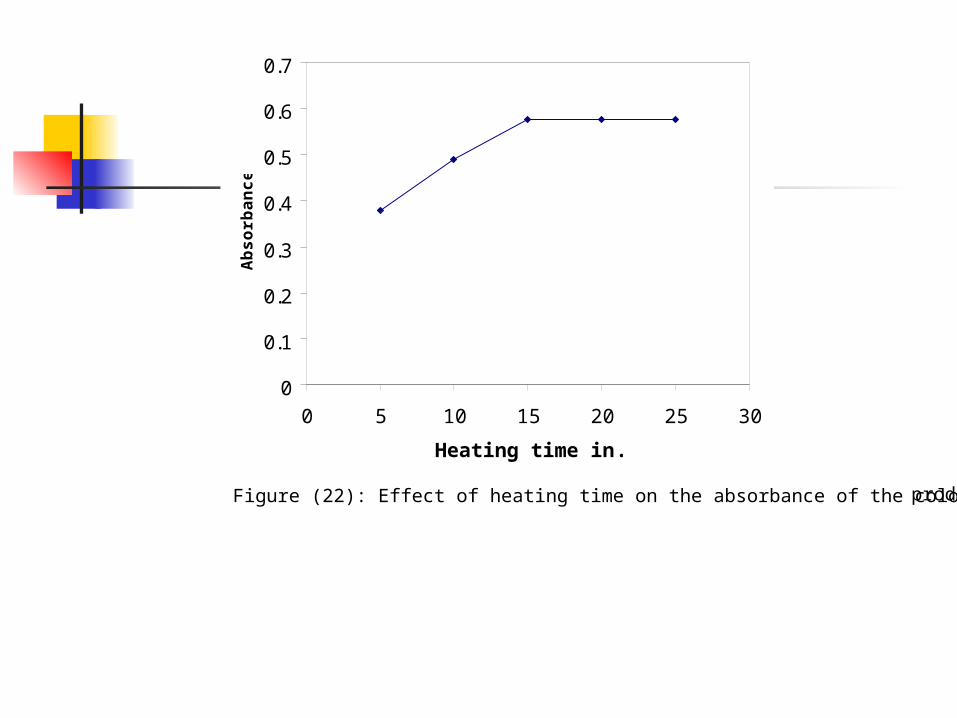
Figure (22): Effect of heating time on the absorbance of the colored product.
0
0.1
0.2
0.3
0.4
0.5
0.6
0.7
0 0.5 1 1.5
Volume (ml) of pyridine
Ab
so
rba
nc
e
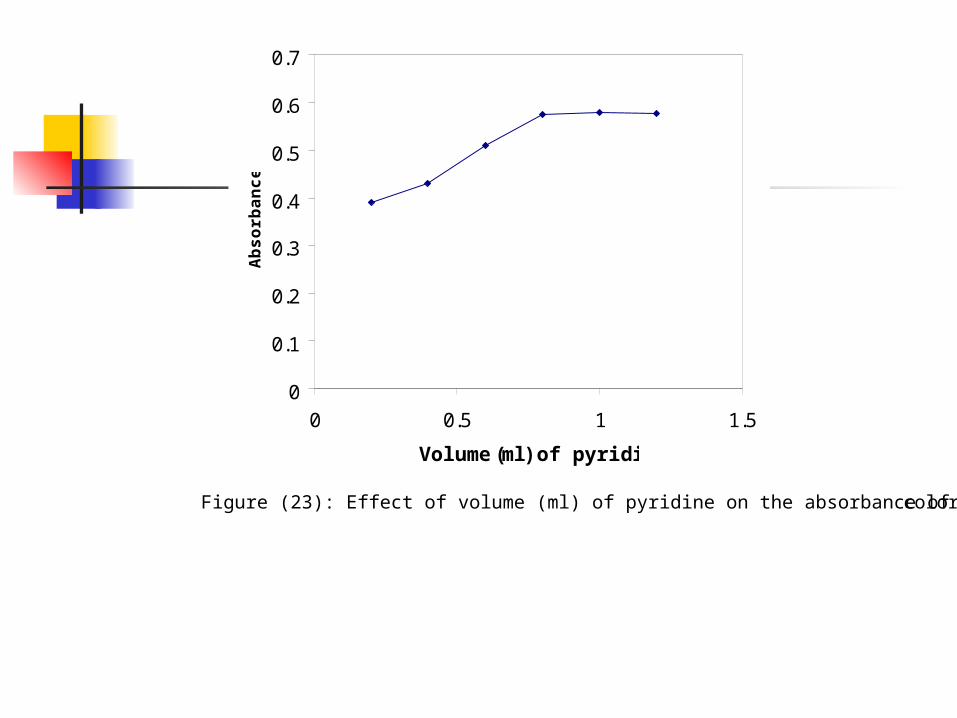
Figure (23): Effect of volume (ml) of pyridine on the absorbance of the colored product.

Figure (18): Absorption spectra of colored product ( piracetam with ninhydrin) 10-50 μg. ml-1
0
0.1
0.2
0.3
0.4
0.5
0.6
0.7
0.8
0.9
1
0 20 40 60
Concentration g.ml-1
Ab
so
rba
nc
e
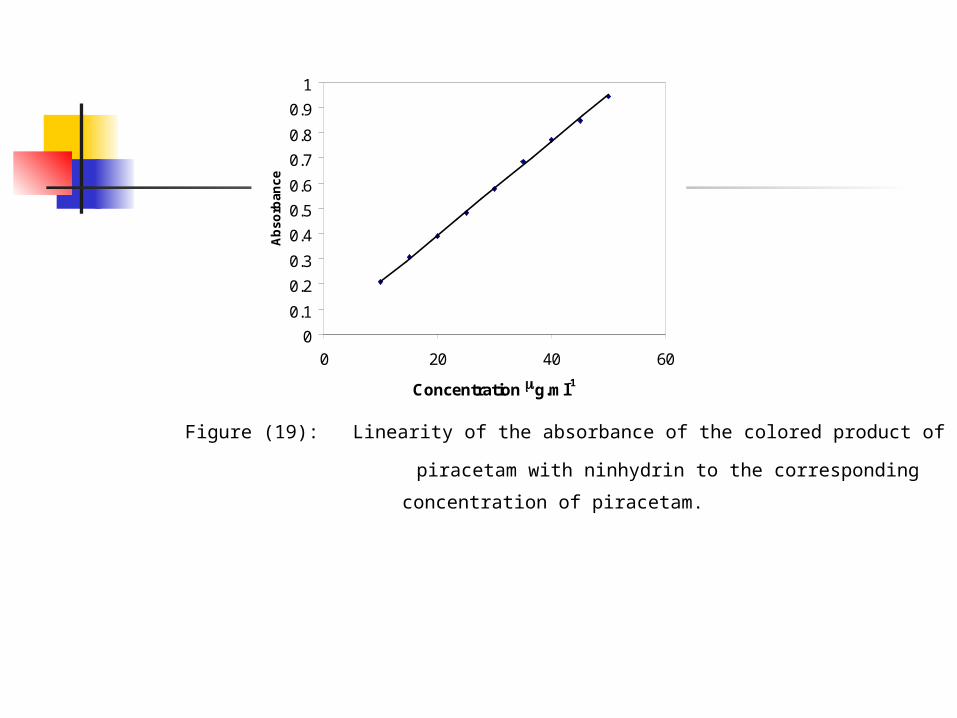
Figure (19): Linearity of the absorbance of the colored product of
piracetam with ninhydrin to the corresponding
concentration of piracetam.
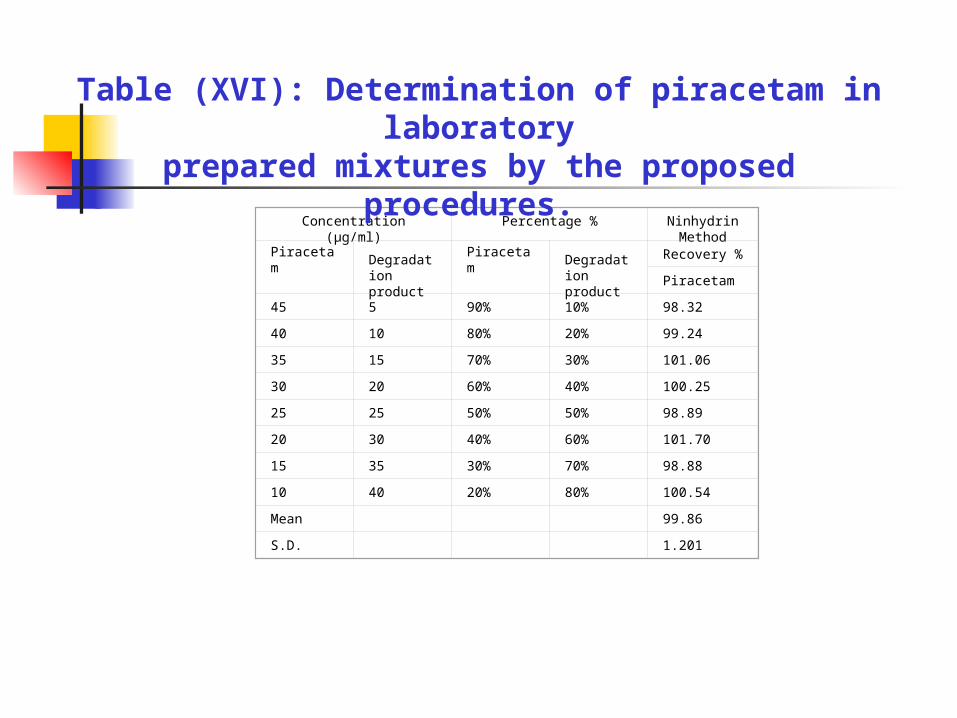
Concentration (µg/ml) Percentage % NinhydrinMethod
Piracetam Degradation product
PiracetamDegradation product
Recovery %
Piracetam
45 5 90% 10% 98.32
40 10 80% 20% 99.24
35 15 70% 30% 101.06
30 20 60% 40% 100.25
25 25 50% 50% 98.89
20 30 40% 60% 101.70
15 35 30% 70% 98.88
10 40 20% 80% 100.54
Mean 99.86
S.D. 1.201
Table (XVI): Determination of piracetam in laboratory prepared mixtures by the proposed
procedures.
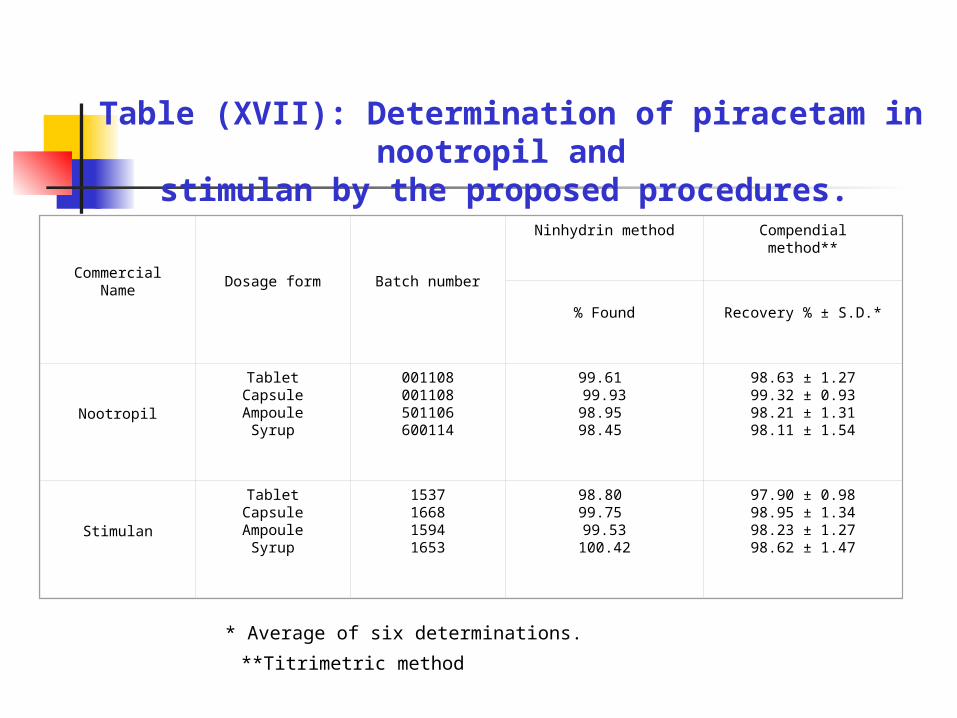
Table (XVII): Determination of piracetam in nootropil and stimulan by the proposed procedures.
* Average of six determinations.
**Titrimetric method
Commercial Name Dosage form Batch number
Ninhydrin method Compendial method**
% Found
Recovery % ± S.D.*
Nootropil
TabletCapsuleAmpoule
Syrup
001108001108501106600114
99.61 99.9398.95 98.45
98.63 ± 1.2799.32 ± 0.9398.21 ± 1.3198.11 ± 1.54
Stimulan
TabletCapsuleAmpoule
Syrup
1537166815941653
98.80 99.75 99.53
100.42
97.90 ± 0.9898.95 ± 1.3498.23 ± 1.2798.62 ± 1.47
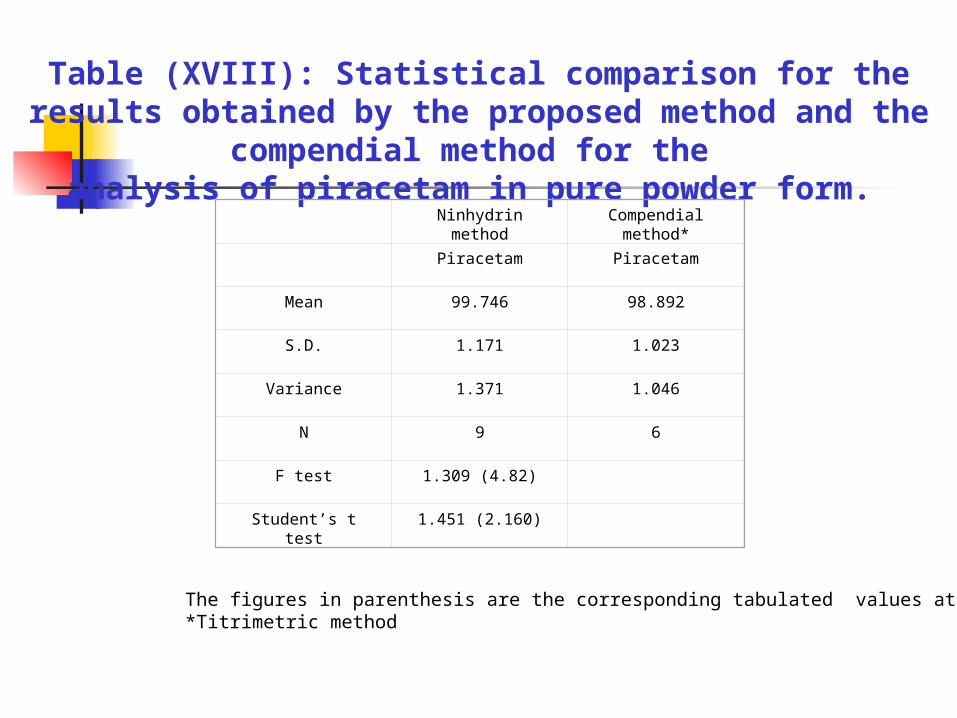
Table (XVIII): Statistical comparison for the results obtained by the proposed method and the compendial method for the
analysis of piracetam in pure powder form.
The figures in parenthesis are the corresponding tabulated values at P=0.05.*Titrimetric method
Ninhydrin method Compendial method*
Piracetam Piracetam
Mean 99.746 98.892
S.D. 1.171 1.023
Variance 1.371 1.046
N 9 6
F test 1.309 (4.82)
Student’s t test 1.451 (2.160)
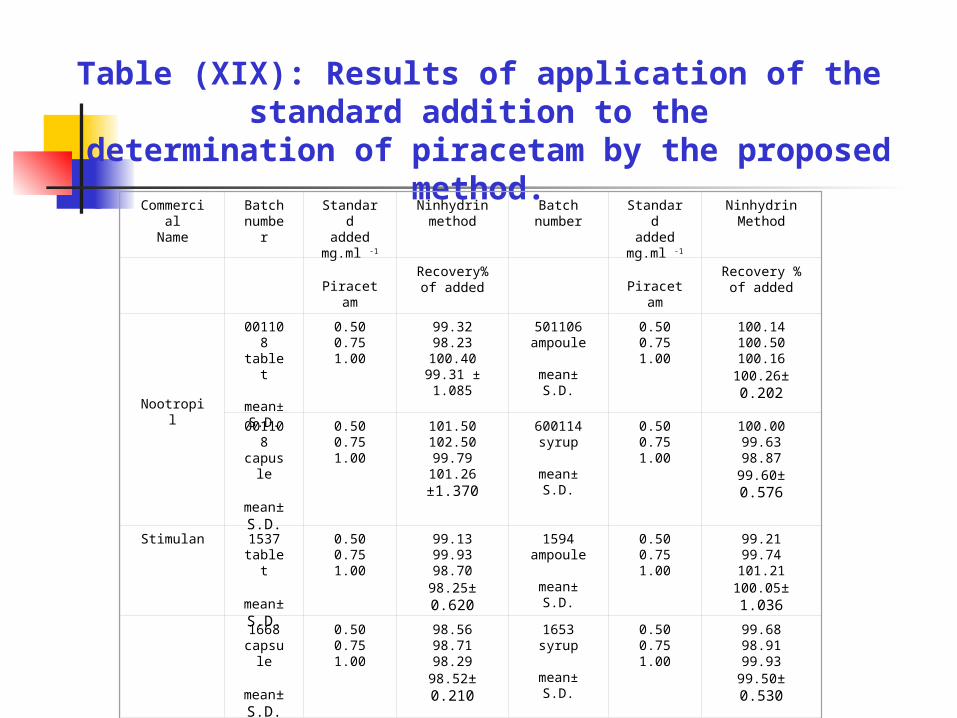
Table (XIX): Results of application of the standard addition to the
determination of piracetam by the proposed method.
CommercialName
Batchnumbe
r
Standardadded
mg.ml -1
Ninhydrinmethod
Batchnumber
Standardadded
mg.ml -1
NinhydrinMethod
Piraceta
m
Recovery%of added
Piraceta
m
Recovery %of added
Nootropil
001108tablet
mean± S.D.
0.500.751.00
99.3298.23100.4099.31 ± 1.085
501106ampoule
mean±S.D.
0.500.751.00
100.14100.50100.16
100.26±0.202
001108capusl
e
mean± S.D.
0.500.751.00
101.50102.5099.79101.26 ±1.370
600114syrup
mean±S.D.
0.500.751.00
100.0099.6398.87
99.60±0.576
Stimulan 1537tablet
mean± S.D.
0.500.751.00
99.1399.9398.70
98.25±0.620
1594ampoule
mean±S.D.
0.500.751.00
99.2199.74
101.21100.05±1.036
1668capsul
e
mean± S.D.
0.500.751.00
98.5698.7198.29
98.52± 0.210
1653syrup
mean±S.D.
0.500.751.00
99.6898.9199.93
99.50±0.530
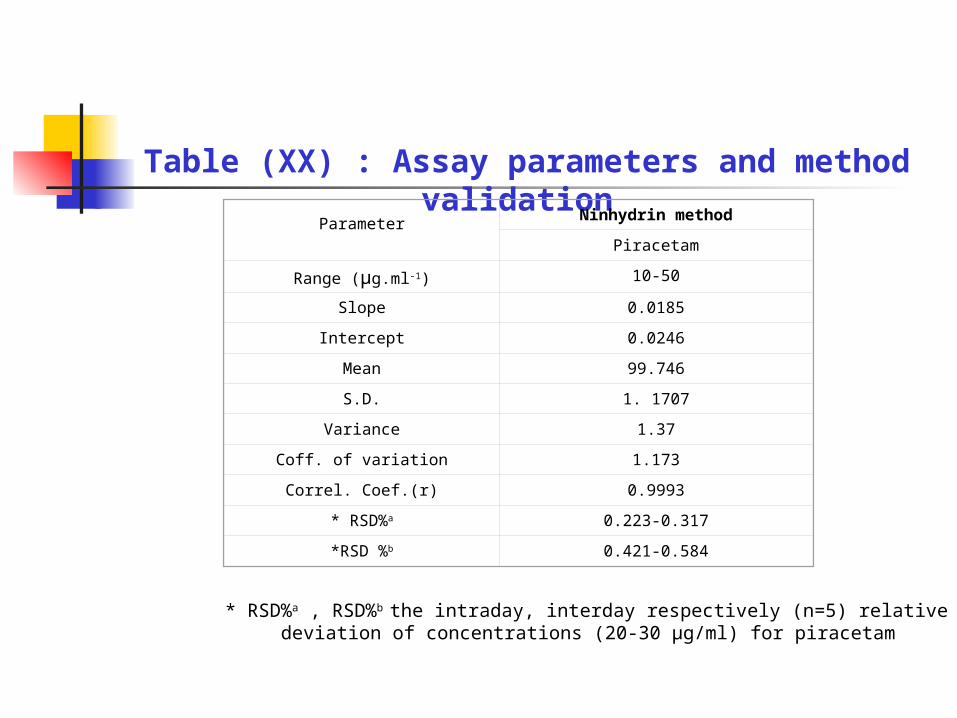
Table (XX) : Assay parameters and method validation
* RSD%a , RSD%b the intraday, interday respectively (n=5) relative standard deviation of concentrations (20-30 µg/ml) for piracetam
Parameter Ninhydrin method
Piracetam
Range (µg.ml-1) 10-50
Slope 0.0185
Intercept 0.0246
Mean 99.746
S.D. 1. 1707
Variance 1.37
Coff. of variation 1.173
Correl. Coef.(r) 0.9993
* RSD%a 0.223-0.317
*RSD %b 0.421-0.584