Embed Size (px)
Citation preview

2018Analyst Meeting
March 7, 2018

22018 Analyst Meeting
Cautionary statementForward-Looking Statements. Outlooks, projections, estimates, goals, targets, descriptions of business plans and objectives, market expectations and other statements of future events or conditions in this presentation or the subsequent discussion period are forward-looking statements. Actual future results, including future earnings, cash flows, returns, margins, and other areas of financial and operating performance; demand growth and energy mix; ExxonMobil’s production growth, volumes, development and mix; the amount and mix of capital expenditures; future distributions; proved and other reserves; reserve and resource additions and recoveries; asset carrying values and future impairments; project plans, completion dates, timing, costs, and capacities; efficiency gains; operating costs and cost savings; integration benefits; product sales and mix; production rates and capacities; and the impact of technology could differ materially due to a number of factors. These include changes in oil or gas demand, supply, prices or other market conditions affecting the oil, gas, petroleum and petrochemical industries; reservoir performance; timely completion of exploration and development projects; regional differences in product concentration and demand; war and other political or security disturbances; changes in law, taxes or other government regulation, including environmental regulations, taxes, and political sanctions; the outcome of commercial negotiations; the actions of competitors and customers; unexpected technological developments; general economic conditions, including the occurrence and duration of economic recessions; unforeseen technical difficulties; and other factors discussed here, in Item 1A. Risk Factors in our Form 10-K for the year ended December 31, 2017 and under the heading "Factors Affecting Future Results" in the Investors section of our website at www.exxonmobil.com. The forward-looking statements in this presentation are based on management’s good faith plans and objectives as of the March 7, 2018 date of this presentation. We assume no duty to update these statements as of any future date and neither future distribution of this material nor the continued availability of this material in archive form on our website should be deemed to constitute an update or re-affirmation of these figures as of any future date. Any future update of these figures will be provided only through a public disclosure indicating that fact.
Supplemental Information. See the Supplemental Information included on pages 73 through 78 of this presentation for additional important information concerning definitions and assumptions regarding the forward-looking statements included in this presentation, including illustrative assumptions regarding future crude prices and product margins; reconciliations and other information required by Regulation G with respect to non-GAAP measures used in this presentation including earnings excluding effects of tax reform and impairments, return on average capital employed (ROCE), free cash flow, and operating costs; and definitions and additional information on other terms used including returns and resources.

32018 Analyst Meeting
Agenda
8:00 Welcome Jeff Woodbury
Introduction Darren Woods
Upstream spotlights Neil Chapman
Open discussion Management Committee
Break
Downstream and Chemical spotlights Jack Williams
Investment and financial plan, closing Darren Woods
Open discussion Management Committee
12:00 Lunch Management Committee
1:00 Energy and carbon session Pete Trelenberg, Vijay Swarup
2:30 Adjourn

42018 Analyst Meeting
Fundamentals drive long-term shareholder value
• Innovative technologies provide competitive advantage
• Integrated businesses capture opportunities across value chain
• Disciplined investments deliver industry-leading portfolio
• Operational excellence maximizes asset value
• Financial strength provides unmatched flexibility
World-class workforce the foundation

52018 Analyst Meeting
Businesses robust to the long term
0
45
90
135
1985 1990 1995 2000 2005 2010 2015
Source: Bloomberg, U.S. Bureau of Labor Statistics
Brent crude price, 2017 dollars per barrel

62018 Analyst Meeting
Disciplined investment underpins shareholder value
XOM
%
XOM
-30
0
30
-20
0
20
XOM
Average annual ROCE 2008 - 2017
Cumulative impairments after tax 2008 - 2017
Billion USD
Peer group: BP, CVX, RDS, TOT derived from public information

72018 Analyst Meeting
0
120
2015 2020 2025 2030 20350
600
2015 2020 2025 2030 2035
Meeting demand with advantaged investmentsLNG growthMTA
Source: Wood Mackenzie
Demand
New supply required
Existing & under construction
Liquid supply / demand1
MOEBD
Demand
Decline without investment
Source: ExxonMobil 2018 Outlook for Energy: A View to 20401Excludes biofuels, includes estimated spare capacity
New supply required

82018 Analyst Meeting
-30
50
Fuel oil Gasoline Diesel Jet / Kero Chemicals
Investing in higher-value products
Industry product demand shiftGrowth from 2016 to 2025
%
Source: ExxonMobil 2018 Outlook for Energy: A View to 2040, IHS
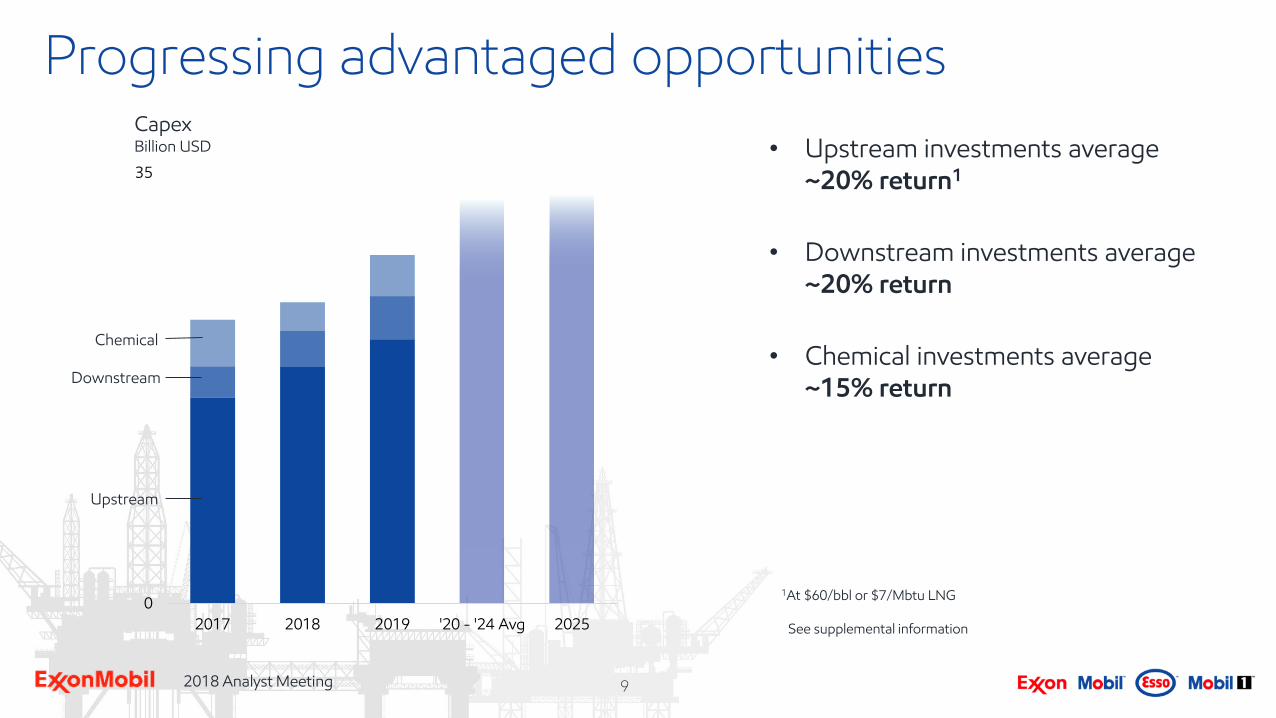
92018 Analyst Meeting
0
35
2017 2018 2019 '20 - '24 Avg 2025
Progressing advantaged opportunities
• Upstream investments average ~20% return1
• Downstream investments average ~20% return
• Chemical investments average ~15% return
1At $60/bbl or $7/Mbtu LNG
See supplemental information
Chemical
Downstream
Upstream
CapexBillion USD
102018 Analyst Meeting
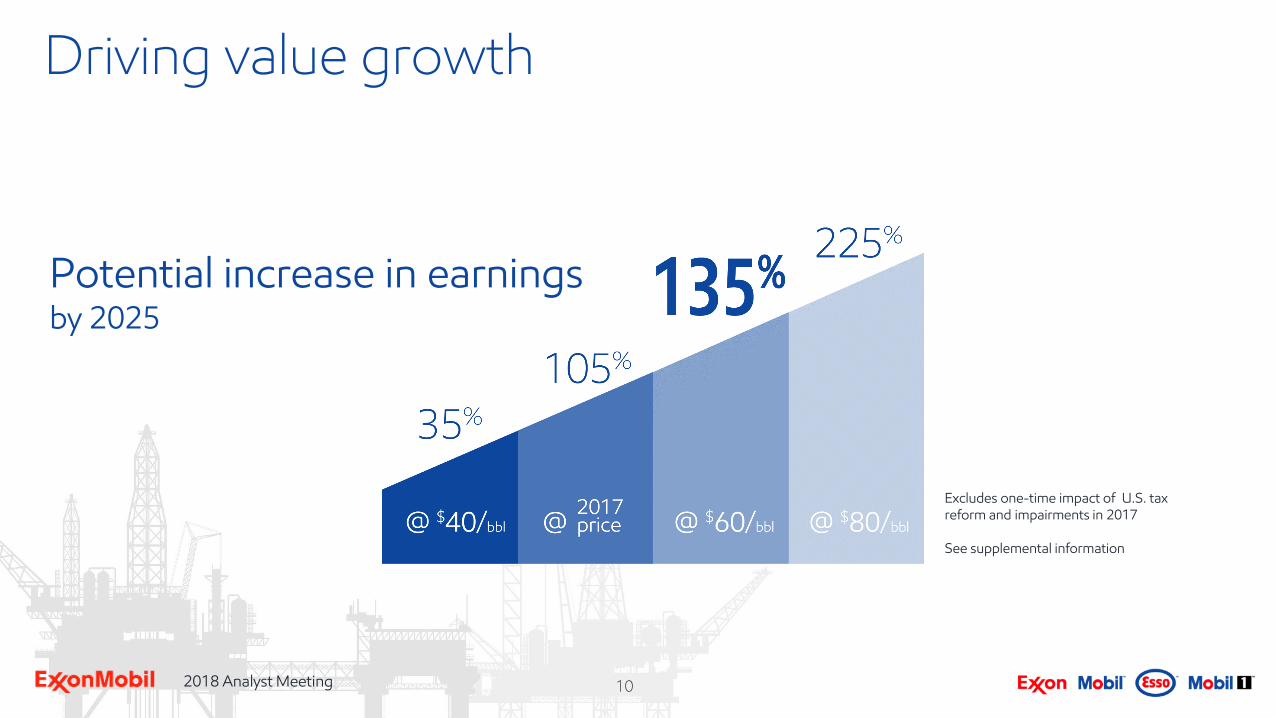
Driving value growth
Excludes one-time impact of U.S. tax reform and impairments in 2017
See supplemental information
Potential increase in earningsby 2025

112018 Analyst Meeting
Cash flow grows with value
Potential increase in cash flowby 2025
Cash flow from operations
See supplemental information

122018 Analyst Meeting
Strengthening Upstream portfolio
• 10 BOEB high-value resources added in 2017
• Fivefold increase in Permian tight-oil production
• 25 start-ups adding net 1 MOEB per day2017 earningsin 2025Excludes one-time impact of U.S. tax reform and impairments in 2017; see supplemental information
~3x

132018 Analyst Meeting
Upgrading Downstream production
• Proprietary technology improves project returns to > 20%
• 20% margin improvement in shift to higher-value products
• Capturing integrated Permian advantage2017 earningsin 2025
~2xExcludes one-time impact of U.S. tax reform and impairments in 2017; see supplemental information

142018 Analyst Meeting
Leading in Chemical growth
• Growing capacity in North America and Asia by 40%
• Starting up 13 new world-class facilities
• Performance products delivering 50% earnings growth
Excludes one-time impact of U.S. tax reform and impairments in 2017; see supplemental information
2017 earningsin 2025
~2x

152018 Analyst Meeting
0
16
35BP
TOT
2025
2020
Growing shareholder valueAverage annual ROCE 2015 - 2017%
Average earnings 2015 - 2017 (Billion USD)
RDSCVX
See supplemental information

162018 Analyst Meeting
StrengtheningUpstream portfolio

172018 Analyst Meeting
12
25
CVX
BP
TOTRDS
Improving Upstream financial performance
See supplemental informationAverage earnings 2015 - 2017 (Billion USD)
Average annual ROCE 2015 - 2017%

182018 Analyst Meeting
12
25
Improving Upstream financial performance
See supplemental information
2025
2020
Average earnings 2015 - 2017 (Billion USD)
Average annual ROCE 2015 - 2017%
CVX
BP
TOTRDS

192018 Analyst Meeting
Industry-leading portfolio growth
0
1,000
2,000
CVX BP TOT RDS XOM
MOEB net
Exploration successTotal commercial discoveries 2012 - 2017
0
5,000
10,000
XOM2017
Resource additions including acquisitions
MOEB net
Source: Wood Mackenzie XOM Competitor
5 Yr. Avg. 2012 - 2016
Source: Wood Mackenzie other than 2017 XOM

202018 Analyst Meeting
Captured highest-quality acreage in 10+ years
>8 BOEB net resource potential captured
Brazil
Guyana
United States
Mexico
Papua New Guinea
Cyprus
Mozambique
MauritaniaMalaysia
Drilling planned,2018 - 2019
Key captures, 2017
South Africa
Australia
Equatorial Guinea
Canada
See supplemental information

212018 Analyst Meeting
Next-generation assets drive growth
LNG
Guyana, Brazil
Deep water
Unconventional
• Our strongest portfolio of opportunities since the merger
• Attractive across range of prices
• All producing by 2025
U.S. tight oil
PNG, Mozambiqueof 2025 Upstream earnings50%
See supplemental information

222018 Analyst Meeting
Guyana: outstanding deepwater discovery
• > 3.2 BOEB (gross) discovered
• Considerable upside potential
− 4 exploration wells in 2018
− 20 additional prospects
• > 10% return at $40/bbl
− Proprietary technology
− Low-cost development
Kaieteur
Stabroek
Canje
Liza
Sorubim
Payara
Pacora
Snoek
Turbot
Guyana
2018 exploration drilling
Discoveries
Ranger
Liza Deep
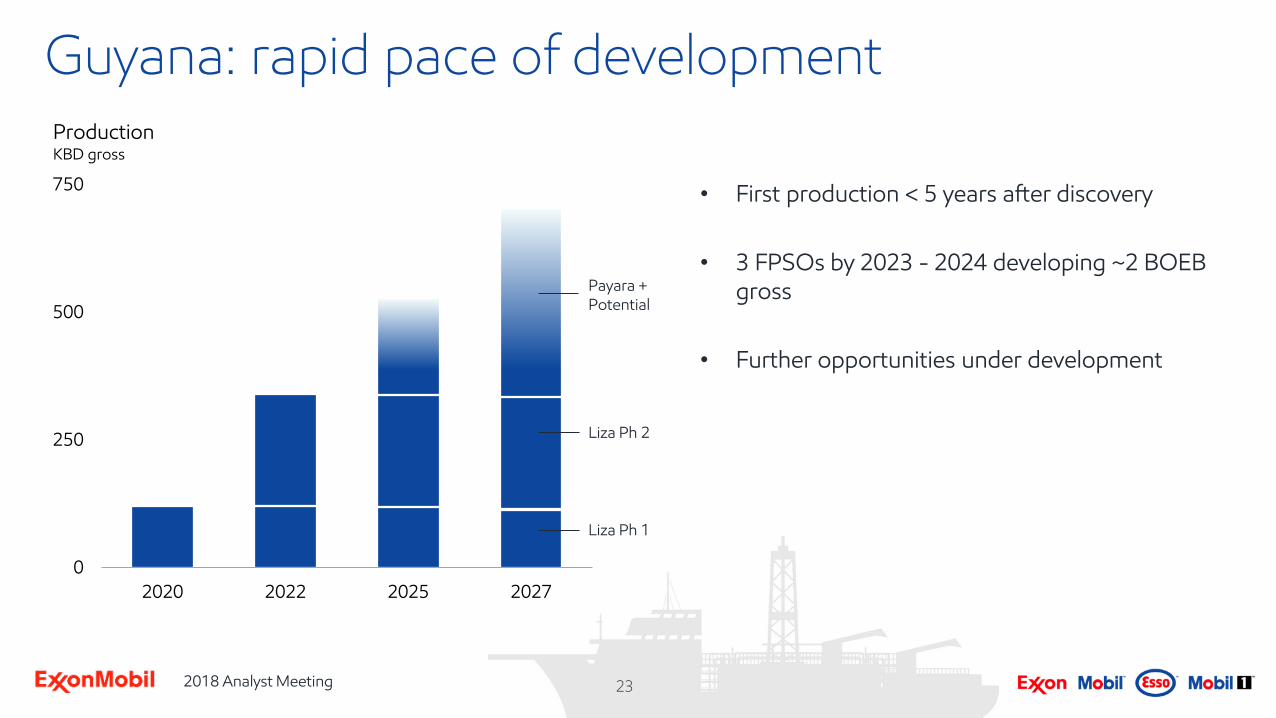
232018 Analyst Meeting
0
250
500
750
2020 2022 2025 2027
Guyana: rapid pace of development
• First production < 5 years after discovery
• 3 FPSOs by 2023 - 2024 developing ~2 BOEB gross
• Further opportunities under development
Liza Ph 1
Payara + Potential
Production KBD gross
Liza Ph 2

242018 Analyst Meeting
0
1.0
2.0
RDS BP XOM TOT CVX
Million acres
Brazil: entry to significant growth potential
• High-quality, > 2 billion barrel Carcara field (gross)
− > 10% return at $40/bbl
• Multi-billion barrel pre-salt prospects
− Under concession contracts
• Aggressive exploration schedule
− > 4,000 km2 3D seismic in 2018
− Up to 4 wells planned in 2018 - 2019
Source: Wood Mackenzie; year-end 2017Includes BM-S-8; targeting close of BM-S-8 farm-in by mid-2018
Net acreage positions

252018 Analyst Meeting
0
250
500
750
2018 2021 2024 20270
200
400
2020 2022 2025 2027
Growing deepwater position at low cost
Romania, West Africa
Guyana,Brazil
Deepwater new developmentsKOEBD net
Deepwater volumesKOEBD net
New developments
Potentialupside
Existing


272018 Analyst Meeting
U.S. tight oil: unique competitive position
IHS data Jan 2018; Horizontal wells > 1K foot lateral length; excludes AK and CA
Company presentations, Wood Mackenzie, XOM data; Permian (Midland / Delaware only), Bakken and Eagle Ford
Leading unconventional portfolio and capability
• 3.2 million net acres in five largest plays
• Accelerated learning through scaleand experience
• Leveraging unmatched integrated capability
Total horizontal wells1
Operated, oil and gas
6,469
2,730
1,166
754 668
XOM TOT CVX RDS BP
2017 production (KOEBD net)2
Key unconventional liquids plays
203
181
63
42
0
XOM CVX RDS BP TOT
1
2

282018 Analyst Meeting
U.S. tight oil: unique competitive position
MidlandBasin
CentralBasin
PlatformDelawareBasin
NM
TX
Hydrocarbon density map for Permian tight oil Operated contiguous acreage
• Expanding contiguous position through acquisitions and trades
• Enables industry-leading, long-lateral advantage
ExxonMobil acreage

292018 Analyst Meeting
0
100
200
5K 7.5K 10K 12.5K 15K
U.S. tight oil: unique competitive position
PV of Permian lateral length% of PV vs. 5K ft well, estimated
Delaware / Midland industry average lateral length
Leading capital efficiency
• 3-mile laterals meeting expectations
• Increasing Bakken recoveries 15 - 25% per well
• Development costs reduced ~70% since 2014
• Driving towards ~$5/OEB target

302018 Analyst Meeting
U.S. tight oil: unique competitive position
2025
2017
2025
2017
0
800
XOM RDS CVX BP
0
7
XOM RDS CVX BP
2021
2017
2022
2017
150% of CP Chem
2018
1
Unique integrated position
• Differentiated with world-class manufacturing on U.S. Gulf Coast
• Expanding refining and chemicals to process advantaged feedstocks
• $2B in planned infrastructure investments
USGC light crude refining capacityKBD
USGC ethylene capacityMTA


322018 Analyst Meeting
Improving U.S. profitability
0
300
600
900
2011 2012 2013 2014 2015 2016 2017 2022
• Focused move to liquids production
− Accelerating with Permian and Bakken growth
• Selectively investing in low-cost dry gas plays
• Aggressive cost reductions
• Increasing asset management focus
U.S. Upstream
Earnings, $B1 5 4 4 5 (1) (2) (0) ~5
XTO U.S. net productionKOEBD
WTI2, Yr avg. 95 94 98 93 49 43 51 $60/bbl Brent
1Excludes one-time impact of U.S. tax reform in 2017 and impairments in 2016 and 20172Source: Bloomberg
Liquids
Dry + associated gas
Dry gas
See supplemental information

332018 Analyst Meeting
0
300
600
2015 2020 2025 2030 2035
Attractive LNG opportunities for low cost of supply
• Demand growing at > 4% annual average
• ~170 MTA additional capacity needed by 2030
Global LNG growthMTA
Demand
Existing & under construction
New supply required
<$5/Mbtucost of supply
Potential new capacity by 2025MTA net
Source: Wood Mackenzie + ExxonMobil plan
• Strength in LNG
ExxonMobil plan
Source: Wood Mackenzie
0
8
16
XOM RDS TOT CVX BP

342018 Analyst Meeting
Papua New Guinea: development synergies
PNG resource growthTCF
0
4
8
12
YE16 YE17
Significant recentdiscoveries
IOC acquisition
• Aggressive exploration program
− 4 - 5 further wells planned for 2018 - 2020
• Captured high-quality resources through InterOil acquisition
• Integrated development planning for multi-train expansion
− Leveraging successful existing LNG facilities to reduce costs
− Doubling capacity with potential 8 MTA expansion

352018 Analyst Meeting
0
20
40
2022 2025 Future
Mozambique: world-class gas resource
• Funded participation in Coral floating LNG
− 3.4 MTA capacity, 2022 start-up
• Progressing low-cost Area 4 development
− ExxonMobil leading onshore developments
− Pursuing synergies in future LNG facilities
• Significant scale potential to > 40 MTA
− Target > 13 MTA online by 2024
• Seismic and drilling in 2018 - 2019 on new exploration
acreage
Mozambique growth potentialMTA gross
Mambainitial trains
Coral
Futuredevelopment

362018 Analyst Meeting
Aggressively driving Upstream competitiveness
• Maintaining exploration activity through cycle
• Highgrading portfolio
− Exploration success, high-value acquisitions
− Large near-term development inventory
− Ramping up divestment activity
• Focused on maintaining cost leadership position
− 22% reduction in cash costs and headcount
10
20
2014 2015 2016 2017
Upstream operating cash costs
Headcount1
97 BOEB total net resource
0
100
2016 2017
Proved
Design/develop
Evaluating
Upstream operating cash costs ($B) and headcount (k)
1Regular employees and staff contractorsSee supplemental information

372018 Analyst Meeting
10
30
50
0
250
2017 2018 2020 2022+
Essential progress on Kearl
• Growing cash generation capacity
− Achieved break-even1 < $50 WTI, 180 kbd gross
• Leveraging integrated R&D, refining capability
• Focus on reliability, cost and yield
− Targeting $20/bbl unit cash operating costs
• Planned production increase to 240 kbd
− Cash generation > $0.5B/yr @ $60/bbl WTI
Kearl unit cash operating costs
See supplemental information
$/bbl
1In 2017; excludes working capital and other timing effects
Production and costKBD gross


UpgradingDownstream production
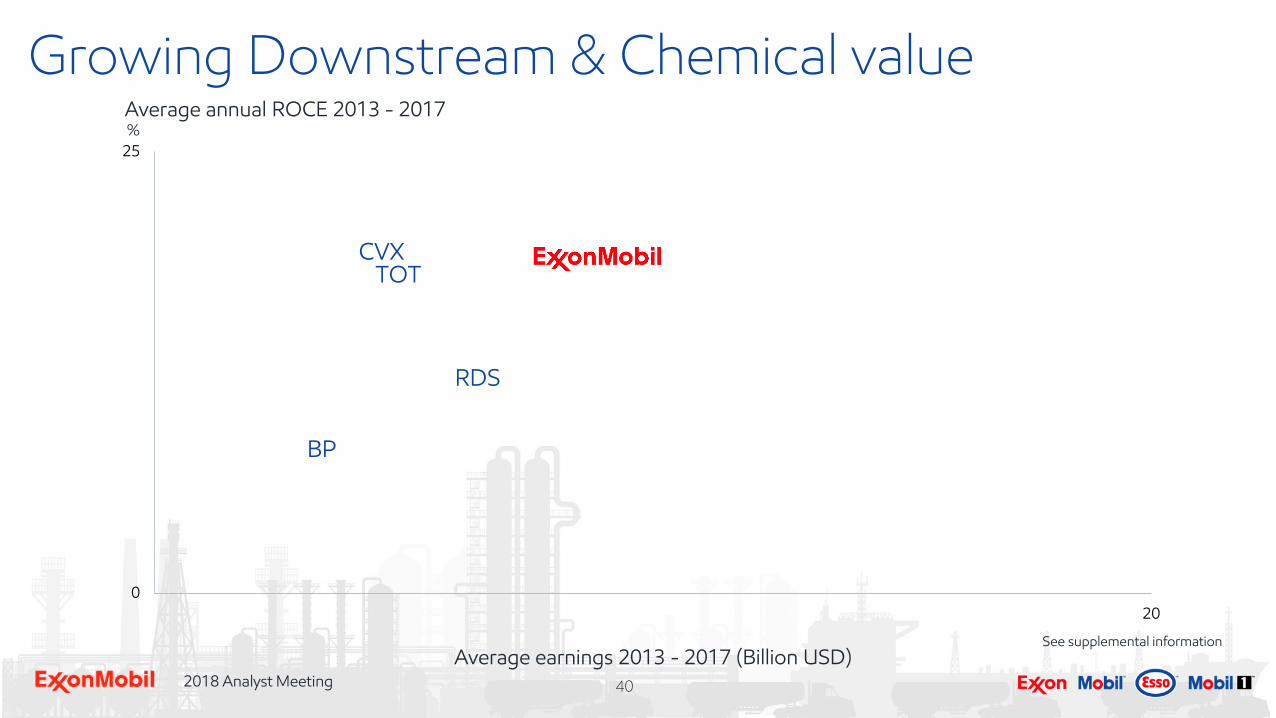
402018 Analyst Meeting
BP
CVXTOT
RDS
0
25
20
Average annual ROCE 2013 - 2017%
Average earnings 2013 - 2017 (Billion USD)See supplemental information
Growing Downstream & Chemical value

412018 Analyst Meeting
0
25
20
20252020
Average annual ROCE 2013 - 2017%
Average earnings 2013 - 2017 (Billion USD)See supplemental information
BP
RDS
TOTCVX
Growing Downstream & Chemical value

422018 Analyst Meeting
RDSPSXVLOMPC
0
30
10
Average annual ROCE 2013 - 2017%
Average earnings 2013 - 2017 (Billion USD)See supplemental information
Growing Downstream value
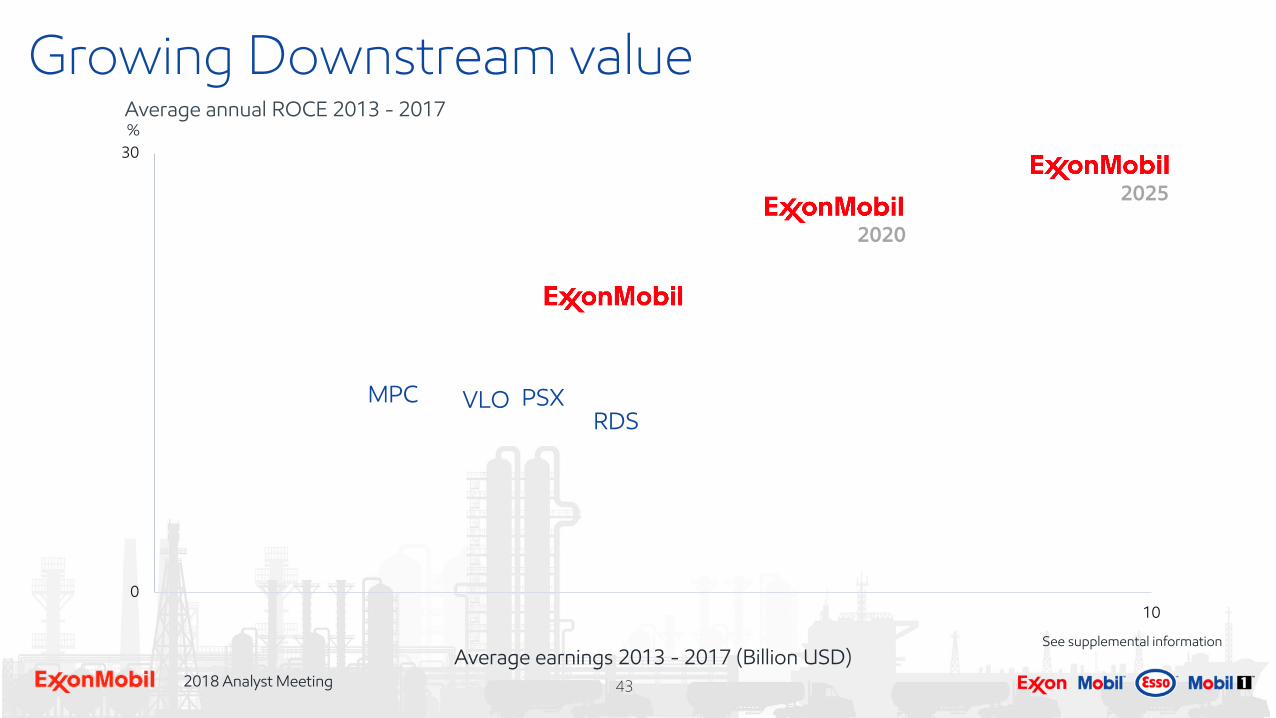
432018 Analyst Meeting
RDSPSXVLOMPC
0
30
10
2025
2020
Average annual ROCE 2013 - 2017%
Average earnings 2013 - 2017 (Billion USD)See supplemental information
Growing Downstream value

442018 Analyst Meeting
Consistently highgrading portfolio
0
100
2008 Number ofterminals
Number ofrefineries
Pipeline miles Retail sitesowned
1Indexed
Portfolio vs. 20081 • Capital employed reduced by $8B through divestments
13 refineries
13 terminals
4,653 miles of pipeline
7,844 retail sites
%
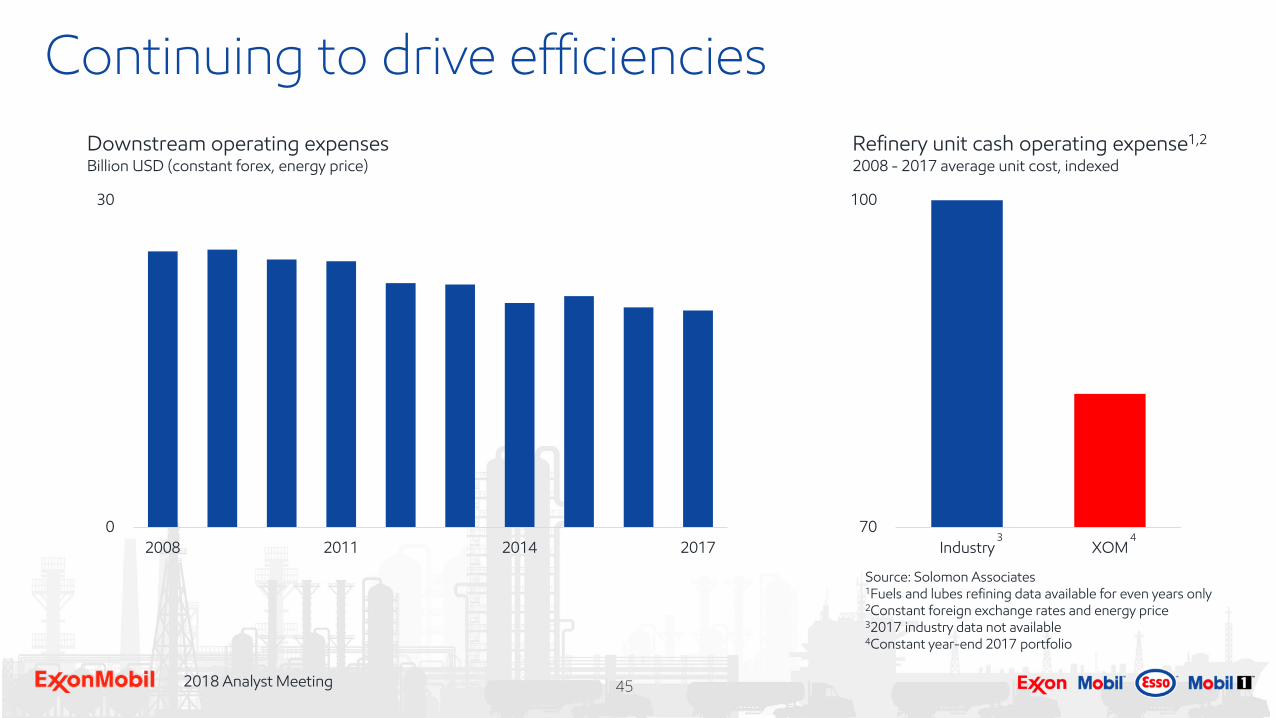
452018 Analyst Meeting
Continuing to drive efficiencies
70
100
Industry XOM
Refinery unit cash operating expense1,2
2008 - 2017 average unit cost, indexed
Source: Solomon Associates1Fuels and lubes refining data available for even years only2Constant foreign exchange rates and energy price32017 industry data not available4Constant year-end 2017 portfolio
0
30
2008 2011 2014 2017
Downstream operating expensesBillion USD (constant forex, energy price)
3 4

462018 Analyst Meeting
Product shifts improving profitability
• Upgrading 200 KBD of fuel oil to higher-value products
• Growing Group II basestocks and distillate > 20%
• Leveraging strong lubricants and chemical integration
-50
0
50
Fuel oil Gasoline ChemicalFeedstock
Diesel /Jet
LubeBasestock
ExxonMobil Downstream product shift 2025 vs. 2017
%
$47/bbl $64/bbl $88/bbl $65/bbl $98/bbl
2017 Prices1
Platts, Argus, and IHS1

472018 Analyst Meeting
• $9B investment in 6 major refinery projects
• Proprietary process / catalyst technology
• Integrated circuit with unmatched scale
Advantaged investments, high returns
0
20
Industry XOM
Investment returns%
Uplift
Integration /Optimization
ProprietaryTechnology
ExxonMobil assessment of industry-announced projects
Planned major projects through 2025 1 2
2
1

482018 Analyst Meeting
Doubling Rotterdam refinery earnings
• Proprietary-technology-enabled project generates > 20% return
• Improves Rotterdam and NW Europe circuit competitiveness
• Growing global Group II basestock production 35%; first in Europe
2xmarginMargin ($/bbl), indexed to 2017

492018 Analyst Meeting
• Strategic lube basestocks investments underway
• Continued growth of strong synthetics position
• Volumes growing at > 3x rate of industry
Extending lubricants leadership
1Market position
100
300
2007 2017 2025
Industry
ExxonMobil
Synthetic lubricants sales growth
Source: Kline, ExxonMobil estimates
%
Lube basestocks 1
Finished lubricants 2
Synthetic lubricants 1
Product leadership1

502018 Analyst Meeting
Value chain earnings growth
LubricantsValue chain
FuelsValue chain
Mexico, Indonesia
Group II, Synthetics, India, China
Research / Technology / Digital
Organizational efficiencies
Commercial leverage
See supplemental information
Advantaged refining investments
2017 earningsin 2025
~2xPermian integration
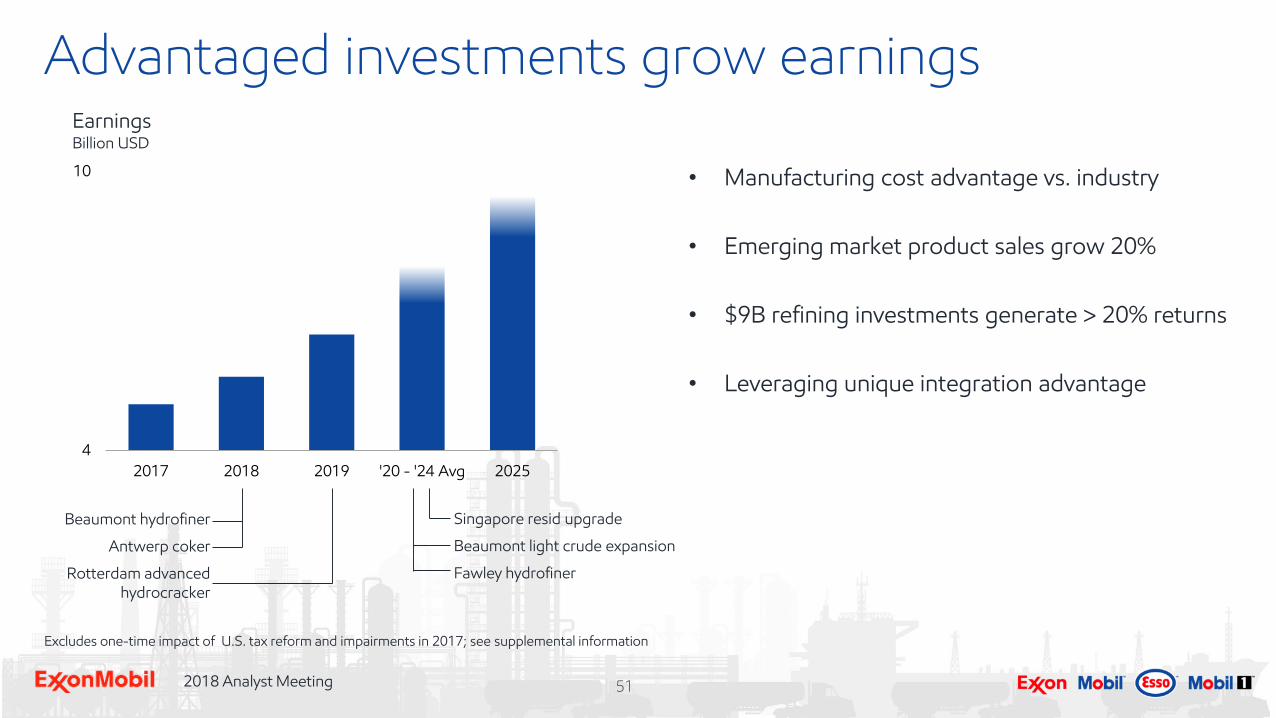
512018 Analyst Meeting
Advantaged investments grow earnings
4
10
2017 2018 2019 '20 - '24 Avg 2025
Earnings Billion USD
Beaumont hydrofiner
Antwerp coker
Rotterdam advanced hydrocracker
Singapore resid upgrade
Beaumont light crude expansion
Fawley hydrofiner
• Manufacturing cost advantage vs. industry
• Emerging market product sales grow 20%
• $9B refining investments generate > 20% returns
• Leveraging unique integration advantage
Excludes one-time impact of U.S. tax reform and impairments in 2017; see supplemental information

522018 Analyst Meeting
LeadingChemical growth
532018 Analyst Meeting
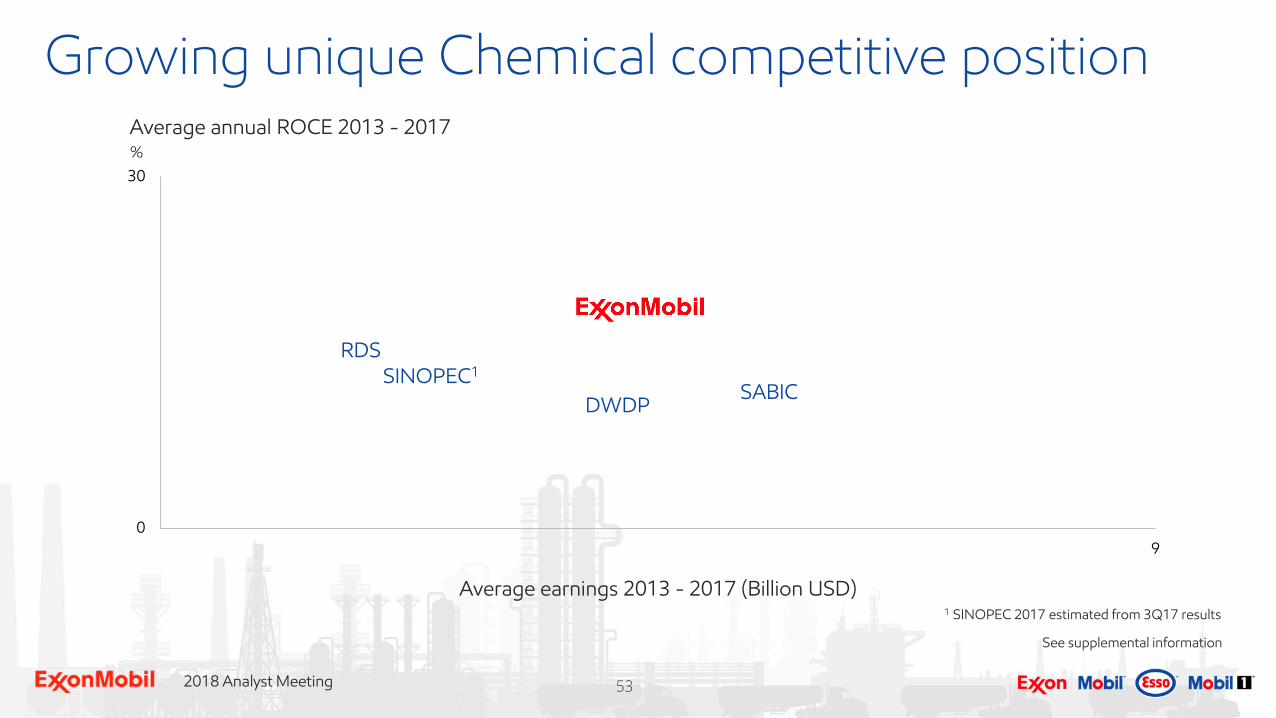
RDSSINOPEC1
SABICDWDP
Growing unique Chemical competitive position
Average earnings 2013 - 2017 (Billion USD)
See supplemental information
1 SINOPEC 2017 estimated from 3Q17 results
Average annual ROCE 2013 - 2017
0
30
9
%

542018 Analyst Meeting
0
30
9
RDSSINOPEC1
SABICDWDP
Growing unique Chemical competitive position
Average earnings 2013 - 2017 (Billion USD)
Average annual ROCE 2013 - 2017%
2020 2025
See supplemental information
1 SINOPEC 2017 estimated from 3Q17 results

552018 Analyst Meeting
Strengthening of competitive position
0
20
0
4
Billion USD
ROCE
Average earnings & ROCE1
1987 1997 2007 2017
Earnings
ROCE
%
1Exxon only before '99
Decade
ending
Source: IHS1ExxonMobil estimates based on available data
Polyethylene 1
Differentiated polyethylene 1
Fluids / plasticizer 1
Propylene-based plastomer1 1
Adhesions 1
Synthetics 1
TPV 1
Butyl rubber 1
Lube & fuel additives 2
EPDM 2
Aromatics 2
Product leadership position
See supplemental information

562018 Analyst Meeting
Leveraging our competitive advantages
400
1,000
ExxonMobil USGC margin advantage
USGC
ExxonMobilUSGC
Industry
$/T
Margin uplift
Proprietary
technology
Integration
Advantaged USGC ethylene supply
Source: ExxonMobil estimates based on IHS, Hodson, CEFIC
Production cost
Cumulative supply
US Gulf Coast
China
WesternEurope
MiddleEast
Gas Liquids

572018 Analyst Meeting
90
250
2007 2009 2011 2013 2015 2017
Performance products sales growthVolume, indexed
ExxonMobil performance product sales
Global GDP growth
Global chemicals commodity growth
Performance polyethylene technology developmentRelative performance
Mechanicalproperties
Processability
ExceedTM XP
EnableTM
ExceedTM
Commodity competitors
Developing high-performance products
Source: IHS, ExxonMobil estimates
100
582018 Analyst Meeting
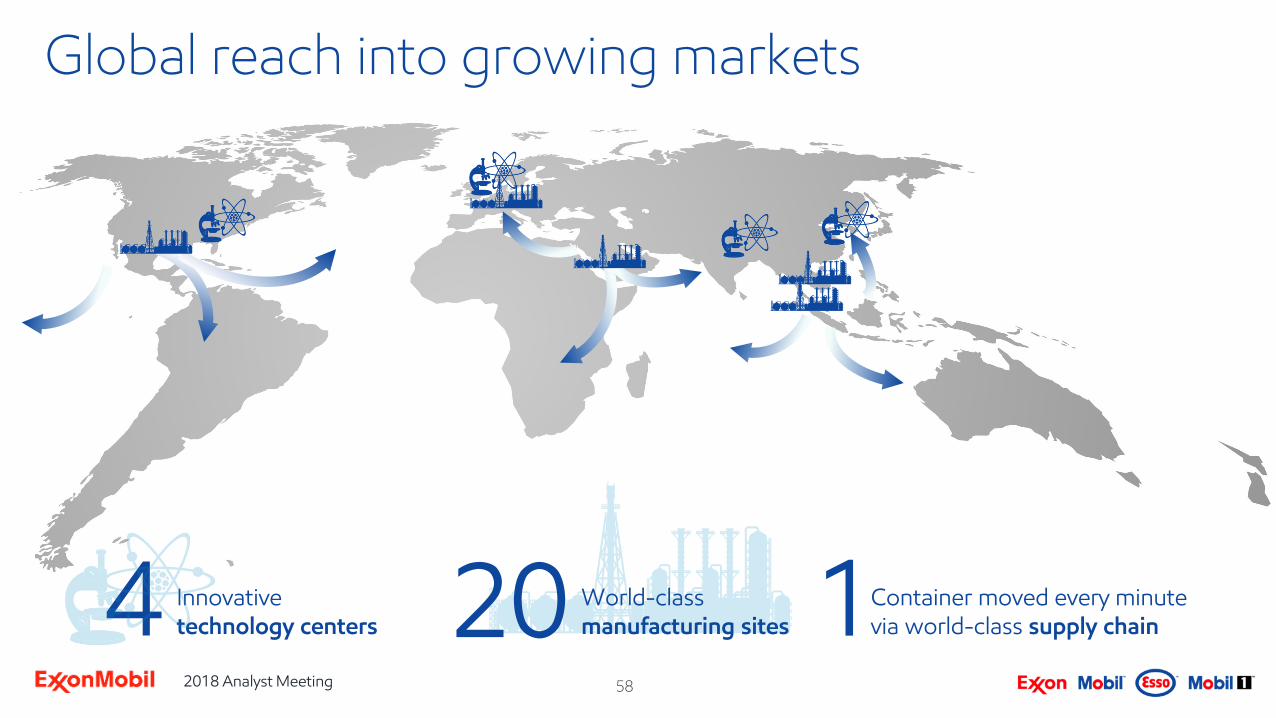
Global reach into growing markets
1Innovative technology centers4 World-class
manufacturing sites20 Container moved every minute via world-class supply chain


602018 Analyst Meeting
Leveraging competitive strengths to grow
4
8
2017 2018 2019 '20 - '24 Avg 2025
Singapore aromatics & specialties
Asia cracker and derivatives
North America polypropylene
Corpus cracker and derivatives
Baytown cracker and derivatives
EarningsBillion USD
Excludes one-time impact of U.S. tax reform in 2017; see supplemental information
• Doubling earnings through
Product leadership
Proprietary technology
Global market access
Integration

Investment and financial plan


642018 Analyst Meeting
0
120
Productively generating cash flow
See supplemental information
1Cumulative capex from publicly available data and adjusted for: RDS includes BG acquisition (2016 - $53B)XOM includes XTO acquisition (2010 - $41B) Peer group: BP, CVX, RDS, TOT derived from public information
XOM
Cash flow from operations over capex1 (cumulative 2008 – 2017)%

652018 Analyst Meeting
0
30
2017 2018 2019
Progressing advantaged investments
Organic
Acquisitions
License to operate, exploration capex
Capex
New investments
• Downstream (avg return ~20%)– Rotterdam advanced hydrocracker– Beaumont light crude expansion– Singapore resid upgrade expansion– Fawley hydrofiner
• Chemical (avg return ~15%)– Baytown cracker– Corpus cracker and derivatives
• Upstream (avg return ~20%)– Conventional work programs – U.S. tight oil– Deepwater - Guyana, Brazil– LNG - PNG, Mozambique
Billion USD
See supplemental information

662018 Analyst Meeting
0
80
2013 2014 2015 2016 2017 2018 2019
Relentlessly focused on the fundamentals
Operating costs
-$11BBillion USD
New business
See supplemental information
Workforce lost-time incident rate1
0.0
0.1
0.2
2012 2013 2014 2015 2016 2017
Employee and contractor lost-time incidents per 200K hours
ExxonMobil
Industry
1Source: American Petroleum Institute. 2017 industry data not available.

672018 Analyst Meeting
AA+/Aaa
AA-/Aa2
A+/Aa2
A+/Aa3A-/A1
0
200
400
5% 15% 25%
Ability to pursue attractive opportunities
Leverage, year-end 2017Total capitalization
Leverage
TOT
CVX
RDS
BP
Billion USD
• Competitively advantaged balance sheet
• Attractive terms for accessing capital
• Flexibility to capture opportunities across price cycle
Total capitalization defined as “net debt + market capitalization”; leverage defined as “net debt / total capitalization”
See supplemental information


692018 Analyst Meeting
• Managing to long-term fundamentals
• Reliably growing cash dividend
• Capturing opportunities across price cycle
• Maintaining financial flexibility
• Returning excess cash to shareholders
Committed to growing shareholder value

702018 Analyst Meeting
0
16
35BP
TOT
2025
2020
Growing shareholder valueAverage annual ROCE 2015 - 2017%
Average earnings 2015 - 2017 (Billion USD)See supplemental information
RDSCVX

712018 Analyst Meeting
Discussion

722018 Analyst Meeting
Backup

732018 Analyst Meeting
Supplemental informationImportant information and assumptions regarding certain forward-looking statements. Forward-looking statements contained in this presentation regarding future earnings, cash flow, project returns, and return on average capital employed (ROCE) are not forecasts of actual future results. These figures are provided to help quantify the targeted future results and goals of currently-contemplated management plans and initiatives including new project investments, plans to grow profitable Upstream production volumes, plans to increase sales in our Downstream and Chemical segments and to shift our Downstream product mix toward higher-value products, continued high-grading of ExxonMobil’s portfolio through our ongoing asset management program, initiatives to improve efficiencies and reduce costs, and other efforts within management’s control to impact future results as discussed in this presentation. These figures are intended to quantify for illustrative purposes management’s targets for these efforts over the time periods shown, calculated on a basis consistent with our internal modelling assumptions for factors such as working capital and capital structure, as well as factors management does not control, such as interest and exchange rates.
For all price point comparisons, unless otherwise indicated, crude prices and product margins are on a flat real basis. For 2017 crude oil prices we used $53/bbl Brent. Where price is not stated, we assume a $60/bbl Brent for future periods. These prices are not intended to reflect management’s forecast for future prices or the prices we use for internal planning purposes. For natural gas, except as otherwise explicitly noted in this presentation, we have used management’s internal planning prices for the relevant natural gas markets. We have assumed that Downstream product margins remain at 2017 levels. We have assumed Chemical margins reflect gas and market conditions. At $60/bbl Brent, we have assumed Chemical margins reflect 2017 margins. We have also assumed that other factors such as laws and regulations, including tax and environmental laws, and fiscal regimes remain consistent with current conditions for the relevant periods and that asset sales are consistent with historical levels.
See the Cautionary Statement at the front of this presentation for additional information regarding forward-looking statements.

742018 Analyst Meeting
(millions of dollars) Upstream Downstream Chemical Corporate and
Financing Corporate
Total
Earnings (U.S. GAAP) 13,355 5,597 4,518 (3,760) 19,710
U.S. tax reform 7,122 618 335 (2,133) 5,942
Impairments (1,504) (17) - - (1,521)
Earnings excluding U.S. tax reform and impairments 7,737 4,996 4,183 (1,627) 15,289
Supplemental informationNon-GAAP and other measures. In this presentation, earnings excluding effects of tax reform and impairments, free cash flow, return on average capital employed (ROCE), and operating costs are non-GAAP measures. With respect to historical periods, reconciliation information is included with the relevant definition below or as noted below in the Frequently Used Terms available on the Investors page of our website at www.exxonmobil.com. For future periods, we are unable to provide a reconciliation of forward-looking non-GAAP measures to the most comparable GAAP financial measures because the information needed to reconcile these measures is dependent on future events, many of which are outside management’s control as described above. Additionally, estimating such GAAP measures to provide a meaningful reconciliation consistent with our accounting policies for future periods is extremely difficult and requires a level of precision that is unavailable for these future periods and cannot be accomplished without unreasonable effort. Forward-looking non-GAAP measures are estimated in a manner consistent with the relevant definitions and assumptions noted above.
Definitions and non-GAAP financial measure reconciliations
Downstream operating expenses. Downstream operating expenses consist of segment operating costs at constant foreign exchange rates and energy prices.
Earnings excluding effects of tax reform and impairments. The table below reconciles 2017 earnings excluding effects of tax reform and impairments used in this presentation to 2017 U.S. GAAP earnings:

752018 Analyst Meeting
Supplemental informationThe following table reconciles U.S. Upstream earnings excluding effects of U.S. tax reform in 2017 and impairments in 2016 and 2017 to U.S. GAAP earnings.
Free cash flow. The definition of free cash flow is provided in our Frequently Used Terms available on the Investors page of our website at www.exxonmobil.com.
Kearl unit cash operating costs ($/bbl). Kearl’s portion of operating costs, excluding depreciation and depletion, using net production as the divisor.
(millions of dollars) 2016 2017
U.S. Upstream Earnings (U.S. GAAP) (4,151) 6,622
U.S. tax reform - 7,602
Impairments (2,163) (521)
Earnings excluding U.S. tax reform and impairments (1,988) (459)

762018 Analyst Meeting
Supplemental informationOperating costs. For information concerning the calculation and reconciliation of operating costs see the Frequently Used Terms available on the Investors page of our website at www.exxonmobil.com.
Project. The term “project” as used in this presentation can refer to a variety of different activities and does not necessarily have the same meaning as in any government payment transparency reports.
Return on average capital employed (ROCE). For information concerning the calculation of average capital employed and ROCE for historical periods, see the Frequently Used Terms on the Investors page of our website at www.exxonmobil.com. The following table shows the calculation of ROCE based on earnings excluding U.S. tax reform and impairments:
(millions of dollars) 2017
Earnings (U.S. GAAP) 19,710
U.S. tax reform 5,942
Impairments (1,521)
Earnings excluding U.S. tax reform and impairments 15,289
Total financing costs (398)
Earnings excluding U.S. tax reform and financing costs 15,687
Average capital employed 222,631
Return on average capital employed 7.0%

772018 Analyst Meeting
Supplemental informationResources, resource base, recoverable resources. These and similar terms include quantities of oil and gas that are not yet classified as proved reserves under SEC definitions but that are expected to be moved into the proved reserves category and produced in the future. Proved reserve figures are determined in accordance with SEC definitions in effect at the end of each applicable year. The term “resource base” or the terms “design / develop” or “evaluating” as used to describe resources are not intended to correspond to SEC definitions such as “probable” or “possible” reserves. The term “in-place” refers to those quantities of oil and gas estimated to be contained in known accumulations and includes recoverable and unrecoverable amounts. “Net resource potential” amounts are not currently included in the resource base.
Returns, investment returns, project returns. Unless referring specifically to ROCE, references to returns, investment returns, project returns, and similar terms mean discounted cash flow returns based on current company estimates. Future investment returns exclude prior exploration and acquisition costs.
Upstream operating cash costs. Upstream operating cash costs are the sum of operations, maintenance, wellwork, exploration, support, administrative, and management costs, which represent major costs under management control. This does not include energy costs, production taxes, and certain non-routine expenses, such as dry hole expense associated with the relinquishment of exploration leasehold, remediation charges for sold assets, and other financial reserves.
(millions of dollars) 2017 2016 2015 2014
Field operations and maintenance 10,404 9,957 11,516 12,984
Wellwork and exploration expense 898 996 1,073 1,599
Support, administrative, and management costs 4,442 4,702 5,224 5,657
Upstream operating cash costs 15,744 15,655 17,813 20,240

782018 Analyst Meeting
Supplemental informationOther information
All references to production rates and project capacity are on a gross basis, unless otherwise noted. References to resource size are on a net basis, unless otherwise noted.
Competitor data is based on publicly available information and, where estimated or derived (e.g., ROCE), done so on a consistent basis with ExxonMobil data. We note that certain competitors report financial information under accounting standards other than U.S. GAAP (i.e., IFRS).

792018 Analyst Meeting
Reference material

802018 Analyst Meeting
Energy Outlook guides business strategy
0
250
500
750
Quadrillion BTUs
1.4%
-0.1%
OECDNon-OECDTotal
2040
2016
Average Growth/Year2016 to 2040
0.9%
Global energy demand
• Non-OECD nations drive growth in GDP and energy demand
• Middle class grows about 80 percent by 2030 to reach more than 5 billion people
• Non-OECD energy use per person remains well below OECD
• Efficiency gains keep OECD demand flat
• Without efficiency gains, global demand growth could be four times projected amount
Long-term view of supply and demand informs investment plans
Source: ExxonMobil 2018 Outlook for Energy: A View to 2040.

812018 Analyst Meeting
Energy Outlook guides business strategy
0
50
100
150
200
250
Oil Gas Coal OtherRenewable1
1.3%
-0.1%
2.3%
Nuclear
0.7%Average Growth/Year
2016 to 20402040
2016
Solar &Wind
6.3%
0.6%
Quadrillion BTUs
Global energy demand
• Oil and natural gas lead growth as energy mix evolves
• Higher oil demand driven by commercial transportation and chemicals
• Strong growth in natural gas led by power generation and industrial demand
• Global LNG trade supplies one-third of natural gas demand growth from 2016 - 2040
• Energy-related CO2 outlook consistent with aggregation of Paris agreement Nationally Determined Contributions
All forms of energy are required to meet global energy demand
1Other Renewable includes hydro, geothermal, biofuels, and biomass.
822018 Analyst Meeting
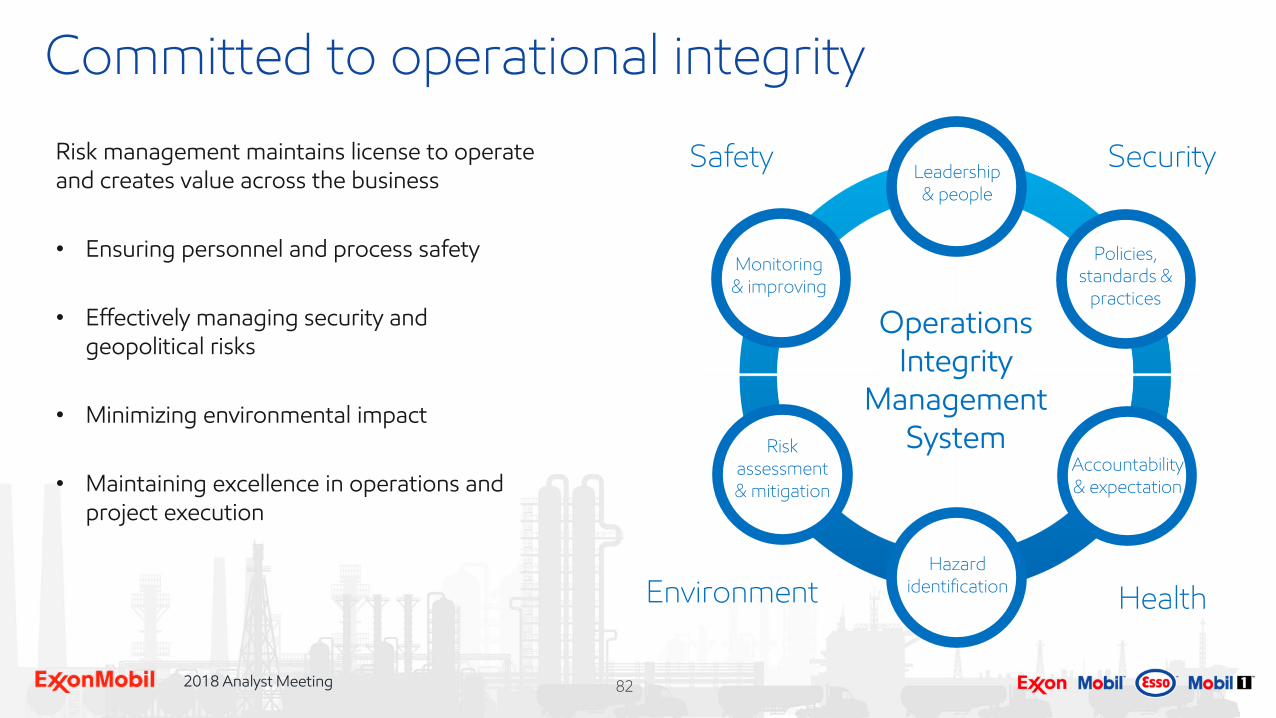
Committed to operational integrity
Operations Integrity
Management System
Safety Security
Environment Health
Leadership& people
Policies,standards &
practices
Accountability & expectation
Hazardidentification
Risk assessment & mitigation
Monitoring & improving
Risk management maintains license to operate and creates value across the business
• Ensuring personnel and process safety
• Effectively managing security and geopolitical risks
• Minimizing environmental impact
• Maintaining excellence in operations and project execution

832018 Analyst Meeting
2017 results
• Leading safety performance
• Earnings $19.7B
• ROCE 9.0%
• Cash flow from operations and asset sales $33.2B
• Capex $23.1B
• Dividends paid to shareholders $13.0B0.0
0.1
0.2
2012 2013 2014 2015 2016 2017
Workforce lost-time incident rate1
Employee and contractor lost-time incidents per 200K hours
Industry
ExxonMobil
Demonstrates strength of integrated business
1Source: American Petroleum Institute. 2017 industry data not available.

842018 Analyst Meeting
Outperform peers over long term
0
20
XOM CVX RDS TOT BP
Return on average capital employed
%
• Best investment opportunities since merger
• ROCE of ~15% in 2025 at $60/bbl real2017
2013 - 2017 average
2008 - 2017 average
See supplemental information