Embed Size (px)
Citation preview
News Release
Exxon Mobil Corporation
5959 Las Colinas Boulevard Irving, TX 75039 972 940 6007 Telephone 972 940 6143 Facsimile
FOR IMMEDIATE RELEASE FRIDAY, APRIL 27, 2018
ExxonMobil Earnings Increase 16 Percent to $4.7 Billion in First Quarter 2018
• Positive U.S. Upstream earnings of $429 million • Highest quarterly cash flow from operations and asset sales since 2014 • Rapid response and recovery from Papua New Guinea earthquake
First First Fourth
Quarter Quarter Quarter
2018 2017 % 2017 %
Earnings Summary (Dollars in millions, except per share data)
Earnings (U.S. GAAP) 4,650 4,010 16 8,380 -45
U.S. Tax Reform Enactment - - 5,942
Asset Impairments - - (1,294)
Earnings Excluding U.S. Tax
Reform Enactment and Impairments 4,650 4,010 16 3,732 25
Earnings Per Common Share
Assuming Dilution 1.09 0.95 15 1.97 -45
Capital and Exploration
Expenditures 4,867 4,169 17 8,999 -46
IRVING, Texas – April 27, 2018 – Exxon Mobil Corporation today announced estimated first quarter 2018 earnings of $4.7 billion, or $1.09 per share assuming dilution, compared with $4 billion a year earlier. Cash flow from operations and asset sales was $10 billion, including proceeds associated with asset sales of $1.4 billion. During the quarter, the corporation distributed $3.3 billion in dividends to shareholders. Capital and exploration expenditures were $4.9 billion, up 17 percent from the prior year. Oil-equivalent production was 3.9 million barrels per day, down 6 percent from the first quarter of 2017. Excluding entitlement effects and divestments, oil-equivalent production was down 3 percent from the first quarter of 2017.
“Increased commodity prices, coupled with a focus on operating efficiently and strengthening our portfolio, resulted in higher earnings and the highest quarterly cash flow from operations and asset sales since 2014,” said Darren W. Woods, chairman and chief executive officer. “Through new discoveries and acquired acreage, we’ve positioned our Upstream portfolio well for future growth. We also made good progress on our plans to improve the production mix and grow premium product sales in the Downstream and Chemical businesses.”
2
First Quarter 2018 Business Highlights Upstream: • Crude and natural gas prices strengthened in the first quarter. ExxonMobil’s crude realizations were
impacted by an increased discount in Western Canada, notably for heavy crudes, as Canadian supply exceeded pipeline and rail capacity. The logistics constraints in Canada supported the decision to accelerate Syncrude turnaround activities into the first quarter.
• Natural gas prices were supported by strong seasonal demand with colder weather across Europe and the U.S. and higher crude-linked LNG prices.
• As expected, higher prices reduced entitlement volumes.
• Following a severe earthquake in Papua New Guinea on February 26, operations at the PNG LNG project were temporarily shut down while the company responded with humanitarian relief for impacted communities and worked to fully restore operations. The project safely resumed LNG production ahead of schedule in mid-April. The impact of the earthquake reduced earnings by $80 million and production by 25,000 oil-equivalent barrels per day.
• The Hebron field in Canada, which started up last year, has ramped up to produce 14,000 oil-equivalent barrels per day in the first quarter with well performance exceeding expectations.
• Development of the company’s U.S. unconventional acreage is progressing with 27 operated rigs in the Permian and four operated rigs in the Bakken. Permian and Bakken unconventional production has experienced 18 percent growth year-over-year.
Downstream: • Global refining margins remained generally strong, especially in North America. Petroleum product
demand was seasonally lower.
• Overall manufacturing reliability improved from one-time fourth quarter events. A significant focus during the quarter was on returning the refinery in Joliet, Ill., back to full capacity in March, capturing attractive margins on weaker Canadian crude prices.
Chemical: • ExxonMobil continued to make significant progress in growing the business. The integration of Jurong
Aromatics Corporation into the existing Singapore business is progressing as planned, contributing 340,000 metric tons of sales during the quarter.
• The North America Growth project is also progressing well with the new polyethylene lines in Mont Belvieu, Texas, increasing sales volumes in the quarter.
• As expected, incremental activity associated with startup and commissioning of these new facilities increased expenses during the quarter.
• Within the base business, large planned turnarounds in the Middle East and the Gulf Coast were successfully completed.
3
Strengthening the Portfolio • ExxonMobil announced its seventh oil discovery offshore Guyana with the completion of the Pacora-1
exploration well. The well encountered approximately 65 feet (20 meters) of high-quality, oil-bearing sandstone reservoir.
• During the quarter, the company increased its holdings in Brazil’s pre-salt basins after winning eight additional exploration blocks, six of them to be operated by ExxonMobil, during the latest bid round. The company added more than 640,000 net acres to its existing deepwater portfolio offshore Brazil, and is now one of the largest acreage holders among international oil companies in the country.
• ExxonMobil announced that its estimate of the size of the natural gas resource at the P’nyang field in Papua New Guinea (PNG) has increased to 4.36 trillion cubic feet of gas, an 84 percent increase from the previous assessment completed in 2012. This increase, based on an independent recertification study, supports a potential three-train expansion concept of the PNG LNG plant.
• ExxonMobil sold its 50 percent ownership interest in the Scarborough gas field, offshore Western Australia, to Woodside Petroleum Ltd. In the Downstream, the company closed several divestments, including distribution and marketing assets in South America, and retail sites in Europe.
• During the quarter, ExxonMobil added to its exploration portfolio offshore West Africa by signing an agreement with the government of Ghana to acquire exploration and production rights for the Deepwater Cape Three Points block. ExxonMobil also signed an agreement with a subsidiary of Galp Energia, SGPS, S.A. for a 40 percent farm-in to a deepwater license offshore Namibia. Both agreements are subject to government approvals.
Investing for Growth • The company began commissioning its new ethane cracker in Baytown, Texas. The cracker, expected
to start up mid-year 2018, will produce 1.5 million metric tons per year of ethylene feedstock for the new polyethylene lines at the company’s plastics plant in Mont Belvieu, Texas.
• The company also continued its entry into Mexico’s fuels market with the opening of new Mobil-branded service stations operated by Grupo Orsan and Grupo Combured. The new stations will be supplied with gasoline and diesel produced by ExxonMobil’s refineries in Texas.
Advancing Innovative Technologies and Products • During the quarter, ExxonMobil and Synthetic Genomics, Inc. announced a new phase in their joint
algae biofuel research program that could lead to the technical ability to produce 10,000 barrels of algae biofuel per day by 2025.
4
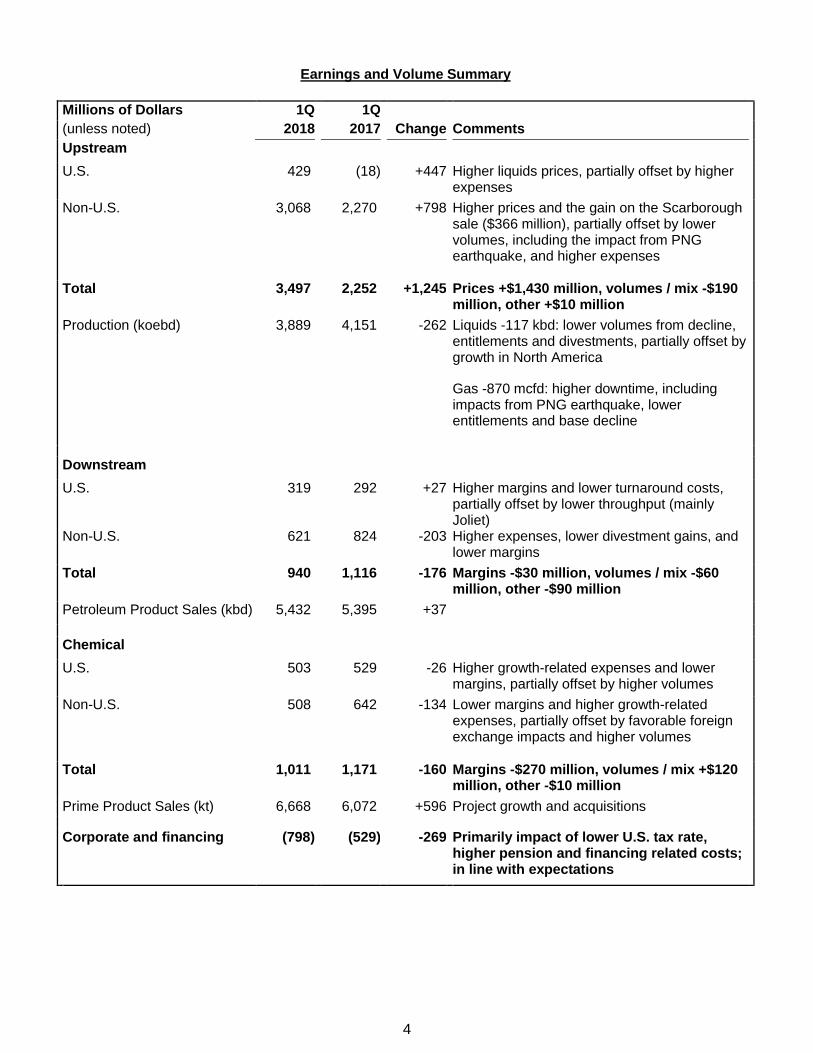
Earnings and Volume Summary
Millions of Dollars 1Q 1Q
(unless noted) 2018 2017 Change Comments
Upstream
U.S. 429 (18) +447 Higher liquids prices, partially offset by higher expenses
Non-U.S. 3,068 2,270 +798 Higher prices and the gain on the Scarborough sale ($366 million), partially offset by lower volumes, including the impact from PNG earthquake, and higher expenses
Total 3,497 2,252 +1,245 Prices +$1,430 million, volumes / mix -$190 million, other +$10 million
Production (koebd) 3,889 4,151 -262 Liquids -117 kbd: lower volumes from decline, entitlements and divestments, partially offset by growth in North America Gas -870 mcfd: higher downtime, including impacts from PNG earthquake, lower entitlements and base decline
Downstream
U.S. 319 292 +27 Higher margins and lower turnaround costs, partially offset by lower throughput (mainly Joliet)
Non-U.S. 621 824 -203 Higher expenses, lower divestment gains, and lower margins
Total 940 1,116 -176 Margins -$30 million, volumes / mix -$60 million, other -$90 million
Petroleum Product Sales (kbd) 5,432 5,395 +37
Chemical
U.S. 503 529 -26 Higher growth-related expenses and lower margins, partially offset by higher volumes
Non-U.S. 508 642 -134 Lower margins and higher growth-related expenses, partially offset by favorable foreign exchange impacts and higher volumes
Total 1,011 1,171 -160 Margins -$270 million, volumes / mix +$120 million, other -$10 million
Prime Product Sales (kt) 6,668 6,072 +596 Project growth and acquisitions
Corporate and financing (798) (529) -269 Primarily impact of lower U.S. tax rate, higher pension and financing related costs; in line with expectations
5
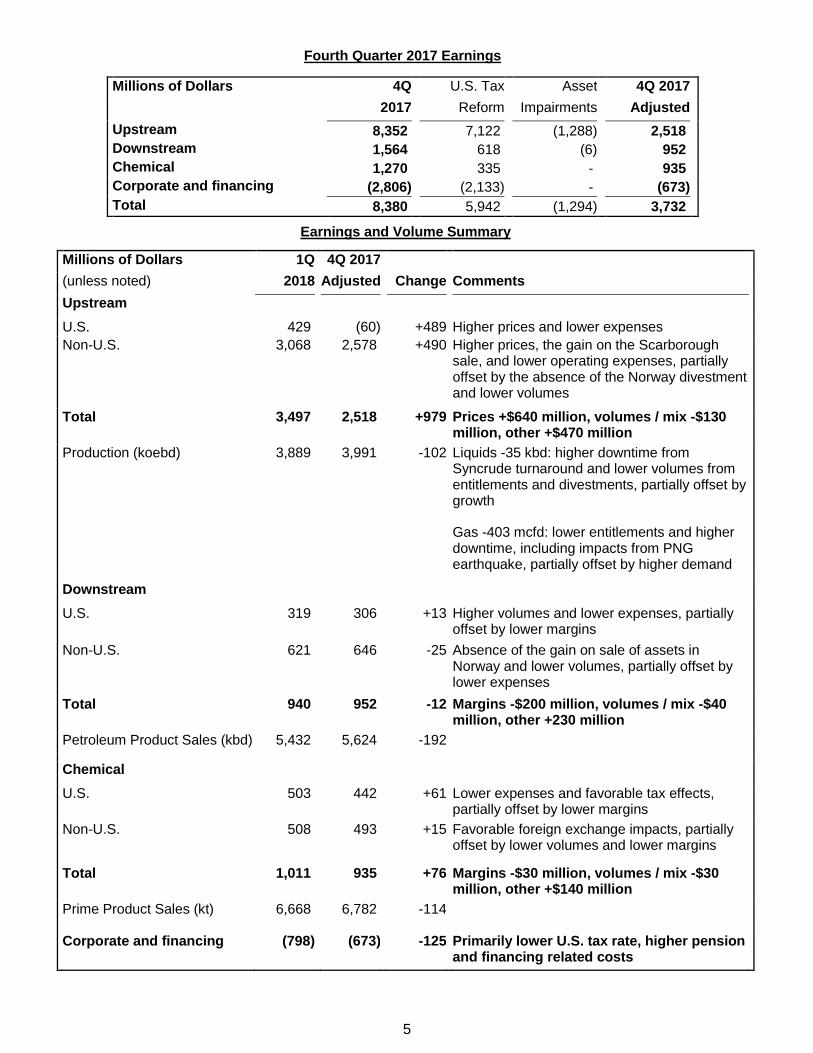
Fourth Quarter 2017 Earnings
Millions of Dollars 4Q U.S. Tax Asset 4Q 2017
2017 Reform Impairments Adjusted
Upstream 8,352 7,122 (1,288) 2,518
Downstream 1,564 618 (6) 952
Chemical 1,270 335 - 935
Corporate and financing (2,806) (2,133) - (673)
Total 8,380 5,942 (1,294) 3,732
Earnings and Volume Summary
Millions of Dollars 1Q 4Q 2017
(unless noted) 2018 Adjusted Change Comments
Upstream
U.S. 429 (60) +489 Higher prices and lower expenses
Non-U.S. 3,068 2,578 +490 Higher prices, the gain on the Scarborough sale, and lower operating expenses, partially offset by the absence of the Norway divestment and lower volumes
Total 3,497 2,518 +979 Prices +$640 million, volumes / mix -$130 million, other +$470 million
Production (koebd) 3,889 3,991 -102 Liquids -35 kbd: higher downtime from Syncrude turnaround and lower volumes from entitlements and divestments, partially offset by growth
Gas -403 mcfd: lower entitlements and higher downtime, including impacts from PNG earthquake, partially offset by higher demand
Downstream
U.S. 319 306 +13 Higher volumes and lower expenses, partially offset by lower margins
Non-U.S. 621 646 -25 Absence of the gain on sale of assets in Norway and lower volumes, partially offset by lower expenses
Total 940 952 -12 Margins -$200 million, volumes / mix -$40 million, other +230 million
Petroleum Product Sales (kbd) 5,432 5,624 -192
Chemical
U.S. 503 442 +61 Lower expenses and favorable tax effects, partially offset by lower margins
Non-U.S. 508 493 +15 Favorable foreign exchange impacts, partially offset by lower volumes and lower margins
Total 1,011 935 +76 Margins -$30 million, volumes / mix -$30 million, other +$140 million
Prime Product Sales (kt) 6,668 6,782 -114
Corporate and financing (798) (673) -125 Primarily lower U.S. tax rate, higher pension and financing related costs
6
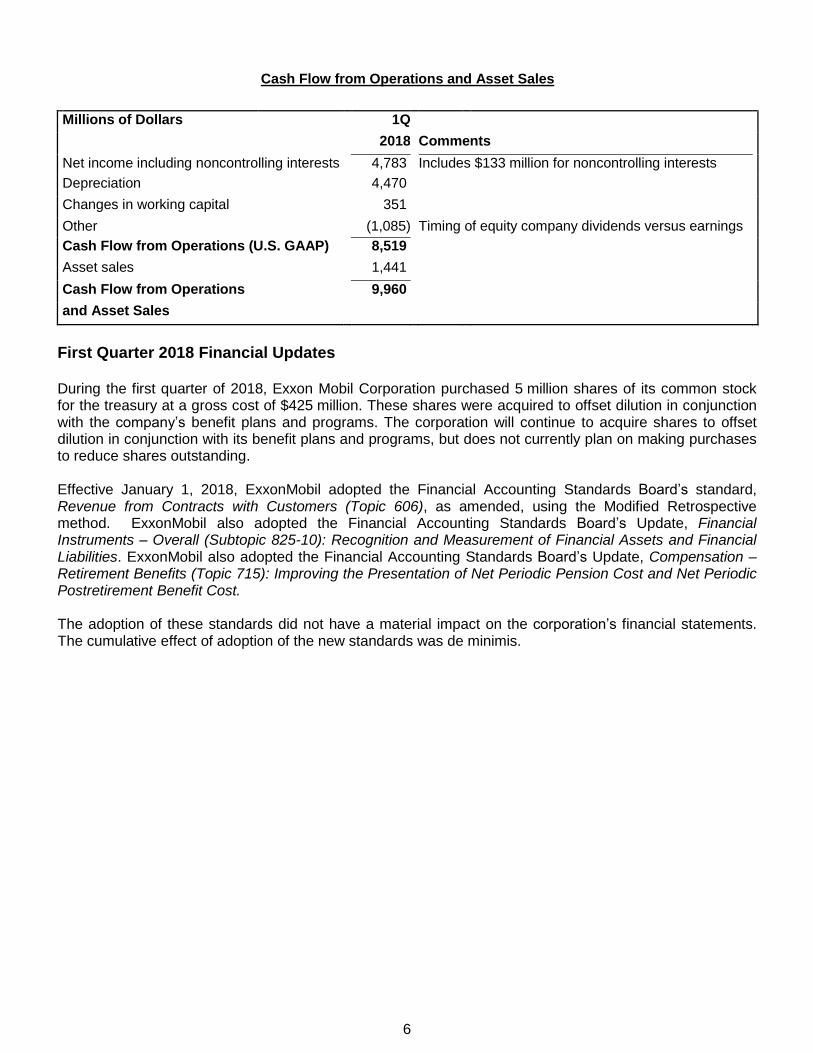
Cash Flow from Operations and Asset Sales
Millions of Dollars 1Q
2018 Comments
Net income including noncontrolling interests 4,783 Includes $133 million for noncontrolling interests
Depreciation 4,470
Changes in working capital 351
Other (1,085) Timing of equity company dividends versus earnings
Cash Flow from Operations (U.S. GAAP) 8,519
Asset sales 1,441
Cash Flow from Operations 9,960
and Asset Sales
First Quarter 2018 Financial Updates During the first quarter of 2018, Exxon Mobil Corporation purchased 5 million shares of its common stock for the treasury at a gross cost of $425 million. These shares were acquired to offset dilution in conjunction with the company’s benefit plans and programs. The corporation will continue to acquire shares to offset dilution in conjunction with its benefit plans and programs, but does not currently plan on making purchases to reduce shares outstanding. Effective January 1, 2018, ExxonMobil adopted the Financial Accounting Standards Board’s standard, Revenue from Contracts with Customers (Topic 606), as amended, using the Modified Retrospective method. ExxonMobil also adopted the Financial Accounting Standards Board’s Update, Financial Instruments – Overall (Subtopic 825-10): Recognition and Measurement of Financial Assets and Financial Liabilities. ExxonMobil also adopted the Financial Accounting Standards Board’s Update, Compensation – Retirement Benefits (Topic 715): Improving the Presentation of Net Periodic Pension Cost and Net Periodic Postretirement Benefit Cost. The adoption of these standards did not have a material impact on the corporation’s financial statements. The cumulative effect of adoption of the new standards was de minimis.
7
ExxonMobil will discuss financial and operating results and other matters during a webcast at 8:30 a.m. Central Time on April 27, 2018. To listen to the event or access an archived replay, please visit www.exxonmobil.com.
Cautionary Statement
Statements relating to future plans, projections, events or conditions are forward-looking statements. Future results, including project plans, costs, timing, and capacities; business growth; integration benefits; resource recoveries; the impact of new technologies; and share purchase levels, could differ materially due to factors including: changes in oil, gas or petrochemical prices or other market or economic conditions affecting the oil, gas or petrochemical industries, including the scope and duration of economic recessions; the outcome of exploration and development efforts; timely completion of new projects; changes in law or government regulation, including tax and environmental requirements; the impact of fiscal and commercial terms and outcome of commercial negotiations; the results of research programs; changes in technical or operating conditions; actions of competitors; and other factors discussed under the heading “Factors Affecting Future Results” in the “Investors” section of our website and in Item 1A of ExxonMobil’s 2017 Form 10-K. We assume no duty to update these statements as of any future date.
Frequently Used Terms and Non-GAAP Measures
This press release includes cash flow from operations and asset sales. Because of the regular nature of our asset management and divestment program, we believe it is useful for investors to consider proceeds associated with the sales of subsidiaries, property, plant and equipment, and sales and returns of investments together with cash provided by operating activities when evaluating cash available for investment in the business and financing activities. A reconciliation to net cash provided by operating activities is shown in Attachment V. This press release also includes earnings excluding impacts from U.S. tax reform enactment and asset impairments. We believe these figures are useful for investors to consider in comparing the performance of our underlying business across periods when one, or both, periods have been impacted by the U.S. tax reform or an asset impairment charge. A reconciliation of earnings excluding these items to U.S. GAAP earnings is shown in Attachment II. This press release also includes total taxes including sales-based taxes. This is a broader indicator of the total tax burden on the corporation’s products and earnings, including certain sales and value-added taxes imposed on and concurrent with revenue-producing transactions with customers and collected on behalf of governmental authorities (“sales-based taxes”). It combines “Income taxes” and “Total other taxes and duties” with sales-based taxes, which are reported net in the income statement. We believe it is useful for the corporation and its investors to understand the total tax burden imposed on the corporation’s products and earnings. A reconciliation to total taxes is shown in Attachment I. References to the resource base and other quantities of oil, natural gas or condensate may include amounts that are not yet classified as “proved reserves” under SEC definitions, but which we believe will likely be moved into the “proved reserves” category and produced in the future. The term “project” as used in this release can refer to a variety of different activities and does not necessarily have the same meaning as in any government payment transparency reports. Further information on ExxonMobil’s frequently used financial and operating measures and other terms including “Cash flow from operations and asset sales”, and “Total taxes including sales-based taxes” is contained under the heading “Frequently Used Terms” available through the “Investors” section of our website at exxonmobil.com.
Reference to Earnings
References to corporate earnings mean net income attributable to ExxonMobil (U.S. GAAP) from the consolidated income statement. Unless otherwise indicated, references to earnings, Upstream, Downstream, Chemical and Corporate and financing segment earnings, and earnings per share are ExxonMobil’s share after excluding amounts attributable to noncontrolling interests.

8
Exxon Mobil Corporation has numerous affiliates, many with names that include ExxonMobil, Exxon, Mobil, Esso, and XTO. For convenience and simplicity, those terms and terms such as corporation, company, our, we, and its are sometimes used as abbreviated references to specific affiliates or affiliate groups. Similarly, ExxonMobil has business relationships with thousands of customers, suppliers, governments, and others. For convenience and simplicity, words such as venture, joint venture, partnership, co-venturer, and partner are used to indicate business and other relationships involving common activities and interests, and those words may not indicate precise legal relationships.
9
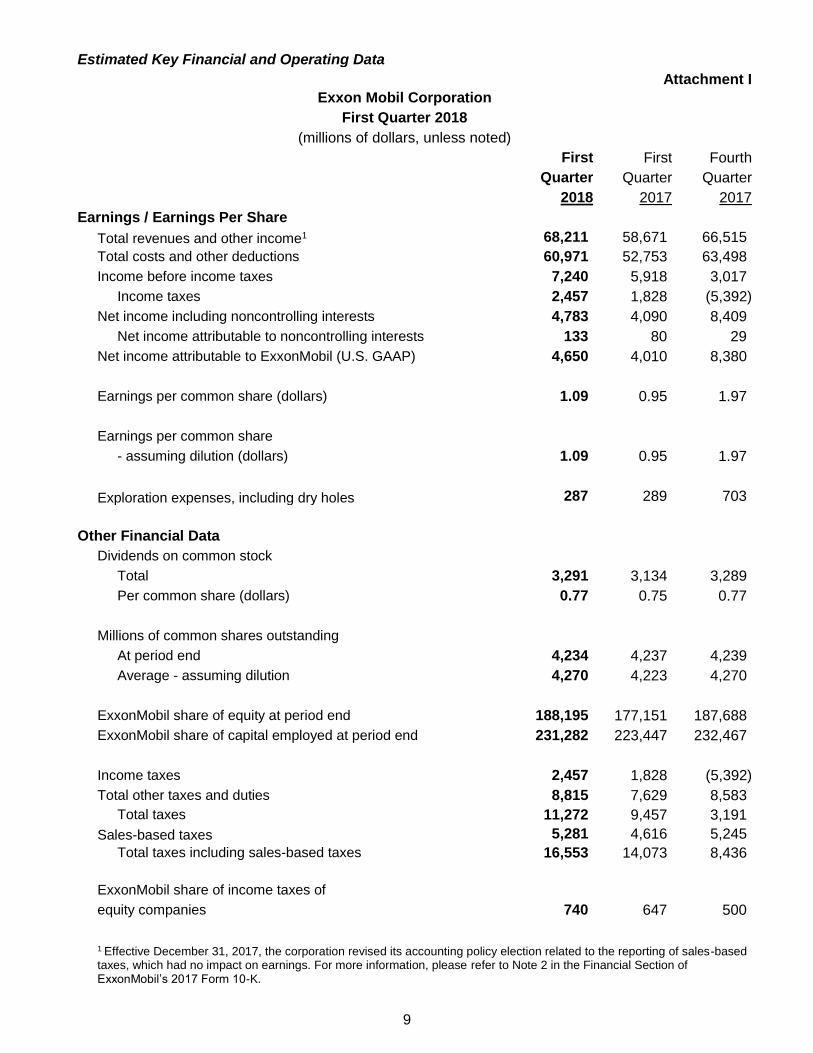
Estimated Key Financial and Operating Data
Attachment I
Exxon Mobil Corporation
First Quarter 2018
(millions of dollars, unless noted)
First First Fourth
Quarter Quarter Quarter
2018 2017 2017
Earnings / Earnings Per Share
Total revenues and other income1 68,211 58,671 66,515
Total costs and other deductions 60,971 52,753 63,498
Income before income taxes 7,240 5,918 3,017
Income taxes 2,457 1,828 (5,392)
Net income including noncontrolling interests 4,783 4,090 8,409
Net income attributable to noncontrolling interests 133 80 29
Net income attributable to ExxonMobil (U.S. GAAP) 4,650 4,010 8,380
Earnings per common share (dollars) 1.09 0.95 1.97
Earnings per common share
- assuming dilution (dollars) 1.09 0.95 1.97
Exploration expenses, including dry holes 287 289 703
Other Financial Data
Dividends on common stock
Total 3,291 3,134 3,289
Per common share (dollars) 0.77 0.75 0.77
Millions of common shares outstanding
At period end 4,234 4,237 4,239
Average - assuming dilution 4,270 4,223 4,270
ExxonMobil share of equity at period end 188,195 177,151 187,688
ExxonMobil share of capital employed at period end 231,282 223,447 232,467
Income taxes 2,457 1,828 (5,392)
Total other taxes and duties 8,815 7,629 8,583
Total taxes 11,272 9,457 3,191
Sales-based taxes 5,281 4,616 5,245
Total taxes including sales-based taxes 16,553 14,073 8,436
ExxonMobil share of income taxes of
equity companies 740 647 500
1 Effective December 31, 2017, the corporation revised its accounting policy election related to the reporting of sales-based taxes, which had no impact on earnings. For more information, please refer to Note 2 in the Financial Section of ExxonMobil’s 2017 Form 10-K.
10
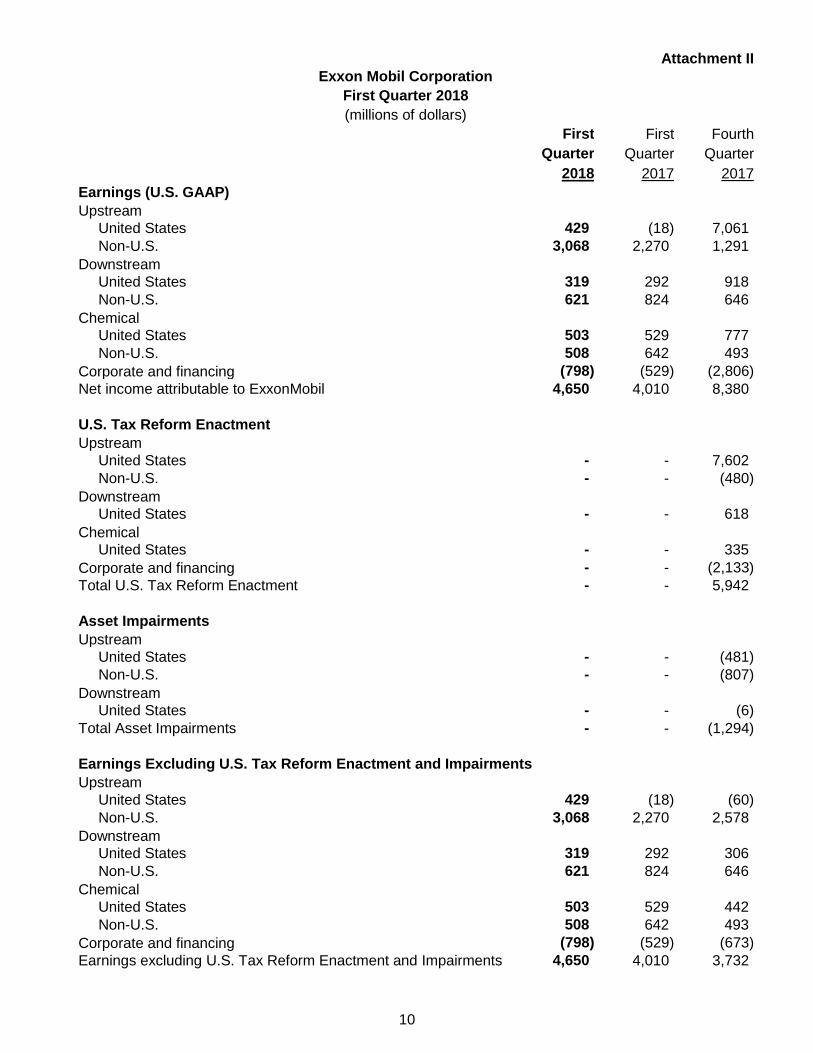
Attachment II
Exxon Mobil Corporation
First Quarter 2018
(millions of dollars)
First First Fourth
Quarter Quarter Quarter
2018 2017 2017
Earnings (U.S. GAAP)
Upstream
United States 429 (18) 7,061
Non-U.S. 3,068 2,270 1,291
Downstream
United States 319 292 918
Non-U.S. 621 824 646
Chemical
United States 503 529 777
Non-U.S. 508 642 493
Corporate and financing (798) (529) (2,806)
Net income attributable to ExxonMobil 4,650 4,010 8,380
U.S. Tax Reform Enactment
Upstream
United States - - 7,602
Non-U.S. - - (480)
Downstream
United States - - 618
Chemical
United States - - 335
Corporate and financing - - (2,133)
Total U.S. Tax Reform Enactment - - 5,942
Asset Impairments
Upstream
United States - - (481)
Non-U.S. - - (807)
Downstream
United States - - (6)
Total Asset Impairments - - (1,294)
Earnings Excluding U.S. Tax Reform Enactment and Impairments
Upstream
United States 429 (18) (60)
Non-U.S. 3,068 2,270 2,578
Downstream
United States 319 292 306
Non-U.S. 621 824 646
Chemical
United States 503 529 442
Non-U.S. 508 642 493
Corporate and financing (798) (529) (673)
Earnings excluding U.S. Tax Reform Enactment and Impairments 4,650 4,010 3,732
11
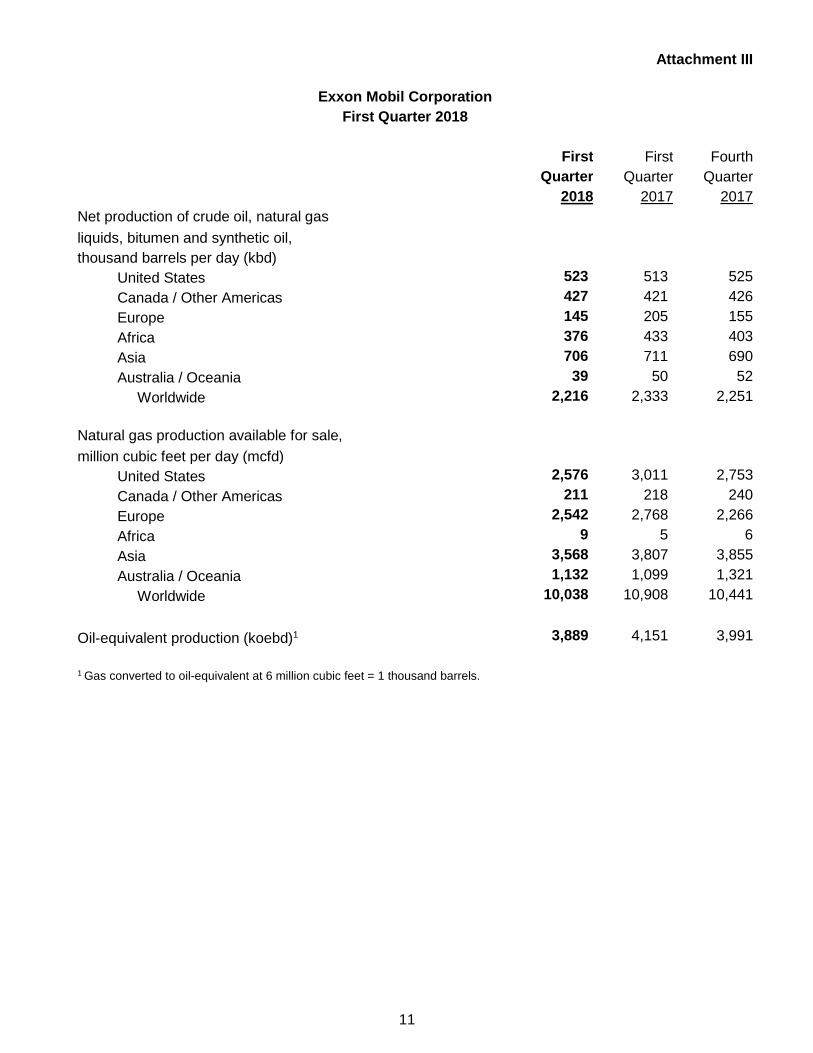
Attachment III
Exxon Mobil Corporation
First Quarter 2018
First First Fourth
Quarter Quarter Quarter
2018 2017 2017
Net production of crude oil, natural gas
liquids, bitumen and synthetic oil,
thousand barrels per day (kbd)
United States 523 513 525
Canada / Other Americas 427 421 426
Europe 145 205 155
Africa 376 433 403
Asia 706 711 690
Australia / Oceania 39 50 52
Worldwide 2,216 2,333 2,251
Natural gas production available for sale,
million cubic feet per day (mcfd)
United States 2,576 3,011 2,753
Canada / Other Americas 211 218 240
Europe 2,542 2,768 2,266
Africa 9 5 6
Asia 3,568 3,807 3,855
Australia / Oceania 1,132 1,099 1,321
Worldwide 10,038 10,908 10,441
Oil-equivalent production (koebd)1 3,889 4,151 3,991
1 Gas converted to oil-equivalent at 6 million cubic feet = 1 thousand barrels.
12
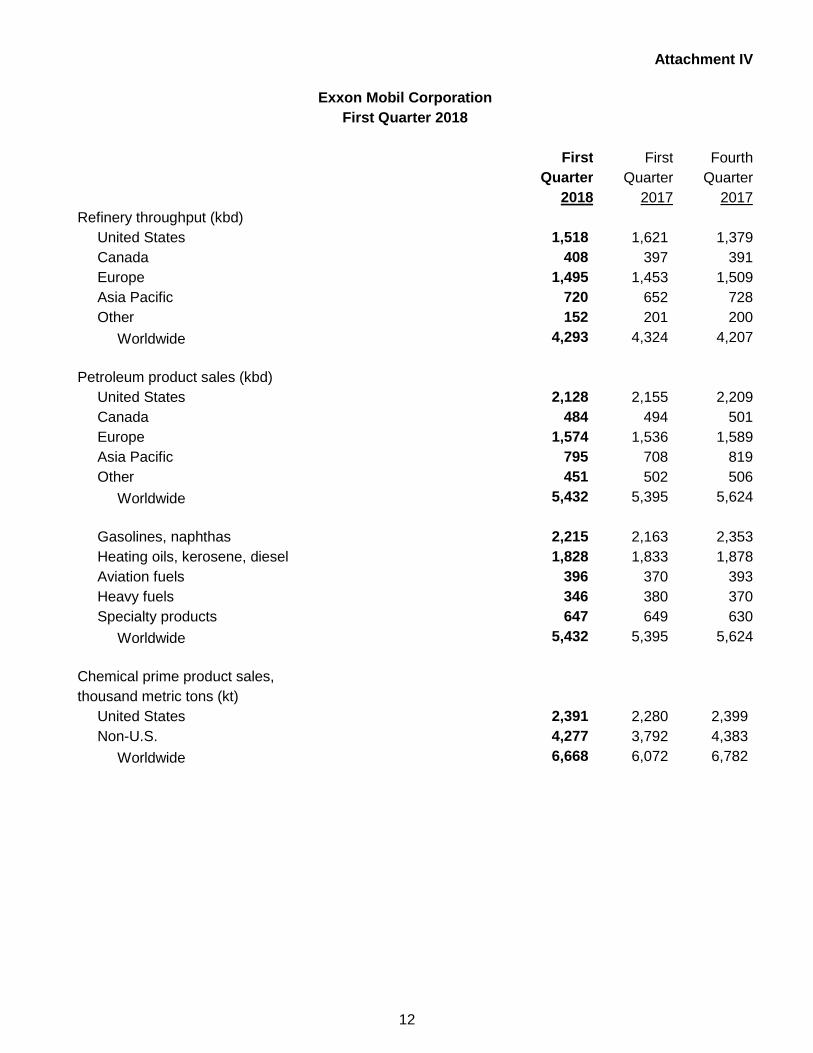
Attachment IV
Exxon Mobil Corporation
First Quarter 2018
First First Fourth
Quarter Quarter Quarter
2018 2017 2017
Refinery throughput (kbd)
United States 1,518 1,621 1,379
Canada 408 397 391
Europe 1,495 1,453 1,509
Asia Pacific 720 652 728
Other 152 201 200
Worldwide 4,293 4,324 4,207
Petroleum product sales (kbd)
United States 2,128 2,155 2,209
Canada 484 494 501
Europe 1,574 1,536 1,589
Asia Pacific 795 708 819
Other 451 502 506
Worldwide 5,432 5,395 5,624
Gasolines, naphthas 2,215 2,163 2,353
Heating oils, kerosene, diesel 1,828 1,833 1,878
Aviation fuels 396 370 393
Heavy fuels 346 380 370
Specialty products 647 649 630
Worldwide 5,432 5,395 5,624
Chemical prime product sales,
thousand metric tons (kt)
United States 2,391 2,280 2,399
Non-U.S. 4,277 3,792 4,383
Worldwide 6,668 6,072 6,782
13
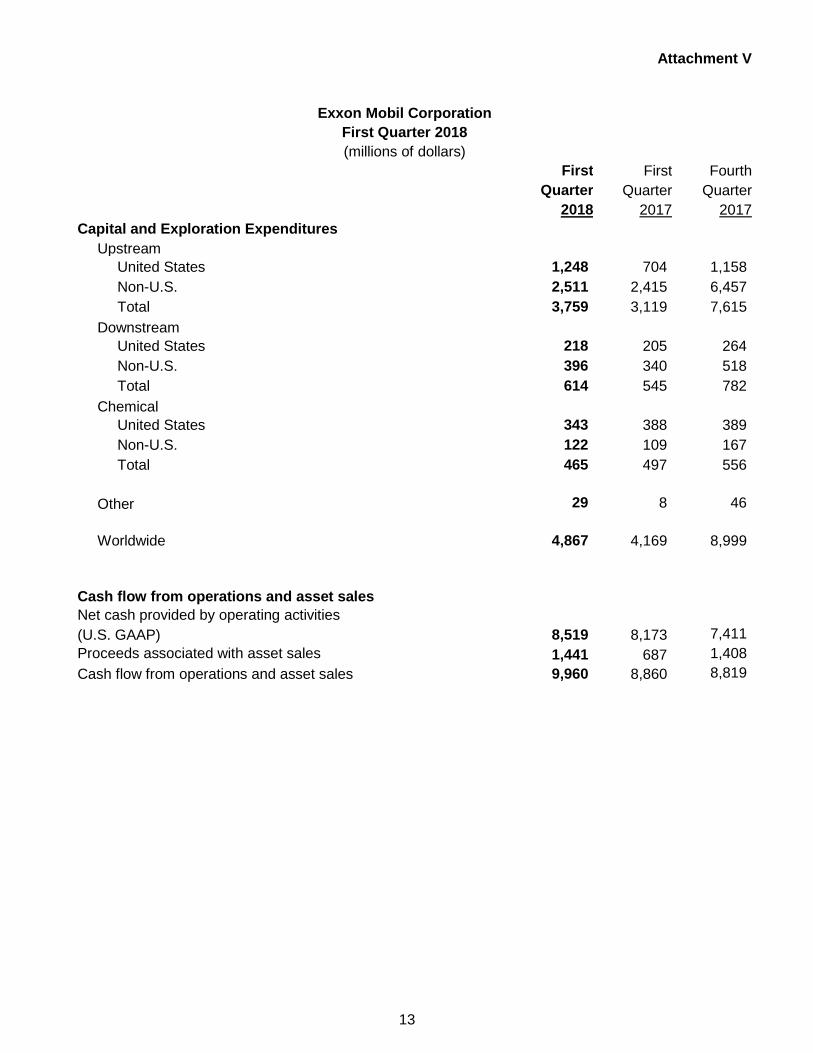
Attachment V
Exxon Mobil Corporation
First Quarter 2018
(millions of dollars)
First First Fourth
Quarter Quarter Quarter
2018 2017 2017
Capital and Exploration Expenditures
Upstream
United States 1,248 704 1,158
Non-U.S. 2,511 2,415 6,457
Total 3,759 3,119 7,615
Downstream
United States 218 205 264
Non-U.S. 396 340 518
Total 614 545 782
Chemical
United States 343 388 389
Non-U.S. 122 109 167
Total 465 497 556
Other 29 8 46
Worldwide 4,867 4,169 8,999
Cash flow from operations and asset sales
Net cash provided by operating activities
(U.S. GAAP) 8,519 8,173 7,411
Proceeds associated with asset sales 1,441 687 1,408
Cash flow from operations and asset sales 9,960 8,860 8,819
14
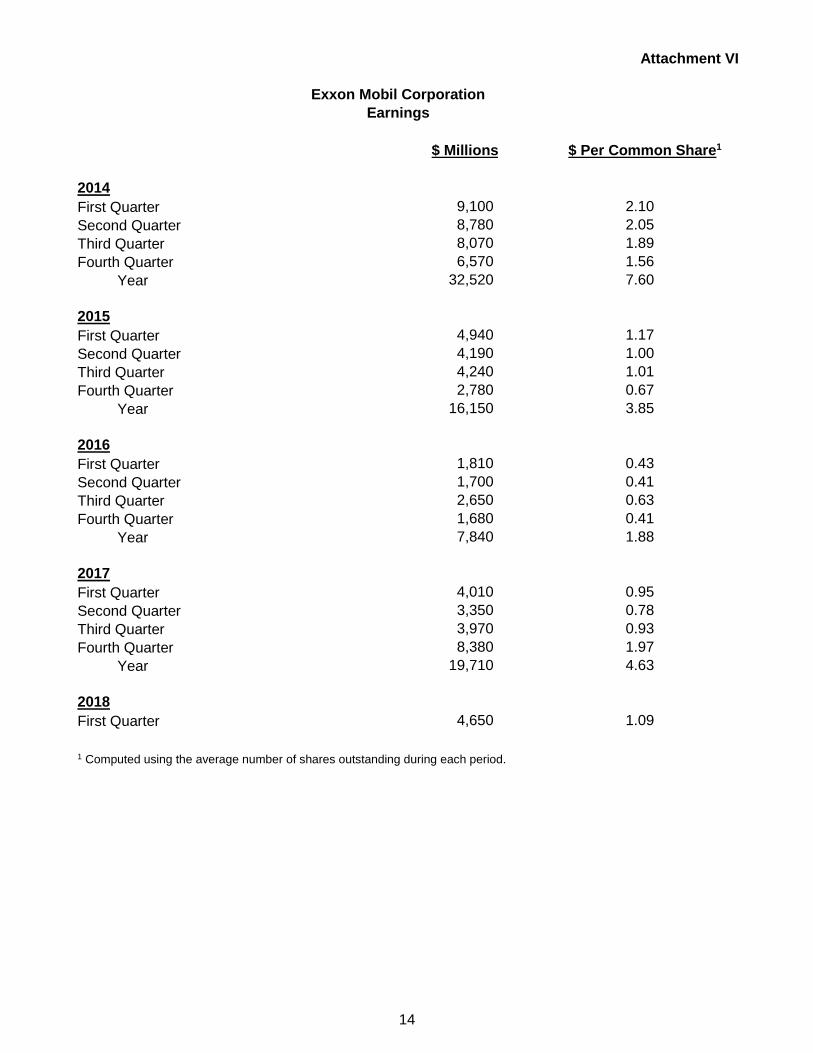
Attachment VI
Exxon Mobil Corporation
Earnings
$ Millions $ Per Common Share1
2014
First Quarter 9,100 2.10
Second Quarter 8,780 2.05
Third Quarter 8,070 1.89
Fourth Quarter 6,570 1.56
Year 32,520 7.60
2015
First Quarter 4,940 1.17
Second Quarter 4,190 1.00
Third Quarter 4,240 1.01
Fourth Quarter 2,780 0.67
Year 16,150 3.85
2016
First Quarter 1,810 0.43
Second Quarter 1,700 0.41
Third Quarter 2,650 0.63
Fourth Quarter 1,680 0.41
Year 7,840 1.88
2017
First Quarter 4,010 0.95
Second Quarter 3,350 0.78
Third Quarter 3,970 0.93
Fourth Quarter 8,380 1.97
Year 19,710 4.63
2018
First Quarter 4,650 1.09
1 Computed using the average number of shares outstanding during each period.

![Product Release Note Oracle FLEXCUBE Universal Banking Release · PDF fileProduct Release Note Oracle FLEXCUBE Universal Banking Release 12.0.2.0.0 [October] [2013] Product Release](https://img.pdfslide.us/doc/110x75/5ab76af57f8b9ad5338b88e3/product-release-note-oracle-flexcube-universal-banking-release-release-note.jpg)