Embed Size (px)
Citation preview
REPORT DOCUMENTATION PAGE Form Approved OMB No. 0704-0188
Public reporting burden for this collection of information is estimated to average 1 hour per response, including the time fo r reviewing instructions, searching existing data sources, gathering and maintaining the data needed, and completing and reviewing this collection of information. Send comments regarding this burden estimate or any other aspect of this collection of infor mation, including suggestions for reducing this burden to Department of Defense, Washington Headquarters Services, Directorate for Information Operations and Reports (0704-0188), 1215 Jefferson Davis Highway, Suite 1204, Arlington, VA 22202- 4302. Respondents should be aware that notwithstanding any other provision of law, no person shall be subject to any penalty for failing to comply with a collection of information if it does not display a currently valid OMB control number. PLEASE DO NOT RETURN YOUR FORM TO THE ABOVE ADDRESS.
1. REPORT DATE (DD-MM-YYYY) 31-03-2012
2. REPORT TYPE Final Performance Report
3. DATES COVERED (From - To) 01-09-2008 to 31-03-2012
4. TITLE AND SUBTITLE Experimental Studies of Coal and Biomass Fuel Synthesis and
Flame Characterization for Aircraft Engines
5a. CONTRACT NUMBER
5b. GRANT NUMBER FA9550-10-1-0344
5c. PROGRAM ELEMENT NUMBER 61102F
6. AUTHOR(S) R. K. Agrawal, J. P. Gore, F. H. Ribeiro, W. N. Delgass, R. Lucht, L. Qiao, S. Naik, A. Smeltz,
D. Guildenbecher, I. Sircar, V. Kumar, A. Sane
5d. PROJECT NUMBER 2308
5e. TASK NUMBER BX
5f. WORK UNIT NUMBER
7. PERFORMING ORGANIZATION NAME(S) AND ADDRESS(ES) AND ADDRESS(ES)
Purdue University Energy Center Mann Hall, Room 266 203 Martin Jischke Drive West Lafayette, IN 47907-2022
8. PERFORMING ORGANIZATION REPORT NUMBER
9. SPONSORING / MONITORING AGENCY NAME(S) AND ADDRESS(ES) Air Force Office of Scientific Research
875 North Randolph St.
Suite 325, Room 3112
Arlington, VA 22203-1768
10. SPONSOR/MONITOR’S ACRONYM(S)
11. SPONSOR/MONITOR’S REPORT
NUMBER(S)
12. DISTRIBUTION / AVAILABILITY STATEMENT Approved for public release; distribution is unlimited
13. SUPPLEMENTARY NOTES
14. ABSTRACT The broad objective of the research team is to establish the feasibility of an innovative idea to develop a commercially and technically viable integrated coal/biomass-to-liquid jet fuel synthesis process while mitigating the CO2 penalty. The production of transportation fuel from domestic coal and biomass sources would assure the U.S. Air Force a dependable and secure fuel supply. However, low efficiencies of the existing coal/biomass-to-liquid fuel processes, high capital and operating costs of the coal gasifiers and lack of combustion characteristics of the liquid fuel f rom coal/biomass are some of the major barriers to their use. As a result, there is a need for fundamental scientific and synergistic research in catalytic biomass fast-hydropyrolysis and advanced coal gasification studies. Synthetic liquid fuel combustion studies were conducted in the previous two years of the project and are also in progress elsewhere. The objective of this project was to develop experimental facilities for addressing specific scientific issues associated with the utilization of biomass and coal to produce appropriate aviation fuels.
15. SUBJECT TERMS Biomass fast hydropyrolysis, hydrodeoxygenation, and coal gasification
16. SECURITY CLASSIFICATION OF: Unclassified
17. LIMITATION OF ABSTRACT
UL
18. NUMBER OF PAGES
72
19a. NAME OF RESPONSIBLE PERSON Dr. Chiping Li ([email protected])
a. REPORT Unclassified
b. ABSTRACT Unclassified
c. THIS PAGE Unclassified
19b. TELEPHONE NUMBER (include area
code)
(703)696-8478
Standard Form 298 (Rev. 8-98) Prescribed by ANSI Std. Z39.18
AFRL-OSR-VA-TR-2012-1056
Experimental Studies of Coal and Biomass Fuel
Synthesis and Flame Characterization for
Aircraft Engines
AFOSR Grant Number: FA9550-10-1-0344
Final Performance Report
Report Period: September 1, 2008 to March 31, 2012
Prepared by:
Dr. Rakesh Agrawal (PI)
765-494-4811
765-494-0805 (fax)
Dr. Jay Gore (Co-PI)
765-494-1610
765-496-9322 (fax)
Dr. Fabio H. Ribeiro (Participating Investigator) Dr.
W. Nicholas Delgass (Participating Investigator) Dr.
Robert P. Lucht (Participating Investigator)
Dr. Li Qiao (Participating Investigator)
Dr. Sameer Naik
Dr. Andrew Smeltz Dr. Daniel Guildenbecher
Mr. Indraneel Sircar Mr.
Vinod Kumar
Mr. Anup Sane
School of Chemical Engineering School
of Mechanical Engineering School of
Aeronautics and Astronautics
Purdue University
West Lafayette, IN 47907
AFOSR Grant # FA9550-08-1-0456 Final Performance Report Purdue University
Page 3 of 72
Table of Contents
Executive Summary..................................................................................................................................................... 4
1.0 Biomass Fast-Hydropyrolysis ............................................................................................................................... 5
1.1 Fundamental Studies of Fast-Pyrolysis and Fast-Hydropyrolysis ....................................................................... 5
1.2 Micro-Scale Batch Fast-Hydropyrolysis Reactor .............................................................................................. 11
1.3 Continuous High-Pressure Fast-Hydropyrolysis Reactor .................................................................................. 17
1.4 References ......................................................................................................................................................... 22
2.0 Investigation of Coal and Biomass Gasification using In-situ Diagnostics ..................................................... 23
2.1 Introduction ....................................................................................................................................................... 23
2.2 Continuous-Flow Experimental Arrangement................................................................................................... 24
2.3 Fixed Bed System.............................................................................................................................................. 41
2.4 Mathematical Modeling of Coal Gasification ................................................................................................... 54
2.5 References ......................................................................................................................................................... 63
3.0 Conclusions .......................................................................................................................................................... 65
4.0 Participating Personnel ....................................................................................................................................... 66
5.0 Publications and Presentations ........................................................................................................................... 68
5.1 Publications ....................................................................................................................................................... 68
5.2 Conference Papers and Presentations ................................................................................................................ 69

AFOSR Grant # FA9550-08-1-0456 Final Performance Report Purdue University
Page 4 of 72
Executive Summary
AFOSR Grant Number: FA9550-08-1-0456
Project Title:
Experimental Studies of Coal and Biomass Fuel Synthesis and Flame Characterization for Aircraft Engines (Final Performance Report)
Project Period: September 1, 2008 to March 31, 2012
Report Period: September 1, 2008 to March 31, 2012
Date of Report: March 31, 2012
Contacts: Rakesh Agrawal Phone: 765-494-4811, E-mail: [email protected]
Jay Gore, Phone: 765-494-1610, E-mail: [email protected]
Project Objective:
The broad objective of the research team is to establish the feasibility of an innovative idea to develop a
commercially and technically viable integrated coal/biomass-to-liquid jet fuel synthesis process while mitigating the
CO2 penalty. The production of transportation fuel from domestic coal and biomass sources would assure the U.S.
Air Force a dependable and secure fuel supply. However, low efficiencies of the existing coal/biomass-to-liquid fuel
processes, high capital and operating costs of the coal gasifiers and lack of combustion characteristics of the liquid
fuel from coal/biomass are some of the major barriers to their use. As a result, there is a need for fundamental
scientific and synergistic research in catalytic biomass fast-hydropyrolysis, advanced coal gasification and liquid
fuel combustion studies. The objective of this project was to develop experimental facilities for addressing specific
scientific issues associated with the utilization of biomass and coal to produce appropriate aviation liquid fuels.
Fundamentals of fast-pyrolysis and fast-hydropyrolysis were systematically studied using micro-scale batch reactor systems. A fixed-bed catalytic reactor was designed, built and integrated with a micro-scale batch fast- hydropyrolysis reactor, and hydrodeoxygenation (HDO) of hydropyrolysis vapors over a 2% Pt/Al2O3 water-gas-
shift (WGS) catalyst was studied. After testing several prototype reactors, a continuous high-pressure cyclone-type fast-hydropyrolysis reactor and a downstream fixed-bed catalytic reactor were designed, built and tested at high pressures (up to 50 bar) and in the presence of candidate HDO catalysts. Findings from this work include: heating
rates of 500 to 1000 ºC s-1
are needed to minimize char formation from cellulose; at high heating rates and pressures of ~25 bar, cellulose pyrolysis in the presence of He and H2 gives similar product distributions, and downstream
hydrodeoxygenation requires a balance of acid and metal functions on the catalyst.
A continuous flow reactor and a fixed bed reactor were built for the experimental investigation of coal and biomass
gasification at high-pressures. In-situ diagnostics in the form of tunable-diode-laser-absorption-spectroscopy
(TDLAS) was developed to study the gasification rates and associated transport and kinetics. The TDLAS technique
was used to probe CO species concentration as a marker of gasification progress. In both cases, in-situ
measurements were correlated with product gas composition analysis using a gas chromatograph and a FTIR based
multi-gas-analyzer. Material characterization techniques were used to assess the structural changes of the solid
feedstock. In addition, detailed chemistry involving multiphysics models were developed to understand the
gasification process from a fundamental perspective.
Page 5 of 72
AFOSR Grant # FA9550-08-1-0456 Final Performance Report Purdue University
1.0 Biomass Fast-Hydropyrolysis
The broad objective of the project is the development of a process to convert biomass, a rich resource of renewable
carbon, to liquid products with high energy density to supplement liquid aviation fuels from traditional, non -
renewable resources. The ultimate goal of the proposed fast-hydropyrolysis and catalytic hydrodeoxygenation
process is to meet these requirements by thermally decomposing biomass into small molecules in the fuel range,
while simultaneously upgrading these products to high-energy-density liquid fuels using catalysts in the presence of
high-pressure hydrogen and carbon monoxide generated by coal gasification.
Year One and Year Two research programs on biomass fast-hydropyrolysis (Task 1.0) took different approaches to
reactor design to construct working reactors capable of operating under high pressure conditions. Several prototype,
lab-scale, fast-pyrolysis reactors with varying configurations were designed, built, and tested. Experiments with
micro-scale reactor systems to better understand the fundamentals of fast-pyrolysis and fast-hydropyrolysis were
also completed. A lab-scale, high-pressure, fast-hydropyrolysis reactor was built based on the results from previous
reactors and fundamental studies on pyrolysis of cellulose.
The Year Three research program continued a two-pronged approach to study various issues related to the utilization
of hydrogen (H2) and carbon monoxide (CO), generated by coal gasification, for biomass fast-hydropyrolysis (FHP)
and subsequent hydrodeoxygenation (HDO) to produce a liquid product suitable for upgrading or directly usable as
a jet fuel. The first approach utilized a lab-scale, continuous-flow, high-pressure, cyclone-type, FHP reactor and a
secondary fixed-bed catalytic reactor located downstream of the FHP reactor for performing product vapor
upgrading and water-gas-shift (WGS) reactions. This reactor system, in addition to allowing study of the
fundamentals of FHP, also allowed us to understand better the practical issues associated with operating a FHP
reactor system. However, this approach did not allow us to quickly screen reaction conditions and catalysts that
could result in a product distribution optimal for liquid fuel production. Additionally, the control over process
variables was coarse at best, which made fundamental studies difficult. Therefore, the second approach was to study
FHP, catalytic product upgrading and WGS reactions using a micro-scale, batch FHP reactor which was capable of
accurately controlling variables, such as particle heating rate, which were believed to be important for controlling
the product distribution. Furthermore, the system was capable of quick screening of process conditions and catalysts
that were also useful for the continuous reactor. In the subsequent sections, both experimental apparatuses are
briefly described, along with an account of progress made in accomplishing specific tasks of the research project. 1.1 Fundamental Studies of Fast-Pyrolysis and Fast-Hydropyrolysis
In order to optimize the fast-hydropyrolysis process and maximize selectivity towards a liquid product, it is essential
to understand the fundamentals of char formation. Heating rate of the biomass particles is an important factor
influencing the formation of undesirable char by-products. In Year Two research, the objective was to get an
estimate of minimum heating rate required to avoid char formation in cellulose pyrolysis, which would aid in the
design of the micro-scale batch and continuous high-pressure FHP reactors. In Year Three, the aim was to accurately
quantify this relationship by precisely measuring the amount of char formed in cellulose pyrolysis at different
heating rates and in the presence of H2/CO/CO2 mixtures.
1.1.1 Experimental Description
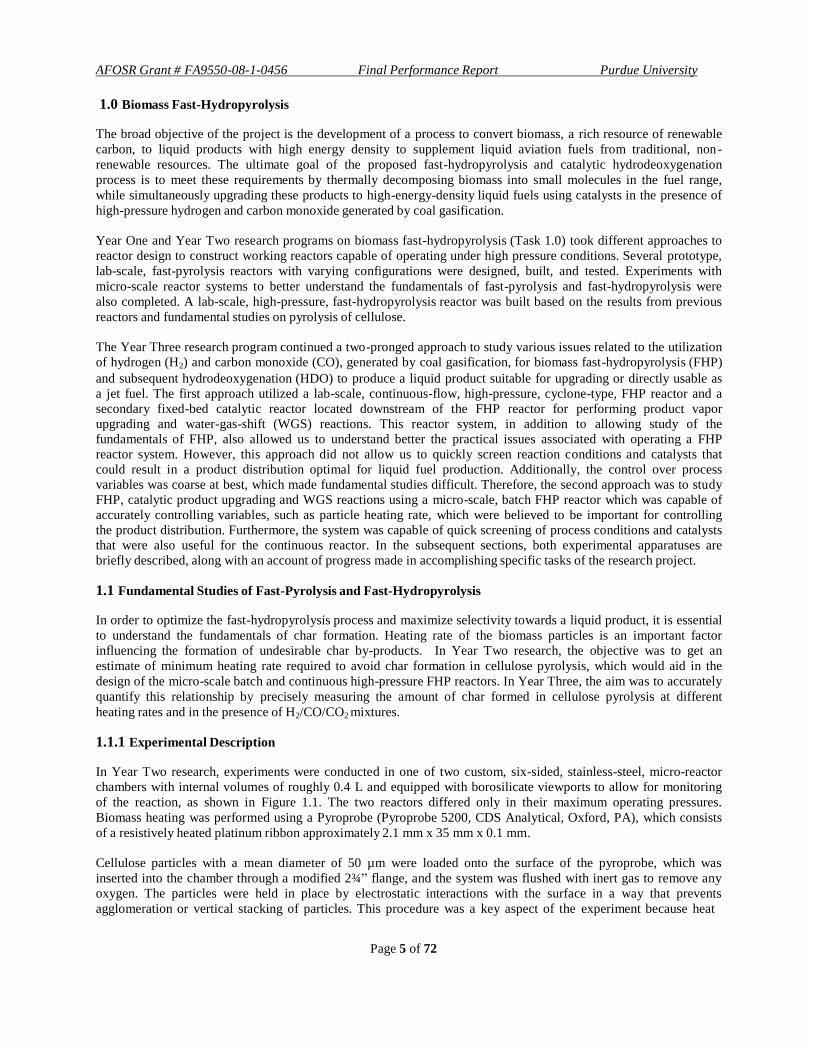
In Year Two research, experiments were conducted in one of two custom, six-sided, stainless-steel, micro-reactor
chambers with internal volumes of roughly 0.4 L and equipped with borosilicate viewports to allow for monitoring
of the reaction, as shown in Figure 1.1. The two reactors differed only in their maximum operating pressures.
Biomass heating was performed using a Pyroprobe (Pyroprobe 5200, CDS Analytical, Oxford, PA), which consists
of a resistively heated platinum ribbon approximately 2.1 mm x 35 mm x 0.1 mm.
Cellulose particles with a mean diameter of 50 µm were loaded onto the surface of the pyroprobe, which was
inserted into the chamber through a modified 2¾” flange, and the system was flushed with inert gas to remove any
oxygen. The particles were held in place by electrostatic interactions with the surface in a way that prevents
agglomeration or vertical stacking of particles. This procedure was a key aspect of the experiment because heat

Page 6 of 72
AFOSR Grant # FA9550-08-1-0456 Final Performance Report Purdue University
transfer to the sample was critical, and a thick layer of sample would result in thermal lag and uneven heating of each individual particle. The intimate solid-solid contact represented the ideal heat transfer scenario and, coupled
with the ability to heat the samples at rates up to 20,000 °C s-1
, made this system a much better candidate for studying the fundamentals of fast-pyrolysis than a typical thermogravimetric analysis (TGA) experiment.
The cellulose samples were heated at rates representing one of three different regimes: slow, TGA-type heating (15
°C min-1
), intermediate heating typical of pyrolysis (200 °C s-1
), and the maximum possible rate (20,000 °C s-1
). The
gas atmosphere was also varied to determine the effects of reaction environment. Experiments were conducted at 1 bar He, 1 bar H2, and 30 bar He. In each experiment, the ribbon was heated to a final temperature of 600 °C, where it
was held for 1 s before being allowed to cool back to room temperature. Pictures of the platinum ribbon were taken using an optical microscope (Olympus BX51, Olympus, Central Valley, PA) before introduction into the chamber
and after reaction in order to qualitatively determine the amount of char formation.
Figure 1.1: CAD drawing of the six-sided micro-reactor with two high-pressure borosilicate viewports.
In Year Three, to quantitatively study char formation during pyrolysis, a modified setup for the pyroprobe was used.
The details of the experimental set-up are explained later. A crucial aspect of the study was the requirement to
deposit quantifiable and reproducible amounts of cellulose onto the platinum filament of the pyroprobe. Previous
experiments showed that it is necessary to load no more than a single layer of sample so that heat transfer is directed
from the platinum surface to the cellulose particle rather than from one particle to an adjacent particle.
A three-step experimental method, shown in Figure 1.2, was designed to quantify char formation as a function of heating rate for cellulose. In the first step, a micro liter of an aqueous suspension of known cellulose concentration was deposited onto the platinum filament and the filament was dried at room temperature to evaporate the water. Then, the particle dispersion was observed with a standalone microscope with 20x magnification. Following
pyrolysis at the desired heating rate (°C s-1
) in H2/CO/CO2 mixtures, the pyroprobe with residual char was inserted
into a decoking flow tube as shown below in Figure 1.3.
Pyrolysis Decoke Analysis
• 1 µL biomass suspensions
• Pyrolyze at different heating rates
• Flow air through tube
• Heat to 815°C
• Gas bag product collection
• CO/CO2 by GC-FID analysis
• Calculate residual carbon from GC-FID data
Figure 1.2: Experimental method to quantify cellulose char formation on pyroprobe.

Page 7 of 72
AFOSR Grant # FA9550-08-1-0456 Final Performance Report Purdue University
The char deposited on the Pt filament was removed by flowing air across the filament and heating the pyroprobe to
815 °C to form CO and CO2. In order to accurately determine the absolute amount of char present, it was necessary
to collect the entire off-gas during this decoking step. To facilitate this process, firstly, a steady-state air flow rate to the vent was established by using a gas mass flow controller. Then, a solenoid valve was energized to direct the
airflow from the vent to the pyroprobe. The solenoid was connected to a time-delay relay that de-energized the valve after a specified period of time and re-directed air flow from the pyroprobe back to the vent. Thus, a fixed
volume of air was passed across the pyroprobe and all of the combustion products were collected in a downstream
gas-sampling bag.
FIC
FC Solenoid Valve Vent
Air
S
Mass Flow Controller
Vent
CO/CO2
to gas bag
Pyroprobe
Decoking Flow Tube
Figure 1.3: Flow diagram of test unit to quantify post-pyrolysis char from pyroprobe.
The final step was to analyze the combustion products by gas chromatography. Based on the known gas sample
volume and composition of combustion products, the amount of carbon present was determined and a relationship
was developed for the mass of char deposited on the platinum filament at a given pyrolysis heating rate.
1.1.2 Results and Discussion
The approximate amount and type of char formed at a given heating rate were similar at different pressures of the
gas environment (1 bar and 30 bar). Heating the cellulose at 15 °C min-1
resulted in a significant amount of char formation, as shown in Figure 1.4. Similar amounts of char formed after pyrolysis in atmospheric pressure helium and hydrogen at the same heating rate. The following hypothesis is consistent with the results. At a low heating rate, cellulose slowly decomposes on the surface and forms amorphous carbon structures with a high C:H ratio rather than forming lower molecular weight vapor and gaseous products. While some lighter compounds are inevitably formed, a large proportion of the original sample remains on the surface in the form of char.
Cellulose has a very ordered and regular structure, consisting of thousands of dehydrated glucose building blocks
linked into long chains with little or no branching. In real biomass, however, cellulose corresponds to only around
one-third of the mass, with the rest made up by hemicellulose (essentially a branched and lower molecular weight
polymer made up of a variety of sugar monomers) and lignin, an amorphous, cross-linked set of molecules so
random in its size and structure that no accurate model has been developed. If such a low heating rate causes the
simplest of compounds found in plants to extensively char, then surely the yields of vapor products from real
biomass would be unacceptable.
An interesting result was obtained by heating the cellulose at a rate of 200 °C s-1
in that the char formed droplets,
which left “char rings” on the surface, as shown in Figure 1.5. This observation is consistent with and confirms the
phenomenon reported previously[1.1]
, which showed cellulose liquefying and bubbling off the surface during
pyrolysis. This heating rate, then, corresponds to a transition zone for this particle size where the heating is fast enough to allow sufficient heat transfer throughout the particle to liquefy the sample. However, the heating is still
not fast enough to completely volatilize all the cellulose, resulting in the ring of char. This heating rate can be
regarded as the minimum order of magnitude required for an ablative reactor to efficiently pyrolyze cellulose, since the liquefied cellulose will “stick” to the surface upon contact, and can spread out on the hot surface, resulting in a
larger contact area and smaller thermal lag through the sample. A reactor operating at lower heating rates relies on
the contact of an irregularly-shaped solid particle with a hot surface, which would lead to less efficient heat transfer.

Page 8 of 72
AFOSR Grant # FA9550-08-1-0456 Final Performance Report Purdue University
A heating rate of 20,000 °C s-1
, two orders of magnitude greater than the previous one, is fast enough to cause
essentially complete vaporization of the samples. Consequently, the experiments at this heating rate resulted in
virtually no char being formed, Figure 1.6. While this heating rate may be difficult to obtain in a large -scale reactor,
it shows that it is possible to eliminate the formation of char for simple model biomass systems.
In order to check if a heating rate in the intermediate range could eliminate char formation, experiments were
conducted at 1,000 °C s-1
. It was observed that these heating rates were sufficient to eliminate the formation of char
from cellulose (Figure 1.7).
Figure 1.4: Char formed after 50 µm cellulose particles were pyrolyzed in 1 bar H2 (left) and 1 bar He (right)
at a heating rate of 15 °C min-1
. 20x magnification. The blue circles outline the same position on the platinum
ribbon.
Figure 1.5: 50 µm cellulose before reaction (left) and after pyrolysis in 1 bar He at a rate of 200 °C s -1
(right).
20x magnification. The blue circle outlines the same position on the ribbon.
Figure 1.6: 50 µm cellulose particles on the surface of platinum ribbon (left). Char formed after pyrolysis in 1
bar H2 at a heating rate of 20,000 °C s-1
(right). 20x magnification. The blue circle outlines the same position
on the platinum ribbon.

Page 9 of 72
AFOSR Grant # FA9550-08-1-0456 Final Performance Report Purdue University
Figure 1.7: 50 µm cellulose particles on the surface of platinum ribbon (left). Char formed after pyrolysis in 1
bar He at a heating rate of 1,000 °C s-1
(right). 20x magnification. The blue circle outlines the same position
on the platinum ribbon.
In Year Three, after the construction of the test apparatus (Figure 1.3) to quantitatively study the effects of different
pyrolysis heating rates and final temperatures on char formation from cellulose in H2/CO/CO2 mixtures, char
formation studies were started by pyrolyzing 50 µm cellulose particles at 15 °C s-1
in the pyroprobe in the presence
of helium. The purpose of testing at this low heating rate was to form char on the platinum filament deliberately in
order to determine if it can be completely removed and collected in a gasbag following an air burn. Figure 1.8
compares microscope images of the platinum filament before pyrolysis, after pyrolysis, and after decoking.
To quantify char formation, a method was developed to deposit measurable quantities of cellulose on the platinum filament of the pyroprobe and generate GC calibration curves to determine the absolute concentrations of CO and CO2 in the decoking gas sample. Samples were deposited on the pyroprobe by preparing a suspension of cellulose
particles in deionized water, adding droplets of this suspension onto the platinum filament, and drying the filament
to remove the water to yield a known starting mass of cellulose. After pyrolyzing the cellulose particles at 15 °C s-1
to a final temperature of 600°C in helium flow, the pyroprobe was cooled and transferred to the decoking apparatus. Then, the residual carbon (char) by-product was removed from the platinum filament by flowing a fixed volume of
purified air across the pyroprobe and heating to 815 °C at 1,000 °C s-1
. The final temperature was held for 5 minutes to ensure complete decoking. The CO and CO2 in the decoking product gas mixture were converted to CH4 before
analysis in the FID of the GC in order to make the CO and CO2 susceptible to the high sensitivity of FID.
Microscopic inspection of the platinum filament after decoking confirmed that the char was removed. These experiments were repeated for 20 µg and 60 µg of starting mass of cellulose.
Sample deposit Post pyrolysis Post decoke
Cellulose Char
• 50 µm cellulose
• Held by static interaction
• Excess removed
• Pyrolyze in He
• Heat 15 °C s-1 to 600 °C
• Char formed
• Decoke in air
• Heat 1,000 °C s-1 to 815 °C
• Char removed
Figure 1.8: Microscope images of the platinum filament to compare the presence of cellulose, formation of
char, and removal by decoking.
Table 1.1 shows the char yield, defined as the mass of char produced per mass of starting cellulose, from pyrolysis
of 20 µg and 60 µg of cellulose in helium at three different heating rates of 15, 100 and 250 °C s-1
. Since the purified

Page 10 of 72
AFOSR Grant # FA9550-08-1-0456 Final Performance Report Purdue University
air used for decoking contained trace amounts of CO and CO2, this baseline quantity of 3.5 µg carbon was
subtracted from the amount of carbon in the gas bag samples to determine the mass of char on the platinum filament.
Figure 1.9 shows the variation of the char yield as a function of the heating rate for the two different starting masses
of cellulose. As a general trend for the 60 µg samples, a decrease in char yield was observed from 52% to 15% as
the pyrolysis heating rate was increased from 15 °C/s to 250 °C/s. With the 20 µg samples the overall trend of
decrease of char yield with increasing pyrolysis heating rate seemed to hold except for 100 °C/s. The discrepancy
was caused by clumping of the cellulose particles because they were deposited as a single droplet (5 µL) of the
suspension for the 20 µg starting mass. Deposition of the 60 µg mass of cellulose in several small droplets resulted
in a more even distribution of particles on the platinum filament and led to more uniform heat transfer to all the
particles. Hence, the overall char formation trends validated the hypothesis that the char yield from cellulose
decreases with increasing pyrolysis heating rate. Time limitations prevented further studies at higher pyrolysis
heating rates, higher pressures and in presence of H2/CO/CO2 mixtures.
Table 1.1: Char formation from pyrolysis of cellulose in helium atmosphere.
Sample
material
Starting mass* /
µg
Pyrolysis rate -1
/ °C s
Total
Carbon**/ µg
Residual
carbon
(char) / µg
Char yield /
%
Purified air - - 3.5*** - -
50 µm
cellulose
20
15 7.0 3.4 17.2
100 9.3 5.8 29.0
250 6.1 2.6 13.0
60
15 34.1 30.6 51.6
100 22.9 19.4 32.4
250 12.3 8.7 14.6
*Estimate based on concentration of cellulose in suspension of 4 g L-1
(4 µg µL-1
) **Total carbon as measured by GC-FID analysis (including the air impurity)
*** Background caused by CO/CO2 impurity in the purified air
Figure 1.9: Variation of char yields as a function of heating rate for two different starting masses of cellulose.
1.1.3 Conclusions
The microscope visualization experiments that were conducted indicated the values of some of the critical
parameters needed for design of a large-scale pyrolysis reactor. It was observed that for cellulose, heating rates on
the order of 1,000 °C s-1
were sufficient to eliminate the formation of char, regardless of reactive gas atmosphere.

Page 11 of 72
AFOSR Grant # FA9550-08-1-0456 Final Performance Report Purdue University
Furthermore, the experiments determined that a heating rate in the 200-500 °C s-1
regimes may be sufficient for an
ablative reactor to function, as this is the required rate to liquefy cellulose particles.
A three- step experimental method was developed and a special test apparatus was constructed for systematically quantifying the char formation as a function of the pyrolysis heating rate of cellulose in the p yroprobe. The char
formation studies of cellulose pyrolysis in helium atmosphere at different heating rates of 15, 100 and 250 °C s -1
validated the hypothesis that char yield decreases with increasing heating rate of the cellulose particles. The knowledge gained from these char formation studies were useful for selection of optimum process conditions for pyrolysis in the micro-scale batch FHP and the continuous FHP reactors, which are discussed in the subsequent sections.
1.2 Micro-Scale Batch Fast-Hydropyrolysis Reactor
The micro-scale, batch fast-hydropyrolysis reactor is based primarily on the pyroprobe (Pyroprobe 5200, CDS
Analytical, Oxford, PA) which utilizes a resistively-heated platinum filament to heat biomass samples at a maximum
possible rate of 20,000 °C s-1
. A basic schematic of the pyroprobe reactor system is shown in Figure 1.10 and Figure 1.11. The Pt filament which is attached to the pyroprobe housing, was then inserted into the temperature controlled
zone which can be pressurized up to 34 bar with He/H2/CO/CO2. The downstream portion of the pyroprobe enabled
product analysis via a GC/MS. As part of the Year Three research, a fixed-bed catalytic reactor, located downstream
of the pyrolysis region between the pyroprobe and valve box, was designed and developed to enable us to perform
HDO/WGS reactions after the pyrolysis stage. During the loading phase of the experiment the reactant gas did not
flow through the pyroprobe housing (Figure 1.10), which prevented the catalyst from being exposed to air . The 8-
port valve was switched during reactor operation and the pyrolysis vapors passed through the fixed -bed reactor and
adsorbed on the trap (Figure 1.11). The trap was then heated to 300 °C and the desorbed products were analyzed via
a GC/MS.
The purpose of the downstream catalytic reactor was to efficiently upgrade pyrolysis vapors to products suitable as
liquid fuels. Prior experiments had shown that the pyrolysis vapors were comprised of compounds which needed to
be deoxygenated while at the same time keeping the carbon-carbon bonds intact to maximize the yield and energy
content of the liquid products. Two catalytic reactors, a micro-capillary reactor and a fixed-bed reactor, were
designed, built and tested to enable the study of different catalysts for HDO of pyrolysis vapor compounds.
A micro-capillary HDO reactor was designed and placed downstream of the micro-scale batch FHP reactor. A detailed description of this reactor is provided in the following experimental description section. The micro -capillary HDO reactor had milligram quantities of a catalyst deposited on the walls of a capillary and the loading of the
catalyst could be controlled by varying the length of the capillary coated. However, this reactor could not be operated at high pressure (>6 bar) and the fragile capillary tubes posed several challenges during the design and operation of this reactor. Also, the capillaries could not be exposed to a temperature greater than 350 °C, thereby limiting higher temperature studies over the catalysts. To overcome these limitations, a fixed bed reactor was
designed and placed downstream of the pyrolysis zone, as shown in Figure 1.10. The fixed bed reactor could be operated in the temperature range 200 °C – 500 °C and pressure range 1 – 35 bar. As an example of a supported metal catalyst, a 2% Pt/ Al2O3 catalyst, from our water-gas-shift (WGS) catalyst inventory, was tested in the fixed
bed HDO reactor for catalytic activity on pyrolysis vapor compounds in the presence of hydrogen. Based on the
assumption that only H2 could be utilized in catalytic deoxygenation reactions, CO present in the gas stream
generated from the coal gasifier should be shifted to H2 via WGS. Thus, this WGS catalyst, in addition to being the
HDO catalyst, could also shift CO to H2 using water generated in the FHP reactor. One of the planned tasks in this
work was also to determine if CO could be directly involved in deoxygenation during fast-hydropyrolysis of cellulose and subsequent HDO.

Page 12 of 72
AFOSR Grant # FA9550-08-1-0456 Final Performance Report Purdue University
Figure 1.10: Schematic of the micro-scale batch FHP and fixed-bed catalytic reactor arrangement during
loading phase.
Figure 1.11: Schematic of the micro-scale batch FHP and fixed-bed catalytic reactor arrangement during
reactor operation. 1.2.1 Experimental Description
A micro-capillary HDO reactor was designed and prepared in accordance with the procedure mentioned by Bravo et
al.[1.2]
, who were able to coat cylindrical non-porous channels, having diameters as low as 250 μm with a supported catalyst. The procedure for making the reactor is described in detail and some preliminary results using well -known probe reactions to test the reactor performance are discussed in the following section.
The experimental procedure
[1.2] for coating of a fused silica capillary with the catalyst can be broadly classified into
3 steps –
1. Pre-treatment of the capillary
2. Slurry preparation
3. Gas assisted fluid displacement
The 1st
step was performed to pre-treat the inner surface of the capillary to make the surface conducive for adhesion
of the deposited catalyst coat. Pretreatment involved exposing the inner surface of the capillary with a Piranha etch solution for 30 min at 100 °C. The Piranha etch solution contained a mixture of sulfuric acid and a solid oxidizer (Nochromix® from Godax Laboratories, Inc) which oxidized impurities present on the inner surface. The inner surface was then rinsed with DI water, followed by ethanol. The capillaries were dried in an oven at a temperature
greater than 80 °C prior to deposition of the slurry. Slurries were prepared with composition similar to that given by
Bravo et al.[1.2]
. The slurry consisted of a binder, Boehmite (Catapal B from Sasol) which aided in the formation of a viscous slurry and increased the adhesion of the coated layer. The catalyst was milled to a mean particle size of
10μm in a ball mill before addition to the slurry. The capillary was filled with the slurry and it was forced out using
an inert gas under pressure. A thin liquid film was deposited on the surface of the capillary, which was then dried in
an oven. A capillary having a uniformly coated inner surface was obtained using this gas-assisted fluid displacement
technique (Figure 1.12).
Page 13 of 72
AFOSR Grant # FA9550-08-1-0456 Final Performance Report Purdue University
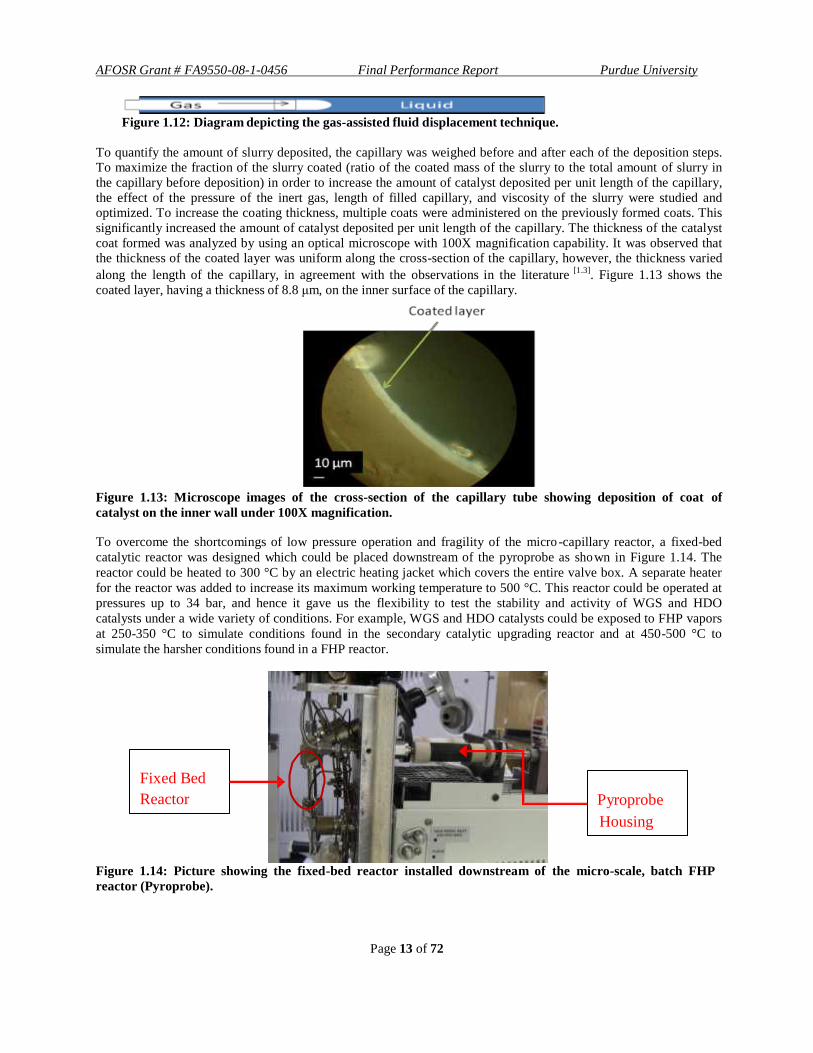
Figure 1.12: Diagram depicting the gas-assisted fluid displacement technique.
To quantify the amount of slurry deposited, the capillary was weighed before and after each of the deposition steps. To maximize the fraction of the slurry coated (ratio of the coated mass of the slurry to the total amount of slurry in
the capillary before deposition) in order to increase the amount of catalyst deposited per unit length of the capillary,
the effect of the pressure of the inert gas, length of filled capillary, and viscosity of the slurry were studied and optimized. To increase the coating thickness, multiple coats were administered on the previously formed coats. This
significantly increased the amount of catalyst deposited per unit length of the capillary. The thickness of the catalyst
coat formed was analyzed by using an optical microscope with 100X magnification capability. It was observed that the thickness of the coated layer was uniform along the cross-section of the capillary, however, the thickness varied
along the length of the capillary, in agreement with the observations in the literature [1.3]
. Figure 1.13 shows the
coated layer, having a thickness of 8.8 μm, on the inner surface of the capillary.
Figure 1.13: Microscope images of the cross-section of the capillary tube showing deposition of coat of
catalyst on the inner wall under 100X magnification.
To overcome the shortcomings of low pressure operation and fragility of the micro -capillary reactor, a fixed-bed
catalytic reactor was designed which could be placed downstream of the pyroprobe as sho wn in Figure 1.14. The
reactor could be heated to 300 °C by an electric heating jacket which covers the entire valve box. A separate heater
for the reactor was added to increase its maximum working temperature to 500 °C. This reactor could be operated at
pressures up to 34 bar, and hence it gave us the flexibility to test the stability and activity of WGS and HDO
catalysts under a wide variety of conditions. For example, WGS and HDO catalysts could be exposed to FHP vapors
at 250-350 °C to simulate conditions found in the secondary catalytic upgrading reactor and at 450-500 °C to
simulate the harsher conditions found in a FHP reactor.
Fixed Bed
Reactor Pyroprobe
Housing
Figure 1.14: Picture showing the fixed-bed reactor installed downstream of the micro-scale, batch FHP
reactor (Pyroprobe).

Page 14 of 72
AFOSR Grant # FA9550-08-1-0456 Final Performance Report Purdue University
Experimental From literature 1.4
-1 -1
TOR /(Moles of ethane formed)(surface moles of Pt) (s) 12.3 +
12.4 -1
Activation energy /kcal mol 10.6±0.4 9.1±0.5+
1.2.2 Results and Discussion
To test the feasibility of the coated capillary as a potential reactor, hydrogenation of ethylene over a Pt catalyst was chosen as a probe reaction. A 2 wt% Pt/Al2O3 catalyst was prepared using the incipient wetness method and was ball
milled to reduce the particle size to that adequate for deposition. A slurry containing this catalyst was prepared and then deposited on the capillary wall. Chemisorption experiments were carried out on the 2% Pt/Al2O3 catalyst and
the catalyst in the dried slurry to determine possible deactivation of catalyst during the coating procedure. The results, not shown, showed negligible deactivation of the active catalyst. The ethylene hydrogenation probe reactio n was carried out in the micro-capillary reactor (530μm ID) under the conditions shown in Table 1.2. Ethylene hydrogenation turnover rates (TOR) and activation energy were obtained and compared to the typical results found
in literature[1.4]
. The activation energy and TOR, Figure 1.15 and Table 1.3 respectively, were in good agreement
with those reported in the literature[1.4]
.
Table 1.2: Conditions for ethylene hydrogenation reaction
Capillary Length / cm 15.9
Deposition in Capillary / g 0.01
Helium Flow Rate / sccm 50
Ethylene Flow Rate / sccm 10
Hydrogen Flow Rate / sccm 10
Pressure / barg 0.35
Temperature Range / K 268 - 298
Figure 1.15: Arrhenius plot for ethylene hydrogenation on 2% Pt/Al2O3 catalyst.
Table 1.3: Comparison of experimental results with those from literature.
+Results from literature[1.4]
extrapolated to our experimental conditions
After successful testing of a probe reaction, the micro-capillary reactor coated with a 2% Pt/Al2O3 catalyst was
tested using isopropyl alcohol (IPA) as a model FHP compound to simulate effluent from a hydropyro lysis reactor. The main products observed were acetone and propane/propene. Acetone was a dehydrogenation product, while
propene was a product of dehydration of IPA. The relative abundance of these products was found to be a function of the temperature of operation. At 200 °C, acetone was the major product, while propane/propene were minor
products. At 300 °C, propane/propene was the major product while acetone was the minor product. The results are
summarized in Table 1.4.
Page 15 of 72
AFOSR Grant # FA9550-08-1-0456 Final Performance Report Purdue University
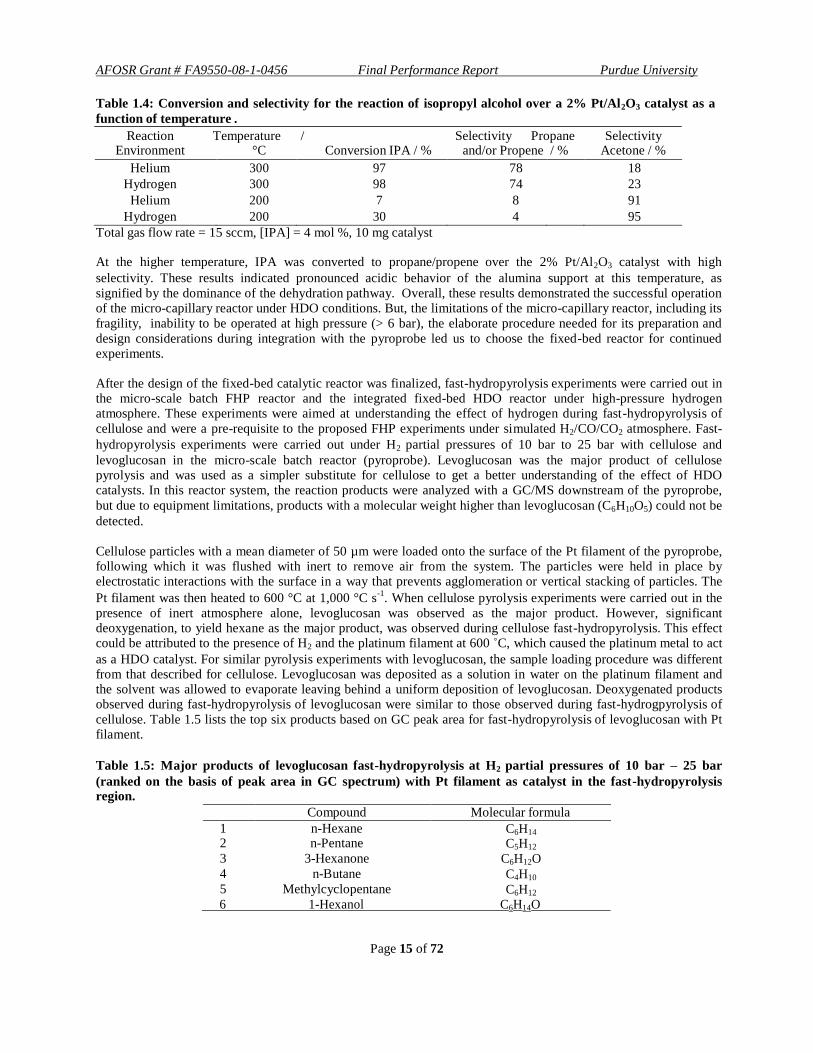
Table 1.4: Conversion and selectivity for the reaction of isopropyl alcohol over a 2% Pt/Al2O3 catalyst as a
function of temperature .
Reaction Temperature / Selectivity Propane Selectivity
Environment °C Conversion IPA / % and/or Propene / % Acetone / %
Helium 300 97 78 18
Hydrogen 300 98 74 23
Helium 200 7 8 91
Hydrogen 200 30 4 95
Total gas flow rate = 15 sccm, [IPA] = 4 mol %, 10 mg catalyst
At the higher temperature, IPA was converted to propane/propene over the 2% Pt/Al2O3 catalyst with high
selectivity. These results indicated pronounced acidic behavior of the alumina support at this temperature, as
signified by the dominance of the dehydration pathway. Overall, these results demonstrated the successful operation of the micro-capillary reactor under HDO conditions. But, the limitations of the micro-capillary reactor, including its
fragility, inability to be operated at high pressure (> 6 bar), the elaborate procedure needed for its preparation and
design considerations during integration with the pyroprobe led us to choose the fixed-bed reactor for continued experiments.
After the design of the fixed-bed catalytic reactor was finalized, fast-hydropyrolysis experiments were carried out in the micro-scale batch FHP reactor and the integrated fixed-bed HDO reactor under high-pressure hydrogen atmosphere. These experiments were aimed at understanding the effect of hydrogen during fast-hydropyrolysis of
cellulose and were a pre-requisite to the proposed FHP experiments under simulated H2/CO/CO2 atmosphere. Fast-
hydropyrolysis experiments were carried out under H2 partial pressures of 10 bar to 25 bar with cellulose and
levoglucosan in the micro-scale batch reactor (pyroprobe). Levoglucosan was the major product of cellulose pyrolysis and was used as a simpler substitute for cellulose to get a better understanding of the effect of HDO catalysts. In this reactor system, the reaction products were analyzed with a GC/MS downstream of the pyroprobe,
but due to equipment limitations, products with a molecular weight higher than levoglucosan (C6H10O5) could not be
detected.
Cellulose particles with a mean diameter of 50 µm were loaded onto the surface of the Pt filament of the pyroprobe, following which it was flushed with inert to remove air from the system. The particles were held in place by electrostatic interactions with the surface in a way that prevents agglomeration or vertical stacking of particles. The
Pt filament was then heated to 600 °C at 1,000 °C s-1
. When cellulose pyrolysis experiments were carried out in the
presence of inert atmosphere alone, levoglucosan was observed as the major product. However, significant deoxygenation, to yield hexane as the major product, was observed during cellulose fast-hydropyrolysis. This effect could be attributed to the presence of H2 and the platinum filament at 600 ˚C, which caused the platinum metal to act
as a HDO catalyst. For similar pyrolysis experiments with levoglucosan, the sample loading procedure was different from that described for cellulose. Levoglucosan was deposited as a solution in water on the platinum filament and the solvent was allowed to evaporate leaving behind a uniform deposition of levoglucosan. Deoxygenated products observed during fast-hydropyrolysis of levoglucosan were similar to those observed during fast-hydrogpyrolysis of
cellulose. Table 1.5 lists the top six products based on GC peak area for fast-hydropyrolysis of levoglucosan with Pt filament.
Table 1.5: Major products of levoglucosan fast-hydropyrolysis at H2 partial pressures of 10 bar – 25 bar
(ranked on the basis of peak area in GC spectrum) with Pt filament as catalyst in the fast-hydropyrolysis region.
Compound Molecular formula
1 n-Hexane C6H14
2 n-Pentane C5H12
3 3-Hexanone C6H12O 4 n-Butane C4H10
5 Methylcyclopentane C6H12
6 1-Hexanol C6H14O

Page 16 of 72
AFOSR Grant # FA9550-08-1-0456 Final Performance Report Purdue University
Shifting the focus to decoupling the effect of H2 versus that of platinum during fast-hydropyrolysis of cellulose, the
heating source was changed from the Pt filament to a Pt coil. The Pt coil had the advantage that the sample could be placed inside a hollow quartz tube around which the coil was wrapped. Thus, the sample was indirectly heated and the pyrolysis vapors never came in contact with the heated Pt coil in the presence of hydrogen.
High-pressure hydropyrolysis of cellulose was carried out in this modified micro-scale, batch reactor and the
products were analyzed using a GC/MS. The product composition did not vary significantly from that of pyrolysis
of cellulose under inert conditions. Table 1.6 lists the top six products based on GC peak area for fast-
hydropyrolysis of cellulose. Qualitatively, there was no difference in the compounds observed with a GC/MS for
fast-hydropyrolysis and fast-pyrolysis of cellulose. From this result, it could be inferred that the deoxygenation
effect was predominantly due to hot Pt metal in contact with cellulose and the pyrolysis vapors in a high -pressure
hydrogen atmosphere. Although the modification of the reactor ensured that interference due to Pt metal did not
disrupt the results of pyrolysis, the indirect heating in the quartz tube reduced the heating rate to approximately 200
C s-1
. Fast-hydropyrolysis of cellulose was also carried out in presence of H2/CO/CO2 (3.5:1.5:1 mole ratio) mixture in the quartz tube to eliminate the catalytic effect of Pt metal in presence of hydrogen. The major products
of pyrolysis were qualitatively similar to the products obtained by fast-hydropyrolysis (pure hydrogen atmosphere)
of cellulose (listed in Table 1.6). It was concluded that presence of a H2/CO/CO2 mixture did not affect the primary
products of cellulose pyrolysis, qualitatively, when analyzed using a GC/MS.
Table 1.6: Major products of cellulose fast-hydropyrolysis at H2 partial pressures of 10 bar – 25 bar. Cellulose
was loaded in quartz tube, which was heated externally by Pt coil (ranked on the basis of peak area in GC
spectrum)
Compound Molecular formula
1 Levoglucosan C6H10O5
2 Acetaldehyde, hydroxy- C2H4O2
3 2-Propanone, 1-hydroxy- C3H6O2
4 Furfural C5H4O2
5 2-Cyclopenten-1-one, 2-hydroxy- C5H6O2
6 Levoglucosenone C6H6O3
Following up on the conclusion that Pt metal was active for hydrodeoxygenation, experiments were conducted for catalytic hydrodeoxygenation (HDO) of pyrolysis vapors in presence of a 2% Pt/Al2O3 catalyst. The 2% Pt/Al2O3
catalyst was also a good WGS catalyst, based on our earlier studies. The catalyst was loaded in the fixed -bed HDO
reactor downstream of the pyrolysis stage. An excess amount of this catalyst was loaded so products after complete conversion could be observed. Levoglucosan was pyrolyzed in presence of hydrogen, in the hollow quartz tube with
wrapped Pt coil, and the vapors were passed over the catalyst. The major products observed are summarized in the table below.
Table 1.7: Major products of levoglucosan fast-hydropyrolysis and 2% Pt/Al2O3 downstream HDO catalyst at
H2 partial pressures of 10 bar – 25 bar (on basis of peak area in the GC spectrum)
Compound Molecular formula
1 Hexane C6H14
2 Methyl Cyclopentane C6H12
3 Cyclohexane C6H12
4 Pentane C5H12
5 Ethyl Cyclohexane C8H16
Page 17 of 72
AFOSR Grant # FA9550-08-1-0456 Final Performance Report Purdue University
These results indicated that the WGS catalyst is active for HDO as well. However, due to the limitations of the
equipment it was not possible to estimate the percentage conversion of levoglucosan. It was, however, concluded
that, in the presence of the excess amount of HDO catalyst, the pyrolysis vapor products underwent numerous
secondary reactions giving completely deoxygenated products.
Coking was observed over the used catalyst which was recovered from the HDO reactor set-up. This led us to
investigate the effect of the support (alumina) during the hydrodeoxygenation reaction, but the estimation of the
amount of coking on the used catalyst was difficult because micro-gram quantities of reactants were used as feed
during a single experiment. Alumina (Al2O3) was loaded in the fixed-bed reactor and pyrolysis vapors were passed
over it before analysis using the GC/MS. On comparing the signal intensity with that of the calibrated spectrum, it
was observed that almost all of the levoglucosan coked over the alumina. Dehydration products like furfural and 2 -
cyclopentene-1-one were observed, however they were in negligible quantities with respect to the amount of feed.
These results indicated that significant dehydration and coking occurs on pure alumina support in a hydrogen
atmosphere. In this reactor, coking was accentuated because microgram quantities of levoglucosan were being used
as the feed material and the amount of catalyst was in excess with respect to the feed. Significant challenges in
quantification of the products of pyrolysis and subsequent HDO reaction limited the understanding of
hydrodeoxygenation reactions on the catalyst. 1.2.3 Conclusions
Two different designs for the downstream HDO reactor for the micro-scale batch reactor were tested and a fixed-bed reactor was chosen as the more feasible reactor design. In the absence of a catalyst, the products of cellulose fast-
hydropyrolysis were qualitatively similar to the products of cellulose pyrolysis in an inert atmosphere. Similarly, the
presence of a H2/CO/CO2 mixture in the pyrolysis region did not qualitatively affect the primary products of
cellulose pyrolysis. In the presence of hydrogen, platinum metal was found to be active for hydrodeoxygenation. A WGS catalyst, 2% Pt/Al2O3, was successfully tested in the fixed-bed HDO reactor.
1.3 Continuous High-Pressure Fast-Hydropyrolysis Reactor
In Year One and Year Two of the project, the fundamentals of pyrolysis of cellulose particles were studied using an
optically-accessible, atmospheric-pressure quartz reactor and the pyroprobe. It was found that rapid heating rates
were needed to eliminate the formation of char from cellulose pyrolysis and solid-solid heat transfer to the biomass
particles could be enhanced by impinging the particles on a hot conductive surface at high velocities.
Based on the fundamental lessons learned, several prototype, fast-pyrolysis reactors were built and tested to explore
different reactor and inlet configurations. A prototype cyclone design was found to be robust and best suited for
continuous operation of fast-hydropyrolysis reactor. The cyclone design prevented clogging of the inlet, which had
hampered the operation of the former reactors. High heat transfer rates to the biomass, low char yield and low
residence time were crucial in adopting this design for the continuous FHP reactor.
In Year Three, the results from the prototype cyclone reactor and fundamental insights gained from the micro-scale batch reactor were used to design and build the new continuous, high-pressure, cyclone-type, FHP reactor safe for use with hazardous gases like H2 and CO. A downstream high-pressure, fixed-bed hydrodeoxygenation (HDO)
reactor was also designed and built. After initial shakedown tests of this combined reactor system with high-pressure inert atmosphere, high-pressure fast-hydropyrolysis experiments were started. Experiments at high H2 partial
pressures were performed to understand the effect of hydrogen on the liquid product and the product distribution. Then, fast-hydropyrolysis experiments were done with downstream HDO/WGS catalysts that were identified from
the micro-scale batch experiments. The experiments were systematically designed so that the effect of H2/CO/CO2
mixtures, resulting from the fast-hydropyrolysis, on the HDO/WGS catalysts could be understood. The effect of the catalyst support on the liquid products and the product distribution was also investigated. In all the experiments,
cellulose, of mean particle size of 50 µm, was used as a model biomass feedstock to simplify the products and gain a more fundamental understanding of the different effects. In the following sections, the reactor setup is discussed and the important results from the different experiments performed are highlighted.
Page 18 of 72
AFOSR Grant # FA9550-08-1-0456 Final Performance Report Purdue University
1.3.1 Experimental Description
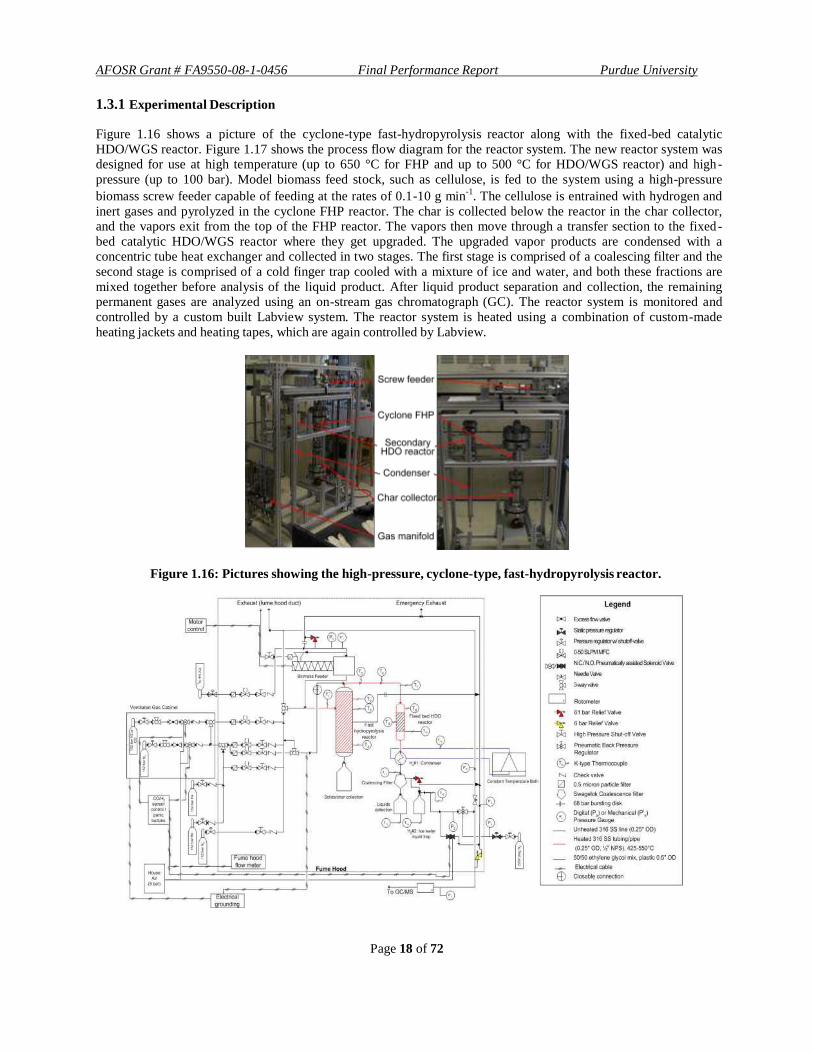
Figure 1.16 shows a picture of the cyclone-type fast-hydropyrolysis reactor along with the fixed-bed catalytic
HDO/WGS reactor. Figure 1.17 shows the process flow diagram for the reactor system. The new reactor system was designed for use at high temperature (up to 650 °C for FHP and up to 500 °C for HDO/WGS reactor) and high -
pressure (up to 100 bar). Model biomass feed stock, such as cellulose, is fed to the system using a high-pressure
biomass screw feeder capable of feeding at the rates of 0.1-10 g min-1
. The cellulose is entrained with hydrogen and
inert gases and pyrolyzed in the cyclone FHP reactor. The char is collected below the reactor in the char collector, and the vapors exit from the top of the FHP reactor. The vapors then move through a transfer section to the fixed -
bed catalytic HDO/WGS reactor where they get upgraded. The upgraded vapor products are condensed with a concentric tube heat exchanger and collected in two stages. The first stage is comprised of a coalescing filter and the
second stage is comprised of a cold finger trap cooled with a mixture of ice and water, and both these fractions are
mixed together before analysis of the liquid product. After liquid product separation and collection, the remaining permanent gases are analyzed using an on-stream gas chromatograph (GC). The reactor system is monitored and
controlled by a custom built Labview system. The reactor system is heated using a combination of custom-made
heating jackets and heating tapes, which are again controlled by Labview.
Figure 1.16: Pictures showing the high-pressure, cyclone-type, fast-hydropyrolysis reactor.
Page 19 of 72
AFOSR Grant # FA9550-08-1-0456 Final Performance Report Purdue University
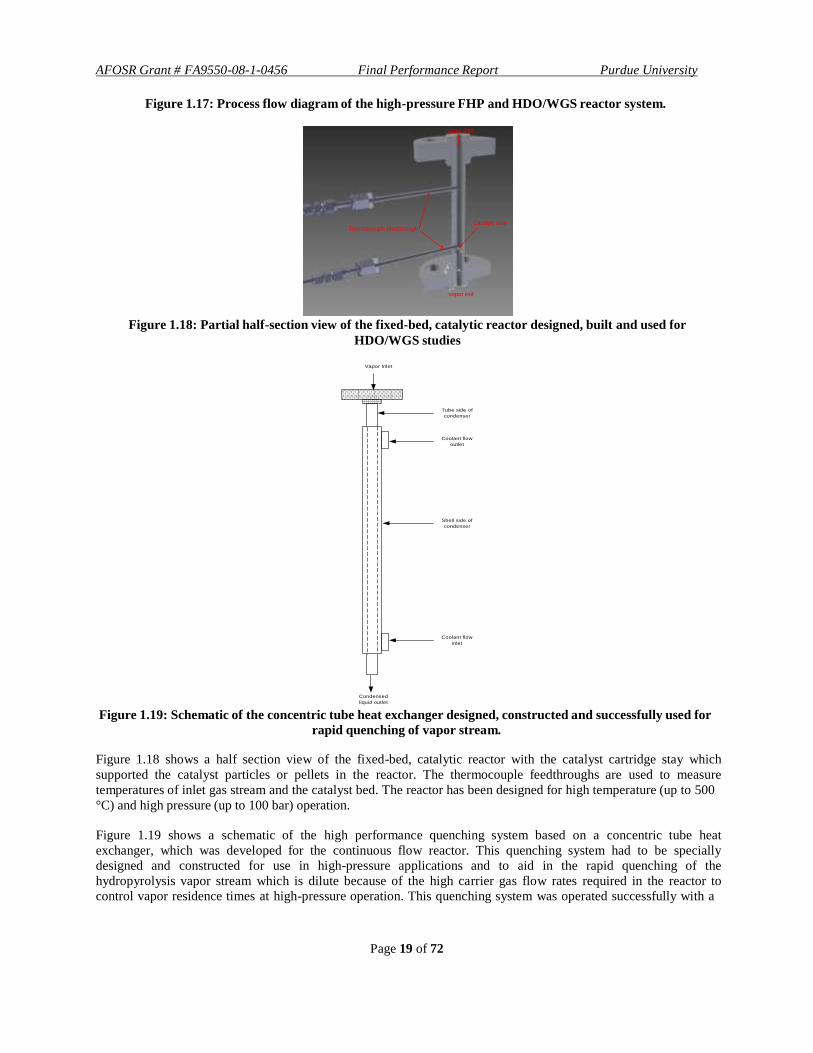
Figure 1.17: Process flow diagram of the high-pressure FHP and HDO/WGS reactor system.
vapor inlet
Thermocouple feedthrough Catalyst stay
vapor exit
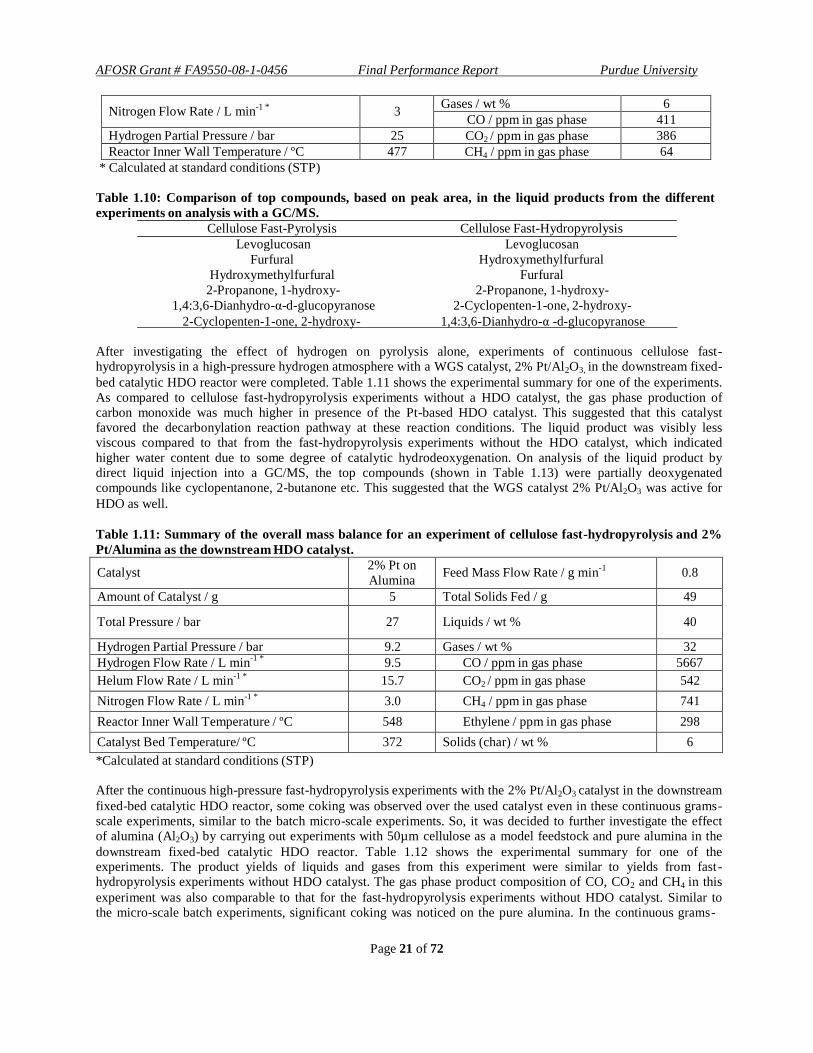
Figure 1.18: Partial half-section view of the fixed-bed, catalytic reactor designed, built and used for
HDO/WGS studies
Vapor Inlet
Tube side of
condenser
Coolant flow
outlet
Shell side of
condenser
Coolant flow
inlet
Condensed
liquid outlet
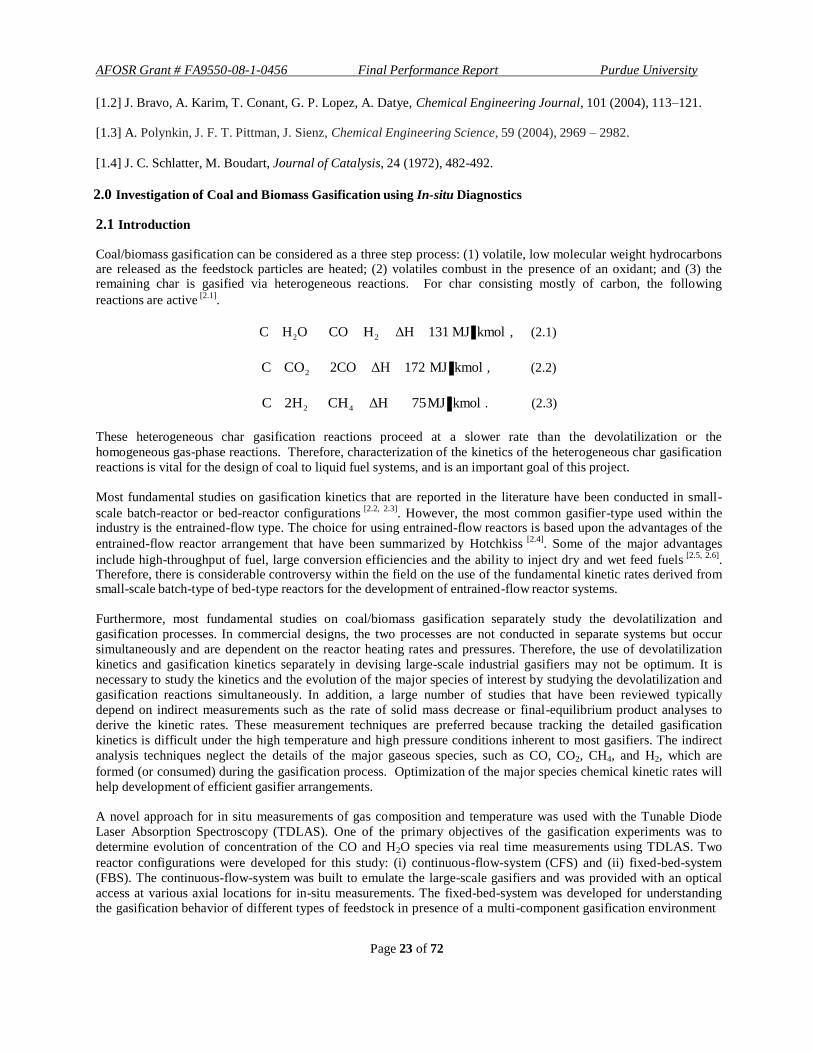
Figure 1.19: Schematic of the concentric tube heat exchanger designed, constructed and successfully used for
rapid quenching of vapor stream.
Figure 1.18 shows a half section view of the fixed-bed, catalytic reactor with the catalyst cartridge stay which
supported the catalyst particles or pellets in the reactor. The thermocouple feedthroughs are used to measure
temperatures of inlet gas stream and the catalyst bed. The reactor has been designed for high temperature (up to 500
°C) and high pressure (up to 100 bar) operation.
Figure 1.19 shows a schematic of the high performance quenching system based on a concentric tube heat
exchanger, which was developed for the continuous flow reactor. This quenching system had to be specially
designed and constructed for use in high-pressure applications and to aid in the rapid quenching of the
hydropyrolysis vapor stream which is dilute because of the high carrier gas flow rates required in the reactor to
control vapor residence times at high-pressure operation. This quenching system was operated successfully with a

Page 20 of 72
AFOSR Grant # FA9550-08-1-0456 Final Performance Report Purdue University
mixture of ethylene-glycol and water as the coolant on the shell-side of the heat exchanger in all the experiments
that are reported in the subsequent sections.
1.3.2 Results and Discussion
After construction of the continuous FHP reactor, initial shakedown experiments in high-pressure inert atmosphere
were started. Table 1.8 shows the experimental summaries for two shakedown experiments. In Run 2, the char yield
was less, indicating that more cellulose was converted to liquids and gases. This result is likely due to higher
average reactor temperatures which resulted in incrementally higher cellulose heating rates. Further, the decrease in
solids concentration in the inert carrier gas in Run 2 is likely to have reduced the clumping of cellulose particles,
thus improving the heat transfer to them. These experiments are further proof for the hypothesis from the char
formation studies that the char yield decreases with increasing heating rate to the cellulose particles. The error in the
overall mass balance was attributed mainly to inaccurate measurement of the gas yield due to sampling rate
limitations inherent in the gas chromatograph which prevented the gas production from being accurately integrated.
Another smaller source of error was the estimation of system holdup by rinsing the reactor system with a solvent and
evaporating it to calculate the liquids held up in the reactor.
The initial shakedown experiments were successful and showed that the new reactor system was capable of
pyrolyzing cellulose at high pressure with an acceptable liquid yield. These experiments were also used to refine
standard operating procedures and safety features of the reactor for use with high-pressure H2 and CO. Based on
these experiments, the downtube inside the cyclone FHP reactor was removed to improve the time-on-stream. After
a final safety review, fast-hydropyrolysis experiments of cellulose were started. Initially, there were some challenges
in heating the reactor at high hydrogen flow rates, but the heating system was successfully modified by combining a
high temperature ceramic heater and flexible laboratory heating tapes which were able to input more heat to the
reactor. Table 9 shows the experimental summary for one of the fast-hydropyrolysis experiments. The product yields
in the fast-hydropyrolysis experiments were similar to the corresponding experiments in an inert atmosphere (fast-
pyrolysis). On analysis of the liquid products by direct liquid injection into a GC/MS, the top compounds (shown in
Table 1.10) present in the liquid products from fast-pyrolysis and fast-hydropyrolysis of cellulose were similar on a
qualitative basis. This suggested that in the absence of a catalyst, the hydrogen atmosphere did not change the liquid
product composition (qualitatively) from pyrolysis of cellulose, which is consistent with the results from the micro -
scale batch reactor.
Table 1.8: Experimental summary for initial shakedown fast-pyrolysis experiments with cellulose.
Run 1 Run 2
Feedstock
Feed rate / g min-1
50 μm cellulose
1.0
50 μm cellulose
0.7
Run time / min 60 89
Total mass fed / g 60.0 59.5
Inert gas flow rate / (std) L min-1
39.3 39.3
Pressure / bar 49.7 49.5
Average pyrolysis temperature / °C 460±10 500±21
Feedstock conversion ~100% ~100%
Liquid yield / wt % 68.0 69.1
Char yield / wt % 13.2 10.9
Gas yield / wt % 8.4 8.6
Table 1.9: Summary of the overall mass balance for a cellulose fast-hydropyrolysis experiment at a H2 partial
pressure of 25 bar.
Mass Flow Rate / g min-1
0.9 Total Solids Fed / g 41
Total Pressure / bar 27 Liquids / wt % 67
Hydrogen Flow Rate / L min-1 *
35 Solids (Char) /wt % 8
Page 21 of 72
AFOSR Grant # FA9550-08-1-0456 Final Performance Report Purdue University
Nitrogen Flow Rate / L min-1 *
3 Gases / wt % 6
CO / ppm in gas phase 411
Hydrogen Partial Pressure / bar 25 CO2 / ppm in gas phase 386
Reactor Inner Wall Temperature / ºC 477 CH4 / ppm in gas phase 64
* Calculated at standard conditions (STP)
Table 1.10: Comparison of top compounds, based on peak area, in the liquid products from the different
experiments on analysis with a GC/MS.
Cellulose Fast-Pyrolysis Cellulose Fast-Hydropyrolysis
Levoglucosan Levoglucosan
Furfural Hydroxymethylfurfural
Hydroxymethylfurfural Furfural
2-Propanone, 1-hydroxy- 2-Propanone, 1-hydroxy-
1,4:3,6-Dianhydro-α-d-glucopyranose 2-Cyclopenten-1-one, 2-hydroxy-
2-Cyclopenten-1-one, 2-hydroxy- 1,4:3,6-Dianhydro-α -d-glucopyranose
After investigating the effect of hydrogen on pyrolysis alone, experiments of continuous cellulose fast- hydropyrolysis in a high-pressure hydrogen atmosphere with a WGS catalyst, 2% Pt/Al2O3, in the downstream fixed-
bed catalytic HDO reactor were completed. Table 1.11 shows the experimental summary for one of the experiments.
As compared to cellulose fast-hydropyrolysis experiments without a HDO catalyst, the gas phase production of carbon monoxide was much higher in presence of the Pt-based HDO catalyst. This suggested that this catalyst favored the decarbonylation reaction pathway at these reaction conditions. The liquid product was visibly less viscous compared to that from the fast-hydropyrolysis experiments without the HDO catalyst, which indicated
higher water content due to some degree of catalytic hydrodeoxygenation. On analysis of the liquid product by direct liquid injection into a GC/MS, the top compounds (shown in Table 1.13) were partially deoxygenated compounds like cyclopentanone, 2-butanone etc. This suggested that the WGS catalyst 2% Pt/Al2O3 was active for
HDO as well.
Table 1.11: Summary of the overall mass balance for an experiment of cellulose fast-hydropyrolysis and 2%
Pt/Alumina as the downstream HDO catalyst.
Catalyst 2% Pt on
Alumina Feed Mass Flow Rate / g min
-1
0.8
Amount of Catalyst / g 5 Total Solids Fed / g 49
Total Pressure / bar
27
Liquids / wt %
40
Hydrogen Partial Pressure / bar 9.2 Gases / wt % 32
Hydrogen Flow Rate / L min-1 *
9.5 CO / ppm in gas phase 5667
Helum Flow Rate / L min-1 *
15.7 CO2 / ppm in gas phase 542
Nitrogen Flow Rate / L min-1 *
3.0 CH4 / ppm in gas phase 741
Reactor Inner Wall Temperature / ºC 548 Ethylene / ppm in gas phase 298
Catalyst Bed Temperature/ ºC 372 Solids (char) / wt % 6
*Calculated at standard conditions (STP)
After the continuous high-pressure fast-hydropyrolysis experiments with the 2% Pt/Al2O3 catalyst in the downstream
fixed-bed catalytic HDO reactor, some coking was observed over the used catalyst even in these continuous grams- scale experiments, similar to the batch micro-scale experiments. So, it was decided to further investigate the effect of alumina (Al2O3) by carrying out experiments with 50µm cellulose as a model feedstock and pure alumina in the
downstream fixed-bed catalytic HDO reactor. Table 1.12 shows the experimental summary for one of the experiments. The product yields of liquids and gases from this experiment were similar to yields from fast - hydropyrolysis experiments without HDO catalyst. The gas phase product composition of CO, CO2 and CH4 in this
experiment was also comparable to that for the fast-hydropyrolysis experiments without HDO catalyst. Similar to the micro-scale batch experiments, significant coking was noticed on the pure alumina. In the continuous grams -

Page 22 of 72
AFOSR Grant # FA9550-08-1-0456 Final Performance Report Purdue University
scale experiments, however, significant amounts of dehydrated products were observed in the liquid phase. On
analysis with direct liquid injection into a GC/MS, a significant percentage of dehydration products (shown in Table
1.13) like furfural, levoglucosenone etc were observed. A lower viscosity of the liquid product as compared t o fast-
hydropyrolysis experiment without HDO catalyst was noticed, which could signify higher water content. Therefore,
in this continuous grams-scale reactor coking was observed on the pure alumina support in high-pressure hydrogen
environment, but a significant increase in the dehydrated products was noted which signified HDO activity of the
alumina.
Table 1.12: Summary of the overall mass balance for one of the experiments of cellulose fast -hydropyrolysis
and pure alumina as the downstream HDO catalyst.
Catalyst Pure
Alumina Feed Mass Flow Rate / g min
-1
0.7
Amount of Catalyst / g 5 Total Solids Fed / g 45
Total Pressure / bar
27
Liquids / wt %
64
Hydrogen Partial Pressure / bar 9.2 Gases / wt % 13
Hydrogen Flow Rate / L min-1 *
9.5 CO / ppm in gas phase 1577
Helum Flow Rate / L min-1 *
15.7 CO2 / ppm in gas phase 694
Nitrogen Flow Rate / L min-1 *
3.0 CH4 / ppm in gas phase 167
Reactor Inner Wall Temperature / ºC 549 Ethylene / ppm in gas phase 35
Catalyst Bed Temperature/ ºC 376 Solids (char) / wt % 13
*Calculated at standard conditions (STP)
Table 1.13: Comparison of top compounds, based on peak area, in the liquid products from the different
experiment on analysis with a GC/MS.
Cellulose Fast-Hydropyrolysis and HDO on 2%
Cellulose Fast-Hydropyrolysis and HDO on pure Al O
Pt/Al2O3 2 3
Levoglucosan Furfural Cyclopentanone Levoglucosenone
Methanol 5-Methyl furfural
Cyclopentanone, 2-methyl 2-Cyclopenten-1-one, 2-hydroxy-
2-Butanone Levoglucosan
2-Propanone, 1-hydroxy- 2-Cyclopenten-1-one, 2-hydroxy-3-methyl-
1.3.3 Conclusions
A novel continuous high-pressure fast-hydropyrolysis reactor and a downstream fixed-bed catalytic reactor have been designed, built and successfully tested in high-pressure hydrogen atmosphere. From cellulose fast-pyrolysis and fast-hydropyrolysis experiments it was seen that in the absence of catalyst, hydrogen did not change the liquid product compositions on a qualitative basis. So, a HDO catalyst was the key for deoxygenation of hydropyrolysis
vapors to produce a liquid product suitable of upgrading or directly usable as jet fuel. A WGS catalyst, 2% Pt/Al2O3,
was found to be active for HDO in the presence of H2/CO/CO2 mixtures resulting from fast-hydropyrolysis of
cellulose. Comparison of the product distributions for HDO over 2%Pt/Al2O3 versus Al2O3 suggests that optimal
catalysts will need a balance of dehydration (acid) and hydrogenation (metal) sites.
1.4 References
[1.1] P. J. Dauenhauer, J. L. Colby, C. M. Balonek, W. J. Suszynski, L. D. Schmidt, Green Chemistry 11 (2009)
1555-1561.
Page 23 of 72
AFOSR Grant # FA9550-08-1-0456 Final Performance Report Purdue University
[1.2] J. Bravo, A. Karim, T. Conant, G. P. Lopez, A. Datye, Chemical Engineering Journal, 101 (2004), 113–121.
[1.3] A. Polynkin, J. F. T. Pittman, J. Sienz, Chemical Engineering Science, 59 (2004), 2969 – 2982.
[1.4] J. C. Schlatter, M. Boudart, Journal of Catalysis, 24 (1972), 482-492.
2.0 Investigation of Coal and Biomass Gasification using In-situ Diagnostics
2.1 Introduction
Coal/biomass gasification can be considered as a three step process: (1) volatile, low molecular weight hydrocarbons are released as the feedstock particles are heated; (2) volatiles combust in the presence of an oxidant; and (3) the remaining char is gasified via heterogeneous reactions. For char consisting mostly of carbon, the following
reactions are active [2.1]
.
C H2O CO H2 ΔH 131 MJ kmol , (2.1)
C CO2 2CO ΔH 172 MJ kmol , (2.2)
C 2H2 CH4 ΔH 75 MJ kmol . (2.3)
These heterogeneous char gasification reactions proceed at a slower rate than the devolatilization or the
homogeneous gas-phase reactions. Therefore, characterization of the kinetics of the heterogeneous char gasification
reactions is vital for the design of coal to liquid fuel systems, and is an important goal of this project.
Most fundamental studies on gasification kinetics that are reported in the literature have been conducted in small-
scale batch-reactor or bed-reactor configurations [2.2, 2.3]
. However, the most common gasifier-type used within the industry is the entrained-flow type. The choice for using entrained-flow reactors is based upon the advantages of the
entrained-flow reactor arrangement that have been summarized by Hotchkiss [2.4]
. Some of the major advantages
include high-throughput of fuel, large conversion efficiencies and the ability to inject dry and wet feed fuels [2.5, 2.6]
. Therefore, there is considerable controversy within the field on the use of the fundamental kinetic rates derived from small-scale batch-type of bed-type reactors for the development of entrained-flow reactor systems.
Furthermore, most fundamental studies on coal/biomass gasification separately study the devolatilization and
gasification processes. In commercial designs, the two processes are not conducted in separate systems but occur
simultaneously and are dependent on the reactor heating rates and pressures. Therefore, the use of devolatilization
kinetics and gasification kinetics separately in devising large-scale industrial gasifiers may not be optimum. It is
necessary to study the kinetics and the evolution of the major species of interest by studying the devolatilization and
gasification reactions simultaneously. In addition, a large number of studies that have been reviewed typically
depend on indirect measurements such as the rate of solid mass decrease or final-equilibrium product analyses to
derive the kinetic rates. These measurement techniques are preferred because tracking the detailed gasification
kinetics is difficult under the high temperature and high pressure conditions inherent to most gasifiers. The indirect
analysis techniques neglect the details of the major gaseous species, such as CO, CO2, CH4, and H2, which are
formed (or consumed) during the gasification process. Optimization of the major species chemical kinetic rates will
help development of efficient gasifier arrangements.
A novel approach for in situ measurements of gas composition and temperature was used with the Tunable Diode
Laser Absorption Spectroscopy (TDLAS). One of the primary objectives of the gasification experiments was to
determine evolution of concentration of the CO and H2O species via real time measurements using TDLAS. Two
reactor configurations were developed for this study: (i) continuous-flow-system (CFS) and (ii) fixed-bed-system
(FBS). The continuous-flow-system was built to emulate the large-scale gasifiers and was provided with an optical
access at various axial locations for in-situ measurements. The fixed-bed-system was developed for understanding the gasification behavior of different types of feedstock in presence of a multi-component gasification environment

Page 24 of 72
AFOSR Grant # FA9550-08-1-0456 Final Performance Report Purdue University
at different operating conditions. Both the systems were equipped with pressure and temperature measurement devices located at suitable positions. A secondary objective was to determine the impact of the continuous flow and fixed bed arrangements on the gasification kinetics. Year 1 of this work was used to perform an extensive review of gasification literature. The team visited various gasification plants in the US to determine the relevant operating parameters for system design. A computation model was created based on chemical kinetic data available in the
literature [2.10]
. The results of the computational study were used to fix the operating parameters for the continuous - flow gasifier arrangement described in this report.
Year 2 of this work was used to design and assemble the continuous-flow gasifier arrangement. The gasifier
arrangement consisted of the optically-accessible reactor vessel, a steam generator, a powder feeder, a heater system,
gas sampling and exhaust system, and instrumentation. The high-pressure and high-temperature conditions of this
study led to significant challenges during system integration. Results demonstrating the system performance are
presented in this report. In addition, preliminary experiments using laser-absorption-spectroscopy were performed.
Year 3 of this work was directed towards fixed bed studies to isolate the experimental challenges associated with the
particle and steam feeder systems and their integration. A fixed-bed reactor system capable of yielding fundamental
gasification and pyrolysis kinetics data was developed. The fixed-bed system incorporated an optically-accessible section for diode-laser-absorption-spectroscopy and the capability for operation at high-pressures. Repeatable
gasification experiments have been conducted using CO2 as the gasification medium and a low-ash pinewood
biomass as the fuel. Laser-absorption-spectroscopy has been used to track the concentration of CO species that was generated through the gasification reaction. Results from these experiments are reported.
The next section describes the design and development of the reactor systems. The theory behind the TDLAS
technique is elaborated on in a later section and the development of optical access is described. Results from the
continuous flow and the fixed bed experiments are presented.
The main objectives of the experimental investigation of gasification include:
1. Study the gasification behavior of different feedstock (bituminous coal, pine wood saw dust) in presence of
single and multi-component gas mixture (CO2, H2O, H2O+H2)
a. Assess the effect of external H2 addition on CO2 emissions
b. Assess the effect of external H2 addition on steam gasification
2. In-situ measurement of H2O and CO using TDLAS technique
2.2 Continuous-Flow Experimental Arrangement
The continuous flow reactor has been described in relevant conferences [2.7-2.10]
. The 2 m long gasifier with an inner
diameter of 7.62 cm operates at temperatures up to 1100 K and pressures up to 10 bar [2.7,2.8]
. In this apparatus, superheated steam is used as the oxidizer for heating and for gasification of carbonaceous material. Steam
gasification offers the advantage of reduced CO2 emissions by avoiding conventional auto-thermal operation [2.11]
.
Superheated steam is produced using a novel H2-O2 chemical steam generator2.9
and is injected into the top of the
gasifier. Simultaneous injection of pulverized coal or biomass is enabled through a high-pressure auger-driven feeder which is also located at the top of the gasifier. The reactant flow rates can be controlled to study the effects of equivalence ratio and particle loading. Excess hydrogen is added to the steam flow to investigate its effects on
the gas product composition [2.12, 2.13]
. Solid particles, dispersed in the steam flow, travel down the length of the gasifier, which is heated externally to maintain nearly isothermal conditions. At the exit of the gasifier, effluent
gases and solid byproducts are separated and collected for post experiment analysis. The effluent gas compositions are analyzed using gas chromatography (GC) and an FTIR based multi-gas analyzer to quantify CO2, CO, CH4, H2,
O2, N2, NO2, NO, and SO2 in the product stream. The solid byproducts are analyzed using scanning electron
microscopy (SEM) and their structure is compared to un-reacted particles to better understand the differences in size, shape, porosity and morphology. In addition to these measurements, the gasifier is equipped with an optically- accessible window section that can be placed at multiple axial locations. This permits TDLAS measurements of

Page 25 of 72
AFOSR Grant # FA9550-08-1-0456 Final Performance Report Purdue University
temperature and water vapor mole fractions at select axial locations. It is expected that the water vapor
concentrations will decrease along the length of the gasifier as the reaction progresses. Therefore, these
measurements will provide quantification of the global reaction progress. One of the major challenges in gasifier
design is the lack of experimental data from arrangements that are scalable with the industrial apparatus. Availability
of detailed real-time experimental data that can be applied to the design of large-scale industrial gasifiers is of
current need.
The operating conditions for the gasifier system were determined from the literature [2.11, 2.12]
. The gasifier was designed to operate at a maximum temperature of 1200 K and a pressure of 1.3 MPa. The reaction temperature was maintained using electrical heating that is rated for 15 kW. This value was chosen based on commercially available
electrical heaters. The steam flow rates and coal flow rates were determined from the work by Sane et al [2.12]
. A summary of the operating conditions is presented in Table 2.1.
Table 2.1: Operating parameters for the continuous-flow gasifier arrangement.
Operating Parameter Value
Pressure 1 – 1.3 MPa
Temperature 1100 – 1400 K
Coal flow rate 0.4 to 0.6 g/s
Steam flow rate 1.2 to 1.8 g/s
External Heating Power 15 kW
The gasification arrangement consisted of six subsystems – an optically accessible entrained-flow gasification
reactor, a hydrogen-oxygen steam generator producing high pressure and temperature steam, a high-pressure
coal/biomass-feeder, an external heater system, an inline gas-sample collector, and a multi-channel data acquisition
and remote-control system. The complete system is represented by the plumbing and instrumentation diagram in
Figure 2.1.
A schematic outlining the operation of the gasifier arrangement is shown in Figure 2.2. Steam and pulverized
coal/biomass were injected into the optically-accessible reactor as simultaneous top-down flows. Energy for the
endothermic gasification reactions (Eq. (2.1) and (2.2)) was provided by the high temperature steam and sustained
by additional electrical heaters along the length of the reactor. Laser diagnostics in the form of tunable-diode-laser-
absorption-spectroscopy was utilized to probe major gas-phase species and temperatures at multiple axial locations
along the gasification reactor. Partially gasified coal/biomass particles were contained in an ash collection system at
the reactor base. Gas products including synthesis gas exited the system via the exhaust line. A control valve on the
exhaust line maintained a constant pressure within the gasification reactor. Finally, a multi-sample gas collection
system was installed at the end of the exhaust tube. The collected gas samples were analyzed using gas
chromatography for species concentrations and were compared with the tunable diode laser-based absorption
spectroscopy data.
Pressure transducers and thermocouples connecting to a multichannel data acquisition system continuously
monitored the conditions of all systems and flows. The multi-channel data-acquisition and control system enabled
remote operation from an adjacent control room. Figure 2.3 displays the gasifier reactor, the hydrogen-oxygen steam
generator and the coal/biomass feeder in a test-ready arrangement, and Figure 2.4 displays the control room
containing the data acquisition and control systems. In the sections that follow, further details are given for each of
the sub-systems.

Page 26 of 72
AFOSR Grant # FA9550-08-1-0456 Final Performance Report Purdue University
PG-N2-01
5000 psi N2
Facility Source
MV-N2-DC
PG
FLT-N2-01
PG-N2-04
PG
MR-N2-04 CK-N2-06
PG-N2-03
PG
MV-N2-04 CK-N2-05
PG-N2-02
PG
PT-N2-01
PT
PV-N2-01
MR-N2-01
MV-N2-01
MV-N2-03
MV-N2-02
CK-N2-04
PG-N2-04
PG
MR-N2-03
MV-N2-04 RV-CF-01
PV-CF-01
PT-H2-02 TC-H2-01
PT T
CR-H2-01 PV-H2-01 C
CK-N2-01
CK-H2-01
CK-N2-07
MR-N2-02
CK-N2-06
0.01 0.007
PG-H2-01 PT-H2-01
PT
0.009
PT-H2-03
PT-O2-01 PG-O2-01
PT PG
HT-RC-01
PG PT PT-H2-04
PT
CK-N2-02
T
CK-H2-02
TC-H2-02
T
0.020
CK-N2-03
PT-O2-03
PT
CR-O2-01
FLT-O2-01
T
3 X TC-RC-
11,12,13
PT
PT-RC-02
CK-CO2-01
PG-CO2-02 PG
MV-CO2-01
RV-CO2-01
FLT-H2-01 C
CR-H2-02 PV-H2-02
RV-W-01
PT-H2-05
PT
PT
PT-SG-01
0.013
0.025
T
CK-O2-01
T
C
PV-O2-01
PT
3 X TC-RC-
08,09,10
T
MV-O2-01 MV-O2-02
Optical
Diagnostics
MR-CO2-01
PG PG-CO2-01
PV-W-01 PT-W-01
MV-W-03 FLT-W-01
PT-W-02
PT
TC-SG-01
TC-O2-01 TC-SG-02
PT-O2-02 3 X TC-RC-
05,06,07
T PT
PV-W-02
T
0.044 Oxygen Cylinders MV-CO2-01 MV-CO2-02
MV-W-02
T
TC-W-01
PT
PT-SG-02
0.12
T
TC-RC-02
CO2
CO2
MV-H2-01
PV-H2ISO-01
Water Tank
MV-W-04
MV-W-01
TC-RC-01
T
RV-PG-01
PT PT-RC-01
TC-PG-01
Cylinder Cylinder
MV-PG-01
TC-PG-02 TC-PG-03
MV-H2-02 T T T
Cooling
Coil
FLT-PG-01 CV-PG-01
Gas Sample
Collection
Hydrogen Bottles
PT
PT-PG-01
Oxygen
Hydrogen
Nitrogen
Steam Coal
Product Gases
Figure 2.1: Plumbing and instrumentation diagram for the continuous-flow reactor arrangement.
Figure 2.2: Schematic of the continuous-flow arrangement.

Page 27 of 72
AFOSR Grant # FA9550-08-1-0456 Final Performance Report Purdue University
Figure 2.3: Gasifier reactor, hydrogen-oxygen
steam generator and coal/biomass feeder in the
test cell.
Figure 2.4: Nitrogen purge control panel, data
acquisition and remote monitoring systems in
control room.
2.2.1 Gasification Reactor Sub-assembly
The gasification reactor is constructed of stainless-steel 316 and has a height of 2.5 meters. The reactor consists of
four interchangeable spool pieces each with an inner-diameter of 7.2 cm and wall-thickness of 2.54 cm. Figure 2.5
displays the physical reactor and its schematic. The reactor expands by approximately 6 cm when heated to 1100 K.
During operation, high-pressure and temperature steam and coal/biomass are injected in the top-most spool piece.
Mixing between the coal/biomass and steam is enhanced by a swirl-flow generated by tangential injection of the
steam into the reactor. Radiant heaters surround the spool pieces to provide 15kW of heat and sustain the
endothermic gasification reactions. The large flanged-section at the bottom of the gasification reactor contains a
dome for collection of ash and partially gasified particles. These particles are subsequently characterized using
scanning electron microscopy (SEM). The system contains two pressure transducers and 20 thermocouples for
temperature measurements.
Figure 2.5: Gasification reactor schematic (left) and actual reactor (right).

Page 28 of 72
AFOSR Grant # FA9550-08-1-0456 Final Performance Report Purdue University
Ga
s t
em
pera
ture
(K
)
Heating tests were performed to check the operability of the heater system and detect any high-temperature related
defects with the gasifier. Figure 2.6 displays the temperature measurements at four axial locations along the length
of the reactor vessel. An approximately constant temperature (1130+/-20K or isothermal within 2%) is measured for
the upper two-thirds of the reactor enabling fundamental gasification experiments.
1200
1000
Coal/
biomass
Inlet
Steam
Inlet
800
600
400
200
0
TC1
TC2
TC3
TC4
0 5 10 15 20
Time (min)
TC1
TW1
TC2
TC3
TW2
TC4
Ash collection
dome
Figure 2.6: Isothermal operation of the heater is verified by heating experiments.
2.2.2 Diode laser absorption spectroscopy and application to a environment
Ttunable-diode-laser-absorption-spectroscopy (TDLAS) is used for in-situ diagnostics of the gas phase temperature
and species concentrations at multiple locations along the length of the entrained flow reactor. Line -of-sight optical
access for the TDLAS measurements is achieved using the optically accessible window section shown in Figure
2.12. Fused silica windows are assembled onto a spool-piece, which can be interchanged with those shown in
Figure 2.5. This allows for TDLAS measurements and flow characterization at four axial locations along the
reactor, providing information on the evolution of the major gas-phase species and reaction temperatures during the
gasification progress.
2.2.2.1 Theory of Laser Absorption Spectroscopy
In direct absorption spectroscopy (DAS) measurements, a collimated laser beam with an intensity of
Ii is shone
through the sample gas, and the transmitted laser intensity It is measured with a detector. When the laser frequency
v [cm-1
] is resonant with the frequency of a transition for the absorbing species in the gas, the laser energy will be
absorbed. The attenuation of the laser intensity along a differential path length of dx can be predicted as follows by
the Einstein theory of radiation,
dI
I PX abs Si (T ( x)) dx
Where P is the pressure, X abs mole fraction of the absorbing species, S
i is the line strength the line strength of the
transition i , T is the temperature and is the line shape function such that d 1 . The line strength is a
function of temperature.
When the gas medium is uniform (i.e. uniform temperature and species distribution), the distribution reduces to the
Beer-Lambert’s law,
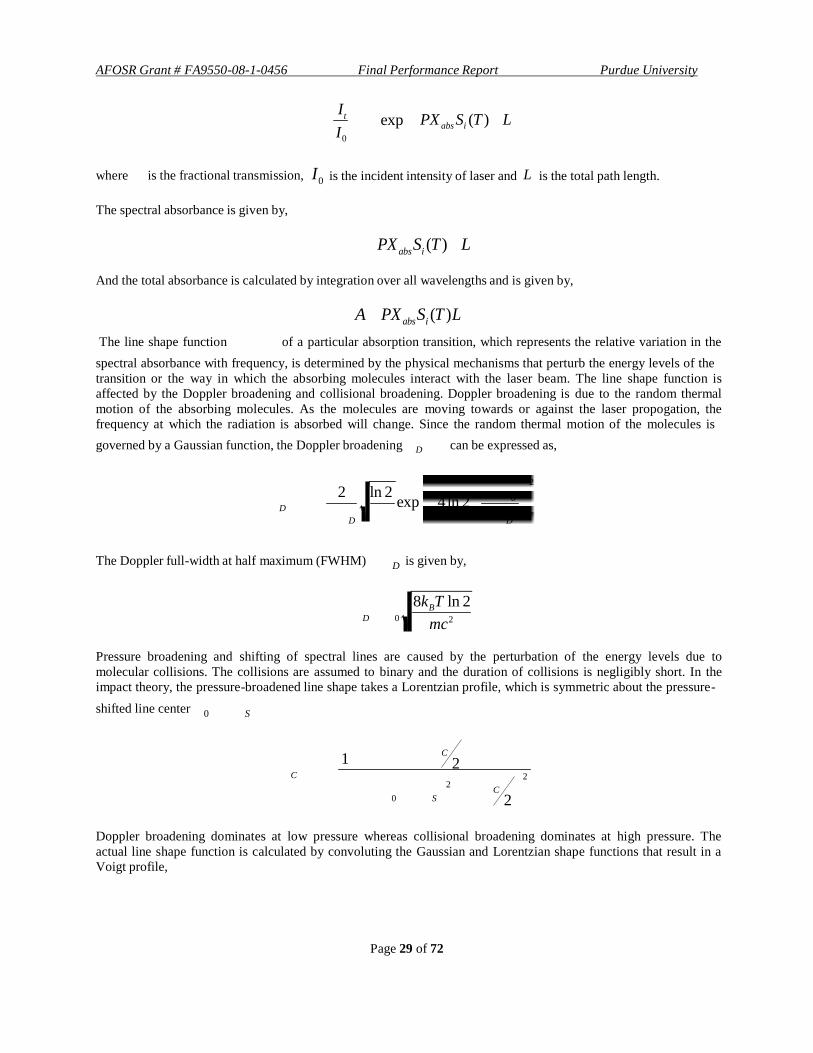
Page 29 of 72
AFOSR Grant # FA9550-08-1-0456 Final Performance Report Purdue University
D
It exp
I0
PX abs Si (T ) L
where is the fractional transmission, I0 is the incident intensity of laser and L is the total path length.
The spectral absorbance is given by,
PX abs
Si (T ) L
And the total absorbance is calculated by integration over all wavelengths and is given by,
A PX
abs S
i (T )L
The line shape function of a particular absorption transition, which represents the relative variation in the
spectral absorbance with frequency, is determined by the physical mechanisms that perturb the energy levels of the
transition or the way in which the absorbing molecules interact with the laser beam. The line shape function is
affected by the Doppler broadening and collisional broadening. Doppler broadening is due to the random thermal
motion of the absorbing molecules. As the molecules are moving towards or against the laser propogation, the
frequency at which the radiation is absorbed will change. Since the random thermal motion of the molecules is
governed by a Gaussian function, the Doppler broadening D can be expressed as,
2
2 ln 2 exp 4 ln 2 0
D D
The Doppler full-width at half maximum (FWHM) D is given by,
8kBT ln 2
D 0 mc2
Pressure broadening and shifting of spectral lines are caused by the perturbation of the energy levels due to
molecular collisions. The collisions are assumed to binary and the duration of collisions is negligibly short. In the
impact theory, the pressure-broadened line shape takes a Lorentzian profile, which is symmetric about the pressure-
shifted line center 0 S
1 C
2 C 2
2 C
0 S 2
Doppler broadening dominates at low pressure whereas collisional broadening dominates at high pressure. The
actual line shape function is calculated by convoluting the Gaussian and Lorentzian shape functions that result in a
Voigt profile,

Page 30 of 72
AFOSR Grant # FA9550-08-1-0456 Final Performance Report Purdue University
Ab
sorb
ance
C
V D u C u du 2 ln 2
V D
aV , w
The normalized Voigt function V (aV
, w) is characterized by two non-dimensional parameters that characterize the
relative effects of Doppler broadening and collisional broadening, and the distance from the pressure shifted line
center:
aV
ln 2 D
w 2 ln 2 0 S
D
The Voigt profile, which has been the basis for most quantitative absorption spectroscopy does not have a simple
analytical form. It is either approximated by complex functions or most often calculated numerically[2.14,2.15]
. For
very small or very large values of aV , the Voigt profile reduces to the Doppler or Lorentzian lineshape respectively.
0.16
P=101325 Pa, XH2O = 0.019, L = 10 cm
P=1933 Pa, XH2O = 1, L = 1 cm
0.14
0.12
0.10
0.08
0.06
0.04
0.02
0.00
7202.0 7202.5 7203.0 7203.5 7204.0
(cm-1)
Figure 2.7: Effect of pressure broadening and shifting (T=296 K)
As an example, the integrated absorbance A , the pressure-induced frequency shift S , as well as the overall
linewidth which includes contributions from both the Doppler FWHM D and collisional FWHM C are
illustrated in Figure 2.7 on the line shapes of H2O transitions at a water vapor mole fraction of 0.019 with/without a
buffer gas of dry air. 2.2.2.2 Design of the proposed TDLAS system
Tunable Diode Laser Absorption Spectroscopy (TDLAS) offers a non-intrusive mehtod of measuring species concentration and temperature inside a multiphase reactive environment. It produces path averaged measurement of gas concentration and temperature. With advent of diode laser technology especially for the telecommunication purposes, the lasers can be tuned to a very narrowband of wavelength and can be scanned over the entire absorption feature. With this tunable feature non-resonant noises can be easily taken care of. A recent review by Hanson et al. [2.16]
gives a detailed description of the technique and its applications. TDLAS has been used for measuring the gas
concentration inside an industrial coal fired power plant [2.17]
. Simultaneous measurements of CO (near 1.65 µm),

Page 31 of 72
AFOSR Grant # FA9550-08-1-0456 Final Performance Report Purdue University
H2O (near 1.4 µm), O2 (near 760 nm) and temperature measurements were made in a 500 MW coal-fired boiler. The
CO data was corrected for H2O interference, similar to the CO measurements in a German coal-fired plant. The
temperature was determined by a fit to multiple water vapor absorption values. CO concentration was monitored for detecting the slagging conditions of the burner. Although absorption spectroscopy sensors for power plants are in their infancy, this pioneering work reveals excellent potential for real-time burner optimization accounting for
changes in the heating value of the input coal. In another study by Lackner et al. [2.18, 2.19]
, the pyrolysis, devolatilization and char combustion of bituminous coal and bio mass (beechwood, firwood) were investigated in a laboratory-scale fluidized bed combustor by TDLAS.
The design of the TDLAS system is based on measurements within high temperature and high pressure reacting
environments that have been reported in the literature. Nagali et al.[2.20]
have reported measurements of temperature and water vapor concentration in a high-pressure shock tube using a 1388-nm diode laser at a temperature range
between 400-1100 K. Li et al. [2.21]
have used 1340-nm and 1393-nm diode lasers to determine water vapor
concentration and temperature measurements within a high-pressure chamber. Upschulte et al. [2.22]
have reported measurements of CO and CO2 concentrations in room temperature gas-mixture and in the exhaust gases of CH4-air
flame using a 1570-nm diode laser. It was noted that the CO concentrations must be relatively high to be measurable
at this wavelength. Wang et al.[2.23]
measured CO concentrations in the exhaust and post-flame regions of an ethylene-air flat flame by using a 2300-nm diode laser. Tunable diode lasers around 1388 nm, 2300 nm, and 1570 nm wavelengths enable the measurement of the H2O, CO2 and CO species concentrations respectively.
2.2.2.3 TDLAS measurements in the entrained flow gasifier
The design of the optical access spool assembly is described in next part. One of the spool sections of the continuous
flow reactor has been modified to hold the optical access. The system is designed for temperatures up to 1300 K at a
pressure of 1.3 MPa. Optical access is available from opposite sides of the spool, allowing transmission and
collection of a laser beam. The windows (fused silica) are 2.54 cm in diameter and 1-cm thick to meet the pressure
and temperature requirements. Nitrogen purge is used for cooling and preventing the deposition of coal particles on
the window surfaces. Graphoil seals have been used to secure the access against pressure leaks at high temperature.
The present experimental arrangement is shown in Figure 2.8. Telecommunication type diode lasers
(NLK1XXGAAA from NTT Electronics Corp.) have been used for the absorption measurement. The lasers are
mounted on mounts (LDM-4980 from ILX Lightwave Corp.) that receive control signals from the laser controller.
The laser diode is controlled through two control signals (i) temperature control and (ii) current control provided by
an ILX Lightwave laser controller (model LDC 3714B). A ramp voltage signal is provided to the laser controller
using a function generator (model 625 from Berkeley Nucleonics). The ramp signal cycles the output current from
the laser controller that in turn cycles the laser output wavelength at a known frequency. Using these control signals
the laser diode is detuned from its centerline frequency to capture various transitions of interest for the absorbing
molecule. Through the fine detuning provided by current control, the entire absorption feature can be captured. The
laser is pre-calibrated for the wavelength output using a wave-meter. The ramp signal and wavelength calibration as
a function of laser current for the 1388 nm laser is shown in Figure 2.9. The laser beam is collimated and then split
into a reference leg and a measurement leg using a beam splitter. The reference leg is further split into two signals
with one going to an etalon and the other to a photo detector (model DET50B from Thorlabs Inc.). Real time
wavelength measurement is provided by the signal presented to the etalon. The reference signal I0 is provided by
the reference photo-diode. The reference signal could also be obtained by fitting a baseline curve using the wings of
the absorption feature. The measurement signal passes through the optical access into the probe volume and is
collected by another photo-diode on the other side. Focusing lenses are used because of the long optical access (~ 53
cm). The signal from the measurement photo-diode and the reference photo-diode is collected by the data
acquisition system. The signals are further processed to calculate the fractional transmission and the absorbance. The
measured absorbance profiles are compared with the simulated absorbance profiles, shown in Figure 2.11, (using
HITRAN database) to calculate the species concentration.
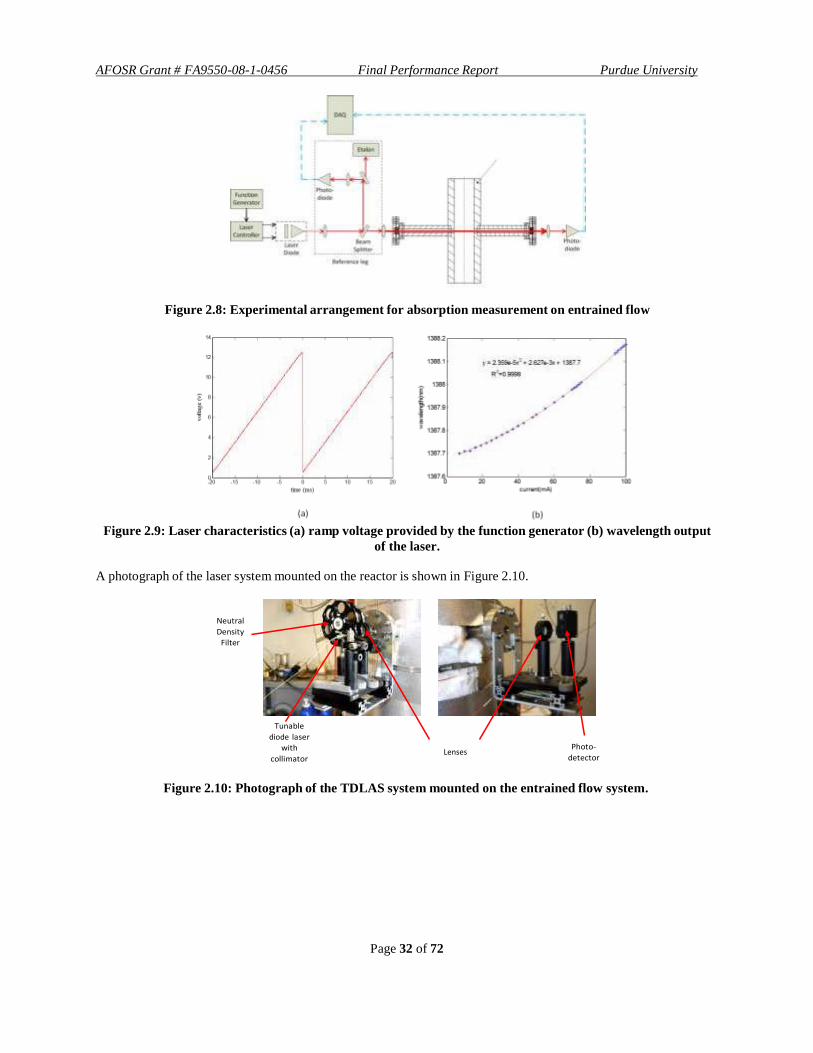
Page 32 of 72
AFOSR Grant # FA9550-08-1-0456 Final Performance Report Purdue University
Figure 2.8: Experimental arrangement for absorption measurement on entrained flow
Figure 2.9: Laser characteristics (a) ramp voltage provided by the function generator (b) wavelength output
of the laser.
A photograph of the laser system mounted on the reactor is shown in Figure 2.10.
Neutral
Density
Filter
Tunable
diode laser
with
collimator
Lenses
Photo-
detector
Figure 2.10: Photograph of the TDLAS system mounted on the entrained flow system.
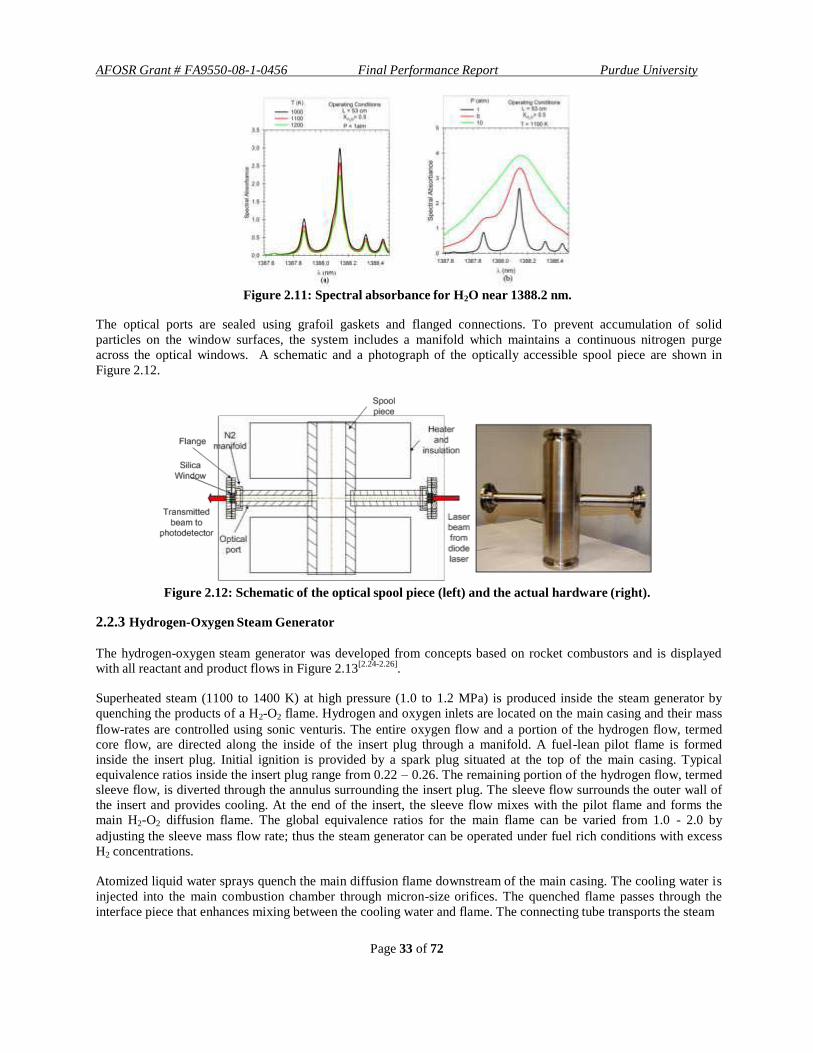
Page 33 of 72
AFOSR Grant # FA9550-08-1-0456 Final Performance Report Purdue University
Figure 2.11: Spectral absorbance for H2O near 1388.2 nm.
The optical ports are sealed using grafoil gaskets and flanged connections. To prevent accumulation of solid
particles on the window surfaces, the system includes a manifold which maintains a continuous nitrogen purge
across the optical windows. A schematic and a photograph of the optically accessible spool piece are shown in
Figure 2.12.
Figure 2.12: Schematic of the optical spool piece (left) and the actual hardware (right).
2.2.3 Hydrogen-Oxygen Steam Generator
The hydrogen-oxygen steam generator was developed from concepts based on rocket combustors and is displayed
with all reactant and product flows in Figure 2.13[2.24-2.26]
.
Superheated steam (1100 to 1400 K) at high pressure (1.0 to 1.2 MPa) is produced inside the steam generator by
quenching the products of a H2-O2 flame. Hydrogen and oxygen inlets are located on the main casing and their mass
flow-rates are controlled using sonic venturis. The entire oxygen flow and a portion of the hydrogen flow, termed core flow, are directed along the inside of the insert plug through a manifold. A fuel-lean pilot flame is formed
inside the insert plug. Initial ignition is provided by a spark plug situated at the top of the main casing. Typical
equivalence ratios inside the insert plug range from 0.22 – 0.26. The remaining portion of the hydrogen flow, termed sleeve flow, is diverted through the annulus surrounding the insert plug. The sleeve flow surrounds the outer wall of
the insert and provides cooling. At the end of the insert, the sleeve flow mixes with the pilot flame and forms the main H2-O2 diffusion flame. The global equivalence ratios for the main flame can be varied from 1.0 - 2.0 by
adjusting the sleeve mass flow rate; thus the steam generator can be operated under fuel rich conditions with excess
H2 concentrations.
Atomized liquid water sprays quench the main diffusion flame downstream of the main casing. The cooling water is
injected into the main combustion chamber through micron-size orifices. The quenched flame passes through the
interface piece that enhances mixing between the cooling water and flame. The connecting tube transports the steam

Page 34 of 72
AFOSR Grant # FA9550-08-1-0456 Final Performance Report Purdue University
from the interface piece to the gasification reactor. Finally, a sonic venturi located at the end of the connecting tube
controls the steam flow-rate. The pressure inside the steam generator is maintained to ensure that the sonic venturi
remains choked.
(a)
steam
(b)
Figure 2.13: The schematic (a) and the actual (b) hydrogen-oxygen steam generator.
Prior to installation in the gasifier, experimental investigations were conducted to verify hardware reliability and
assess the capability to meet the operating parameters shown in Table 2.1. Figure 2.14 shows the steam generator
chamber pressure and steam temperature time history for the first 4 minutes of operation at stoichiometric operating
conditions. Steady state conditions inside the steam generator were achieved after approximately 120 seconds. The
initial spike in the steam generator temperature corresponds to the operation of the spark.
Figure 2.15 also shows a comparison between calculated and measured thermodynamic properties (pressure and
temperature). The thermodynamic properties were calculated iteratively. The chamber pressure was calculated by
starting with an initial guess of temperature for sonic condition at the throat. The calculated pressure was then used
to update the temperature based on adiabatic chemical composition. The iterations were continued until an error
criterion was met (error < 10-9
). For these calculations complete evaporation of liquid cooling water was assumed.
The calculated temperature was assumed to be the stagnation temperature at the exit of the sonic nozzle.
The measured chamber pressures are in good agreement with calculated values. The chamber pressure is found to
increase with increasing equivalence ratios. This increase is attributed to the increased mass flow rates inside the
chamber due to greater hydrogen mass flow rates. The steam temperature was measured using a thermocouple
located at the end of the connecting tube at atmospheric pressure. This measured temperature shows a good
agreement with the calculated temperature at the throat of the sonic venturi.
These results verify operation of the steam generator meeting the design conditions outlined in Table 2.1. Following
these experiments, the steam generator was installed onto the reactor vessel as shown in Figure 2.3 and has been
operated without incident for multiple long duration experiments (30 min).

Page 35 of 72
AFOSR Grant # FA9550-08-1-0456 Final Performance Report Purdue University
Figure 2.14: Steam generator chamber pressure (left) and steam temperature (right) time history for
stoichiometric operation.
Figure 2.15: Comparison of theoretical and experimental steam generator chamber pressure (left) and steam
temperature (right) for varying equivalence ratio.
2.2.4 High-Pressure Coal/Biomass Feeder
A high-pressure powder-feeder system shown in Figure 2.16 is used to displace coal into the gasifier. The system consists of a stainless steel auger (helical screw), a servo motor, a pressurized hopper, a water cooling jacket, and a
reactor interface tube. The hopper holds pulverized feedstock (~50 µm avg. dia.) that falls into the auger tube. The rotating auger displaces a metered quantity of feedstock into the feed tube. The feed tube is pressurized with nitrogen that reduces the penetration of steam into the feeder and pushes the coal from the tip of the tube into the reactor. A nitrogen feedback line is connected between the feed tube and the hopper to achieve a minimum pressure
gradient across the positive feed system. This makes the flow rate of the coal feed and its measurement independent
of the downstream reactor pressure. Farias et al.[2.27]
used a similar feeder design for operation at high pressure.
The coal feeder is designed for operation at 2 MPa while maintaining a temperature of 300 K. The water cooling
jacket helps to maintain this temperature by removing heat conducted from the reactor along the tubing. Dynamic
sealing between the slowly rotating auger shaft and the auger tube is achieved through two Viton O-rings placed
inside the auger tube. The feeder interfaces with the reactor through a high-pressure and high temperature coupling.
The feeder is supported from a pulley and is counterbalanced using a balancing weight, allowing it to move fre ely as
the reactor vessel expands and contracts vertically. This motion eliminates bending moments and stresses on the
feeder tube and auger.
Operation of a pressurized screw feeder was demonstrated at atmospheric and high pressure conditions.
Experimental arrangement and procedures for calibration of the feeder were developed and demonstrated using
anthracite and bituminous coal and coconut char. Good repeatability in measurements was obtained for coconut char
calibration at both atmospheric and high pressure. The experimental results were compared with theoretical

Page 36 of 72
AFOSR Grant # FA9550-08-1-0456 Final Performance Report Purdue University
calculations and were in close agreement with each other. An optically-accessible flange was incorporated in the
feeder design to monitor the experiment. These observations were used to improve the feeder performance by
making changes to the vibrator parameters on the hopper and the test procedures. The effect of moisture on the
flowability of coal and biomass was studied and it was concluded that dry feedstock is essential for proper flow from
the feeder. This was accomplished by baking of feedstock before experiment and storage in an inert environment.
Figure 2.16: Schematic (left) and image (right) of the coal/biomass feeder.
Figure 2.17 displays the mass flow-rate calibration curve as a function of the motor speed for Anthracite type coal
and coconut char. The coals and biomass are typically ground to approximately 50-micron particle sizes. Slurry
rheologies and granular-flow phenomenon determines the shapes of the curves. Calculations based on the work by
Sander and Schonert were performed and are presented with the experimental curves. Parameters for the calculation
are summarized in the Appendix.
(a) (b)
Figure 2.17: Anthracite coal (left) and coconut char (right) flow-rate trend with motor speed.
2.2.5 Gas Sampling and Collection
Figure 2.18 displays a schematic of the gas sampling and collection system. This system contains a filter to remove
solid particulates, a condenser and liquid-gas separator to remove water, and a line for capturing gas samples into
sample bags for analysis using a gas chromatograph. Initially, the sampling bags are evacuated using a vacuum
pump. A sample is collected by directing the exhaust gases into the sampling bag. Once filled, the sampling bag is
sealed and the gases are directed to the exhaust again. The manual sampling system enables sampling at
approximately 1 minute intervals.

Page 37 of 72
AFOSR Grant # FA9550-08-1-0456 Final Performance Report Purdue University
Figure 2.18: Schematic of the gas sampling and collection system.
2.2.6 Continuous Flow System Results and Discussion
Following design, construction, and calibration of all of the sub-components, the entire system was integrated for
preliminary gasification experiments. At the start of such an experiment, the reactor was heated to the desired
temperature using the radiant heaters. During the heat-up, the reactor is continuously purged with nitrogen. The
outer-wall temperatures of each spool piece as well as the gas-phase temperature within the reactor are continuously
monitored using shielded thermocouples. Once the reactor temperatures reach the desired temperature, a
gasification experiment is initiated. The heating period can require up to 6 hours.
The gasification experiment begins by ignition of the hydrogen-oxygen steam generator. This results in a rise in
pressure and temperature within the steam generator as shown in Figure 2.14. Within a few minutes, the steam
generator achieves steady state operation. At this point, coal is injected using the coal feeder. Release of volatiles
and gasification of the char causes an increase in the total system pressure. Finally, the system pressure is slowly
brought to the desired operating conditions by adjusting the pressure drop across a computer-regulated needle valve
located in the exhaust stream. Once the system reaches steady-state operation, gas samples are collected using the
sampling system.
A number of system-integration experiments have been performed. Product gas analysis of the collected gas samples has indicated the presence of carbon containing species including CO, CH4, and CO2. This is strong
evidence of successful gasification.
The objectives of this experiment included:
1. Demonstrate the operation of the continuous-flow gasifier arrangement through the gasification of coconut
char particles in a steam enviorment.
2. Peform preliminary TDLAS measurements to demonstrate TDLAS operation.
Table 2.2 lists the operating parameters of the gasifier integration tests. The number of operating parameters
conveys the complexity associated with the operation of the continuous-flow gasifier arrangement.
Table 2.2: Operating parameters for the biomass gasification experiment.
Operation Parameter
Unit
Value
Total hydrogen mass flow rate g/s 0.51
Oxygen mass flow rate g/s 2.66
Cooling water mass flow rate g/s 6.57
Steam flow rate to gasifier g/s 1.2
Steam flow rate to vent g/s 8.6

Page 38 of 72
AFOSR Grant # FA9550-08-1-0456 Final Performance Report Purdue University
Total steam flow rate g/s 9.8
Steam generator equivalence ratio g/g 1.5
Feedstock Coconut
char 5562
Average particle size micron 50
Feedstock preparation Baked at 100 oC for 12
hours and stored in an
inert glove-box prior to
gasification.
Feedstock flow rate g/s 0.12
Nitrogen flow rate for optical window purge
g/s
0.04
Nitrogen flow rate through coal feeder g/s 0.09
Total nitrogen flow rate g/s 0.13
Heater set point temperature K 1100
Reactor pressure MPa 1
Diagnostics
TDLAS, high-speed imaging, pressure and
temperature measurement,
product gas
characterization using
Multi Gas Analyzer.
Multiple gas samples were collected during the experiments. The first sample was collected before the start of the
powder feeder. This sample can be used to quantify the products of combustion from the H2-O2 steam generator and
to determine gas-phase carbon containing species that may be present due to gasification of small amounts of residual coal and char within the gasifier. Table 2.3 presents a summary of events during the experiment.
Table 2.3: Summary of experimental operation.
Event
Time from start of steam generator
Steam generator started 0
Background sample (Sample 1) collected at gasifier pressure 72 psia
8 min 45 s
Coal feeder started 10 min 40 s
Sample 2 collection started at gasifier pressure 145 psia 16 min 10 s
Sample 3 collection started at gasifier pressure 140 psia 20 min 10 s
Coal feeder stopped 27 min 30 s
Sample 4 collection started at gasifier pressure 137 psia 30 min
Steam generator stopped 30 min
Total test duration 30 min
Coal feed duration 17 min 40 s
Figure 2.20 shows the experimental reactor pressures verified with three independent pressure transducers.
Following the start of the steam generator and closure of the control valve, the reactor pressure raised to 0.50 MPa at
which point the first gas sample was obtained. Following this, the reactor pressure was allowed to continue
increasing until it stabilized at approximately 0.76 MPa. At that point, the feeder was started to inject biomass into

Page 39 of 72
AFOSR Grant # FA9550-08-1-0456 Final Performance Report Purdue University
the reactor. Entrained flow was verified using high-speed imaging through the optical access for entrained biomass
particles. Following biomass injection, the pressure within the gasifier rose, possibly due to gasification. As the
pressure approached approximately 1 MPa, the control valve was manipulated to maintain an approximately
constant pressure. Five minutes and thirty seconds after the start of the biomass feed the second gas sample was
obtained. A third and fourth sample was obtained at 9 min 30 s and 19 min 20 s after the start of the feeder
respectively.
High speed visible imaging was used to visualize a coal particle laden steam flow through the optically accessible
gasification chamber at a pressure of 1 MPa and a temperature of 1100K. A high-speed camera (Vision Research
Phantom v7) with a 105 mm lens was mounted perpendicular to gasification chamber and focused on the chamber
centerline. A 1000 W arc lamp and diffuser plate were positioned on the opposite side of the chamber to provide
adequate backlighting conditions. The spatial resolution was approximately 80 μm for each pixel at the center of the
chamber. The camera integration time (20 μs) and aperture size were adjusted to optimize the camera sensitivity.
Data was collected at a nominal sampling frequency of 10 kHz resulting in 100 μs between consecutive images.
Figure 2.19 (a) - (f) show six representative visible images of the coal particles flowing through the gasification
chamber. The field of view is approximately 24 mm square, and the flow direction is from top to bottom in the
same direction as gravity. Well-established correlation-based tracking techniques, developed and utilized within the
particle image velocimetry community, were applied to these path-integrated measurements. The average velocity
of the particles is estimated to be 0.6 m/s resulting in an expected residence time of 2.5 s based on the 1.5 m length
of uniformly heated gasification chamber. The large range of individual particle sizes apparent in the images leads
to a range of particle velocities. Additional analysis will estimate a probability density function of the velocity
distribution.
(a) (b) (c)
(d) (e) (f)
Figure 2.19: High speed visible images of a coal laden particle flow through a gasification chamber at a
pressure of 1 MPa and temperature of 1100 K.
Near the conclusion of the gasification experiment, the biomass feeder stalled. This indicated a possible clogging of
the feeder. At that point, nitrogen was rapidly injected into the feeder using a line installed prior to experiment for
this specific purpose. This nitrogen injection resulted in the pressure and temperature variations seen in Figure 2.20
and Figure 2.21. After this injection, the feeder was started again, but became clogged shortly thereafter. At that
point, the experiment was stopped to diagnose the feeder issues.

Page 40 of 72
AFOSR Grant # FA9550-08-1-0456 Final Performance Report Purdue University
Pre
ssure
(psia
) /
Contr
ol V
alv
e P
ositio
n (%
open)
Te
mpera
ture
(K
)
300
250
Reactor bottom
Reactor top
Downstream of filter
Control Valve Position
1300
1250
1200
Spool 4 center
Spool center 3
Spool center 2
Spool Center 1
200
1150
150
100
50
CF Start
Bkgrnd
1 2 3
1100
1050
1000
950
0
0 500 1000 1500 2000
Time [sec]
900
0 500 1000 1500 2000
Time [sec]
Figure 2.20: Pressure in the reactor vessel during
the gasification experiment.
Figure 2.21: Gas-phase temperatures at the center
of the reactor.
Four gas samples were collected during the gasification experiment. The collection times for the samples are given in Table 2.3. The MGA is capable of detecting CO2, CO, CH4, NO, NH3, C2H6, C2H4, O2, C2H2, H2O, SO2, NO2,
C3H6 and C3H8. However, only the major constituents of interest are reported here.
Table 2.4: Gas composition as measured with the MGA.
Species CO (%) CO2 (%) O2 (%) CH4 (%)
Sample 1 0.21 1.64 0.7 0.14
Sample 2 0.64 1.15 0.9 0.14
Sample 3 0.38 1.00 0.6 0.13
Sample 4 0.15 0.80 0.6 0.09
The presence of carbon-containing gas-phase species verified that gasification reactions had occurred. Further
integration experiments were required to attain full operability of the system. However, time and man-power
constraints forced the group to pursue testing on a smaller and simpler fixed-bed, which will be described in the next
section.
Identical experiments were conducted using an anthracite coal as the feedstock. In this experiment, ten samples were
collected using gas sampling bags as opposed to cylinders. The temperature and pressure history during the
gasification experiment are presented in Figure 2.22 and Figure 2.23 respectively. Figure 2.23 also shows the
instance of product gas collection during the gasification experiment.
start of coal feeder 8
3
6 7 2 4 5
1
Figure 2.22: Temperature history for the reactor
during the anthracite gasification experiment. Figure 2.23: Pressure history for the reactor
during the anthracite gasification experiment.
Instance of sample collection are indicated by
numbers.

Page 41 of 72
AFOSR Grant # FA9550-08-1-0456 Final Performance Report Purdue University
Mo
lar
Con
ce
ntr
atio
n (
%)
Product gas composition showed the presence of carbon-containing gas-phase species. The dry gas composition
demonstrates the onset of gasification and is presented in Figure 2.24.
1.8
1.6
1.4
1.2
H
2/100
O2/10
CH4
CO
CO2
1.0
0.8
0.6
0.4
0.2
0.0
1 2 3 4 5 6 7 8
Sample No.
Figure 2.24: Dry product gas composition.
These experiments have been repeated using coconut char based biomass and anthracite coal. The experiments
demonstrate that gasification is occurring within the continuous-flow system. Future work on the gasifier will
include TDLAS measurements for water-vapour and CO composition and gas-phase temperatures. The objective of
the studies will be to develop in-situ measurement techniques for monitoring gasifier operation and determine
chemical reaction rate constants. Due to the significant human and time needed to operate the system for a single
test, studies were shifted to a smaller and more fundamental fixed-bed configuration that will be discussed next.
2.3 Fixed Bed System
2.3.1.1 Design of the Fixed Bed System
The fixed bed reactor system is built to supplement the continuous flow reactor experimentation. The main
objectives for the fixed bed reactor system include:
1. Study the gasification behavior of different carbonaceous feed-stocks (bituminous coal and pine wood saw
dust) in presence of single and multi-component gasification environment at different operating parameters
2. Assess the effect of excess H2 addition to the steam gasification reaction and subsequent CO2 production
3. In situ real time measurement of H2O and CO concentration just downstream of (~ 2 cm) the porous bed 4. In situ gas measurement very near to the fuel particle
Figure 2.25 shows the experimental arrangement for the fixed bed experiment. The optical spool section described
in the previous section forms the main reactor. A shorter spool section that houses the inlets for reactant gases and
pressure measurement device is attached to the optically accesible section with the use of special Grayloc®
connectors and seals. These seals are designed for high temperature (~1200 K) and high pressure (~ 1.1 MPa)
operation. A similar but smaller spool section that houses the exit port of the reactor is attached to the lower part of
the optical piece with similar connections. A stainless steel pipe with OD of 7.3 cm is placed inside the reactor
resting on the bottom most flat surface. Thie pipe supports a porous bed made out of stainless steel 316 sieves. The
pipe is not be subject to any pressure loading as it sits inside the pressure vessel. Coal/biomass particles are loaded
on a fixed porous bed. The reactant gases enter from the top of the reactor and flow over the fixed bed after passing
through a flow straightner. The product gases are formed near the bed and exit the reactor at the bottom. The flow is
driven by pressure that is controlled by a control valve downstream of the exit of reactor. The pressure inside the
reactor can be controlled at any value between 0.1 to 1.1 MPa by tuning the control valve downstream of the exit of
the reactor to an appropraite value. The maximum allowed temperature temperature in the reactor is ~ 1300K but
operating temperature depends on the severity of corrosive environments induced by the reactant gases. The reactor

Page 42 of 72
AFOSR Grant # FA9550-08-1-0456 Final Performance Report Purdue University
assembly is surrounded by two sets of radiant heaters as shown in Figure 2.25. Radiant heaters provide isothermal
environment for the gasification reactions.
Front View Right View
Flange clamps Reactant gas inlet
Sealing gaskets
Honeycomb (flow straightner)
Fixed Bed
Optical access
Radiant Heaters
SS pipe supporting the bed
Reactant gas exit
Figure 2.25: Fixed bed reactor arrangement.
2.3.1.2 CO measurement using TDLAS on fixed bed reactor
The survey spectra for CO and CO2 between 1 and 5 micron are shown in Figure 2.26 (a). The transition of interest
for CO lies in the first overtone band (2v) which is shown in Figure 2.26 (b). The combined survey spectra show negligible interference due to CO2. The experimental arrangement for CO measurements is shown in Figure 2.27.
The arrangement is similar to the arrangement for H2O detection that has been described above. Hence all the details
are not provided. The laser used for the experiment was a high powered DFB diode laser (Sacher Lasertechnik Group) tuned at central wavelength of 2337.4 nm. The effect of temperature and pressure on spectral absorbance of CO is shown in Figure 2.28. The absorbance is found to decrease with increase in temperature and increase with increase in pressure. The behavior is expected.
(a) (b)
Figure 2.26: Survey spectra at 298 K using (HITRAN 2008) (a) for CO and CO2 (b) transition of interest for
CO.
The spectral absorption curves for CO near this wavelength simulated using HITRAN are shown in Figure 2.28.

Page 43 of 72
AFOSR Grant # FA9550-08-1-0456 Final Performance Report Purdue University
DAQ
Etalon
Function
Generator
Laser
Controller
Photo-
diode
(1)
(2)
Optical access
Laser
Diode
Beam Splitter
Reference leg
(3) Photo- diode
Figure 2.27: TDLAS arrangement for CO detection in the fixed bed.
Figure 2.28: Spectral absorbance for CO in the vicinity of 2337.4 nm.
The calibration of laser was done using a pressure cell with fused silica windows. This method was chosen because
the available wave-meter could not measure the wavelength in the desired range. Laser scans were taken for
reference gas (Air) and a CO + Argon gas mixture (1% CO). The laser scans are shown in Figure 2.29 (a) with y-
axis showing the detector output and x-axis showing the laser current. Transmission as a function of current was
obtained from CO and Air scans as shown in Figure 2.29 (b).
Figure 2.29: Laser scans for wavelength vs. current calibration.

Page 44 of 72
AFOSR Grant # FA9550-08-1-0456 Final Performance Report Purdue University
Figure 2.30: Calibration of laser (a) data fit with HITRAN simulation (b) wavenumber as a function of laser
current.
The experimental scan was compared with the HITRAN simulation of transmission vs. wave-number for given
conditions of pressure (1.8 atm), temperature (298 K) and mole fraction of CO (1%). A data fit for laser temp erature
of 40 C is shown in Figure 2.30 (a). Wavelength vs. current correlation was obtained from this data fit as shown in
Figure 2.30 (b).
CO was detected by probing the R(4) line in a CO+CO2+Air mixture. The mixture was used because similar
reaction environment is expected during gasification. The laser scans are shown in Figure 2.31.
(a) (b)
Figure 2.31: Laser scans (a) in N2 (b) in CO+CO2+Air mixture.
(a) (b)
Figure 2.32: Transmission comparison (at T = 301 K and P = 1 atm) (a) data for transmission calculation (b)
data fit with simulation.
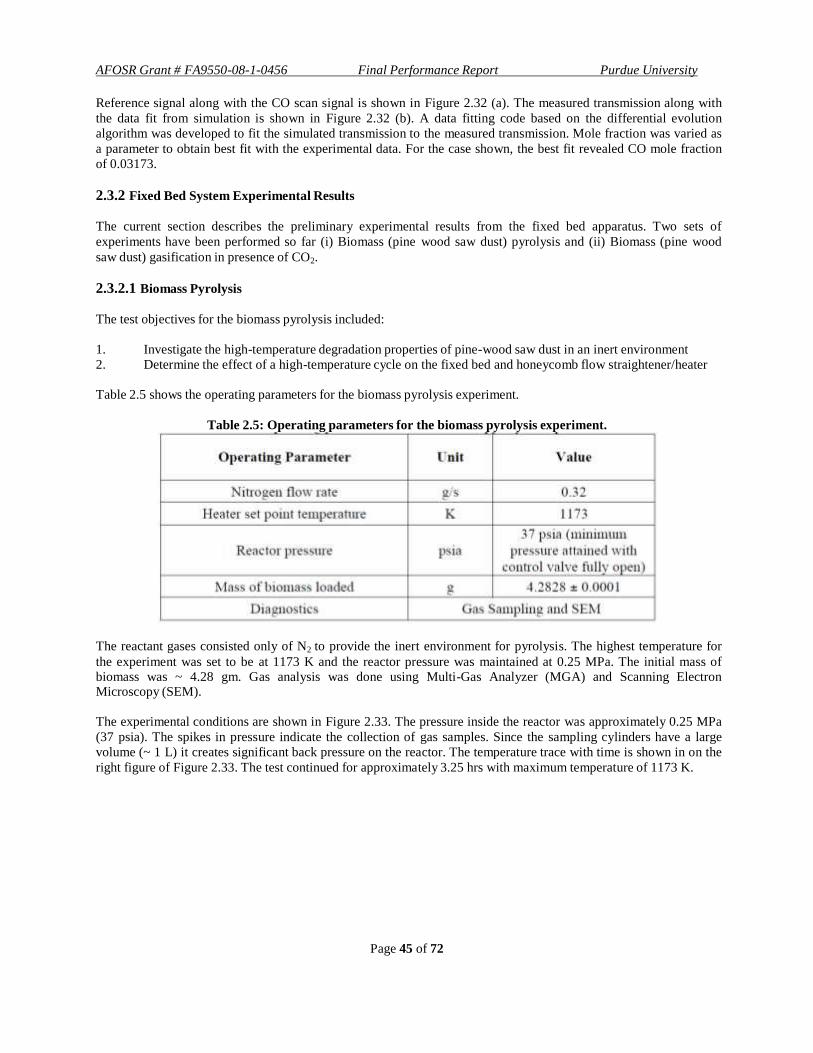
Page 45 of 72
AFOSR Grant # FA9550-08-1-0456 Final Performance Report Purdue University
Reference signal along with the CO scan signal is shown in Figure 2.32 (a). The measured transmission along with
the data fit from simulation is shown in Figure 2.32 (b). A data fitting code based on the differential evolution
algorithm was developed to fit the simulated transmission to the measured transmission. Mole fraction was varied as
a parameter to obtain best fit with the experimental data. For the case shown, the best fit revealed CO mole fraction
of 0.03173.
2.3.2 Fixed Bed System Experimental Results
The current section describes the preliminary experimental results from the fixed bed apparatus. Two sets of
experiments have been performed so far (i) Biomass (pine wood saw dust) pyrolysis and (ii) Biomass (pine wood
saw dust) gasification in presence of CO2.
2.3.2.1 Biomass Pyrolysis
The test objectives for the biomass pyrolysis included:
1. Investigate the high-temperature degradation properties of pine-wood saw dust in an inert environment
2. Determine the effect of a high-temperature cycle on the fixed bed and honeycomb flow straightener/heater
Table 2.5 shows the operating parameters for the biomass pyrolysis experiment.
Table 2.5: Operating parameters for the biomass pyrolysis experiment.
The reactant gases consisted only of N2 to provide the inert environment for pyrolysis. The highest temperature for
the experiment was set to be at 1173 K and the reactor pressure was maintained at 0.25 MPa. The initial mass of biomass was ~ 4.28 gm. Gas analysis was done using Multi-Gas Analyzer (MGA) and Scanning Electron Microscopy (SEM).
The experimental conditions are shown in Figure 2.33. The pressure inside the reactor was approximately 0.25 MPa
(37 psia). The spikes in pressure indicate the collection of gas samples. Since the sampling cylinders have a large
volume (~ 1 L) it creates significant back pressure on the reactor. The temperature trace with time is shown in on the
right figure of Figure 2.33. The test continued for approximately 3.25 hrs with maximum temperature of 1173 K.

Page 46 of 72
AFOSR Grant # FA9550-08-1-0456 Final Performance Report Purdue University
Figure 2.33: Pressure (left) and temperature (right) of the bed during inert heating.
Figure 2.34: Pre and post experiment images of the bed.
The pre and post test images of the biomass in the porous bed are shown in Figure 2.34. As shown in the figure, the biomass shows a significant structural change along with substantial solid mass loss. The mass loss was measured to be 84.1% with uncertainty of 1%. The biomass appears to be shrunk due to pyrolysis. The volatile release from
biomass lies in the reported range of 70 to 90% that is typical for pine wood saw dust biomass[2.28]
.
The results of gas analysis are shown in Table 2.6. The samples were collected at bed temperature of 573, 773, 973 and 1100 K respectively. The analysis shows that water vapor concentration decreases with increase in temperature.
CO and CO2 are found to be highest in sample 1 indicating highest degree of pyrolysis. Presence of aldehydes is
observed in the products which is a typical observation for woody biomass.
Table 2.6: Product gas composition for the pyrolysis experiment.
The biomass pyrolysis experiment showed the successful operation of the fixed bed reactor. The values obtained for
the mass loss during pyrolysis are found to be in good agreement with the reported values.

Page 47 of 72
AFOSR Grant # FA9550-08-1-0456 Final Performance Report Purdue University
2.3.2.2 Biomass Gasification with CO2
Five experiments were conducted to investigate the gasification behavior of pinewood in the presence of CO 2.The
objective of the experiments was to: 1) investigate the high-temperature gasification of biomass in presence of CO2
and 2) demonstrate the use of TDLAS for gas-phase specie measurements in a gasifier.
Table 2.7: Operating conditions for the gasification experiment.
Operating Parameter Unit Tests 1 & 2 Test 3 & 4 Test 5
Nitrogen flow rate g/s 0.05 0.050 0.05
CO2 flow rate g/s 0.15 0.150 0.074
Bed temperature K 1100 1100 1150
Reactor pressure MPa 0.1 (atmospheric) 0.1 (atmospheric) 0.1 (atmospheric)
Mass of biomass loaded g 6.5
Diagnostics Gas sampling, SEM, EDS
Gas sampling, SEM, EDS
Gas sampling, TDLAS
Test duration minutes 30 60 60
The operating conditions for all experiments are shown in Table 2.7. Pyrolysis formed the first step of the
experiment. The biomass sample was heated to the set bed temperature in an inert environment consisting of N2.
After that, the flow was switched to CO2 with N2 flowing as a tracer gas. The reactor pressure was maintained at
nearly atmospheric condition. The initial solid mass loading was kept constant at approximate 6.5 grams. Gas chromatography was used to determine the product gas composition and SEM was used to analyze the structure of the biomass particles. TDLAS was utilized in the third experiment for tracking the concentration of CO from the gasification reaction.
The experimental conditions of pressure and temperature during Tests 1 and 2 are shown in Figure 2.35. The
temperature graph plot represents the entire experiment thus the time scale ranges for 3.5 hrs. The pressure in the
reactor during the gasification experiment is maintained at nearly atmospheric conditions as shown. The negative
spikes indicate the operation of the vacuum pump just before collecting each sample. The temperature of the bed is
maintained around 1100 K for the gasification experiment as shown in Figure 2.36. Tests 3 and 4 were conducted at
similar conditions for sixty minute duration.
Figure 2.35: Experimental conditions for biomass gasification during Test 1. Temperature (left) and pressure
(right) for the complete experiment - inert heating and gasification - are shown.

Page 48 of 72
AFOSR Grant # FA9550-08-1-0456 Final Performance Report Purdue University
Figure 2.36: A close-up of the bed temperature during the gasification stage.
Figure 2.37 shows the image of the biomass contained in the bed after the experiment. The mass loss during the
experiment was ~ 95% of the original mass of the biomass with uncertainty of 1%. Formation of ash was visible on
some particle indicating that the gasification was initiated during the experiment.
Figure 2.37: Pinewood sampled retrieved after the gasification experiment.
(a) (b)
Figure 2.38: Product gas analysis post gasification test (a) major species and (b) minor species.
The product gas analysis from Test 1 is depicted in Figure 2.38. CO2 was used as the main gasifying agent and N2 as
the main tracer gas. These two gases constitute the major species in the products, as shown in Figure 2.38 (a). The minor species are shown in Figure 2.38 (b). A similar minor species product gas composition for Test 2 is shown in
Figure 2.39. CO concentration is highest at the in the initial stages of gasification in both experiments. Thereafter, the CO concentration decreases and gradually increases with sample number (also corresponding to increase in time)
with a second peak around sample number 10 to 13 (~ 10 to 13 min). After that it is found to tail off with increased
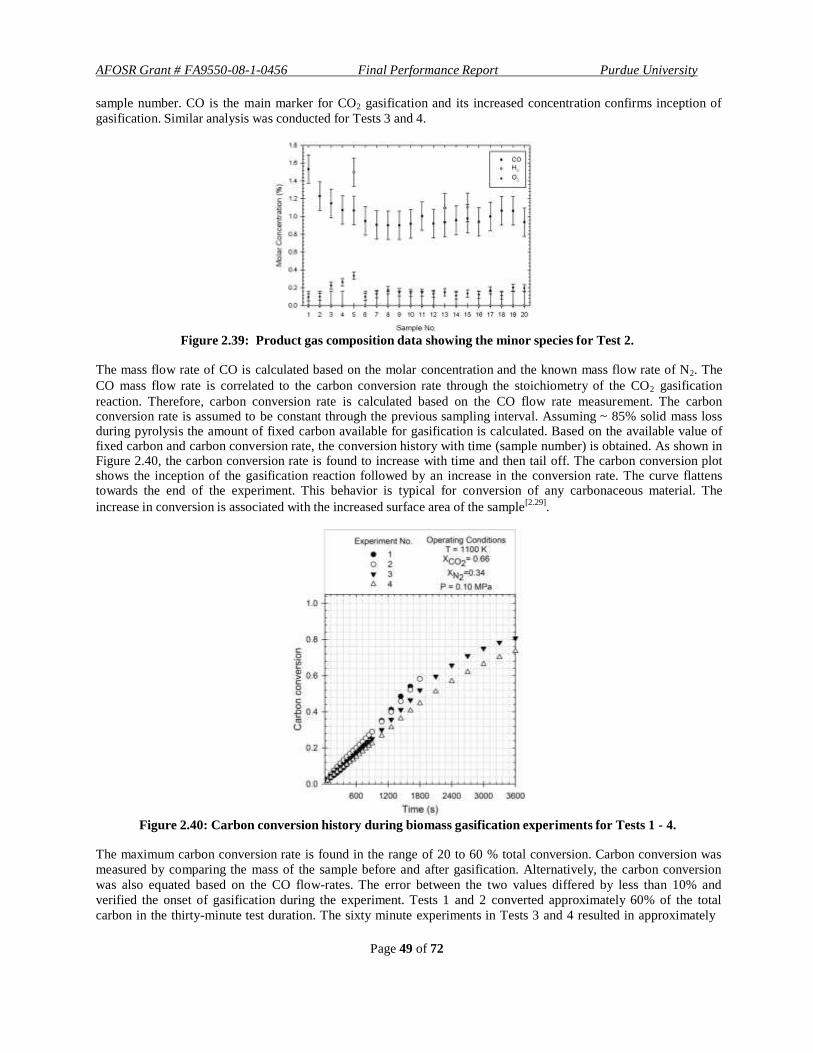
Page 49 of 72
AFOSR Grant # FA9550-08-1-0456 Final Performance Report Purdue University
sample number. CO is the main marker for CO2 gasification and its increased concentration confirms inception of
gasification. Similar analysis was conducted for Tests 3 and 4.
Figure 2.39: Product gas composition data showing the minor species for Test 2.
The mass flow rate of CO is calculated based on the molar concentration and the known mass flow rate of N2. The
CO mass flow rate is correlated to the carbon conversion rate through the stoichiometry of the CO2 gasification
reaction. Therefore, carbon conversion rate is calculated based on the CO flow rate measurement. The carbon conversion rate is assumed to be constant through the previous sampling interval. Assuming ~ 85% solid mass loss during pyrolysis the amount of fixed carbon available for gasification is calculated. Based on the available value of fixed carbon and carbon conversion rate, the conversion history with time (sample number) is obtained. As shown in Figure 2.40, the carbon conversion rate is found to increase with time and then tail off. The carbon conversion plot shows the inception of the gasification reaction followed by an increase in the conversion rate. The curve flattens towards the end of the experiment. This behavior is typical for conversion of any carbonaceous material. The
increase in conversion is associated with the increased surface area of the sample[2.29]
.
Figure 2.40: Carbon conversion history during biomass gasification experiments for Tests 1 - 4.
The maximum carbon conversion rate is found in the range of 20 to 60 % total conversion. Carbon conversion was
measured by comparing the mass of the sample before and after gasification. Alternatively, the carbon conversion
was also equated based on the CO flow-rates. The error between the two values differed by less than 10% and
verified the onset of gasification during the experiment. Tests 1 and 2 converted approximately 60% of the total
carbon in the thirty-minute test duration. The sixty minute experiments in Tests 3 and 4 resulted in approximately

Page 50 of 72
AFOSR Grant # FA9550-08-1-0456 Final Performance Report Purdue University
80% carbon conversion. The remaining mass consists of carbon and ash. The resilient carbon is thought to be a
byproduct of long-duration and high-temperature annealing[2.30]
. Future work to investigate the characteristics of the
resilient carbon is planned utilizing the x-ray diffraction technique (XRD).
Scanning electron microscopy was used to acquire and compare micrographs of the original sawdust and post- experiment biomass from the CO2 gasification experiment. A sample of representative images from Tests 1 and 2
are presented in this report. Images of gold-coated specimen were acquired at magnifications from 65X to 250X at
an electron beam acceleration voltage of 10kV. The images in this report have been resized and do not retain their original magnifications. Additional imaging parameters included a working distance of approximately 10 mm and a
beam spot size of 4.
Figure 2.41 shows two images (a,b) of the sawdust used for the gasification experiment. Each sawdust strand was
several millimeters in length and approximately 5 millimeters in width. Therefore, a group of sawdust could not be
imaged even at the lowest magnification (20X) via the SEM. Images ‘a’ and ‘b’ represent the biomass surface at 65
and 250X respectively.
A fibrous material covers the biomass surface in image ‘a’. The material appears soft and leafy at 65X. The material
crisscrosses across the surface and covers the biomass surface in multiple layers, as that within an onion. Image ‘b’,
acquired at 250X, shows that the fibrous material is composed of parallel wall-like structures that give the sawdust
and other woody material their strength and shape. In addition, large pores and crevices are visible throughout the
surface of the sawdust at both magnifications. Large divisions between layers enable fluids to penetrate into the
strands thus enhancing the apparent reactivity of biomass samples reported in the literature. The resolutions for the
unedited images ‘a’ and ‘b’ are 1.28 µm and 0.33 µm respectively.
a) b)
Figure 2.41: Images of non-gasified sawdust particles.
Figure 2.42 shows five images (a-e) of the post-experiment biomass residue. Images ‘a’ and ‘b’, acquired at 65X
and 250X respectively, show a coarse biomass surface texture in comparison to the original feedstock. The images
show large divisions between parallel fiber strands and transverse fractures across groups of parallel strands. Image
‘c’, acquired at 1000X, shows that the multilayered structure of the biomass (Figure 1.36) has deteriorated; the outer
walls of the biomass fibers have been consumed thus revealing skeleton-like interior features. The remaining
structures appear stiff, coarse, hollow, thin-walled and tubular. The structure in image ‘c’ evokes characteristics of
dry bamboo or tree bark. Macro pore formation is evident in all three images discussed.
Images ‘d’ and ‘e’ have been acquired at 2000X and 12000X respectively. The objective of these images is to
determine the extent of pore formation within the biomass. Image ‘d’ shows enhanced macro pore propagation
across the biomass particle. The literature discusses the importance of the micro pore formation in the overall pore
development mechanism that occurs during pyrolysis and the onset of gasification; however, the multiple-scale pore
structures are seldom shown in a single image, as in image ‘e’. Image ‘e’ shows the complexities presented by the
multi-scale pore dimensions towards mathematical representation. Furthermore, images ‘d’ and ‘e’ also show that
micropores dominate the biomass surface structure and cannot be overlooked in modeling of gasification reactions.
The resolutions of the unedited images ‘a-d’ are 1.28 µm, 0.33 µm, 83.2 nm and 41.6 nm and 6.93 nm respectively.

Page 51 of 72
AFOSR Grant # FA9550-08-1-0456 Final Performance Report Purdue University
a) b) c)
d) e)
Figure 2.42: Images of post-experiment biomass remains.
The EDS (energy-dispersive-spectroscopy) technique was used to compare the gravimetric elemental compositions
of the original pinewood sawdust and the post-gasification residue. The EDS system is coupled to the XL40 FESEM
that was used for the SEM analysis. The specimen are deposited onto a resin and then mounted onto a stub using
carbon tape. The stub is then placed into the SEM analysis chamber. The sample preparation method is important to
note for the EDS analysis since contaminant specie from the carbon tape and the mounting resin may appear in the
analysis and produce uncertainties. Changes in the analysis parameters also introduce uncertainty in a comparison
between two spectra. Similar analysis parameters were maintained for acquiring the EDS spectra for the pinewood
sawdust and the post-gasified residue, when permissible. ZAF correction was applied to the data to correct for
atomic number, absorption and secondary fluorescence effects. Hydrogen is not detected via the EDS technique.
Figure 2.43 shows the average energy dispersive spectra from Tests 1 and 2 for the original pinewood sawdust and
the post-gasified char. Table 2.8 presents the gravimetric elemental composition for the pinewood sawdust and the
average elemental composition from Tests 1 and 2 from the post-gasified char for comparison. Elemental
composition for pinewood sawdust presented by Bridgewater and Boocock[2.31]
is included for reference.
Bridgewater and Boocock[2.31]
also state 6.0% hydrogen content for pinewood sawdust. Some specie could not be
resolved in both spectra and are denoted by ‘-’.
There is reasonable agreement between the EDS analysis of the pinewood sawdust and the literature analysis
considering uncertainties regarding the origin of the biomass and specimen handling. The comparison of the carbon
and oxygen content between the original and post-gasified samples reveals proof of gasification, identified by the
decrease in the volatile composition and a large increase in the carbon composition. The large carbon content in the
post-gasification sample supports the gas composition analysis that longer reaction duration is needed to attain 100%
carbon conversion.
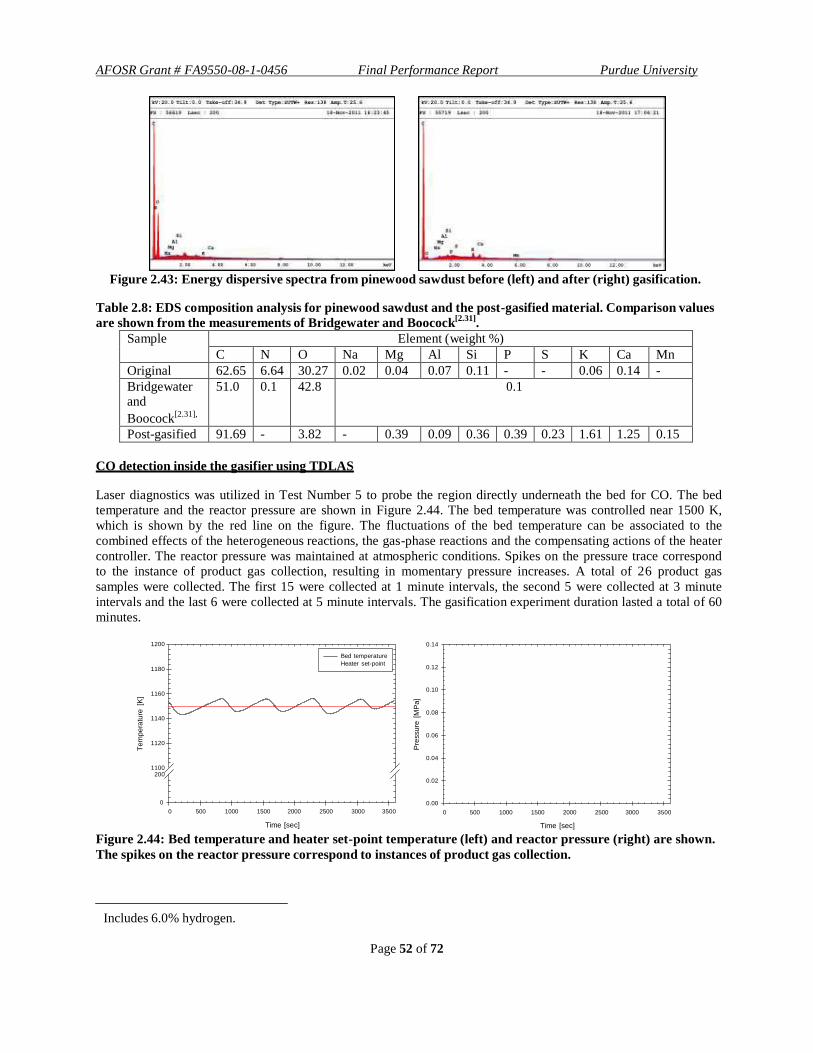
Page 52 of 72
AFOSR Grant # FA9550-08-1-0456 Final Performance Report Purdue University
Te
mp
era
ture
[K
]
Pre
ssu
re [
MP
a]
Figure 2.43: Energy dispersive spectra from pinewood sawdust before (left) and after (right) gasification.
Table 2.8: EDS composition analysis for pinewood sawdust and the post-gasified material. Comparison values
are shown from the measurements of Bridgewater and Boocock[2.31]
.
Sample Element (weight %)
C N O Na Mg Al Si P S K Ca Mn
Original 62.65 6.64 30.27 0.02 0.04 0.07 0.11 - - 0.06 0.14 -
Bridgewater and
Boocock[2.31],
51.0 0.1 42.8 0.1
Post-gasified 91.69 - 3.82 - 0.39 0.09 0.36 0.39 0.23 1.61 1.25 0.15
CO detection inside the gasifier using TDLAS
Laser diagnostics was utilized in Test Number 5 to probe the region directly underneath the bed for CO. The bed
temperature and the reactor pressure are shown in Figure 2.44. The bed temperature was controlled near 1500 K,
which is shown by the red line on the figure. The fluctuations of the bed temperature can be associated to the
combined effects of the heterogeneous reactions, the gas-phase reactions and the compensating actions of the heater
controller. The reactor pressure was maintained at atmospheric conditions. Spikes on the pressure trace correspond
to the instance of product gas collection, resulting in momentary pressure increases. A total of 26 product gas
samples were collected. The first 15 were collected at 1 minute intervals, the second 5 were collected at 3 minute
intervals and the last 6 were collected at 5 minute intervals. The gasification experiment duration lasted a total of 60
minutes.
1200
1180
Bed temperature
Heater set-point
0.14
0.12
1160 0.10
1140
0.08
1120
0.06
1100
200
0.04
0.02
0
0 500 1000 1500 2000 2500 3000 3500
Time [sec]
0.00 0 500 1000 1500 2000 2500 3000 3500
Time [sec]
Figure 2.44: Bed temperature and heater set-point temperature (left) and reactor pressure (right) are shown.
The spikes on the reactor pressure correspond to instances of product gas collection.
Includes 6.0% hydrogen.

Page 53 of 72
AFOSR Grant # FA9550-08-1-0456 Final Performance Report Purdue University
CO was detected by probing the R(4) inside the gasifier during a gasification experiment. Reference signal was collected during the heating period in presence of N2 and after the steady gasification temperature was reached. The
reference signal is shown in Figure 2.45 (a). The gasifier was probed using TDLAS for CO produced during gasification. The CO scan signal is shown in Figure 2.45 (b).
(a) (b)
Figure 2.45: Output signal (a) reference signal (b) signal after the CO2 flow was started.
The transmission of laser radiation during gasification was calculated the CO signal with the reference. The
experimental transmission was compared with simulation to calculate the mole fraction of CO inside the gasifier.
The data fit for one of the scans is shown in Figure 2.46.
Figure 2.46: Simulation using HITRAN fitted to the measured transmission signal.
A data fitting code based on the differential evolution algorithm was developed to fit the simulated transmission to
the measured transmission. Mole fraction was varied as a parameter to obtain best fit with the experimental data. For
the case shown, the best fit revealed CO mole fraction of 0.02670. Multiple scans were taken to study the evolution
of CO with time. Similar fitting was done for other scans. The evolution of CO as a function of time is shown in
Figure 2.47.

Page 54 of 72
AFOSR Grant # FA9550-08-1-0456 Final Performance Report Purdue University
Figure 2.47: Evolution of CO inside the gasifier as a function of time (T = 1150 K and P = 101325 Pa).
During the initial transience the concentrations predicted by TDLAS show a fair agreement with the GC
measurements. However, TDLAS predicts higher concentration of CO in the later part. Absence of window purge
(to reduce the noise) during the test might have caused the CO to stagnate near the windows resulting in increased
prediction by TDLAS. 2.4 Mathematical Modeling of Coal Gasification
Gasification processes occur at multiple length scales that are characterized by endothermic solid-gas reactions that
occur at the solid particle scale (~500 µm) coupled with gas phase reactions that span the reactor scale (~ 10 m).
Heat and mass exchange between the two phases plays an important role in determining the overall gasification rate.
The processes at the particle scale are governed by diffusion of heat and mass to and from the particle along with the
solid-gas chemical reactions. The processes at the particle scale interact with the processes at the reactor scale
making it a multi-phase multi-scale problem. Mathematical modeling of coal gasification at particle scale has been
largely based on quasi-steady approach with co-relations and semi analytical solutions. The analytical solutions may
not be valid in different scenarios such as presence of multiple gaseous species, large difference between diffusional
and kinetic rates. Unsteady spatially resolved solutions to the reaction diffusion equation around a particle could
provide insights related to the gasification processes at the smallest scale. Detailed gas phase chemistry solution in
the region surrounding the particle could be helpful in identifying the critical gas phase reactions affecting the
gasification process.
During the course of the project mathematical models were developed that addressed the unsteady behavior of gasification and the importance of gas phase chemistry. The models were to assess the possibility of excess H2
addition to the gasification process. The models and their results are summarized in the following section. 2.4.1 Spatially resolved model for coal gasification at particle scale
Spatially resolved model for the gasification of a char particle in a multi-component gaseous environment was
developed. Finite Volume Method (FVM) approach has been used to solve the unsteady reaction diffusion equations
at the particle scale. The results of the model were compared with the experimental results. The effect of reaction
conditions such as temperature, pressure and particle diameter on the gasification rate was characterized. Dominance
of diffusive processes and chemical kinetics in determining the overall gasification rate is identified with variation in
temperature. Particle heating in presence of radiative heat transfer from surroundings has been compared with the
diffusive heat transfer through the boundary layer. Addition of excess H2 to the gaseous environment and its effect
on the CO2 production are analyzed.
A coal/char particle composed of pure carbon is considered to gasify in the presence of a gaseous mixture of H 2O,
CO, H2, CO2, CH4 and N2. The model accommodates for three generic shapes of the char particle, i.e. a slab, a
cylinder and a sphere using the same mathematical framework. In the present study spherical geometry is considered. The computational domain for a spherical particle is shown in Figure 2.48.

Page 55 of 72
AFOSR Grant # FA9550-08-1-0456 Final Performance Report Purdue University
2( g )
4
0
0
Figure 2.48: Computational domain for particle scale model.
One dimensional reaction diffusion equation is solved inside and around the gasifying particle. Diffusion of heat and
mass is considered through the boundary layer and also inside the particle. Thermal conductivity of the gaseous
mixture is assumed to vary with temperature however, the conductivity of the solid is assumed to be constant with
temperature. The diffusivity of H2 is assumed to be large as compared to the remaining gases following Srinivas and
Amundson[2.32]
. The mixture diffusivity of gas is calculated using the Chapman-Enskog equations. The particle is
assumed to be porous. The diffusivity of gases inside the particle is calculated using the porosity and the diffusivity
of gases in the free space. The change in the radius of the particle is tracked with respect to time. Shrinking sphere
model has been employed for capturing the change in the radius of the particle. The evolution of surface area inside
the particle is calculated from a correlation by Dutta et al.[2.33]
. Three solid-gas reactions have been considered i.e.
steam gasification (Eq.(1)), CO2 gasification (Eq.(2)) and methanation reaction (Eq.(3)). The surface kinetics for the
three reactions is obtained from Hedden et al.[2.34]
, Dutta et al.[2.33]
and Blackwood et al.[2.35]
respectively.
C( s )
H 2O
( g ) CO
( g ) H H
0 131 kJ/gmol (1)
C( s )
CO2( g )
2CO( g )
H0
172.67 kJ/gmol (2)
C(s) 2H2 ( g) CH ( g) H0
74.94 kJ/gmol (3)
Water gas shift reaction (Eq.(4)) is assumed to be the dominant gas phase reaction with finite rate chemistry and
assumed to occur in the entire domain. The kinetics pertaining to coal gasification conditions for the water gas shift
are obtained from Wen et al.[2.36]
.
CO( g ) H 2O( g ) CO2( g ) H 2( g ) H
CO( g ) H 2O( g ) CO2( g ) H 2( g ) H
41.21 kJ/gmol
41.21 kJ/gmol
(4)
The reaction diffusion equation for a generic quantity for the above mentioned geometries can be written as,
t (
g )
1 r
n S
r n
r r
(5)
where the exponent n takes the values of 0, 1 and 2 for a slab, a cylinder and a sphere respectively. Species
conservation and energy conservation is expressed in terms of Eq. (5) with taking the values of gaseous species’
mass fraction Yi and temperature T . The source terms S account for the generation and consumption of gaseous
species due to chemical reactions for species conservation and generation and absorption of heat for energy
conservation. The mass of the system is conserved as given in Eq. (6)

Page 56 of 72
AFOSR Grant # FA9550-08-1-0456 Final Performance Report Purdue University
t ( g ) S
(6)
Dirichlet boundary conditions have been used for the gaseous species and temperature at the edge of the boundary
layer. The values of temperature and mass fraction of gaseous species are specified at the boundary layer edge and
assumed to remain constant with time. Symmetry boundary conditions with zero flux are employed at the center.
Radiation exchange between the surface of coal particle and the surroundings are considered with negligible
absorption in the gaseous boundary layer. The temperature of the surroundings is specified and assumed to remain
constant with time. Radiation is implemented as a surface boundary condition for the outer surface of the coal
particle. Equations (5) and (6) are solved using the iterative finite volume approach. The conversion of the particle is
tracked until 99% of the initial mass is converted into gases.
Following the treatment by Srinivas and Amundson[2.32]
, the volumetric reaction rate for each of the gas-solid
reaction is found out using Eq. (7),
rj rsj Sa
0 (1
X )Wb kg
m3
s
j 1, 2 and 3
(7)
In this equation, rsj is the surface reaction rate per unit specific surface area, S is the specific surface area, a is the
structural parameter, 0 is the density of coal, X is the local conversion and Wb is the initial carbon content in the
coal. a is calculated following the treatment by Dutta et al.[2.33]
. The shrinking sphere model results in a moving
boundary problem which is handled using a non-dimensionalization similar to Gupta et al.[2.37]
. In this
transformation as shown in Figure 2.48 is the new stationary variable, r0 is the initial radius for each domain (for
the particle r0 0 and for the boundary layer r0 r
s ), is the thickness for each domain and Sh is the Sherwood
number based on the velocity of the surrounding gases. Sherwood number can be calculated using the Ranz
Marshall correlation and its value is assumed to be 2 indicating a stagnant boundary layer around the particle.
After integration over a finite size control volume[2.38], Eq. (5) can be simplified to,
ap g P P aN g N N as g S S b (8)
In Eq. (10)
P is the quantity of interest and
N and S account for the effect of neighbors. The source terms are
included in the term b . Source terms resulting from the non-linear kinetics of the chemical reactions have been
linearized using Taylor series approximation[2.38]
.
The temperature and species equations are solved iteratively for each time step until a specified convergence criterion is met. Tri-diagonal Matrix Algorithm (TDMA) is used to solve the resulting system of equations. The
solution is assumed to converge when the normalized errors for each variable are < 10-4
. The conversion of the particle is tracked until 99% of the particle is gasified. Due to the implicit time marching the size of time steps do not have any influence on the solution, however, a large time step could make the source terms large resulting in an unstable solution.
Comparison of carbon conversion histories obtained from numerical computations with experimental results by
Everson et al[2.39]
is shown in Figure 2.49. The gasification experiments were conducted on South African coal with mean particle diameter of 70 µm in presence of gaseous environment containing 20% steam and 80% nitrogen. The
average surface area measured was 12.1 m2/g. The computed carbon conversion histories show a good agreement
with the experimental results. The model predicts higher conversion rates (15 %) in the initial stages however the decay in the conversion rate predicted by the model is higher compared to the experimental values (10%) by
Everson et al.[2.39]
. After gaining confidence from the comparison of the model results with experiments, the model
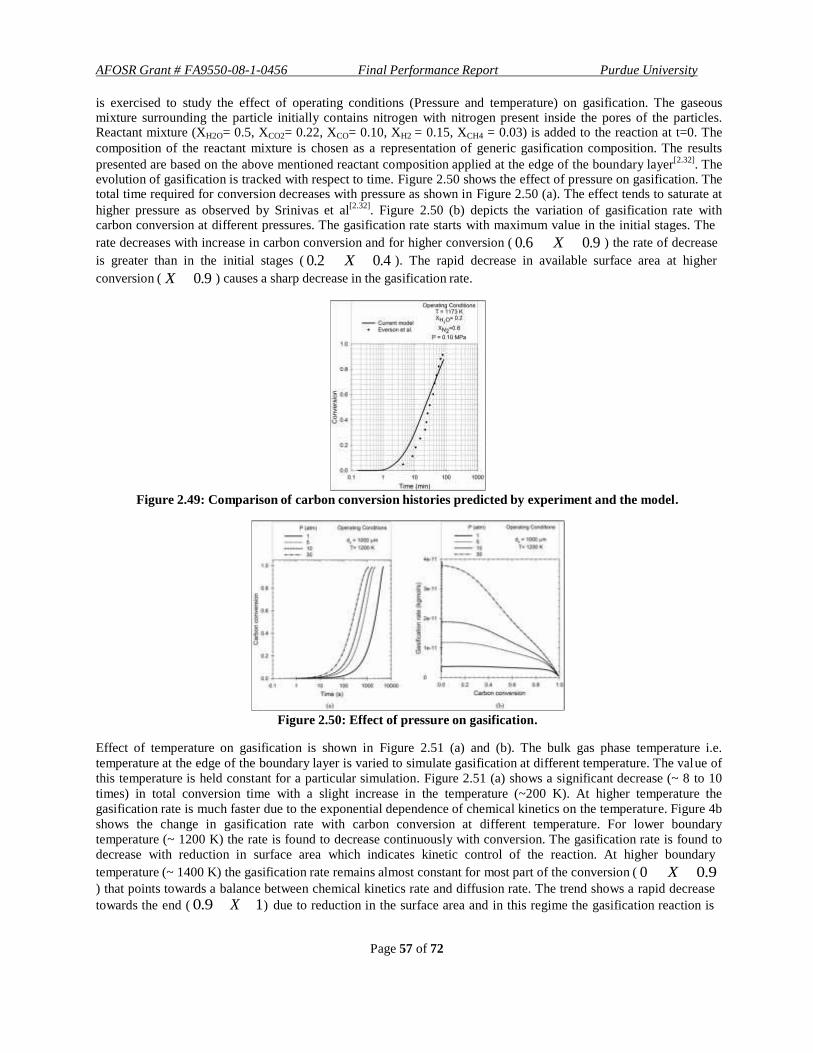
Page 57 of 72
AFOSR Grant # FA9550-08-1-0456 Final Performance Report Purdue University
is exercised to study the effect of operating conditions (Pressure and temperature) on gasification. The gaseous mixture surrounding the particle initially contains nitrogen with nitrogen present inside the pores of the particles. Reactant mixture (XH2O= 0.5, XCO2= 0.22, XCO= 0.10, XH2 = 0.15, XCH4 = 0.03) is added to the reaction at t=0. The
composition of the reactant mixture is chosen as a representation of generic gasification composition. The results
presented are based on the above mentioned reactant composition applied at the edge of the boundary layer[2.32]
. The evolution of gasification is tracked with respect to time. Figure 2.50 shows the effect of pressure on gasification. The total time required for conversion decreases with pressure as shown in Figure 2.50 (a). The effect tends to saturate at
higher pressure as observed by Srinivas et al[2.32]
. Figure 2.50 (b) depicts the variation of gasification rate with carbon conversion at different pressures. The gasification rate starts with maximum value in the initial stages. The
rate decreases with increase in carbon conversion and for higher conversion ( 0.6 X 0.9 ) the rate of decrease
is greater than in the initial stages ( 0.2 X 0.4 ). The rapid decrease in available surface area at higher
conversion ( X 0.9 ) causes a sharp decrease in the gasification rate.
Figure 2.49: Comparison of carbon conversion histories predicted by experiment and the model.
Figure 2.50: Effect of pressure on gasification.
Effect of temperature on gasification is shown in Figure 2.51 (a) and (b). The bulk gas phase temperature i.e.
temperature at the edge of the boundary layer is varied to simulate gasification at different temperature. The val ue of
this temperature is held constant for a particular simulation. Figure 2.51 (a) shows a significant decrease (~ 8 to 10
times) in total conversion time with a slight increase in the temperature (~200 K). At higher temperature the
gasification rate is much faster due to the exponential dependence of chemical kinetics on the temperature. Figure 4b
shows the change in gasification rate with carbon conversion at different temperature. For lower boundary
temperature (~ 1200 K) the rate is found to decrease continuously with conversion. The gasification rate is found to
decrease with reduction in surface area which indicates kinetic control of the reaction. At higher boundary
temperature (~ 1400 K) the gasification rate remains almost constant for most part of the conversion ( 0 X 0.9 ) that points towards a balance between chemical kinetics rate and diffusion rate. The trend shows a rapid decrease
towards the end ( 0.9 X 1) due to reduction in the surface area and in this regime the gasification reaction is
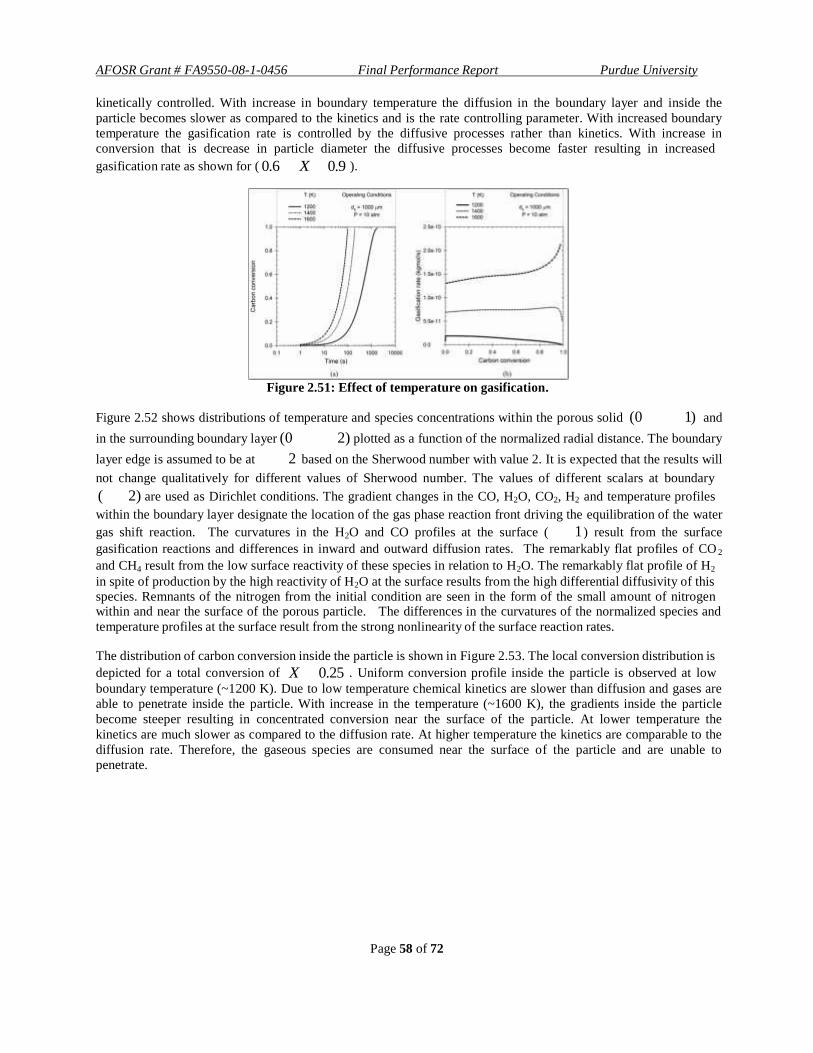
Page 58 of 72
AFOSR Grant # FA9550-08-1-0456 Final Performance Report Purdue University
kinetically controlled. With increase in boundary temperature the diffusion in the boundary layer and inside the
particle becomes slower as compared to the kinetics and is the rate controlling parameter. With increased boundary
temperature the gasification rate is controlled by the diffusive processes rather than kinetics. With increase in
conversion that is decrease in particle diameter the diffusive processes become faster resulting in increased
gasification rate as shown for ( 0.6 X 0.9 ).
Figure 2.51: Effect of temperature on gasification.
Figure 2.52 shows distributions of temperature and species concentrations within the porous solid (0 1) and
in the surrounding boundary layer (0 2) plotted as a function of the normalized radial distance. The boundary
layer edge is assumed to be at 2 based on the Sherwood number with value 2. It is expected that the results will
not change qualitatively for different values of Sherwood number. The values of different scalars at boundary
( 2) are used as Dirichlet conditions. The gradient changes in the CO, H2O, CO2, H2 and temperature profiles
within the boundary layer designate the location of the gas phase reaction front driving the equilibration of the water
gas shift reaction. The curvatures in the H2O and CO profiles at the surface ( 1 ) result from the surface
gasification reactions and differences in inward and outward diffusion rates. The remarkably flat profiles of CO 2
and CH4 result from the low surface reactivity of these species in relation to H2O. The remarkably flat profile of H2
in spite of production by the high reactivity of H2O at the surface results from the high differential diffusivity of this species. Remnants of the nitrogen from the initial condition are seen in the form of the small amount of nitrogen within and near the surface of the porous particle. The differences in the curvatures of the normalized species and
temperature profiles at the surface result from the strong nonlinearity of the surface reaction rates.
The distribution of carbon conversion inside the particle is shown in Figure 2.53. The local conversion distribution is
depicted for a total conversion of X 0.25 . Uniform conversion profile inside the particle is observed at low
boundary temperature (~1200 K). Due to low temperature chemical kinetics are slower than diffusion and gases are
able to penetrate inside the particle. With increase in the temperature (~1600 K), the gradients inside the particle
become steeper resulting in concentrated conversion near the surface of the particle. At lower temperature the
kinetics are much slower as compared to the diffusion rate. At higher temperature the kinetics are comparable to the
diffusion rate. Therefore, the gaseous species are consumed near the surface of the particle and are unable to
penetrate.

Page 59 of 72
AFOSR Grant # FA9550-08-1-0456 Final Performance Report Purdue University
Figure 2.52: Scalar gradients inside and around the particle.
Figure 2.53: Effect of temperature on distribution of local carbon conversion.
Figure 2.54: Effect of excess H2 (XH2 = 0.2, 0.6) on: (a) CO2 release and (b) Carbon conversion with time.
The effects of external H2 addition on the CO2 production and the carbon conversion rates are shown in Figure 2.54
for a representative gasification temperature of 1400 K. The cumulative CO2 produced per unit of C gasified
decreases as the H2 mole fraction in the gasifier is increased. Figure 7 (a) shows the mass of CO2 produced per unit
mass coal gasified as a function of time. As seen in figure, for 99% conversion with 0.2 H2 mole fraction in steam,
0.8 units of CO2 mass is produced from gasification of 1 unit mass of C. This is reduced by approximately 55% by
increasing the mole fraction of H2 in the gasifier from 0.2 to 0.6. Figure 7 (b) shows that the carbon conversion rate decreases and the total time for conversion increases by as much as a factor of 2 with the increased use of free
stream H2 from 0.2 to 0.6 mole fraction. Routine process engineering methods involving staging of the excess
hydrogen can be used to overcome this challenge in addition to the previously recognized challenge of cost of hydrogen production using renewable energy sources.

Page 60 of 72
AFOSR Grant # FA9550-08-1-0456 Final Performance Report Purdue University
The predictions from the particle scale model are found to be in good agreement with the experimental results of
Everson et al.[2.39]
. From the parametric study it is found that gasification rate increases with increase in pressure and temperature. The gasification reaction is dominated by chemical kinetics at lower temperature and by diffusion of gaseous species at the higher temperatures. The species profiles near the particle surface and in the boundary layer emphasize the importance of steam as a gasifying medium and as an important species promoting the water gas shift reaction. The chemical reaction rates are balanced by the diffusion rates of reactant and product species. Uniform conversion profiles are observed inside the particle at lower temperature however concentrated higher conversions
are observed near the particle surface with increased temperature. CO2 emissions are found to decrease with excess
H2 addition but at the cost of decreased gasification rate.
2.4.2 Model for coal gasification processes in a well-stirred reactor with detailed gas-phase chemistry
The model has been described in great detail in Qiao et al[2.40]
. Important findings from the paper are highlighted in
the following section.
To theoretically understand the complex chemical processes in a gasifier and to identify the most influential
parameters for syngas production, we developed a multiphysics model to simulate the gasification processes in a
well-stirred reactor. This model is the first of its kind and considers detailed gas-phase chemistry, particle-phase
reactions, radiative heat transfer, as well as full coupling between the two phases at various scales for mass, species,
and energy exchange. The gas-phase reactions use the detailed chemistry GRI-Mech 1.2, including 177 elementary
reactions and 31 species, as well as variable thermodynamic and transport properties. Four surface reactions were
considered and the reaction rates were simulated by the diffusion-kinetics model with consideration of boundary
layer diffusion. A random pore model was used to account for the evolution of the char porous structure and its
impact on gasification rates. A numerical code was developed to solve the gas-phase and the particle-phase
governing equations. Numerical simulations were conducted to understand the gasification process and the effects of
particle size, porous structure, radiative heat transfer, pressure, O2 concentration, and H2 addition on gasification
performance.
Carbon particles with diameter are uniformly distributed inside the reactor together with gaseous species as shown
in Figure 2.55. The reactor’s pressure remains constant, which means that during the gasification process the volume
increases as a result of thermal expansion; thus the number density of coal particles decreases, but the total number
is conserved. It is assumed that intense mixing occurs inside the reactor so that all gas-phase properties in the gas-
phase bulk of the reactor, with the exception of the small boundary layers surrounding the particles, are uniform or
spatially independent. As a result of this assumption, the temperature and number density of the particles can be
assumed to be uniform at the bulk scale of the reactor. Mass, species, and energy exchanges between individual
particles and surrounding gases cause local non-equilibrium in the boundary layers surrounding each of the particles.
These interactions are modeled on the particle scale. Moreover, the model developed for a single particle represents
all particles inside the reactor. For the gas-phase reactions, detailed kinetics and variable thermodynamic properties
are considered. The governing equations of mass, species, and energy conservation for the gas phase and the particle
phase are coupled to account for mass, species, and energy exchanges between the two phases. The transient
gasification process is computed until 99% of the coal particle is gasified. Equal binary diffusion coefficients are
considered applicable for multi-species diffusion and the bulk gas properties are modeled using ideal gas law.
Carbon particles
dP – diameter NP – number density
Gases
Constant
pressure valve
Figure 2.55: Coal gasification in a well-stirred reactor.
The present work adapted the Random Pore Model by imposing a factor into the gasification rate to capture the
evolution of char pore formation during the gasification process. The governing equations are described in detail in

Page 61 of 72
AFOSR Grant # FA9550-08-1-0456 Final Performance Report Purdue University
reference. Four heterogeneous reactions are assumed to take place on the particle surfaces. The surface reaction constants were expressed as Arrhenius rate laws. The gas-phase and particle-phase governing equations, which form
a closed ODE system, were solved using FORTRAN package DASPK3.1[2.41]
. DASPK was designed to solve large- scale Differential-Algebraic Equation (DAE) systems. After the initial condition for every variable and the convergence criteria were specified, DASPK integrated the equations over time. The time step size and the order of temporal discretization were dynamically determined by the solver itself.
It was found that for steam gasification at lower temperature (~ 1200 K) in absence of oxygen, convective and radiative heat transfer plays a significant role in increasing the temperature of the particle. However, in the later stages the difference between the particle and gas temperature is negligible owing to the low rates of endothermic gasification reactions. The energy release from OH + H2 = H + H2O reaction was found to be few magnitudes larger
than that from the other 177 elementary gas phase reactions that were studied, indicating that it is the most influential elementary reaction in the gas phase. The water-gas-shift reaction (CO + H2O = CO2 + H2) is often
assumed to be at equilibrium in most modeling studies. To evaluate this assumption, we calculated the ratio = XCO2XH2/(XCOXH2O) by using the simulation results (in equilibrium this ratio is equal to the equilibrium constant
Kp), where the concentrations of H2O, CO, H2, and CO2 are obtained from the present detailed-chemistry
calculations. The comparison in Figure 2.56 clearly shows that the ratio of concentrations is not equal to the Kp value over the entire time, indicating that the water-gas-shift reaction is not in equilibrium. The reason for the nonequilibrium might be the extreme temperature sensitivity of the elemental reactions at the relatively low
temperatures (below 1200 K), as suggested by Gregg et al[2.42]
.
Figure 2.56: Computed ratio of concentrations of product and reactant gases and theoretical equilibrium
constant of water-gas-shift reaction as a function of time for the basic case without O2. Computed ratios of
concentrations are based on detailed chemistry calculations; theoretical Kp are calculated using the
polynomial expression in Ref. [24]. Initial conditions are listed in Table 2.9.
Table 2.9: Initial conditions for a typical steam gasification process.
Initial gas temperature Tg = 1200 K Initial particle temperature Tp = 1200 K
Wall temperature Tw = 1100 K Density of particles ρp = 1.3 g/cm3
Gas pressure P = 10 atm Initial particle diameter dp = 100 µm
Initial water concentration XH2O = 1.0 Particle number density Np = 896 cm-3
Initial H2O/C molar ratio H2O/C = 2.0
In case of gasification in presence of oxygen, it was found that the provided oxygen is consumed for the combustion
of part of the carbon in the initial period. The heat energy that is released provides for the endothermic gasification
reactions that ensue. The particle and gas temperatures increase rapidly to a maximum. During the initial period,
particle temperature is found to be higher than the gas temperature, but is found to reduce during the rest of the
gasification process. The peak temperatures occur at the instant of complete oxygen depletion. In the initial period,
oxidation reactions of both the bulk gas phase and the particle surface and gas phase occur. Gas -phase oxidation
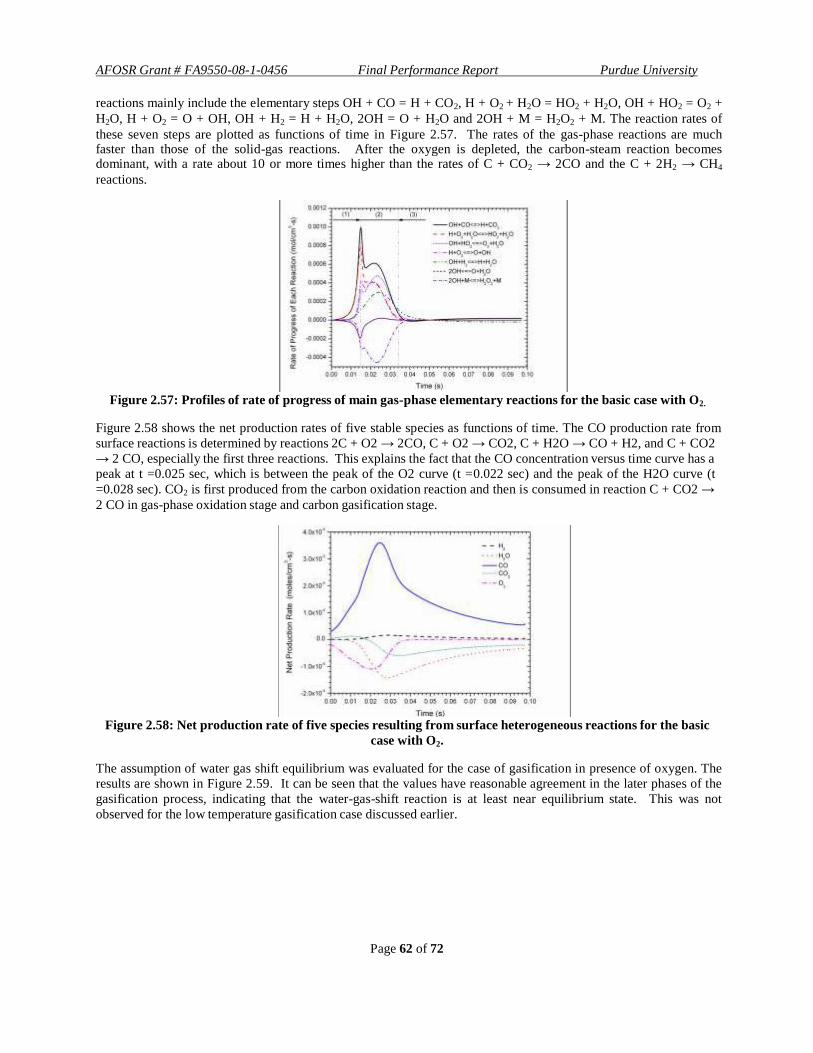
Page 62 of 72
AFOSR Grant # FA9550-08-1-0456 Final Performance Report Purdue University
reactions mainly include the elementary steps OH + CO = H + CO2, H + O2 + H2O = HO2 + H2O, OH + HO2 = O2 +
H2O, H + O2 = O + OH, OH + H2 = H + H2O, 2OH = O + H2O and 2OH + M = H2O2 + M. The reaction rates of
these seven steps are plotted as functions of time in Figure 2.57. The rates of the gas-phase reactions are much faster than those of the solid-gas reactions. After the oxygen is depleted, the carbon-steam reaction becomes dominant, with a rate about 10 or more times higher than the rates of C + CO2 → 2CO and the C + 2H2 → CH4
reactions.
Figure 2.57: Profiles of rate of progress of main gas-phase elementary reactions for the basic case with O2.
Figure 2.58 shows the net production rates of five stable species as functions of time. The CO production rate from
surface reactions is determined by reactions 2C + O2 → 2CO, C + O2 → CO2, C + H2O → CO + H2, and C + CO2
→ 2 CO, especially the first three reactions. This explains the fact that the CO concentration versus time curve has a
peak at t =0.025 sec, which is between the peak of the O2 curve (t =0.022 sec) and the peak of the H2O curve (t
=0.028 sec). CO2 is first produced from the carbon oxidation reaction and then is consumed in reaction C + CO2 →
2 CO in gas-phase oxidation stage and carbon gasification stage.
Figure 2.58: Net production rate of five species resulting from surface heterogeneous reactions for the basic
case with O2.
The assumption of water gas shift equilibrium was evaluated for the case of gasification in presence of oxygen. The
results are shown in Figure 2.59. It can be seen that the values have reasonable agreement in the later phases of the
gasification process, indicating that the water-gas-shift reaction is at least near equilibrium state. This was not
observed for the low temperature gasification case discussed earlier.
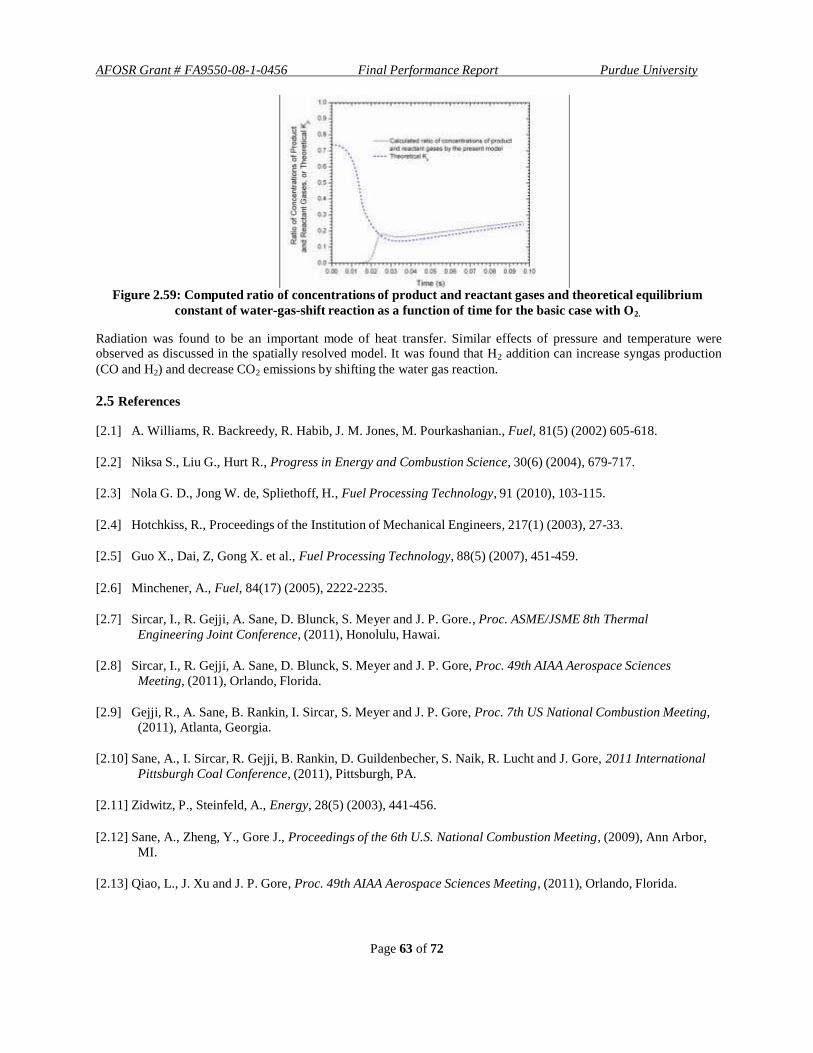
Page 63 of 72
AFOSR Grant # FA9550-08-1-0456 Final Performance Report Purdue University
Figure 2.59: Computed ratio of concentrations of product and reactant gases and theoretical equilibrium
constant of water-gas-shift reaction as a function of time for the basic case with O2.
Radiation was found to be an important mode of heat transfer. Similar effects of pressure and temperature were observed as discussed in the spatially resolved model. It was found that H2 addition can increase syngas production
(CO and H2) and decrease CO2 emissions by shifting the water gas reaction.
2.5 References
[2.1] A. Williams, R. Backreedy, R. Habib, J. M. Jones, M. Pourkashanian., Fuel, 81(5) (2002) 605-618.
[2.2] Niksa S., Liu G., Hurt R., Progress in Energy and Combustion Science, 30(6) (2004), 679-717.
[2.3] Nola G. D., Jong W. de, Spliethoff, H., Fuel Processing Technology, 91 (2010), 103-115.
[2.4] Hotchkiss, R., Proceedings of the Institution of Mechanical Engineers, 217(1) (2003), 27-33.
[2.5] Guo X., Dai, Z, Gong X. et al., Fuel Processing Technology, 88(5) (2007), 451-459.
[2.6] Minchener, A., Fuel, 84(17) (2005), 2222-2235.
[2.7] Sircar, I., R. Gejji, A. Sane, D. Blunck, S. Meyer and J. P. Gore., Proc. ASME/JSME 8th Thermal
Engineering Joint Conference, (2011), Honolulu, Hawai.
[2.8] Sircar, I., R. Gejji, A. Sane, D. Blunck, S. Meyer and J. P. Gore, Proc. 49th AIAA Aerospace Sciences
Meeting, (2011), Orlando, Florida.
[2.9] Gejji, R., A. Sane, B. Rankin, I. Sircar, S. Meyer and J. P. Gore, Proc. 7th US National Combustion Meeting,
(2011), Atlanta, Georgia.
[2.10] Sane, A., I. Sircar, R. Gejji, B. Rankin, D. Guildenbecher, S. Naik, R. Lucht and J. Gore, 2011 International
Pittsburgh Coal Conference, (2011), Pittsburgh, PA.
[2.11] Zidwitz, P., Steinfeld, A., Energy, 28(5) (2003), 441-456.
[2.12] Sane, A., Zheng, Y., Gore J., Proceedings of the 6th U.S. National Combustion Meeting, (2009), Ann Arbor,
MI.
[2.13] Qiao, L., J. Xu and J. P. Gore, Proc. 49th AIAA Aerospace Sciences Meeting, (2011), Orlando, Florida.

Page 64 of 72
AFOSR Grant # FA9550-08-1-0456 Final Performance Report Purdue University
[2.14] S. M. Abrarov, B. M. Quine, R. K. Jagpal, Journal of Quantitative Spectroscopy and Radiative Transfer, 111
(3) (2010), 372-375.
[2.15] S. M. Abrarov, B. M. Quine, R. K. Jagpal, Computer Physics Communications, 181(5) (2010), 876-882.
[2.16] R. K. Hanson, Proceedings of the Combustion Institute, 33 (1) (2011), 1-40.
[2.17] H. Teichert, T. Fernholz, V. Ebert, Applied Optics, 42 (12) (2003), 2043-2051.
[2.18] M. Lackner, G. Totschnig, G. Loeffler, H. Hofbauer, F. Winter, Thermal Science, 6 (2) (2002) ,13-27.
[2.19] M. Lackner, Fuel, 83 (10) (2004), 1289-1298.
[2.20] V. Nagali, J. T. Herbon, D. C. Horning, D. F. Davidson, R. K. Hanson, Appl. Opt., 38(33) (1999), 6942-6950.
[2.21] H. Li, G. B. Rieker, X. Liu, J. B. Jeffries, R. K. Hanson, Appl. Opt., 45(5) (2006), 1052-1061.
[2.22] B. L. Upschulte, D. M. Sonnenfroh, M. G. Allen, Appl. Opt., 38(9) (1999), 1506-1512.
[2.23] J. Wang; M. Maiorov, D. S. Baer, D. Z. Garbuzov, J. C. Connolly, R. K. Hanson, Appl. Opt., 39(30) (2000),
5579-5589.
[2.24] G. Repas, (1994), NASA TM 106493.
[2.25] E. Dambach, D. Helderman., A. Boopalan, T. Kite, Purdue University Internal Report, (2006), West
Lafayette, IN.
[2.26] A. Boopalan, D. Helderman, Purdue University Internal Report, (2006), West Lafayette, IN.
[2.27] Farias L., Irons G., Metallurgical and Materials Transactions B, 17(1) (1986), 229-231.
[2.28] Ragland, K. W., Aerts, D. J., Bioresource Technology, 37 (1991), 161-168.
[2.29] Dutta, S., Wen, C. Y., Ind. Eng. Chem Process Des. Dev., 16(1) (1977), 31-37.
[2.30] Gupta, R., Energy & Fuels, 21 (2007), 451-460.
[2.31] Bridgewater, A.V. Boocock, D.G.B. (eds). Developments in Thermochemical biomass Conversion. London: Chapman & Hall, 2 (1997), 830.
[2.32] B. Srinivas, N. R. Amundson, AIChE Journal, 26(3) (1980), 487-496.
[2.33] S. Dutta, C. Y. Wen, R. J. Belt, Industrial & Engineering Chemistry Process Design and Development, 16(1)
(1977), 20-30.
[2.34] K. Heden, A. Löwe, Carbon, 5(4) (1967), 339-353.
[2.35] J. Blackwood, Australian Journal of Chemistry, 12(1) (1959), 14-28.
[2.36] C. Y. Wen, T. Z. Chaung, Industrial & Engineering Chemistry Process Design and Development, 18(4)
(1979), 684-695.
[2.37] P. Gupta, A. K. Sadhukhan, R. K. Saha, International Journal of Chemical Kinetics, 39(6) (2007), 307-319.

Page 65 of 72
AFOSR Grant # FA9550-08-1-0456 Final Performance Report Purdue University
[2.38] S. Patankar, Numerical fluid flow and heat transfer, Hemisphere Publications, 1980.
[2.39] R. C. Everson, H. W. J. P. Neomagus, H. Kasaini, D. Njapha, Fuel, 85(7-8) (2006), 1076-1082.
[2.40] Qiao, L, Xu, J., Sane, A., Gore, J., Combustion and Flame, 159(4) (2012), 1693-1707.
[2.41] Petzold, L. R., A description of DASSL: A differential/algebraic system solver in scientific computing, (1983),
North-Holland, Amsterdam: Stepleman, R. S. et al. (Eds.), 65-68.
[2.42] Gregg, D. W., W. R. Aiman, H. H. Otsuki, C. B. Thorsness, Solar Energy,24(3) (1980), 313-321.
3.0 Conclusions
Biomass Fast-Hydropyrolysis
(1) Heating rate is a very critical parameter that determines the char yield from cellulose. Increasing pyrolysis
heating rate decreased the char yield. Heating rates on the order of 1,000 °C s-1
were sufficient to eliminate the formation of char from cellulose, regardless of the gas atmosphere.
(2) For the micro-scale batch reactor, two different designs of a downstream catalytic reactor were tested and
evaluated. The design based on a fixed-bed reactor was more robust and gave us more flexibility in
conducting HDO/WGS studies than a capillary reactor design.
(3) The high-pressure continuous FHP was designed, built and successfully tested in a high-pressure hydrogen
atmosphere and in the presence of candidate HDO/WGS catalysts in the downstream fixed-bed catalytic
reactor.
(4) In the absence of catalyst during pyrolysis of cellulose, hydrogen does not affect the liquid product
composition on a qualitative basis.
(5) The presence of a H2/CO/CO2 mixture in the pyrolysis region did not qualitatively affect the primary
products of cellulose hydropyrolysis.
(6) Pt metal in the hydropyrolysis region was found to be active for HDO of hydropyrolysis vapors of cellulose
(7) A WGS catalyst, 2% Pt/Al2O3, was found to be active for HDO of hydropyrolysis vapors of cellulose in the
downstream HDO conditions.
(8) Comparison of the 2% Pt/Al2O3 catalyst to pure Al2O3 showed that a balance between acid function on the
Al2O3 and hydrodeoxygenation on the Pt metal function is needed to optimize dehydration, deoxygenation,
and coking in the HDO reactor.
Investigation of Coal and Biomass Gasification using in-situ Diagnostics
(1) A unique, laboratory scale, continuous-flow, high-pressure, high-temperature and optically accessible
gasifier arrangement has been designed and assembled. The gasifier arrangement consists of a novel steam-
generator, a high-pressure powder feeder and optical accessibility for in-situ diagnostics along the reactor
length. Operation of the gasifier arrangement at the design pressure and temperature conditions has been
demonstrated.
(2) Gasification of a coconut-based char and anthracite coal has been demonstrated at a temperature of 1100 K
and 1 MPa. Gas-phase carbon species (in the form of CH4, CO, and CO2) have been measured using
product gas sampling and analysis.
(3) A fixed-bed gasifier has been developed, assembled and demonstrated. Optical access within the fixed-bed
gasifier enables in-situ diagnostics in a highly controlled setting. Gasification of pinewood biomass in CO2
has been successfully demonstrated and repeated. Product gas analysis and solid mass balance has indicated

Page 66 of 72
AFOSR Grant # FA9550-08-1-0456 Final Performance Report Purdue University
up to 80% conversion of the original feedstock. The next steps include gasification in a high-pressure
environment and gasification in the presence of solid catalysts.
(4) Micro-structural analysis combined with x-ray characterization techniques have shown to provide valuable
insight into the structural and chemical evolution of the feedstock during gasification. Systematic analysis
into the formation of the micropores and will be conducted in subsequent studies and contribute to
heterogeneous chemistry modeling.
(5) In-situ diagnostics have been demonstrated via the use of TDLAS for the measurement of CO
concentrations. Product gas sample composition and in-situ TDLAS measurements have been compared
and show qualitative correlation. Future work will include the demonstration of the TDLAS method in the
particle-laden continuous flow arrangement, where scattering of the signal off of particles is an additional
challenge.
(6) Mathematical modeling of the coal gasification process has shown that carbon conversion is highly
sensitive to the operating temperature.
(7) The models show that the assumption of constant diffusivity for all gas-phase species, especially when H2
is present, tends to over-predict the carbon conversion rates. Differential diffusivity models represents the
gasification process more accurately.
(8) The addition of H2 as a gasification reactant, via partial recirculation of the product gases, can inhibit CO2
formation via the water-gas-shift-reaction. However, H2 also interferes with the gasification reaction rate
and reduces the rate of carbon conversion.
(9) The water-gas-shift reaction is not in equilibrium for the steam gasification process. The water -gash-shift
equilibrium assumption is more accurate for the high-temperature gasification process with the addition of
O2 as a reactant.
4.0 Participating Personnel
Biomass Fast-Hydropyrolysis: School of Chemical Engineering
1. Rakesh Agrawal, Professor, PI. Oversaw and participated in all aspects of the research related to biomass
hydropyrolysis and provided the overall vision for a sustainable transportation fuel economy.
2. Fabio H. Ribeiro, Professor, participating investigator. Participated in design and oversaw construction and
operation of all equipment, participated in design and interpretation of all experiments.
3. W. Nicholas Delgass, Professor, participating investigator. Participated in design of equipment and design
and interpretation of all experiments.
4. Andrew Smeltz, Lead Research Engineer. Oversaw and helped design, build and operate all experimental
apparatuses, responsible for compiling research reports from group members.
5. Fernando Resende, Post-Doctoral Research Associate. Helped design and operate continuous low pressure
pyrolysis unit used for visualization studies.
6. Jun Wang, Post-Doctoral Research Associate. Built and operated continuous optically-accessible pyrolysis
reactor used for visualization studies.
7. Dharik Mallapragada, Graduate Student. Performed overall process calculations to support the
experimental studies.

Page 67 of 72
AFOSR Grant # FA9550-08-1-0456 Final Performance Report Purdue University
8. Piotr Gawecki, Graduate Student. Designed, built, and operated micro batch pyrolysis reactor used for
visualization studies.
9. Navneet Singh, Graduate Student. Performed overall process calculations that established the research
direction and led to motivation for the experimental studies.
10. Harshavardhan Choudhari, Graduate Student. Helped design, build, and operate micro-scale batch fast-
hydropyrolysis and fixed bed catalytic reactor and compiled data for reporting.
11. Viktor Cybulskis, Graduate Student (Summer Research). Helped design, build, and operate decoking
apparatus used for char formation studies and compiled data for reporting.
12. Vinod K. Venkatakrishnan, Graduate Student. Helped design, build and operate continuous high-pressure
fast-hydropyrolysis and fixed-bed catalytic reactor and compiled data for reporting.
13. Yury Zvinevich, Director of the Advanced Spectroscopic Facility. Helped design and build all apparatuses
used in this study.
Investigation of Coal and Biomass Gasification using in-situ Diagnostics: School of Mechanical Engineering and School of Aeronautical and Astronautical Engineering
1. Jay Gore, Professor, Co-PI. Oversaw and participate in all aspects of the research related to the optically
accessible gasifier and flame structure studies. Provided overall coordination and support across the project.
2. Robert Lucht, Professor, participating investigator. Oversaw the design, construction and operation of the
counter flow burner experiment for flame structure studies. Provided expertise in design of experiment for
optical diagnostics for gasifier.
3. Li Qiao, Assistant Professor, participating investigator. Oversaw the computational work related to flame
structure studies. Provided her expertise related to coal gasifier modeling.
4. Scott Meyer, Operational director, Maurice J. Zucrow Laboratories. Oversaw the design and construction
of the gasifier experimental apparatus and laboratory infrastructure.
5. Sameer V. Naik, Visiting Assistant Professor. Participated in design and operation of experiment for flame
structure studies. Provided his expertise in design of experiment for optical diagnostics of gasifier.
6. Anup Sane, Graduate Student. Performed overall process calculations that established the research
direction, led the design process of the high pressure particle feeder and optical diagnostics system,
responsible for compiling research reports from group members.
7. Indraneel Sircar, Graduate Student. Led the design of the reactor vessel, support structure, and control and
diagnostics systems for the gasifier arrangement, responsible for product gas analysis, post-gasified
material characterization and compiling research reports from group members.
8. Jian Xu, Graduate Student. Performed the computational work on the multiphysics modeling of carbon
gasification process using detailed chemistry.
9. Rohan Gejji, Graduate Student. Led the design and manufacture of the chemical steam generator and the
assembly process of the optically accessible gasifier arrangement for gasifier.
10. David Blunck, Former Graduate Student (now at AFRL, Dayton, OH). Oversaw and participate in the
design process of gasifier arrangement, worked as a project coordinator.
11. Aman Satija, Graduate Student. Performed experimental work for flame structure studies.

Page 68 of 72
AFOSR Grant # FA9550-08-1-0456 Final Performance Report Purdue University
12. Deepti Singh, Graduate Student. Performed premixed flame speed measurements and computations for
alternative fuels.
13. Devashish Bangar, former Undergraduate Student (now Graduate Student). Learned laboratory practices
and helped with experimental arrangements.
14. Yahui Wang, Undergraduate Student (Summer-Undergraduate-Research-Foundation Fellow). Performed
detailed calibration of the powder feeder with various feed-stocks at high pressure and improved the flow-
ability of various feeds-tocks through design iterations on the powder feeder.
15. Hao Wu, Undergraduate Student (Summer-Undergraduate-Research-Foundation Fellow). Performed
detailed plug-flow reactor simulations on Ansys Fluent to aid with the development of the experimental
apparatus, aid with selection of feed-stock, and solve process problems.
16. Zexi Xu, Undergraduate Student (Summer-Undergraduate-Research-Foundation Fellow). Learned the
theory behind laser-absorption-spectroscopy and helped arrange and calibrate the initial diode-laser for
water-vapor measurements.
17. Sameer Patel, Visiting Assistant Scholar. Learned about coal and biomass gasification, provided help in
arranging experimental apparatus, and helped with multi-specie, multi-diffusion single particle gasification
modeling.
18. Christine S. LaBelle, Undergraduate Student. Provided hands-on help in the laboratory.
5.0 Publications and Presentations 5.1 Publications
Published
[1] Agrawal,R., Singh, N. R., 2010, “Solar Energy to Biofuels,” Annual Review of Chemical and Biomolecular
Engineering, 1, pp. 343-364.
[2] Singh, N. R., Delgass, W. N., Ribeiro, F. H., Agrawal, R., 2010, “Estimation of Liquid Fuel Yields from
Biomass,” Environmental Science and Technology, 44(13), pp. 5298-5305.
[3] Qiao, L., Xu, J., Sane, A., Gore, J. P., 2012, “Multiphysics modeling of carbon gasification processes in a well-
stirred reactor with detailed gas-phase chemistry,” Combustion and Flame, 159(4), pp. 1693-1707.
In Progress
[4] Singh, N. R., Mallapragada, D. S., Agrawal, R., Tyner, W. E., “Economic Analysis of Novel Synergistic Biofuel
(H2Bioil) Processes,” Submitted for publication to Biomass Conversion & Biorefinery.
[5] Gawecki, P., Smeltz, A. D., Hurt, M. R., Borton II, D. J., Vinueza, N. R., Nugent, N. J., Agrawal, R., Delgass,
W. N., Kenttämaa, H. I., Anderson, W. E., Ribeiro, F. H., “Direct Production of Molecules in the Fuel Range by
Selective Tailoring of Biomass Fast Pyrolysis,” (In Preparation).
[6] Sane, A., Sircar, I., Gore, J. P., “A Study of Biomass Gasification with Hot CO2, Steam and Excess Hydrogen,
Proceedings of the 34th
International Symposium on Combustion, (In Review).
Page 69 of 72
AFOSR Grant # FA9550-08-1-0456 Final Performance Report Purdue University
5.2 Conference Papers and Presentations
[1] “Energy Solutions for a Fossil Fuel Deprived Future”, Rakesh Agrawal, Andlinger Energy Lecture, Princeton
University, Princeton, February 2009.
[2] “Transportation Fuel in a Fossil Fuel Free world”, Rakesh Agrawal, Renewable Energy World 2009, Las
Vegas, March 2009.
[3] “Sustainable Energy Utilization and Transformation”, Rakesh Agrawal, George W. Woodruff School of
Mechanical Engineering’s Sustainable Energy Pathways and Solutions Workshop, Georgia Tech., Atlanta,
April 2009.
[4] “Synergistic Processes for Biofuels”, Rakesh Agrawal, Purdue Biofuels Symposium, West Lafayette, In, May
2009.
[5] “A Study of Steam Gasification of Coal with CO2 Control using H2,” Sane, A., Zheng, Y., and Gore, J. P., Proc.
6th US National Combustion Meeting, Ann Arbor, MI, May 2009.
[6] “Transportation Fuel in a Solar Economy”, Rakesh Agrawal, Keynote Lecture, FOCAPD, Breckenridge, Co,
June 2009.
[7] “Synergistic Processes for Biofuels”, Rakesh Agrawal, Plenary Lunch Lecture, BioFuels Conference- The Next
Generation of Biofuels, Mississippi State University, Jackson, MS, August 2009.
[8] “Energy Solutions for a Fossil Fuel Deprived Future”, Rakesh Agrawal, Pioneers in Energy Lecture, Purdue
University, West Lafayette, IN, September 2009.
[9] “More Liquid Fuel from Biomass”, Rakesh Agrawal, Indo-US Workshop on Climate and Energy Futures,
Chennai, India, October 2009.
[10] “Transportation Fuel Solutions Using Renewable Energy”, Rakesh Agrawal, RTI Fellows Symposium, RTI
International, Research Triangle Park, NC, November 2009.
[11] “Solar Based Sustainable Ener gy Solutions”, Rakesh Agrawal, Maddox Solar Energy Series, Whitacre
College of Engineering at Texas Tech University, February 2010.
[12] “Solar Based Sustainable Energy Solutions”, Rakesh Agrawal, Plenary Lecture, 2nd International Symposium
on Sustainable Chemical Product and Process Design (ISSCPPE), Hangzhou, China, May 2010.
[13] “Coal and Biomass to Liquid Fuel Synthesis for Aerospace Engines,” Anup Sane, Rohan Gejji, and Indraneel
Sircar, Poster Presentation, 5th
Annual Frontiers in Bioenergy Symposium, Purdue University, West Lafayette,
IN, May 2010.
[14] “Transportation Fuel Solutions using Renewable Energy”, Dharik Mallapragada, EPFL, Lausanne, Switzerland,
September 2010.
[15] “Chemical Engineering in a Solar Energy Driven Sustainable Future”, Rakesh Agrawal, PPG Foundation
Keynote Address, 32nd
Annual Chemical Engineering Graduate Student Association Symposium, Carnegie Mellon University, Pittsburgh, PA, October, 2010.
[16] “Solar Based Sustainable Energy Solutions”, Rakesh Agrawal, Pirkey Lecture, University of Texas, Austin, TX,
November 2010.

Page 70 of 72
AFOSR Grant # FA9550-08-1-0456 Final Performance Report Purdue University
[17] “Solar Based Sustainable Energy Solutions”, Rakesh Agrawal, Invited keynote address, AIChE annual meeting,
Salt Lake City, UT, Nov 2010.
[18] “Design and Construction of an Optically-Accessible Coal Gasifier for CO2 Reduction using Excess H2,"Sircar,
I., Gejji, R., Sane, A., Blunck, D., Meyer, S., and Gore, J. P., Proc. 49th AIAA Aerospace Sciences Meeting,
Orlando, FL, January 2011.
[19] “Multiphysics Modeling of Coal Gasification Processes in a Perfectly-stirred Reactor with Detailed Gas-
Phase Chemistry,” L. Qiao, J. Xu, A. Sane, J. Gore, Proc. 49th AIAA Aerospace Sciences Meeting,
Orlando, FL, January 2011.
[20] “Transportation Fuel Solutions Using Solar Energy”, Rakesh Agrawal, Helmholtz-Zentrum Berlin für
Materialien und Energie, Berlin, Feb 2011.
[21] “Coal Gasification and its Impact on Domestic Energy Security,” Indraneel Sircar, Poster Presentation, 2011
Next Generation Scholars, Purdue University, West Lafayette, IN, February 2011.
[22] “Chemical Engineering in a Solar Energy Driven Sustainable Future”, Rakesh Agrawal, IIT Kanpur, March
2011.
[23] "An experimental study of a superheated H2-O2 steam generator," Gejji, R., Sane, A., Rankin, B., Sircar, I.,
Meyer, S., and Gore, J. P., Proc. 7th US Joint Combustion Meeting of the Combustion Institute, Georgia Institute of Technology, Atlanta, GA, March 2011.
[24] “Multiphysics Modeling of Coal Gasification Processes in a Perfectly-stirred Reactor with Detailed Gas-
Phase Chemistry,” L. Qiao, J. Xu, A. Sane, J. Gore, Proc. 7th US Joint Combustion Meeting of the
Combustion Institute, Georgia Institute of Technology, Atlanta, GA, March 2011.
[25] "Design and Testing of a High Pressure and Temperature, Optically Accessible, Entrained Flow Coal Gasifier,"
Sircar, I., Gejji, R., Sane, A., Blunck, D., Meyer, S., and Gore, J. P., Proc. ASME/JSME 8th Thermal
Engineering Joint Conference, Honolulu, HI, March 2011.
[26] “Chemical Engineering in a Solar Energy Driven Sustainable Future”, Rakesh Agrawal, Hugh M. Hulburt
Memorial Lecture, Northwestern University, Evanston, IL, April 2011.
[27] “Energy Systems Analysis for a Renewable Transportation Sector”, Rakesh Agrawal, Navneet R. Singh and
Dharik S. Mallapragada, Proceedings 21st European Symposium on Computer Aided Process Engineering-
ESCAPE-21, Porto Carras, Chalkidiki, Greece, May 2011
[28] “Catalytic Hydropyrolysis – it Really is Rocket Science”, Fabio H. Ribeiro, 6th
Frontiers in Bioenergy: United
States-Brazil Symposium on Sustainable Bioenergy, West Lafayette, IN, May 2011.
[29] “Optically Accessible Entrained Flow Steam Gasifier,” Indraneel Sircar and Anup Sane, Invited Presentation,
NETL Multiphase Flow Workshop, Coraopolis, PA, August 2011.
[30] “Direct Production of Molecules in the Fuel Range by Selective Tailoring of Biomass Fast Pyrolysis”, Fabio H.
Ribeiro, Piotr Gawecki, W. Nicholas Delgass, Rakesh Agrawal, Andrew Smeltz, Matthew R. Hurt, David J.
Borton II, Nelson R. Vinueza, Hilkka I. Kenttamaa, Nicholas J. Nugent and William E. Anderson,
IDECAT/JCAT Conference on Catalysis, Bertinoro, Italy, September 2011.
[31] "Tunable Diode Laser Absorption Diagnostics and Gas Composition Analysis of Reaction Progress in a
Laboratory-Scale Entrained-Flow Gasifier," Sane, A., Sircar, I., R., G., Rankin, B., Guildenbecher, D., Naik, S.,
Lucht, R., and Gore, J., 2011 International Pittsburgh Coal Conference, Pittsburgh, PA, September 2011.

Page 71 of 72
AFOSR Grant # FA9550-08-1-0456 Final Performance Report Purdue University
[32] “Optically Accessible, Entrained-Flow, Steam Drive Coal and Biomass Gasifier,” Indraneel Sircar and Anup
Sane, Poster Presentation, Shell Energy Day, Purdue University, West Lafayette, IN, September 2011 .
[33] “Optically Accessible, Entrained-Flow, Steam Drive Coal and Biomass Gasifier,” Indraneel Sircar and Anup
Sane, Poster Presentation, China-US 2011 Joint Symposium: Prospects and Challenges of Growing the Biology
Based Economy, Purdue University, West Lafayette, IN, September 2011.
[34] “Chemical Engineering in a Solar Energy Driven Sustainable Future”, Rakesh Agrawal, Hess Lecture,
Department of Chemical Engineering, University of Virginia, October 2011.
[35] “Chemical Engineering Innovation Needs for a Future Solar Economy”, Rakesh Agrawal, Plenary Lecture, 61st
Canadian Chemical Engineering Conference, London, Ontario, Canada, October 2011.
[36] “Novel Pathways for Biomass-to-Liquid Fuel Production”, Rakesh Agrawal, In session honoring Professor
Santosh K. Gupta, AIChE Annual Meeting, Minneapolis, MN, October 2011.
[37] “High-Pressure Fast-Pyrolysis and Fast-Hydropyrolysis for Conversion of Biomass to Liquid Fuels”, Vinod K.
Venkatakrishnan, Andrew Smeltz, Sergey Semikolenov, Fabio H. Ribeiro, W. Nicholas Delgass, Rakesh
Agrawal, AIChE Annual Meeting, Minneapolis, MN, October 2011.
[38] “Direct Production of Molecules in the Fuel Range by Selective Tailoring of Biomass Fast Pyrolysis”, Piotr
Gawecki, Fabio H. Ribeiro, W. Nicholas Delgass, Rakesh Agrawal, Andrew Smeltz, Matthew R. Hurt, David J.
Borton II, Nelson R. Vinueza, Hilkka I. Kenttamaa, Nicholas J. Nugent and William E. Anderson, AIChE
Annual Meeting, Minneapolis, MN, October 2011.
[39] “Multiphysics Modeling of Coal Gasification Processes in a Perfectly-stirred Reactor with Detailed Gas-
Phase Chemistry,” L. Qiao, J. Xu, A. Sane, J. Gore, Fall Technical Meeting, Western States Section of the
Combustion Institute, University of Riverside, CA, October 2011.
[40] “Multiphysics Modeling of Coal Gasification Processes in a Perfectly-stirred Reactor with Detailed Gas-
Phase Chemistry,” L. Qiao, J. Xu, A. Sane, J. Gore, Fall Technical Meeting, Eastern States Section of the
Combustion Institute, University of Connecticut, CT, October 2011.
[41] “Novel Pathways for Biomass-to-Liquid Fuel Production”, Rakesh Agrawal, Plenary Lecture, 6th
Sino/US joint
conference, Beijing, China, November 2011.
[42] “Optically Accessible, Entrained-Flow, Steam Drive Coal and Biomass Gasifier,” Indraneel Sircar, Poster
Presentation, Ecological Sciences and Engineering Symposium: 7 Billion People – 7 Grand Challenges, Purdue
University, West Lafayette, IN, November 2011 (Awarded 2nd
place).
[43] “An Experimental Study of a H2-O2 Flame based Superheated Steam Generator for Coal Gasification”, Gejji,
R., Sane, A., Sircar, I., Rankin, B., Meyer, S., and Gore, J.P., 2012, 50th AIAA 2012 Aerospace Sciences
Meeting, January 2012.
[44] “A Study of Biomass Gasification with Hot CO2, Steam and Excess Hydrogen,” Sane, A., Sircar, I., Gore, J. P.,
Submitted for the 34th
International Symposium on Combustion, Jul 29 – Aug 3, 2012.
Conference Papers Indirectly Supported by the AFOSR Grant
[45] “Dual-pump CARS measurements in a gas turbine combustor facility using the NASA 9-point lean direct
injector,” Thariyan, M. P., Bhuiyan, A. H., Chai, N., Naik, S. V., Lucht, R. P., and Gore, J. P., Proc. 48th AIAA
Aerospace Sciences Meeting and Exhibit, Orlando, FL, January 2011.

Page 72 of 72
AFOSR Grant # FA9550-08-1-0456 Final Performance Report Purdue University
[46] “Temperature and CO2 measurements in a high-pressure, lean direct injector combustor using dual-pump
CARS,” Thariyan, M. P., Bhuiyan, A. H., Naik, S. V., Gore, J. P., and Lucht, R. P., Proc. Spring Technical
Meeting of Central States Section of the U. S. Sections of the Combustion Institute, Champaign, IL, March
2010.
[47] “Dual-pump CARS and OH-PLIF measurements at elevated pressures in a gas turbine combustor facility,”
Thariyan, M. P., Bhuiyan, A. H., Naik, S. V., Gore, J. P., and Lucht, R. P., Proc. 27th AIAA Aerodynamic
Measurement Technology and Ground Testing Conference, Chicago, IL, June 2010.
[48] "Characterization of methane-air and hydrogen-air flames using stereoscopic particle imaging velocimetry
(SPIV) and coherent anti-Stokes Raman scattering (CARS)," Satija, A., Panda, P., Wagh, Y., Naik, S. V., Gore,
J.P., and Lucht, R. P., Proc. 7th Joint Meeting of the U.S. Sections of the Combustion Institute, Atlanta, GA,
March 2011.
[49] "Temperature and CO2 measurements in a high-pressure, lean direct injector combustor using dual-pump
CARS," Thariyan, M. P., Bhuiyan, A. H., Naik, S. V., Gore, J. P., and Lucht, R. P., Proc. 7th Joint Meeting of
the U.S. Sections of the Combustion Institute, Atlanta, GA, March 2011.