Embed Size (px)
Citation preview
UNIVERSITY OF TECHNOLOGY SYDNEY
Analysis of Tax Avoidance Strategies of Top Foreign Multinationals Operating in
Australia: An Expose
RossMcClure,RomanLanisandBrettGovendir
19April2016
1
1. Introduction to Tax Aggressiveness
The term “tax aggressiveness” first entered accounting research literature in the late 1990’s.
At this time, the gap between financial income and tax income in company financial
statements was getting wider and wider.1 Research into tax aggressiveness has been
concerned with the magnitude, determinants and consequences of these corporate behaviours
and activities. It has borrowed from similar research in economics that investigates the tax
burden and where the burden lies, and from finance research that examines the effect of taxes
on firm value, expected returns and leverage (Hanlon & Heitzman 2010).
In tax research, “tax aggressiveness” is generally defined as a broad continuum of activities
that range from benign behaviours that were envisioned by tax policies at one end, to outright
tax fraud and tax evasion at the other (Hanlon & Heitzman 2010). While the term has a
specific meaning within accounting research into tax, in wider practice it is used
interchangeably with the term “tax avoidance”, and in Australia, it is often referred to as
“aggressive tax planning”. Much of the tax research uses very broad definitions of tax
aggressiveness that capture all tax-reducing activities. However, it is the activities at the
more aggressive end of the spectrum that is of interest to most stakeholders, such as tax
authorities, capital markets, employee organisations and interest groups.
The need to encompass the definitions from other disciplines becomes obvious when a firm,
or firms, have been identified and accused of being tax aggressive. The first response by the
firm, or firms, or the industry body, is nearly always that they fully comply with all laws and
pay all taxes required of them in all jurisdictions in which they operate (Aston & Wilkins
2014). The question as to whether or not an activity or scheme is legal is a fundamental issue
in gauging or ranking the level of tax aggressiveness. As Borek, Frattarelli & Hart (2014)
point out, “litigation has long revealed difficulties in designing, implementing and
interpreting tax law in a manner that allows taxpayers to claim intended benefits without
encouraging abuse.” (p.2) The abuse of tax mechanisms for unintended consequences are the
activities and corporate behaviours that both interests and motivates much of the tax research
in accounting.
Within the research literature, as well as in general usage, there are other terms such as “tax
minimisation”, “tax planning”, “tax avoidance”, “tax sheltering”, and “tax evasion”. At
1ThisgapwasidentifiedbyDesai(2003)whofoundthatby1998,thebook-taxgapcouldnolongerbeexplainedbythepreviouslyattributeddeterminants,suchascapitalallowances,debtstructure,etc.
2
times, some of these terms are also often used interchangeably. However, they can have
specific meanings, based on legal, economic or legislative notions. Recent attempts to
categorise and characterise these terms (Lisowsky, Robinson & Schmidt 2013; Hanlon &
Heitzman 2010) has led to the following general categorisation.
• Tax minimisation refers to any activity that reduces explicit taxes.2 This includes tax
concessions such as capital allowances, accelerated depreciation, and research and
development tax deductions that designed to encourage investment and growth in the
Australian economy.
• Tax planning is a term mainly used in Australia and Europe research literature and
usually refers to an aggressive form of tax minimisation. It is described as a
concerted strategy to reduce taxes.
• Tax avoidance refers to companies (and individuals) entering into transactions that
have no economic significance, and with the sole or dominant purpose of reducing
taxes. While this is supposedly illegal in Australia under Part IVA of the Income Tax
Assessment Act, these cases can be difficult to prosecute and exist in a “grey” area of
tax law that usually requires judicial determination.
• Tax sheltering is a U.S. term that is similar to tax avoidance, but usually refers to
schemes that are marketed by tax consultants and sometimes involve a series of
transactions in an attempt to disguise the ultimate nature of the arrangement.
• Tax evasion refers to activities that are illegal under tax legislation such as not
reporting foreign income or claiming fraudulent deductions.
The decision to enter into an aggressive tax scheme involves balancing the costs and benefits
involved. The main benefits of corporate tax aggressiveness are:
• increased cash and liquidity (Saveedra 2014);
2Explicittaxesarethosetaxespaidtotaxauthorities.Ontheotherhand,implicittaxesarethelossesincurredbyenteringtocertaintransactions.Forexample,whenaU.S.firmpurchaseslocalgovernmentbonds,theinteresttheyreceiveonthebondsisnottaxableincome,therebyreducingexplicittaxes.However,thefirmmayhavetoacceptlowerratesofreturnonthesebondsthantheycouldachieveelsewhere,therebyincurringanimplicittax.Mosttaxresearchisonlyinterestedinexplicittaxes.Implicittaxesareverydifficulttoidentifyorestimateandarelargelyignoredintaxresearch.
3
• increased after-tax profits represented in a firm’s performance metrics such as
earnings per share (Hanlon & Slemrod 2009);
• a reduced tax liability (Hanlon & Slemrod 2009); and,
• a reduced effective tax rate that can send a positive signal to investors, thereby
reducing the cost of equity capital (Chi, Pincus & Teoh 2014; McGuire, Omer &
Wilde 2014; Inger 2014).
The costs of tax aggressiveness include:
• transaction costs incurred in setting up the tax planning strategy, such as registration
and legal fees to establish off-shore subsidiaries;
• the risk of detection if the activities are illegal, or in the “grey” area. Gergen (2002)
produced empirical evidence that the risk of detection increases as more firms engage
in the same strategy, and also with the length of period a firm pursues the strategy;
• the increased ability of managers to use the opaqueness required to disguise some
transactions in order to extract rents for themselves (Desai & Dharmapala 2009); and,
• the incentives required to encourage the tax manager or director to engage in these
activities, as they face personnel costs if detected (Crocker & Slemrod 2005; Chen &
Chu 2005).
There are further costs involved if the activity is detected and disallowed, such as:
• the unpaid tax liability and back taxes;
• tax benefits that may be disallowed;
• interest on the tax deficiency;
• penalties imposed on both managers and the firm; and,
• staff and mangers time along with disruptions from normal activities in order to
comply with a tax audit.
Critically, there are also reputational and political costs from being associated with tax
avoidance, both for the firm (Gallermore, Maydew & Thornock 2013) and the individual
4
managers (Chyz 2013). Reputational damage can affect a company’s sales, and produce a
negative effect on a firm’s share price, leading to an increased cost of equity capital (Hanlon
& Slemrod 2009).
However, if the only determinant of tax aggressiveness was weighing up of the costs and
benefits involved, it would most probably be much more widespread than it is and involve
almost all firms. Different risk profiles between firms, and amongst the individuals involved,
leads most tax research to observe a variation in level of tax aggressiveness between firms
(Weisbach 2002; Hanlon & Heitzman 2010).
The response to corporate tax aggressiveness by tax authorities has followed three main
avenues. Firstly, there has been a concerted effort to close any loopholes in the current
legislation, such as an amendment to the ITAA973 in 2015 that closed a loophole in the
definition of a permanent establishment that made it inapplicable to overseas multinational
corporations for capital gains tax purposes. The second response has been to improve the
general anti-avoidance provisions that are contained in Part IVA of the ITAA364. Part IVA
cases are difficult to prosecute and there have been few successful cases in Australia. The
third response was the introduction of dividend imputation in Australia in 1987 that provides
strong incentives for firms to pay the full statutory tax rate on all reported profits. Companies
that pay fully franked dividends in Australia pay on average over 10% additional tax on the
same level of earnings than companies not paying franked dividends (Govendir et al. 2016).
However, private companies do not have the same level of incentives as they do not need to
send a message to their shareholders and the financial markets regarding their future
prospects. Foreign-owned companies and investors do not benefit from the imputation
system and are not influenced by the incentives.
Multinational corporations are in a unique position to engage in tax aggressive strategies, as
they are generally large in size and highly profitable, they exhibit low levels of debt in their
capital structure, and have operations across national borders that generate foreign income
streams. The overall group is made up of multiple entities across a number of tax
jurisdictions and most multinational corporations have at least one subsidiary in a tax haven.
These characteristics have been associated with tax shelter activity in the U.S. (Wilson 2009)
and with aggressive tax planning strategies such as abusive transfer pricing in Australia
3IncomeTaxAssessmentAct,19974IncomeTaxAssessmentAct,1936
5
(Richardson et al. 2012). The information technology, pharmaceutical and energy sectors are
both dominated by large multinational corporations and provide strong mechanisms that
allow these corporations to divert profits away from where value and profits are created in
order to reduce their tax liabilities.
2. Base Erosion, Profit Shifting and Loss Creation Mechanisms
Shifting profits away from where they are created to low or zero tax jurisdictions undermines
the corporate tax base in those countries whence profits are diverted. Companies that engage
in these behaviours operate at an advantage to domestic only companies as they do not have
to provide funds to cover their tax liabilities. They are able to undercut their domestic
competitors’ profits and margins, thereby reducing the aggregate amount of profits that are
captured by a national corporate tax regime. While globalisation has brought many benefits to
the global and domestic economies,5 it has also created problems for national tax laws.
Multinational corporations dominate large sectors of the global economy, interconnected
financial markets support the rapid movement of capital, and the digital economy allows
firms to connect with a global customer base, ignoring national boundaries. This creates gaps
and mismatches in and between national tax laws that can be exploited, especially by
multinational corporations.
In the pre-integrated world economy, the main tax issue affecting world trade and the ability
of companies to operate in multiple economies was double taxation, whereby profits were
taxed in the country where the operations took place and again when the (after tax) profits
were repatriated to the parent company. This issue has been mainly addressed by the
negotiation of bilateral tax treaties where the two countries agree on where the tax will be
imposed. However, we now have an issue with double non-taxation, where these same tax
treaties are being used to avoid paying tax anywhere. This undermines the fairness and
integrity of corporate tax systems allowing multinational corporations a competitive
advantage over their domestically-based rivals. The consequences of this behaviour by
multinational corporations affect almost all countries, but have a larger effect on developing
5AccordingtotheOECDActionPlanonBEPS,Globalisationhasresultedin“thefreemovementofcapitalandlabour, the shift ofmanufacturing bases fromhigh-cost to low-cost locations, the gradual removal of tradebarriers, technological and telecommunication developments, and the ever-increasing importance ofmanaging risks and of developing, protecting and exploiting intellectual property, have had an importantimpacton theway cross-borderactivities takeplace.Globalisationhasboosted tradeand increased foreigndirectinvestmentsinmanycountries.Henceitsupportsgrowth,createsjobs,fostersinnovation,andhasliftedmillionsoutofpoverty.”(OECD2013)
6
countries, as they face policy and other conditions that reduce their abilities to address these
corporate strategies.
The Organisation for Economic Co-operation and Development (OECD) has identified the
opportunities multinational corporations have to greatly reduce their tax burden and the harm
this creates for governments who are experiencing declining tax revenues, for individual
taxpayers who have to cover the shortfall in corporate taxes, and for other business who have
difficulty competing. In 2012, the G20 finance ministers requested that the OECD develop an
action plan to address Base Erosion and Profit Shifting (BEPS) by multinational corporations.
BEPS refers to tax planning strategies that exploit these gaps and mismatches in tax rules to
artificially shift profits to low or no-tax locations where there is little or no economic activity,
resulting in little or no overall corporate tax being paid. BEPS is of major significance for
developing countries due to their heavy reliance on corporate income tax, particularly from
multinational enterprises (MNEs). The BEPS Action Plan states that "BEPS relates chiefly to
instances where the interaction of different tax rules leads to double non-taxation or less than
single taxation.” (OECD 2013, p.10) These activities artificially segregate income from the
activities and jurisdictions that generate them, through a series of arrangements that
ultimately achieve low or zero taxation. The concern is that because of the gaps in the
interactions between separate, domestically-based tax systems, and in some cases due to the
application of bilateral tax treaties, that “income from cross-border activities may go untaxed
anywhere, or be only unduly lowly taxed." (OECD 2013, p.10) Research undertaken since
2013 confirms the potential magnitude of the BEPS problem. Conservative estimates indicate
annual losses of anywhere from 4 to 10% of global corporate income tax revenues, i.e.
$US100 to $US240 billion annually (OECD 2015, p.4).
Another mechanism used to reduce tax liabilities but has received little attention from
corporate regulators, tax authorities or accounting researchers is loss creation. In March
2016, the Australian Tax Office (ATO) released data on large private companies operating in
Australia for 2014. This data showed that almost a third6 of these companies reported no tax
liability for the year. The response from many of these companies, their industry associations
and some in the financial press argued that these companies had losses from previous periods
and these losses can legitimately be used to offset current tax liabilities. The message being
expressed is that it is a fairly low act to accuse these poor companies, who are making losses, 692outofatotalof321privatecompaniesthatreportedrevenuesover$200millionin2014hadnotaxliabilityforthatyear(ATO2016).
7
of being tax aggressive. In some cases, such as Qantas, there are legitimate reasons for the
substantial losses they incurred during the Global Financial Crisis, such as high oil prices, a
high interest expense, and a drop off in the demand for air travel. There is an incentive for
firms that are making a loss due to changed market situation to maximise the size of the loss
for tax purposes. However, there has been little to no scrutiny of how many of these losses
are generated, particularly for private companies who have less incentive to report profits.
The methods used by companies to increase their tax losses have not been investigated
although there is some evidence that supports the existence of such strategies. There is
substantial evidence, that in their first year following their appointment, new CEO’s take
what is called a “big bath”. They employ strategies to create large losses and blame it on the
incompetence of the previous occupant thereby providing themselves with ample flexibility
to improve performance in subsequent years (Murphy & Zimmerman 1993; Arya et al. 1998).
For instance, large write-downs and impairments of assets are written directly into the income
statement and are based on internally-generated estimates providing flexibility as to timing
and magnitude.
Loss creation is particularly useful for large infrastructure investments, such as resources and
energy companies as they are characterised by large initial investments with long time lags
between the commencement of the investment, the start of production and the receipt of sales
revenues. During these time lags, the operation is incurring expenses, such as interest
payments and administrative costs, but is not receiving any revenues, therefore reporting a
loss. Losses can accumulate over extended periods and it can take years to offset these losses
with profits before any tax is paid. Loss creation provides an opportunity for firms to
maximise losses in order to reduce future tax liabilities.
BEPS and loss creation are overall strategies that firms use to reduce their tax liability and,
due to the cost and effort involved in setting up the schemes that are employed, are usually
undertaken on an ongoing or permanent basis. Two schemes that are used stand out as being
most popular with large multinational corporations and most problematic for tax authorities.
Technology and pharmaceutical firms favour a scheme dubbed the Double Irish with Dutch
Sandwich, while resources and energy firms prefer the use of Thin Capitalisation and Debt
Loading to lower their tax liability.
2.2 Double Irish with Dutch Sandwich
8
The Double Irish with Dutch Sandwich scheme is used to move profits from both the country
where the intellectual property rights are created as well as from the country where the
revenues are realised through sales. Intellectual property rights are usually held in low or zero
tax jurisdictions and revenues from sales are either booked directly to the subsidiary in the
tax haven, booked through another subsidiary first to avoid withholdings taxes, or
incorporated into the cost of the product at the manufacturing stage. There are other
variations of this scheme using Luxembourg, Switzerland, Delaware in the U.S., and
Singapore appears to be a hub for Australian operations.
Different processes will be used depending on the product or service being supplied. For
instance, Google books its revenues from sales of advertising in Australia directly to a
subsidiary in Singapore; Uber’s revenues from ride-sharing fares go directly to a subsidiary
in the Netherlands, and AirBnB revenues go directly to Ireland, thereby by-passing any
recognition of revenues in their Australian operations. On the other hand, Apple incorporates
large intellectual property rights costs into its products at the manufacturing stage through
licence, patent and copyright fees. They sell the product in Australia with a very low margin
between the selling price and the cost which is bloated with these fees. The margin is usually
just sufficient to cover the costs of their retail and marketing operations in Australia.
The Double Irish with Dutch Sandwich scheme utilises a series of aggressive tax planning
strategies to shift profits to low, or zero, tax jurisdictions. It involves the use of a
combination of Irish and Dutch subsidiary companies to shift profits and revenues, first
through one Irish company, then to a Dutch company, and finally to a second Irish registered
company but with its headquarters in a tax haven for tax purposes. This mechanism is used
primarily by large multinational tech and pharmaceutical companies and is based around the
transfer of intellectual property rights to a subsidiary in a tax haven. The royalties and
licence fees that are generated from these rights are then used to shift profits to the low tax
jurisdiction.
This technique has allowed large multinational corporations to dramatically reduce their
overall corporate tax rate. Ireland is one of the few countries that allow companies to choose
their own tax residency. It is this feature alone that allows this arrangement to exist. The
inclusion of a Dutch subsidiary is to avoid the imposition of withholding tax on funds being
transferred out of the EU, as the recipient is an Irish registered company. However, for tax
purposes, the Irish registered company has its headquarters in a tax haven.
9
The process usually involves the rights to some intellectual property such as patents or
copyrights. This intellectual property has mostly been produced in high to medium taxed
jurisdictions, such as the U.S., Europe, Korea, Japan, or Australia. Quite often it has been
produced with the aid of generous tax concessions for research and development expenses,
with the assistance of taxpayer-funded universities and research centres, or from large
government contracts, such as defence contracts in the U.S. While the economic rights may
have been produced in a high to medium taxed jurisdiction, they are subsequently transferred
to a subsidiary in a low or zero taxed jurisdiction. The rights are usually transferred at well
below either the cost to produce them or the future income they will generate. Once the
foreign subsidiary owns the economic rights, the profits derived from them become those of
the subsidiary, not the parent
Transferring the economic rights over the intellectual property to the subsidiary is either
through a direct transfer at low price or through a cost sharing arrangement. To reduce the
level of abuse that can take place when assets are transferred between associated entities,
transfer pricing rules based on “arm’s length” principles have been developed by tax
authorities. “Arm’s length” pricing involves an estimate of the price an entity would have
paid for the goods or service in an open market or what an unrelated third party would have
to pay. The problem with intangible assets, especially mobile assets such as intellectual
property rights, is that there is no active market for these rights in order to compare prices, as
each right is unique. An example of the abuse of transfer-pricing involving Microsoft was
outlined in a 2012 U.S. Senate enquiry. In 2011, Microsoft transferred certain intellectual
property rights to two subsidiaries. Microsoft Singapore paid $US1.2 billion and Microsoft
Ireland paid $US2.8 billion. However, in a single year, Microsoft Singapore generated
revenues of $US3 billion and Microsoft Ireland, $US9 billion from those rights. Over 85%
of Microsoft’s research and development is undertaken in the U.S. (Levin 2012)
Intellectual property rights acquired through a cost sharing arrangement does not involve any
transfer, so the transfer-pricing rules do not apply. Under cost sharing, the subsidiary in a
low tax jurisdiction provides some funds to a joint development of the intellectual property
with the parent company. These funds are usually a small proportion of the actual
development costs. However, the subsidiary usually acquires the rights to exploit the
intellectual property in all markets outside the parent company’s home country or region.
This arrangement has been mainly exploited by large U.S. multinational technology
10
companies who mostly pay full tax on their domestic operations and profits but pay very little
if any tax on profits produced abroad.
The "double Irish" provision allows corporations with operations in Ireland to make royalty
payments for the use of intellectual property rights to another Irish-registered subsidiary. It is
called double Irish because it requires two Irish companies to complete the structure. One of
these companies is tax resident in a tax haven, such as the Cayman Islands or Bermuda. Irish
tax law provides that a company is tax resident where its central management and control is
located, not where it is incorporated, so that it is possible for the first Irish company not to be
tax resident in Ireland. This company is the offshore entity which owns the valuable
intellectual property rights. These rights are then licensed to a second Irish company (tax
resident in Ireland) in return for substantial royalties or other fees. The second Irish company
receives income from use of the asset, but its taxable profits are low because the royalties or
fees paid to the first Irish company are deductible expenses. Any profits remaining in the
second Irish company are taxed at the Irish rate of 12.5%, although in Apple’s case this is
still regarded as too much, and they have negotiated a rate at around 1.5%.
The addition of a Dutch sandwich to the double Irish scheme is used to eliminate
withholdings tax liabilities. Ireland does not levy withholding tax on certain receipts from
other European Union member states. Therefore, revenues from the sale of the products
shipped by the second Irish company are first booked through a shell company in the
Netherlands, taking advantage of generous tax laws there. The remaining profits are then
transferred directly to the Cayman Islands or Bermuda. Thus if the two Irish holding
companies are thought of as "bread" and the Netherlands company as "cheese", this scheme is
referred to as the "Dutch sandwich". The Irish authorities never see the full revenues and
hence cannot tax them, even at the low Irish corporate tax rates. There are equivalent
Luxembourgish and Swiss sandwiches. Companies do not need to be located in Ireland,
Netherlands or even Europe to take advantage of this scheme.
An example of a company employing this method to reduce their tax liability is Google,
whose Dublin headquarters is its main hub for all sales outside the United States, including
Australia, and employs more than 2,500 people. A Dublin-based subsidiary of Google
generates the revenue, mostly from online advertising. It then pays royalties for the use of
Google intellectual property rights, such as the name and software, to another subsidiary in
the Netherlands, who in turn pay it back to a separate Google unit in Ireland, which is
11
resident in Bermuda for tax purposes. The second Irish company holds the ultimate rights to
the Google intellectual property.
In 2013, following pressure from the European Commission, the Irish government announced
that companies will no longer be able to incorporate in Ireland without also being tax resident
there, a measure intended to counter arrangements similar to the Double Irish. Michael
Noonan, Ireland's finance minister, recently told the Irish Parliament, "I am abolishing the
ability of companies to use the 'double Irish' by changing our residency rules to require all
companies registered in Ireland to also be tax resident." (NYT 14 Oct 2014) These changes
came into effect from January 2015. However, there is an extended “grandfathering” or
phase-out period for existing schemes that will continue until 2021, allowing corporations
exploiting this loophole to re-arrange their tax avoidance strategies. Variations of this
scheme already exist elsewhere such as the Swiss-Luxembourg Sandwich.
In response to the increased scrutiny of companies and their relationships with known tax
havens, companies such as Google, Oracle and FedEx have begun declaring fewer of their
ongoing offshore subsidiaries in their public financial filings. This reduces the visibility of
these companies using entities in known tax havens, and the visibility of tax havens in
general. The negative effects on a company’s reputation from being associated with tax
aggressive behaviours, leads companies to limit their disclosures and become less
transparent. This suggests that companies are highly sensitive to the reputational damage
caused by these behaviours being exposed to the general public.
The Double Irish with Dutch Sandwich strategy is used by multinational corporations to
move profits out of Australia. The amount of profit diverted is difficult to estimate, and
schemes like this are also difficult to legislate against. An Australian retailer basically pays
tax on the difference between the amount it sells its products for and the cost of those
products. Apple is able to load intellectual property rights charges into the cost of its
products so that there is very little profit. It is difficult to put a realistic price on those
intellectual property rights in order to ascertain a non-contrived cost base for its products as
that information is not publicly available. Likewise, with an Australian service provider that
pays tax on the difference between the revenues it derives from selling its services and the
deductions, such as wages and salaries that are allowable against that revenue. Companies
like Google or Uber book their revenues directly in a low tax jurisdiction. The only revenues
returned to Australia are to cover the costs of marketing and analysis carried out here, with
12
those costs fully deductible against that revenue. Both these situations leave very little profit
in Australia subject to company tax.
A necessary requirement of the Double Irish with Dutch Sandwich scheme is usually some
exclusive intellectual property rights or other intangible assets. These assets are mainly the
domain of technology and pharmaceutical firms. Resources and energy companies have only
fixed or tangible assets and therefore must look other mechanisms, such as thin capitalisation
or debt loading, to reduce their tax liabilities.
2.3 Debt Loading and Thin Capitalisation
For most intentions and purposes, the terms “debt loading” and “thin capitalisation” have the
same meaning. Thin capitalisation is a technical term used in tax legislation and in some
accounting research, whereas debt loading is a more general term used in the media and in
business circles. This report will use the term “debt loading” in keeping with general usage.
However, the terms can be used interchangeably.
Debt loading refers to a strategy by the firm to finance business operations and capital
structure primarily with debt capital rather than equity capital (Richardson et al. 1998; Taylor
& Tower 2009; Taylor, Tower, & Van der Zahn 2010). A company is regarded as employing
debt loading when its capital is made up of a much greater proportion of debt than equity, i.e.
its gearing, or leverage, is too high, for the life-cycle stage of the business or industry. This
excessive use of debt finance compared to equity finance creates “debt loaded” or “thinly
capitalized” structures in subsidiaries located in higher tax jurisdictions. This constitutes an
important international corporate tax avoidance technique used by multinational firms
(Shackelford & Shevlin 2001; Shackelford, Slemrod, & Sallee 2007; Taylor & Richardson
2013). These activities are consistent with the legal definition of “sole and dominant
purpose.” Due to the effects of the dividend imputation system in Australia, the incentive to
use thin capitalisation by public companies is reduced. However, private companies and
foreign subsidiaries operating in Australia are not affected in the same way by these
incentives.
Debt loading is perceived to create problems for two classes of people:
• Creditors bear the solvency risk of the company, which has to repay the bulk of its
capital with interest; and
13
• Revenue authorities, who are concerned about abuse through excessive interest
deductions reducing taxable income.
The corporate laws in some countries actually allow for companies to be thinly capitalised, or
loaded with debt. However, the revenue authorities in those countries will often limit the
amount of interest that a company can claim as a tax deduction, particularly when it receives
loans at non-commercial rates (e.g. from associated or connected parties). However, some
countries simply disallow interest deductions above a certain level, from all sources, when
the company is considered to be too highly geared under applicable tax regulations.
Some tax authorities limit the applicability of thin capitalisation rules to corporate groups
with foreign entities to avoid “tax leakage” to other jurisdictions. The U.S. “earnings
stripping” rules are an example. Hong Kong goes even further to protect tax revenues by
prohibiting payers from claiming tax deductions for any interest paid to foreign entities, thus
eliminating the possibility of firms using thin capitalisation to shift income to a lower-tax
jurisdiction. Thin capitalisation rules determine the amount of interest paid on corporate debt
that is allowable as a deduction for tax purposes. Such rules are of strong interest to private-
equity firms, which use significant amounts of debt to finance leveraged buyouts.
The rules for thin capitalisation in Australia are found in Division 820 of the ITAA 97. They
attempt to put a limit on the amount of interest a company can claim in deductions on its tax.
The rules do not apply to companies that operate on a purely domestic basis. The rules use
the arm’s length principle to set rates of interest that can be claimed between related entities.
However, in a recent case involving Chevron and the ATO, a company merger and
restructure reduced the paid up capital of Chevron Australia Pty Ltd from over $3 billion to
only $29 million with the shortfall made up by $US2.5 billion loan from another Chevron
subsidiary. Central to the proceedings is a credit facility agreement between Chevron
Australia and Chevron Texaco Funding Corporation under which it was agreed to make
advances through a Credit Facility Agreement in aggregate of $2.5billion. Interestingly, the
agreement did not breach the thin capitalisation rules nor any other anti-avoidance provisions
of Part IVA of the Income Tax Assessment Act 1936 (ITAA). The critical issue related to the
contravention of other provisions of the ITAA, specifically those introduced in theTax Laws
Amendment (Cross-Border Transfer Pricing) Act (No. 1) in 2012. The argument brought
forward by the Australian Tax Office (ATO) was that the agreement was not at arm’s length,
as defined in ITAA section 136AD (3) (c) where a related party transaction is made between
14
two companies and the acquisition amount exceeds a commercial amount. In addition, it was
in contravention of the international agreement cross-border transfer pricing rules (as set out
in the Cross-Border Transfer Pricing Act). Accordingly, the agreement contravened the
transfer pricing rules in Australia’s double tax agreements with the U.S.
A similar change to a company’s capital structure has occurred with the U.K-based William
Hill bookmaker in its acquisition of Sportingbet and Tom Waterhouse (West 2014). The new
entity has had its capital reduced and replaced with debt from a Gibraltar-based subsidiary.
As changes in capital structure are common in mergers and takeovers, it is difficult for the
ATO to mount a case against such activities using the current rules.
Large, multinational resource and energy firms operate in many jurisdictions, including
Australia. The Australian operations are usually wholly-owned subsidiaries of their parent
company, and therefore are only required to make minimal disclosures of these operations.
This allows these corporations to arrange their finances in such a manner as to reduce their
tax liabilities in Australia without any public scrutiny.
3. Analysis of Effective Tax Rates of Foreign Multinationals Operating in Australia
Sample Selection
A sample of 100 large, private firms was selected from a database of companies reported by
the ATO in December 2015. These firms operate in the technology, electronics and media
industries, the pharmaceuticals and healthcare sectors, and the energy sector. Most of the
firms are wholly-owned subsidiaries of foreign corporations plus a few large private
companies. The latest financial reports for these companies were acquired from ASIC7 in
March 2016, and relevant data required to analyse the tax aggressiveness of these companies
for their last two years was hand collected from the reports. The data for each firm was
averaged over the two year period to provide a clearer picture of any tax reducing
mechanisms and to reduce the volatility that can exist in single period results. The sample
contained 24 companies that made an overall loss for the two years. Therefore, the sample
was divided into profit firms, who netted an overall profit across the two years, and loss firms
who reported an overall loss. The main reason that the loss firms were eliminated from the
7AustralianSecuritiesandInvestmentCommission.
15
analysis is that the incentives involved in loss creation move in the opposite direction to
profit-shifting in profitable firms, and therefore, could potentially corrupt the results. The
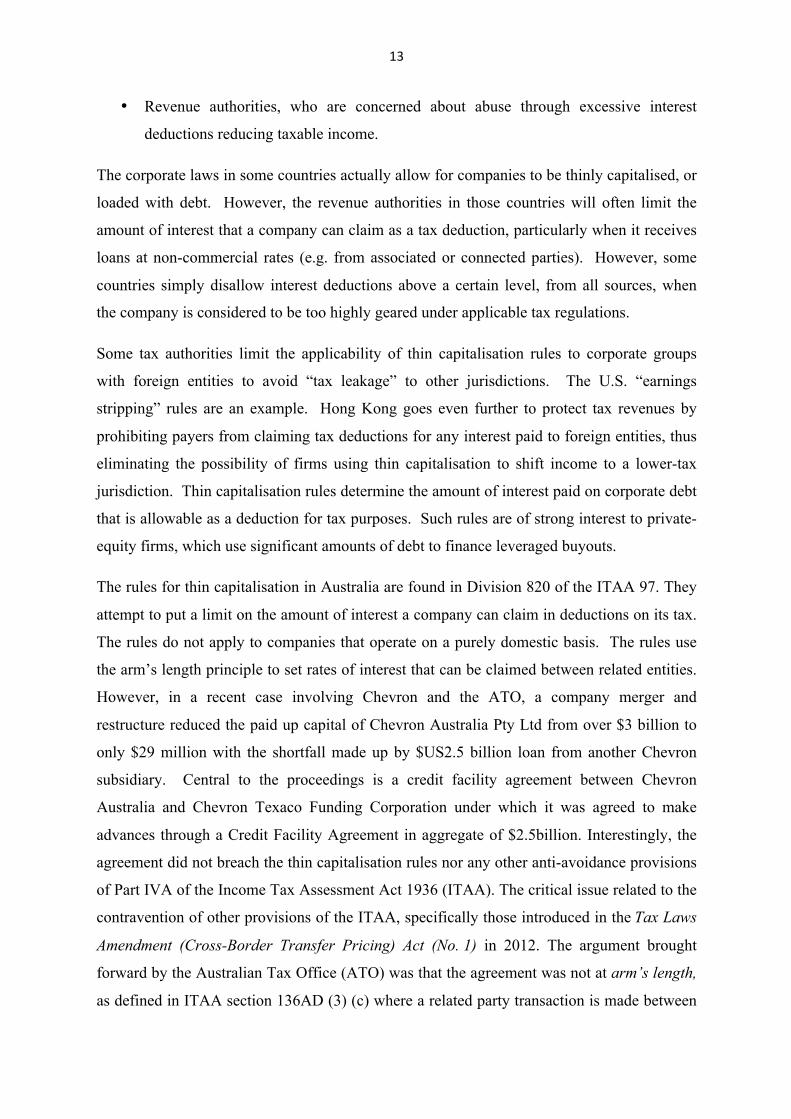
sample was divided into three basic industry groupings that are loosely aligned with different
tax planning methods. Initially, there were 62 technology, electronics and media companies;
15 pharmaceutical and healthcare companies; and 23 energy firms included in the sample.
However, this was reduced down to 48, 13 and 15 respectively when the loss firms were
eliminated. The summary of the data selection process is in Table 1.
Table 1: Sample Selection - Selected Private Australian Companies – 2013 & 2014
Technology,Electronics&Media
Pharmaceuticals&Health
Energy Total
AllFirms 62 15 23 100
LossFirms 14 2 8 24
ProfitFirms 48 13 15 76
Data source: ASIC 'Copy of financial statements and report', Form 388
Descriptive Statistics
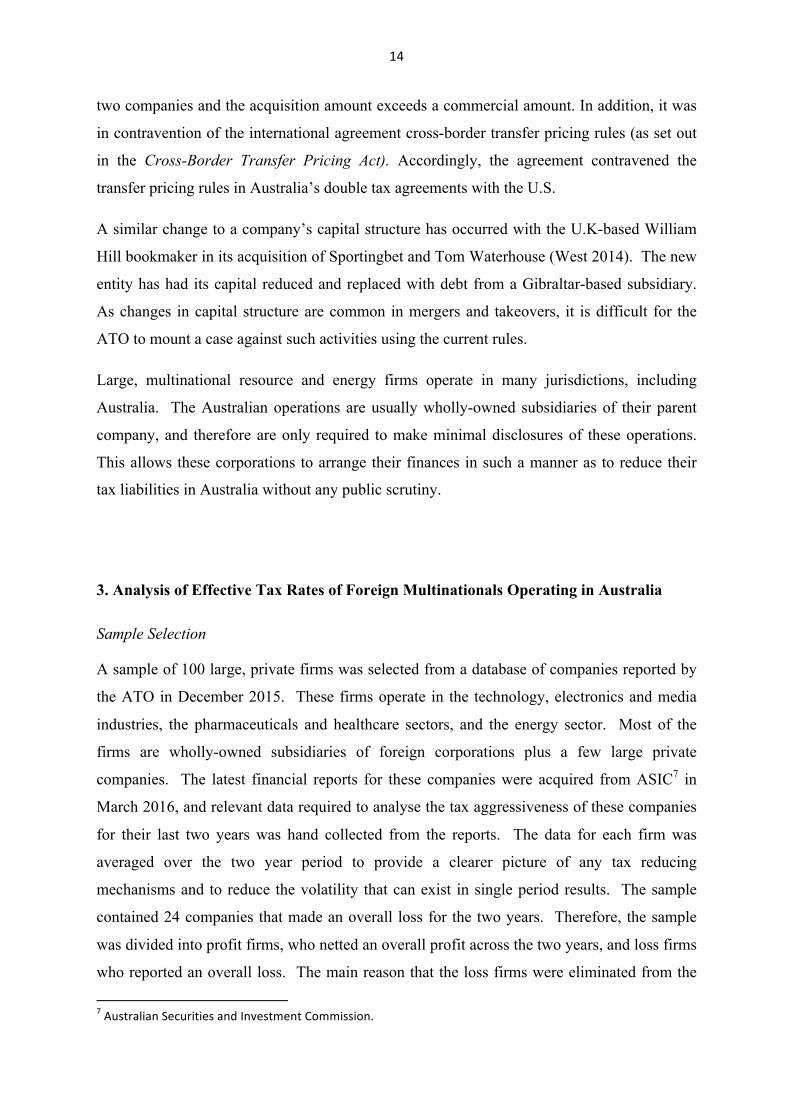
Over the two-year period, profit firms reported total net profits before tax of almost $11.7
billion. On these profits, they incurred a total tax liability of over $1.89 billion and they
claim to have paid cash of over $4.17 billion in taxes. The average profit firm reported an
annual profit of $76 million, whereas, firms reporting losses made an average loss of
approximately $128 million per year. This provides some initial evidence that firms may be
engaging in loss creation. The largest profit in a single year was $1.49 billion by Japan
Australia LNG (MIMI) Pty Ltd, who explore and produce gas and oil on the North-West
Shelf, in 2013. The largest single loss was reported by coal miner, Peabody Australia Holdco
Pty Ltd of over $1.2 billion in 2014. Over the two years, eighty per cent of profit firms
incurred a net tax expense as opposed to a tax benefit and 76% paid taxes rather receiving a
net refund. While some loss firms did pay taxes and report a tax expense, profit firms were
five times more likely to pay taxes and ten times more likely to report a tax expense against
their profits.
The descriptive statistics are shown in Table 2. Panel A shows the total amount over the two-
year period. Panel B displays the average annual amount for each firm.
16
Table 2: Descriptive Statistics - Selected Private Australian Companies - 2013 & 2014
Panel A: Total amounts for the two year period
No. AccountingNetProfitbeforeTax
TaxExpense CashTaxPaid
$'000 $'000 $'000
Technology,Electronics&Media 48 2,913,864 -220,139 -294,997
Pharmaceuticals&Health 13 573,848 -32,623 -157,309
Energy 15 8,182,994 -1,638,758 -3,720,958
AllProfitFirms 76 11,670,706 -1,891,520 -4,173,264
Panel B: Average annual amount for each firm
No. AccountingNetProfitbeforeTax
TaxExpense CashTaxPaid
$'000 $'000 $'000
Technology,Electronics&Media 48 30,353 -2,293 -3,073
Pharmaceuticals&Health 13 22,071 -1,255 -6,050
Energy 15 272,766 -54,625 -124,032
AllProfitFirms 76 76,781 -12,444 -27,456
Data source: ASIC 'Copy of financial statements and report', Form 388
Methodology
Measuring tax aggressiveness in business research has always been problematic as it is not
directly observable due to the private nature of tax returns and other submissions to the tax
authorities. Accounting research has traditionally employed proxy measures of tax
aggressiveness obtained from data in the financial statements. The main proxies used in
recent research are the effective tax rates (ETR’s) and book-tax gaps (BTG’s). These proxies
capture the tax burden facing companies and are useful for the comparative ranking firms,
based on their level of tax aggressiveness. The most popular effective tax rates are the cash
effective tax rates, which utilise cash taxes paid, rather than the tax expense. However, using
these measures in this analysis is problematic due to inconsistencies in the reporting of cash
taxes paid in the financial statements of some companies. Some companies, particularly the
energy firms have included other taxes, such as the Resources, Rent Tax and Royalty
payments, in taxes paid thereby inflating the figures. Therefore, this analysis will rely on the
17
GAAP8 effective tax rate and the book-tax gap to examine these companies and to estimate
the amount of taxes avoided.
The GAAP effective tax rate can be split into current tax payable and deferred tax liability.
While most of the deferred tax liability will at some stage reverse and become current tax
payable some of it can be deferred almost indefinitely. In such cases, the tax expense may
not accurately represent the correct level of taxes incurred on corporate profits. GAAP
ETR’s can also be distorted by the estimates used to calculate accruals. These estimates may
be unreliable and many accruals are disallowed for taxation purposes. However, GAAP
ETR’s capture the reporting behaviour of firms which is the main focus of this analysis. The
formula used to estimate this measure is:
GAAP ETR = Tax Expense / Accounting Net Profit before Tax
Book-tax gaps are useful for estimating the amount of taxes that are avoided. Like the
ETR’s, these measures can use either cash taxes paid or the GAAP tax expense. The book-
tax gap measures the difference between the amount of tax that was paid and the amount that
would have been paid if the statutory tax rate was applied to reported profits. It provides a
measure of the magnitude of the economic loss caused by tax aggressive behaviours. The
GAAP BTG grosses up the tax expense by the statutory tax rate and deducts the pre-tax
profits. The formula used to estimate this measure is:
GAAP BTG = (Tax Expense / STR) - Accounting Net Profit before Tax
When interpreting the results from these measures, a lower ETR represents a higher level of
tax aggressiveness, whereas it is the opposite for the BTG.
Results
The results from the main analysis of tax aggressiveness in large private companies and
multinational subsidiaries operating in Australia are shown in Table 3. Column 1 (GAAP
ETR) displays the results from the GAAP ETR. The average ETR is 16.2%. This is almost
half the statutory tax rate for companies in Australia which is currently 30%. However, it is
worse at the industry level, with an ETR of only 5.7% for the Pharmaceutical and Health
8GenerallyAcceptedAccountingPrinciples
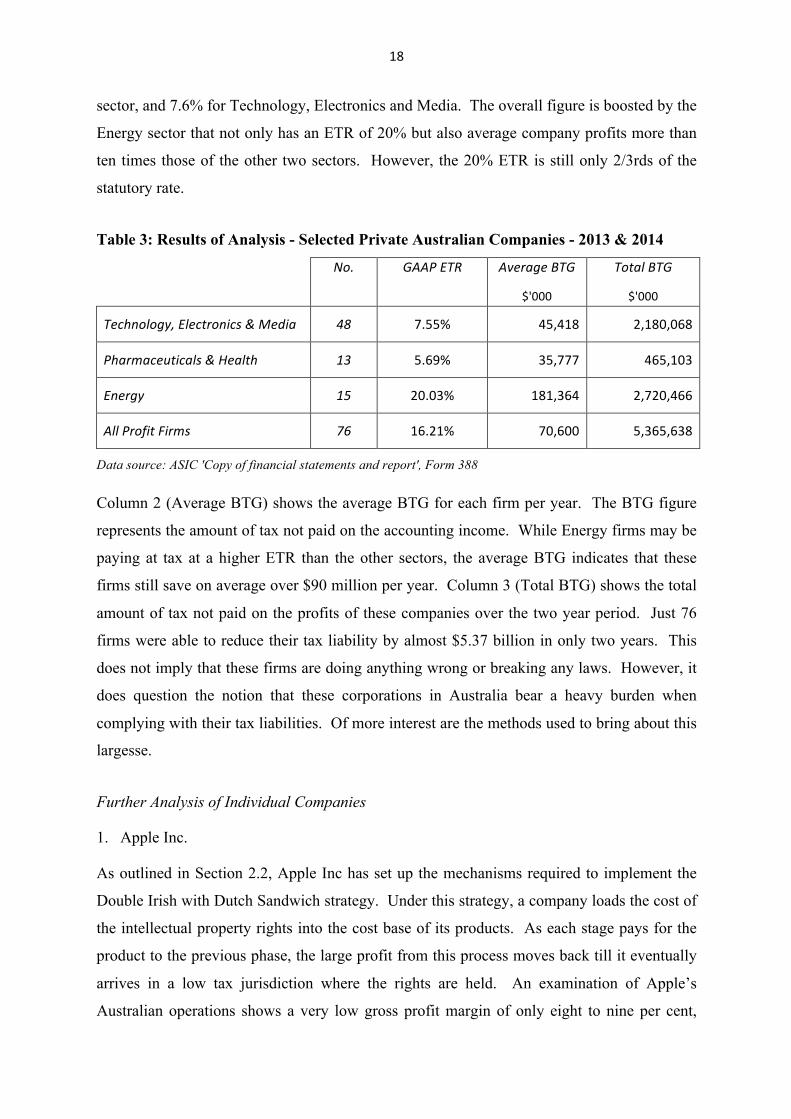
18
sector, and 7.6% for Technology, Electronics and Media. The overall figure is boosted by the
Energy sector that not only has an ETR of 20% but also average company profits more than
ten times those of the other two sectors. However, the 20% ETR is still only 2/3rds of the
statutory rate.
Table 3: Results of Analysis - Selected Private Australian Companies - 2013 & 2014
No. GAAPETR AverageBTG TotalBTG
$'000 $'000
Technology,Electronics&Media 48 7.55% 45,418 2,180,068
Pharmaceuticals&Health 13 5.69% 35,777 465,103
Energy 15 20.03% 181,364 2,720,466
AllProfitFirms 76 16.21% 70,600 5,365,638
Data source: ASIC 'Copy of financial statements and report', Form 388
Column 2 (Average BTG) shows the average BTG for each firm per year. The BTG figure
represents the amount of tax not paid on the accounting income. While Energy firms may be
paying at tax at a higher ETR than the other sectors, the average BTG indicates that these
firms still save on average over $90 million per year. Column 3 (Total BTG) shows the total
amount of tax not paid on the profits of these companies over the two year period. Just 76
firms were able to reduce their tax liability by almost $5.37 billion in only two years. This
does not imply that these firms are doing anything wrong or breaking any laws. However, it
does question the notion that these corporations in Australia bear a heavy burden when
complying with their tax liabilities. Of more interest are the methods used to bring about this
largesse.
Further Analysis of Individual Companies
1. Apple Inc.
As outlined in Section 2.2, Apple Inc has set up the mechanisms required to implement the
Double Irish with Dutch Sandwich strategy. Under this strategy, a company loads the cost of
the intellectual property rights into the cost base of its products. As each stage pays for the
product to the previous phase, the large profit from this process moves back till it eventually
arrives in a low tax jurisdiction where the rights are held. An examination of Apple’s
Australian operations shows a very low gross profit margin of only eight to nine per cent,
19
whereas the margin for the consolidated global group is close to 40% across all their
operations. The net profit margin before tax in Australia is between four and six per cent,
compared to the group margin of around 30%. The cost structure embedded in the price of
Apple’s products in Australia is just sufficient to cover the costs of their operations here.
2. Google Inc
Another company that utilises the Double Irish with Dutch Sandwich scheme is Google Inc.
However, Google does not use the intellectual property rights embedded in its prices of its
products to shift profits as they book revenues directly into low tax jurisdictions. From
examining Google’s financial statements, Google appears to be more generous with the
Australian taxpayers than Apple with net profit margins before tax of around 13%. While
this is still considerably less than the twenty-six to thirty-one per cent margin for the
consolidated global group, it is only on those revenues that are recognised in Australia. Out
of Google’s global revenues in 2014, only 0.54% was booked through Australia. The
Australian economy generates almost 2% of the world’s GDP. For a company so closely
integrated into all aspects of business, it would be expected there would be a closer
correlation between Australia’s share of GDP and our share of Google revenues.
3. Chevron
The Double Irish scheme is mainly used by multinational corporations that possess valuable
intellectual property rights. Therefore, it is not available to companies in other sectors such
as mining and energy firms. However, these firms have large investments and are highly
capital intensive allowing them to take advantage of aspects of the thin capitalisation rules
and undertake debt loading. Chevron is involved in the exploration and production of oil and
gas in Australia including the massive Gorgon natural gas project off North-Western
Australia. Chevron has already had settlements with the ATO over the level of debt, or more
precisely, the amount of interest it wishes to deduct from its revenues. In 2014 Chevron had
an interest expense equal to over 62.5% of its sales revenues and 45% in 2013. It increased
the amount of the interest expense by another two per cent through a process called
accretion9. At the end of the 2014 financial year, Chevron was carrying a debt-to-equity ratio
of over 4:1. Most, if not all of this debt was provided by associated entities. While these
arrangements might not breach the thin capitalisation rules, the conditions of the loans may
9Inaccounting,anaccretionexpenseisanexpenserecognizedwhenupdatingthepresentvalueofabalancesheetliability.Thisiscanbeinresponsetoanticipatedmovesininterestrates,ortheeconomicoutlook.
20
have breached the arm’s length principles. Chevron’s financial statements also revealed very
large amounts of unrecognised tax losses that they have carried forward. These losses can be
used to offset future taxable income.
When companies engage in aggressive tax strategies, footprints and signals can appear in
their financial statements10. In some cases, these signals are the result of a unique but
legitimate set of circumstances. However, that explanation appears to wear very thin when
these signals are widespread and appear throughout the financial statements of the very same
groups of companies that have both the largest incentives to engage in these behaviours, and
the opportunities and means to carry them out. In this context, there is a demand from tax
authorities, governments, other taxpayers and interest groups to address the underlying
mechanism of abusive profit shifting and loss creation. Some solutions have now been
proffered by international forums and institutions.
4. Solutions
In 2009, the G20 finance ministers requested that the OECD assess the issues of multi-
jurisdictional tax avoidance and produce a plan to address them. As a result, the OECD
commenced the BEPS project and produced in a list of fifteen action items that to address
different aspects of multinational corporate tax aggressiveness. The action items were agreed
at the ST Petersburg meeting of the G20 in September 2013. These action items rely on the
co-operation and support of the member nations. The action items are as follows:11
1. Address the tax challenges of the digital economy.
2. Neutralise the effects of hybrid mismatch arrangements.
3. Strengthen Controlled Foreign Company (CFC) rules.
4. Limit base erosion via interest deductions and other financial payments.
5. Counter harmful tax practices more effectively, taking into account transparency
and economic substance.
10Thisisnotalwaysthecase.AttemptstouncoverthestrategiesknowntohavebeenusedbyEnronintheyearsleadinguptoitscrashwereunabletofindanyevidenceinthefinancialstatementsforthatperiod.However,Enronandsomeofitsexecutiveswereengaginginoutrightfraud.11FurtherinformationanddetailsontheBEPSProjectandtheActionItemsisavailablefromOECD(2013).
21
6. Prevent treaty abuse.
7. Prevent the artificial avoidance of Permanent Establishment status.
8. Develop rules to prevent BEPS by moving intangibles among group members.
9. Develop rules to prevent BEPS by transferring risks among, or allocating
excessive capital to, group members.
10. Develop rules to prevent BEPS by engaging in transactions which would not, or
would only very rarely, occur between third parties.
11. Measuring and monitoring of BEPS.
12. Require taxpayers to disclose their aggressive tax planning arrangements.
13. Re-examine transfer pricing documentation.
14. Make dispute resolution mechanisms more effective.
15. Develop a multilateral instrument.
While some of these action items may seem like nothing more than “motherhood” statements,
such as “prevent treaty abuse”, they have at least opened the process required to create
solutions to BEPS. Others items show greater substance and put forward practical solutions
that address some of the underlying issues, such as some of the disclosure and transparency
proposals, and limiting interest deductions and financial payments. Other items drive at the
heart of some avoidance schemes, such as rules to limit the transfer of intangible assets
within groups, but these items will be difficult to implement.
The difficulty in finding solutions to some of these issues has led some countries to begin to
enhance their tax regimes, mostly within the BEPS framework. One such endeavour is the
Diverted Profits Tax, or as it is better known the “Google” tax, given it is specifically
targeted at companies like Google that use the Double Irish with Dutch Sandwich in some
form. In 2015, the U.K. adopted what has become known as the “Google” tax based on
proposals from a number of interest groups and following public outrage at the low tax bill of
many large, multinational corporations operating in the U.K. Other groups, such as the Tax
22
Justice Network and Publish-What-You-Pay, have called for increased disclosures and
transparency in corporate tax affairs.
4.1 ‘Diverted Profits Tax
The U.K.’s Diverted Profits Tax (DPT) (also known as the Google Tax) came into effect on
April 1, 2015. It is aimed at multinational corporations who divert profits from the U.K. by
either arranging their affairs so as to avoid creating a permanent establishment in the U.K.
(BEPS7), or by making payments that lack economic substance, such as some royalty
payments and management fees (BEPS5). The DPT rate itself is set at 25% of any profits
relating to U.K. activity that are diverted. A secondary aim of the DPT is to remove
information bias, allowing the U.K. tax authorities full and timely examination of high-risk
transfer pricing transactions (BEPS13). This provision creates strong financial incentives for
full disclosure and engagement with tax authorities (BEPS12). The tax amendment was
aimed directly at companies such as Google in order to prevent the diversion of revenues
directly to another tax jurisdiction and loading U.K. operations with high levels of
management and other fees. In addition, further anti-avoidance requirements were introduced
in the U.K. with the 2016 Finance Bill with respect to hybrid mismatch arrangements and
royalty payment. There were many distractors of the DPT in the U.K. claiming that it is in
breach EU legislation, tax treaties and that most multinational would challenge its legality
based on those factors. Although, it has only come into force a little more than one year there
have not been any major legal challenges as far as we are aware, but it has had notable
successes already. Most notably Google’s tax deal with HM Revenue and Customs for over
130 million pounds in January this year could be seen as the first success despite the fact that
the deal related to periods prior to 2015. Perhaps the DPT has no direct link to the deal many
commentators agreed that it may have played an indirect role in the settlement.
Although there was some early optimism in late 2014 when the then treasurer Joe Hockey
suggested that Australia may also adopt a U.K. style DPT, most of that optimism disappeared
with the 2015 Budget and in late 2015 when it became obvious that the Tax Laws Amendment
(Combating Multinational Tax Avoidance) Bill 2015 was a mere shadow of the U.K. DPT.
Although it is unclear what happened between late 2014 and the 2015 Budget, as the decision
was made not to introduce a U.K. style DPT, it has been suggested that what may have
spooked the law makers in Australia are the same problems (double taxation treaties, the U.S.
government and potential legal action by multinationals) that were presented prior to the U.K.
23
adopting the DPT. Thus, Australia adopted a less stringent version of the DPT in 2015 budget
with the Multinational Anti-Avoidance Law (MAAL), with further measures included in the
Tax Laws Amendment (Combating Multinational Tax Avoidance) Bill 2015. However, these
measures do not actually represent a new tax and the 2015 Budget provided no estimate of
associated revenue gains, with many speculating at the time that any gains would be marginal
if any at all. Further, MAAL only applies to “significant global entities” with global
revenues of over $1 billion, with a presence in a low tax or secrecy jurisdiction. Like the
U.K. version, the legislation focuses on corporate attempts to avoid creating a permanent
establishment in Australia (BEPS7). It is based on whether the “principal purpose” of the
structures is to avoid Australian or foreign taxes as per ITAA36 Part IVA. The legislation is
accompanied by compulsory disclosure by a company y of their country-by-country tax
affairs. However, the disclosure is confidential to the ATO only. This allows companies to
avoid public scrutiny of their tax avoidance strategies. While there is a significant increase in
the penalties for a breach of these laws, the measures are not back-dated and allow existing
schemes to continue.
There is criticism that the legislation seeks to claim unlimited taxing rights over “stateless”
income. However, the legislation only seeks to tax those profits that would have been
attributed to a foreign entity’s Australian permanent establishment had the artificial structures
and diversion of sales revenue not occurred. The Australian Treasurer, Joe Hockey, defended
the limited nature of the Australian legislation compared to the U.K. on the grounds that
further restrictions would breach existing tax treaties. Thus, the recommendation to combat
all forms of the Double Irish with Dutch Sandwich is to introduce a U.K. style DPT in
Australia.
4.2 Debt Loading Solutions
Limiting base erosion via interest deductions and other financial payments is a key target of
BEPS. Australia already has relatively strict thin capitalisation provisions, which limit the
gearing levels of foreign owned companies and the allowable level of interest deductions
given a company’s level of debt. Despite that, the Chevron case has shown that private
companies which are, in particular, wholly owned subsidiaries of large multinational energy
companies can still avoid hundreds of million in tax using interest deductions. One option is
to restrict, or even eliminate, interest expense deductions on related party borrowings. That is,
24
to prevent the wholly owned subsidiaries of multinational corporations claiming a deduction
for interest on their borrowing from other subsidiaries12 within the group. Hong Kong has
adopted this approach to prevent debt loading abuse. This is essentially what Chevron was
able to achieve and what other energy companies also have an opportunity to exploit.
Additional measures may include providing the ATO with further resources to audit all
energy multinationals operating in Australia.
4.3 Greater Transparency
Require taxpayers to disclose their aggressive tax planning arrangements is also an important
target of BEPS. However, the disclosure requirements related to private companies' in
Australia is in many respects is the equivalent of the Wild West. Many do not produce
general purpose financial statements and the few that do not comply will many important
Australian accounting standards as per the analysis of the 100 companies analysed in this
report. Thus despite having a presence in Australia which is as big and significant as the most
well know public companies, the amount of useful information disclosed is negligible and
very difficult to interpret. In fact, some of the financial reports analysed were not legible and
thus non-compliant which raises questions as to whether ASIC even looks at what the private
companies submit. However recent research by Dyreng et al. (2016) indicates that public
scrutiny can sufficiently change the costs and benefits of tax avoidance such that tax expense
increased for scrutinized firms. Therefore, public pressure from outside activist groups can
exert a significant influence on the behaviour of firms. The key point is that in order to
increase scrutiny the public requires quality financial information, which simply is not
currently supplied by large private companies in Australia, and may in turn explain their high
levels of tax aggressiveness. This issue is also known to the Australian Accounting Standards
Board, which we hope will revisit the concept of the ‘reporting entity’ in the conceptual
framework and the AASB 1053 standard on the Application of Tiers of Australian
Accounting Standards. The solution is rather simple. It would require a small change in the
accounting standards that made it compulsory for at least all large private companies to apply
all Australian accounting standards without any exception. One immediate benefit is that the
public will have access to related party transactions and executive remuneration data of these
private companies. This is but one example of information which will enable the public to
12ThelendingsubsidiaryisusuallynotlocatedinAustralia.
25
have a better understanding and scrutiny of the tax affairs of private companies. Additionally,
the ATO could go further than the BEPS recommendations of providing country-by-country
tax reporting to tax authorities, by requiring all companies to disclose that information to the
public.
In the U.K. the Finance Bill 2016 includes provisions requiring large groups, companies,
partnerships and UK PEs of foreign entities to publish an annual tax strategy in relation to
UK taxation, which has to be disclosed to the public on the Internet. Non-compliance carries
significant penalties. Furthermore, certain European companies, such as banks, have to now
disclose country-by-country tax information to the public. Unfortunately, Australia lacks far
behind with respect to any similar initiatives. The recent disclosures from the Panama Papers
once again draw attention to the links between transparency, corruption and tax avoidance.
5. Conclusion
The BEPS project and the G20 meetings over the past 4 years have provided an excellent
framework with very specific and achievable recommendations related to decreasing base
erosion, profit shifting and loss creation. Some of the recommendation have been adopted by
certain countries, albeit at a different pace and with distinct priorities. Although this is a good
start base erosion, profit shifting and loss creation continue unabated, especially by
multinational firms using the Double Irish with Dutch Sandwich and interest rate deductions.
The analysis here of Australia’s top private companies or subsidiaries owned by foreign
multinationals that have significant activities in this country indicates that the potential tax
avoidance is economically significant (in the billions of dollars). Thus, immediate action is
necessary to reduce the avoidance and if such action is proper could net the government
billions of dollars in additional corporate tax revenue in the coming years and beyond, which
will in turn reduce the burden on individual tax payers. The solutions include, introducing a
U.K. style DPT, limiting the deductibility of interest from related party debt/loans and
significantly increasing the transparency of financial and tax information disclosed by large
private companies in particular in order to increase the public scrutiny of their tax affairs.
Other countries have already adopted these measures, which is a first necessary step in
defeating BEPS and loss creation. No doubt Australia can do the same if the government is
serious about reducing corporate tax avoidance.
26
6. References
Astin, H. and Wilkins, G. 2014, ‘ASX200 company tax avoidance bleeds Commonwealth coffers of billions a year, report finds’, The Age, 30 September 2014, accessed at, http://www.theage.com.au/action/printArticle?id=61543983, on 16 December 2014.
Arya, A., Glover, J. and Sunder, S. 1998, ‘Earnings management and the revelation principle’, Review of Accounting Studies, 3(1-2), pp.7-34.
Borek, C.T, Frattarelli, A. and Hart, O. 2014, Tax Shelters or Efficient Tax Planning? A Theory of The Firm Perspective On the Economic Substance Doctrine, Harvard University Law School, Working Paper, April 2013 (revised May 2014).
Chen, K-P. and Chu, C.Y.C. 2005, Internal control versus external manipulation: a model of corporate income tax evasion’, The RAND Journal of Economics, Vol. 36, No. 1, PP. 151-164.
Chi, S.S., Pincus, M. and Teoh, S.H. 2014, ‘Mispricing of Book-Tax Differences and the Trading Behavior of Short Sellers and Insiders’, The Accounting Review, Vol. 89, No. 2, pp. 511-543.
Chyz, J.A. 2013, ‘Personally tax aggressive executives and corporate tax sheltering’, Journal of Accounting and Economics, Vol. 56, pp. 311–328.
Crocker, K.J. and Slemrod, J. 2005, ‘Corporate tax evasion with agency costs’, Journal of Public Economics, Vol. 89, pp. 1593–1610.
Desai, M. A. 2003, ‘The Divergence between Book Income and Tax Income’, in Poterba, J.M., Ed., Tax Policy and the Economy, Volume 17, MIT Press, Cambridge MA.
Desai, M.A. and Dharmapala, D. 2009, ‘Corporate Tax Avoidance and Firm Value’, The Review of Economics and Statistics, Vol. 91, No. 3, pp. 537–546.
Dyreng, S.D., Hoopes, J.L. and Wilde, J.H. 2016, ‘Public pressure and corporate tax behavior’, Journal of Accounting Research, 1 January 2016.
Gallemore, J., Maydew, E.L. and Thornock, J.R. 2014, ‘The Reputational Costs of Tax Avoidance’, Contemporary Accounting Research, Vol. 31, No. 4, pp. 1103-1133.
Gergen, M.P. 2002, ‘The Logic of Deterrence: Corporate Tax Shelters’, 55 Tax L. Rev. 255 2001-2002.
Govendir, B., Lanis, L., McClure, R. and Wells, P.A. 2016 The Effect of Dividend Imputation on Corporate Tax Aggressiveness, Working Paper, University of Technology Sydney, dated 1 April 2016.
27
Hanlon, M. and Heitzman, S. 2010, ‘A review of tax research’, Journal of Accounting and Economics, Vol. 50, pp. 127-178.
Hanlon, M. and Slemrod, J. 2009,’ What does tax aggressiveness signal? Evidence from stock price reactions to news about tax shelter involvement’, Journal of Public Economics, Vol. 93, Iss. 1–2, pp. 126–141.
Inger, K.K. 2014, ‘Relative Valuation of Alternative Methods of Tax Avoidance’, The Journal of the American Taxation Association, Vol. 36, No. 1, pp. 27-55.
Lisowsky, P., Robinson, L. and Schmidt, A. 2013, ‘Do Publicly Disclosed Tax Reserves Tell Us About Privately Disclosed Tax Shelter Activity?’, Journal of Accounting Research, Vol. 51, No. 3, pp. 583-629.
McGuire, S.T., Omer, T.C. and Wilde, J.H. 2014, ‘Investment Opportunity Sets, Operating Uncertainty, and Capital Market Pressure: Determinants of Investments in Tax Shelter Activities?’, The Journal of the American Taxation Association, Vol. 36, No. 1, pp. 1-26.
Murphy, K.J., and Zimmerman, J.L. 1993, ‘Financial performance surrounding CEO turnover’, Journal of Accounting and Economics, Vol. 16, No’s 1-3, pp. 273-315.
OECD 2013, Action Plan on Base Erosion and Profit Shifting, OECD Publishing, http://dx.doi.org/10.1787/9789264202719-en
OECD 2015, Explanatory Statement, OECD/G20 Base Erosion and Profit Shifting Project, OECD.www.oecd.org/tax/beps-explanatory-statement-2015.pdf
Richardson, G., Taylor, G. and Lanis, R., 2013 ‘Determinants of transfer pricing aggressiveness: Empirical evidence from Australian firms’, Journal of Contemporary Accounting & Economics, Vol. 9, pp. 136–150.
Saavedra, D. 2013, Analysis of Unsuccessful Tax Avoiders, Working Paper, Massachusetts Institute of Technology, Dec 2013.
Shackelford, D.A., and Shevlin, T. 2001, ‘Empirical tax research in accounting’, Journal of Accounting and Economics, Vol. 31, No. 1, pp. 321-387.
Shackelford, D.A., Slemrod, J. and Sallee, J.M. 2007, A unifying model of how the tax system and generally accepted accounting principles affect corporate behavior, (No. w12873). National Bureau of Economic Research.
Taylor, G. and Richardson, G. 2013, ‘The determinants of thinly capitalized tax avoidance structures: Evidence from Australian firms’, Journal of International Accounting, Auditing and Taxation, Vol. 22, pp. 12– 25.

28
Weisbach, D.A. 2002, ‘Ten Truths About Tax Shelters’, 55 Tax L. Rev. 215
West, M. 2014, ‘Bookmakers’ books seem to add up under the odds’, Sydney Morning Herald, 22 September 2014, accessed at, http://www.smh.com.au/business/comment-and-analysis/bookmakers-books-seem-to-add-up-under-the-odds-20140921-10k0f1.html, on 8 April 2016
Wilson, R. 2009, ‘An Examination of Corporate Tax Shelter Participants’, The Accounting Review, Vol. 84, No.3, pp. 969-999.
29
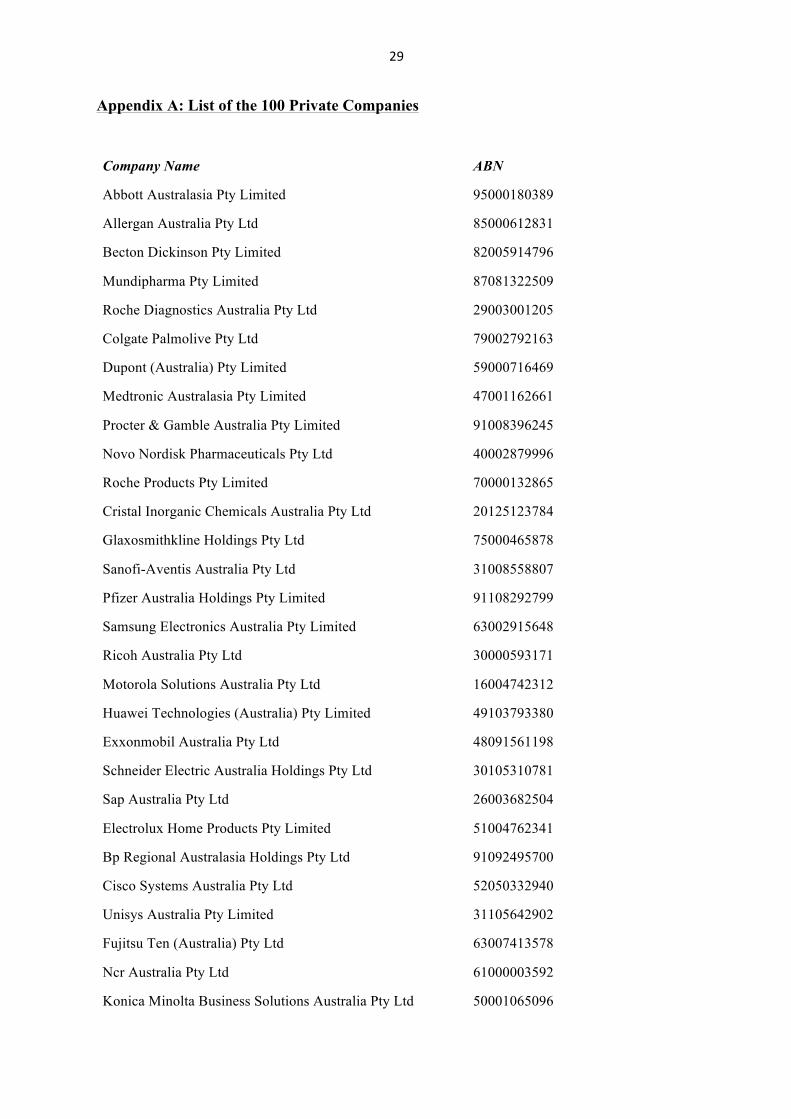
Appendix A: List of the 100 Private Companies
Company Name ABN
Abbott Australasia Pty Limited 95000180389
Allergan Australia Pty Ltd 85000612831
Becton Dickinson Pty Limited 82005914796
Mundipharma Pty Limited 87081322509
Roche Diagnostics Australia Pty Ltd 29003001205
Colgate Palmolive Pty Ltd 79002792163
Dupont (Australia) Pty Limited 59000716469
Medtronic Australasia Pty Limited 47001162661
Procter & Gamble Australia Pty Limited 91008396245
Novo Nordisk Pharmaceuticals Pty Ltd 40002879996
Roche Products Pty Limited 70000132865
Cristal Inorganic Chemicals Australia Pty Ltd 20125123784
Glaxosmithkline Holdings Pty Ltd 75000465878
Sanofi-Aventis Australia Pty Ltd 31008558807
Pfizer Australia Holdings Pty Limited 91108292799
Samsung Electronics Australia Pty Limited 63002915648
Ricoh Australia Pty Ltd 30000593171
Motorola Solutions Australia Pty Ltd 16004742312
Huawei Technologies (Australia) Pty Limited 49103793380
Exxonmobil Australia Pty Ltd 48091561198
Schneider Electric Australia Holdings Pty Ltd 30105310781
Sap Australia Pty Ltd 26003682504
Electrolux Home Products Pty Limited 51004762341
Bp Regional Australasia Holdings Pty Ltd 91092495700
Cisco Systems Australia Pty Ltd 52050332940
Unisys Australia Pty Limited 31105642902
Fujitsu Ten (Australia) Pty Ltd 63007413578
Ncr Australia Pty Ltd 61000003592
Konica Minolta Business Solutions Australia Pty Ltd 50001065096
30
Netapp Australia Pty Ltd 14092499431
Concophillips Australia Gas Holdings Pty Ltd 69081089170
Microsoft Pty Ltd 29002589460
Epson Australia Pty Limited 91002625783
Apple Pty Ltd 46002510054
Amadeus It Pacific Pty Ltd 22080674255
At&T Global Network Services Australia Pty Limited 72087916701
Access Prepaid Australia Pty Ltd 47145452044
Electronics Boutique Australia Pty Ltd 50077681442
Transalta Energy (Australia) Pty Ltd 40062135844
Csc Computer Sciences Australia Holdings Pty Limited 33120570390
Japan Australia Lng (Mimi) Pty Ltd 18006303180
Dell Australia Pty Limited 46003855561
Datacom Australia Holdings Pty Limited 45094235373
Toshiba (Australia) Pty Limited 19001320421
Yahoo! Australia & Nz (Holdings) Pty Limited 54117505450
Origin Energy Uranquinty Power Pty Ltd 26120384938
Lockheed Martin Australia Pty Limited 30008425509
Panasonic Australia Pty Limited 83001592187
Brother International (Australia) Pty Limited 17001393835
Honeywell Holdings Pty Ltd 18000383764
Saab Technologies Australia Pty Ltd 47002950790
Airbus Group Australia Pacific Holdings Pty Limited 75003066788
Lg Electronics Australia Pty Limited 98064531264
Sas Institute Australia Pty Limited 13002287247
Activision Blizzard Pty Limited 90054096883
Google Australia Pty Limited 33102417032
Hawker Pacific Pty Ltd 94001540316
Freedom Energy Holdings Pty Ltd 24093243844
G4s Australia Holdings Pty Ltd 68128783602
Click Energy Group Holdings Pty Ltd 31160484837
Vodafone Hutchison Australia Pty Ltd 76096304620
31
Acer Computer Australia Pty Limited 78003872768
Puma Energy (Australia) Holdings Pty Ltd 26147978890
Amaysim Australia Pty Ltd 65143613478
Boeing Australia Holdings Pty Ltd 42101168932
Tokyo Gas Australia Pty Ltd 46102349557
Saxon Energy Services Australia Pty Ltd 91137534993
International Power (Australia) Holdings Pty Ltd 70105041209
Technip Oceania Pty Ltd 43062878719
Energy Infrastructure Investments Pty Ltd 95104348852
Verizon Australia Pty Limited 62081001194
Foxteq Australia Pty Limited 38114305494
Nikon Australia Pty Ltd 34121761537
Enerflex Energy Systems (Australia) Pty Ltd 74140790610
Symantec Australia Holding Pty Ltd 43003967333
Foxtel Cable Television Pty Limited 45069008797
Ge Oil & Gas Australia Pty Ltd 65009080951
Nokia Solutions And Networks Australia Pty Ltd 74122172365
Cnooc Gas And Power Aus Investment Pty 28142591044
Kogas Australia Pty Ltd 42130065682
Nec Australia Pty Ltd 86001217527
Glencore Australia Investment Holdings Pty Ltd 74154042636
Hewlett Packard South Pacific Pty Ltd 94121554489
Glencore Investment Pty Limited 67076513034
Peabody Australia Holdco Pty Ltd 61154820130
Warner Bros. Entertainment Australia Pty Limited 70003773411
Citrix Systems Asia Pacific Pty Ltd 37078874530
Myob Group Pty Limited 61153094958
Agilent Technologies Australia Pty Ltd 29088510605
Sumitomo Australia Pty Ltd 81000371497
Lenovo (Australia & New Zealand) Pty Limited 70112394411
Lexmark International (Australia) Pty Limited 86050148466
Axia Energy Australia Pty Limited 75108275216

32
Ge Energy Holdings Australia Pty Ltd 37086855076
Nokia Australia Pty Limited 39007366949
Fujifilm Holdings Australasia Pty Limited 58008443892
Ibm A/Nz Holdings Pty Limited 12105319248
Fuji Xerox Australia Pty. Ltd 63000341819
News Australia Holdings Pty Limited 32105197028
Toshiba International Corporation Pty Ltd 29001555068