Embed Size (px)
Citation preview
Institutions and Economies
Vol. 8, No. 3, July 2016, pp. 61-83
Corporate Tax Avoidance and
Performance: Evidence from China’s
Listed Companies
Zhang Chena, Cheong Kee Cheokb, Rajah Rasiahc
Abstract: This paper examines the impact of corporate tax avoidance on firms’ financial
performance. China is the country of focus because of its unique reform experience. The
results using structural equation modeling (SEM) show that there is a significant
negative direct relationship between tax avoidance and market value. It indicates that
the opaque nature of China’s stock market creates ‘opportunities’ for managers using
tax avoidance as an instrument to engage in rent seeking activities, which hurt
shareholders’ value. However, this study also finds significant positive indirect
relationships between tax avoidance and market value as it has stimulated firms’ growth
and increase in profitability as the additional after-tax cash arising from tax avoidance
has helped expand the firm’s market value. The results imply that tax avoidance can be a
value-adding activity but for firms to appropriate its advantages, there is a need to
strengthen internal supervision and management capability. Additionally, the State
Administration of Taxation of China should enhance the legal provisions to prevent
managerial rent extraction.
Keywords: Growth, market value, profitability, structural equation model, tax avoidance
JEL classification: G30, G32, H26, O53
Article received: 1 December 2015; Article Accepted: 14 June 2016
1. Introduction
To the extent that taxation impacts firms’ performance, the textbook
argument that tax imposes a burden on firms has been subject to extensive
research. Thus, tax planning to reduce this burden through tax avoidance is
expected to have a significant impact on firms. Following Dyreng, Hanlon,
and Maydew (2008) and Hanlon and Heitzman (2010), tax avoidance can
a Corresponding author. Institute of Graduate Studies (IGS), University of Malaya, 50603 Kuala
Lumpur, Malaysia. Email: [email protected] b Department of Economics, Faculty of Economics and Administration, University of Malaya,
50603 Kuala Lumpur, Malaysia. Email: [email protected] c Department of Development Studies, Faculty of Economics and Administration, University of
Malaya, 50603 Kuala Lumpur, Malaysia. Email: [email protected]
62 Zhang Chen, Cheong Kee Cheok, Rajah Rasiah
be defined as any activity that can explicitly reduce a firm’s tax burden,
reflected in its effective tax rate, and covers tax reductions that are fully
legal and those that occupy a grey area (Dyreng, et al., 2008).
If successfully deployed, a tax avoidance strategy would transfer wealth
from the state or government to shareholders. Therefore, it should result in
relatively low taxes payable (that is, low ETRs), and higher after-tax cash
flows, which will show up in analysts’ financial reports and ultimately,
stock prices. According to Swenson (1999), the stock market perceives
low-tax paying firms that pay lower taxes as being better at controlling
costs. However, empirical evidence on tax avoidance shows the opposite is
the case. The conflicts of interest between managers and shareholders
(Chen & Chu, 2005; Crocker & Slemrod, 2005) create opportunities for
managerial diversions which discount the value of firms (Desai &
Dharmapala, 2006, 2009).
Further, even if shareholder wealth is maximised, tax avoidance can
nevertheless have both adverse firm- and macro-level effects (Hanlon &
Heitzman, 2010; Hanlon & Slemrod, 2009; Robinson, Sikes, & Weaver,
2010). At the firm level, tax avoidance diminishes the firm’s discharge of
its social irresponsibility (Erle, 2008). At the macro-level, tax avoidance
represents the loss of resources to the government that can finance the
provision of public goods (Sikka, 2010).
This study examines the relationship between tax avoidance and
selected firms’ performance, manifested through the firms’ value, in the
context of China. China represents a case worthy of study because its
development model is hotly debated. This model is one of state-led growth,
with a strong state sector coexisting with a vibrant private sector although a
series of reforms have also blurred the distinction between enterprises in
both sectors (Cheong, Ran, & Miao, 2014). China’s reforms saw Chinese
corporations made to pay corporate income tax. However, the Chinese
taxation system is itself in a state of transition. The coverage of the present
system is not comprehensive and has loopholes giving opportunities to
corporations, especially those connected to the state, to exploit. These flaws
may intensify the agency problems in Chinese listed companies, not just
state enterprises, which would directly or indirectly affect firms’
performance.
Given the above, this paper seeks to answer the following research
questions that correspond with the research objectives. The first question is
whether there exists a link between tax avoidance and firm value in China
and the associated objective is to explore this link in Chinese companies.
The second question is whether the country’s transition and corporate
reforms have moved China’s enterprise environment closer to the norm of
other countries so that the tax avoidance – firm value linkage in China
converges with what is found in the other countries. To the extent gaps in
Corporate Tax Avoidance and Performance: Evidence from China’s Listed Companies 63
convergence remain, the third question and objective are respectively to ask
why and to explain these gaps in terms of China’s reform experience.
In undertaking this study, existing studies do not provide much
guidance. Compared with research on developed markets, especially the
US, studies of tax avoidance in emerging markets especially China, are
very limited. Most extant research on China examines the relationship
between tax avoidance and firm characteristics, such as firm size,
ownership and leverage (Adhikari, Derashid, & Zhang, 2006; Badertscher,
Katz, & Rego, 2013; Wu, Wang, Luo, & Gillis, 2012). This study,
however, focuses on the impact of tax avoidance activities on a firm’s
market value improvement through improving growth and profitability.
The structure of this paper is as follows: Section 2 presents a brief
literature review and the hypotheses to be tested. Section 3 lays out model
specification and data, including measures of four latent variables, model
specification, data characteristics and data analysis. Section 4 discusses the
estimated results. Finally, Section 5 concludes the paper by drawing several
implications.
2. Literature Review and Hypotheses
Tax avoidance has been defined as the reduction in a firm’s explicit tax
liabilities (Hanlon & Heitzman, 2010). Therefore, tax avoidance consists of
tax planning strategies with perfectly legal activities at one extreme and
illegal tax evasion at the other (Hanlon & Heitzman, 2010).
Corporate tax avoidance is traditionally viewed as a tax-reducing device
that transfers interest from the government to shareholders to maximise
shareholders’ value, although an expanding body of work on agency theory
emphasises that tax avoidance is closely related to corporate governance
because of the agency cost implications. In practice, the complexity and
ambiguity of tax avoidance can shelter managers who engage in various
forms of managerial rent extraction such as earnings manipulation and
insider transactions which would reduce after-tax cash flows (Desai &
Dharmapala, 2009; Desai, Dyck, & Zingales, 2007). Enron’s case is a
striking example. In the 1990s, Enron made use of structured financing
transactions to evade tax, leading to government prosecution and its
collapse. Beyond that, firms also need to shoulder the combined tax
avoidance costs, which include direct tax planning, compliance and non-tax
costs. Lee, Dobiyanski, and Minton (2015) suggest that if shareholders
cannot fully understand the cost-benefit calculus, tax avoidance activities
could actually reduce firm value.
Empirical research on the impact of corporate tax avoidance on firm
value has produced mixed findings. Desai and Dharmapala (2009) found no
64 Zhang Chen, Cheong Kee Cheok, Rajah Rasiah
significant relationship between tax avoidance and firm value, but a
positive relationship for firms with dominant institutional ownership. They
suggest that shareholders consider that ability to control the manager can
add value to tax avoidance. Hanlon and Slemrod (2009) examined the
market reaction to news about a firm’s application for tax shelters. They
find that such news dampened stock price. Chen, Hu, Wang, and Tang
(2014) showed that tax avoidance is also inversely related to firm value, but
this can be mitigated by information transparency.
In comparison with the aforementioned research focused on developed
countries (Wahab & Holland, 2012; Badertscher, et al., 2013; Desai &
Dharmapala, 2009), Claessens and Fan (2002) argued that the agency
problems in Asian countries are compounded by a lack of corporate
transparency that permitted rent seeking and insider transactions. China
represents a special case because of the important role played by the
government. Piotroski, Wong, and Zhang (2015) reported that China’s
financial market and listed firms are operating in an environment of poor
information. In addition, China’s taxation system started to open up only in
the last three decades, is not comprehensive and has many loopholes. These
factors provide more space for managers to engage in managerial
opportunism and finally to maximise their self-serving objectives.
Given the above, and further in the context of the Chinese institutional
setting, corporate tax avoidance may not necessarily increase firm value.
Reflecting this, the first hypothesis is:
Hypothesis 1: corporate tax avoidance has a direct negative relationship
with firms’ market value.
Extensive empirical literature has shown that firms with good
profitability and growth performances are generally associated with better
firm value. Varaiya, Kerin, and Weeks (1987) found that firm profitability
and growth significantly impact shareholder value. Naceur and Goaied
(2002) investigated the relationship between value creation and profitability
in the Tunisia stock exchange. They found that future value creation is
significantly and positively related to a firm’s profitability. Furthermore,
Fama and French (1998) argued that if firms have a good record of
profitability, a positive relationship exists between taxation of dividends
and firm value. For these reasons, good profitability and growth
performance should be important factors in firm value maximisation.
Literature also shows corporate governance has a significantly positive
association with profitability and growth. Durnev and Kim (2005) found
firms with better governance to grow faster and be more profitable. In
addition, Peni and Vähämaa (2012) reported that large publicly traded US
banks with stronger corporate governance mechanisms have higher
Corporate Tax Avoidance and Performance: Evidence from China’s Listed Companies 65
profitability. Moreover, Harford, Mansi, and Maxwell (2012) indicated that
firms with low shareholder rights spend cash more quickly than those with
stronger governance. Besides, Yen (2005) stated that firms with a
management-friendly board structure would choose projects for which
growth prospects are promising.
The above suggests that corporate governance impacts a firm’s
profitability and growth. Therefore, profitability and growth performance
are posited as two mediators in the relationship between tax avoidance and
firm value. The following are Hypothesis 2a and 2b:
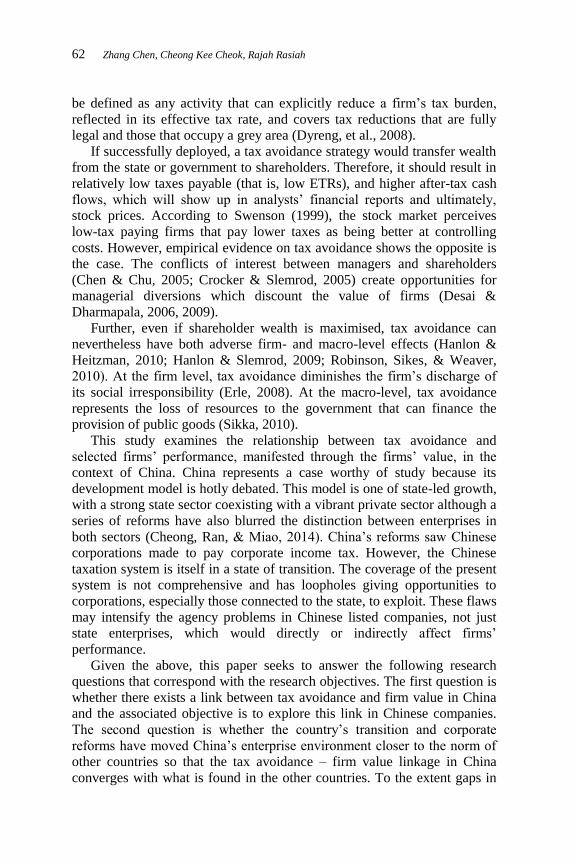
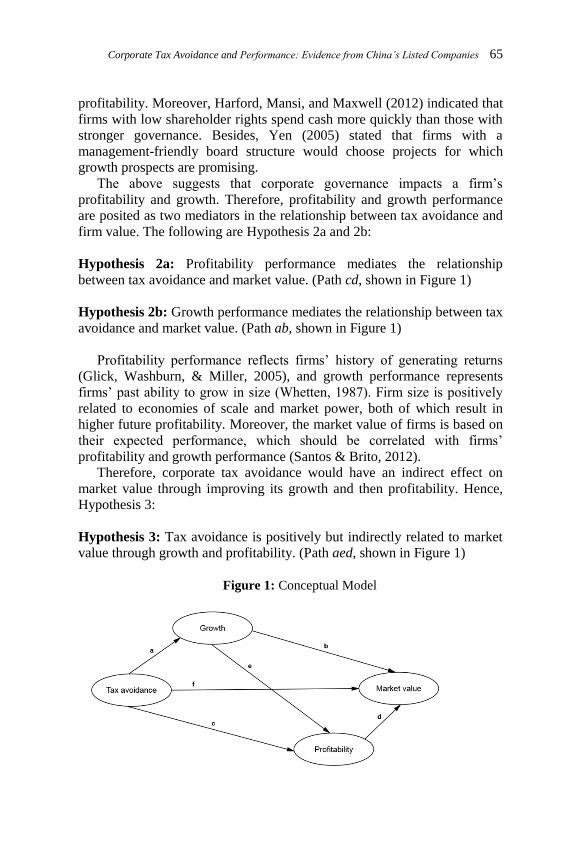
Hypothesis 2a: Profitability performance mediates the relationship
between tax avoidance and market value. (Path cd, shown in Figure 1)
Hypothesis 2b: Growth performance mediates the relationship between tax
avoidance and market value. (Path ab, shown in Figure 1)
Profitability performance reflects firms’ history of generating returns
(Glick, Washburn, & Miller, 2005), and growth performance represents
firms’ past ability to grow in size (Whetten, 1987). Firm size is positively
related to economies of scale and market power, both of which result in
higher future profitability. Moreover, the market value of firms is based on
their expected performance, which should be correlated with firms’
profitability and growth performance (Santos & Brito, 2012).
Therefore, corporate tax avoidance would have an indirect effect on
market value through improving its growth and then profitability. Hence,
Hypothesis 3:
Hypothesis 3: Tax avoidance is positively but indirectly related to market
value through growth and profitability. (Path aed, shown in Figure 1)
Figure 1: Conceptual Model
66 Zhang Chen, Cheong Kee Cheok, Rajah Rasiah
3. Model Specification and Data
3.1 Measures
Four constructs are used in the model to examine the relationships between
corporate tax avoidance, firms’ growth performance, profitability
performance and market value performance. The constructs and their
indicators (observed variables) are discussed below.
3.1.1 Corporate tax avoidance
Previous research had considered the effective tax rate (ETR) as a proxy for
the corporate tax burden (Gupta & Newberry, 1997; Porcano, 1986; Salihu,
Obid, & Annuar, 2013; Wu, et al., 2012). It is simultaneously an important
index used to measure the effectiveness of tax avoidance. This study adopts
two effective tax rates (ETRs) to represent tax avoidance (risky and non-
risky strategies) (Badertscher, et al., 2013). The first measure is the ETR 1
defined under GAAP as total tax expenses divided by pre-tax income. The
second measure is the ETR 2 defined on a cash basis as tax expenses minus
deferred tax expenses dividend by pre-tax income. In the model process,
we use the opposite number of the two ETRs.
All ETR measures are well understood by financial statement users.
Specifically, GAAP ETR is affected by changes in tax reserves and the
valuation allowance while Cash ETR is influenced by the timing of tax
payments, settlements with tax authorities and some type of earnings
management (Hanlon & Heitzman, 2010). However, in focusing on ETR as
the proxy for tax avoidance and its link with firm value, this study does not
investigate the differences between the two measures.
3.1.2 Profitability performance
Profitability is this study’s major performance dimensions of concern. It is
defined as the firm’s earnings net of costs and is commonly measured by
return on assets (ROA), return on invested capital (ROIC) and return on
sales (ROS). The ROA is the most often used accounting measure of
performance in financial research (Cable & Mueller, 2008). because it has
been shown to represent a firm’s performance well (Rowe & Morrow,
1999; Peng & Luo, 2000). It represents the ability of firms to use their
assets to generate profit. The ROS is also used by many researchers (Delen,
Kuzey, & Uyar, 2013; Jang, & Park, 2011) because it can reflect the profits
from a company’s sales in the short-term. The ROIC is a measure of the
return earned on the invested capital. Damodaran (2007) notes that ROIC is
Corporate Tax Avoidance and Performance: Evidence from China’s Listed Companies 67
a key input in both corporate finance and valuation. This study employs all
of the three measures to make up the latent variable of profitability. (See
Appendix 1)
3.1.3 Growth performance
In this study, a firm’s growth performance is measured by the growth rates
of sales revenue (SALG), sales income (SIG) and net income (NIG). Sales
growth has become a common measure of firm growth rate in many studies
(Anthony & Ramesh, 1992; Brush, Bromiley, & Hendrickx, 2000; Jang &
Park, 2011; Serrasqueiro, 2009). Wang and You (2012) believed that the
growth rate of sales income would yield more reliable estimation results in
the case of China. Moreover, net income growth represents the rate at
which firms have grown profits. Stocks that experience faster net income
growth are generally favoured over those with slower net income growth
rate. Therefore, the study employs growth rate of net income (Delen, et al.,
2013). Appendix 1 describes the variables’ definitions.
3.1.4 Market value performance
This study measures firms’ market performance using three market-based
measures of return. These are Price-to-book (PB) ratio, Tobin’s Q, and
Market capitalisation improvement. The PB is the ratio of stock price to
book value per share (Brealey & Myers, 2000; Montgomery, Thomas, &
Kamath, 1984). In addition, Tobin’s Q is the ratio of the market value of a
firm’s debt and equity to the ending total assets (Desai & Dharmapala,
2009; Yu, 2013). It is widely used because it takes account of the book and
market values of equity1 and the value of debt (Demsetz & Lehn 1985;
Desai & Dharmapala, 2009; Firth, Gong, & Shan, 2013). Moreover, market
capitalisation reflects the stock market’s valuation of a firm
(Abdolmohammadi, 2005) and is defined in this study as the improvement
of the total market value of the shares outstanding. (See Appendix 1)
3.2 Model specification
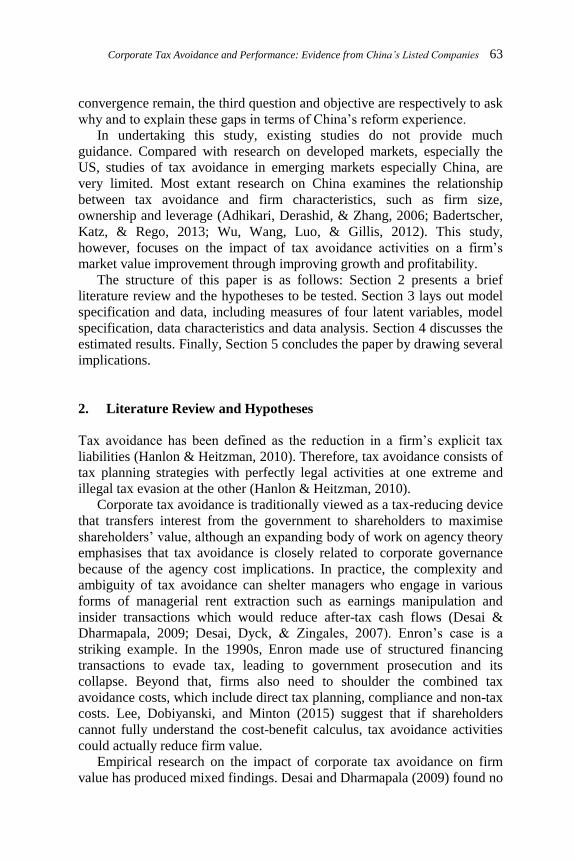
Figure 2 shows the structural model which underpins the causal
relationships among four latent constructs: tax avoidance, growth
performance, profitability performance and market value.
68 Zhang Chen, Cheong Kee Cheok, Rajah Rasiah
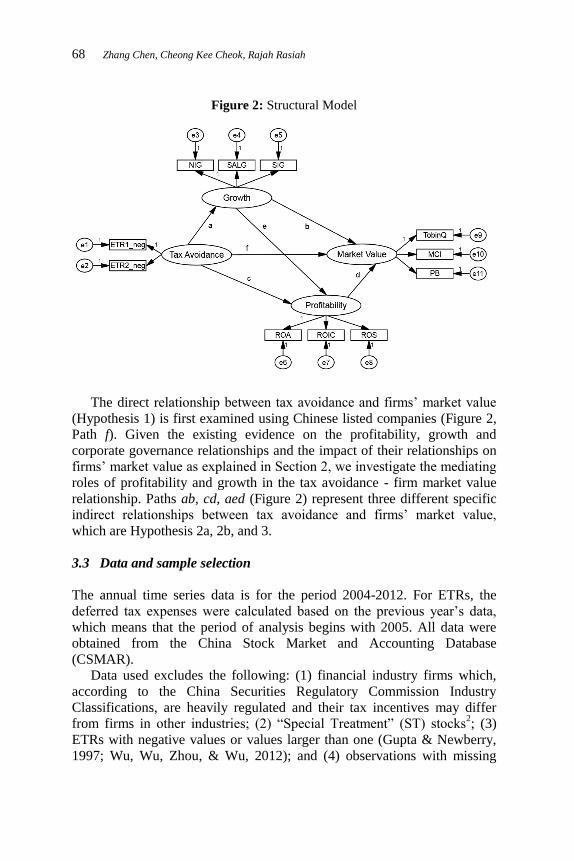
Figure 2: Structural Model
The direct relationship between tax avoidance and firms’ market value
(Hypothesis 1) is first examined using Chinese listed companies (Figure 2,
Path f). Given the existing evidence on the profitability, growth and
corporate governance relationships and the impact of their relationships on
firms’ market value as explained in Section 2, we investigate the mediating
roles of profitability and growth in the tax avoidance - firm market value
relationship. Paths ab, cd, aed (Figure 2) represent three different specific
indirect relationships between tax avoidance and firms’ market value,
which are Hypothesis 2a, 2b, and 3.
3.3 Data and sample selection
The annual time series data is for the period 2004-2012. For ETRs, the
deferred tax expenses were calculated based on the previous year’s data,
which means that the period of analysis begins with 2005. All data were
obtained from the China Stock Market and Accounting Database
(CSMAR).
Data used excludes the following: (1) financial industry firms which,
according to the China Securities Regulatory Commission Industry
Classifications, are heavily regulated and their tax incentives may differ
from firms in other industries; (2) “Special Treatment” (ST) stocks2; (3)
ETRs with negative values or values larger than one (Gupta & Newberry,
1997; Wu, Wu, Zhou, & Wu, 2012); and (4) observations with missing
Corporate Tax Avoidance and Performance: Evidence from China’s Listed Companies 69
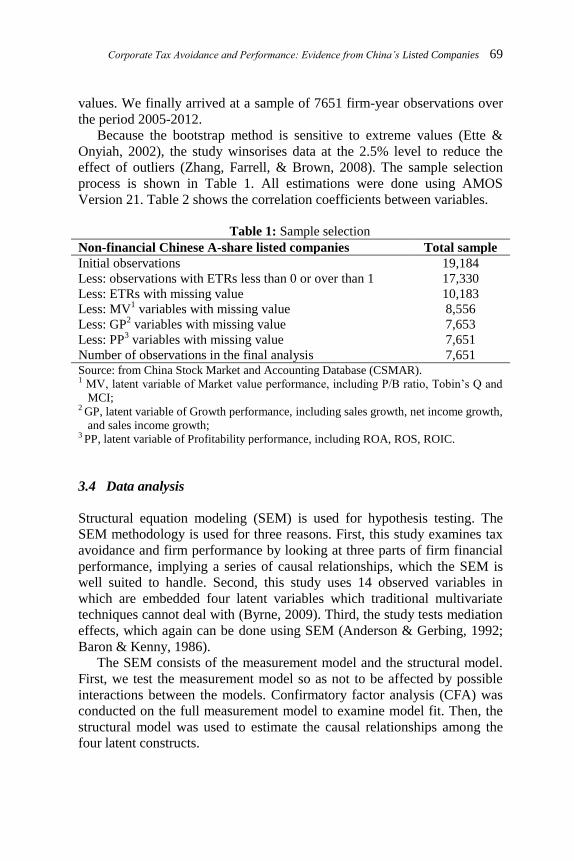
values. We finally arrived at a sample of 7651 firm-year observations over
the period 2005-2012.
Because the bootstrap method is sensitive to extreme values (Ette &
Onyiah, 2002), the study winsorises data at the 2.5% level to reduce the
effect of outliers (Zhang, Farrell, & Brown, 2008). The sample selection
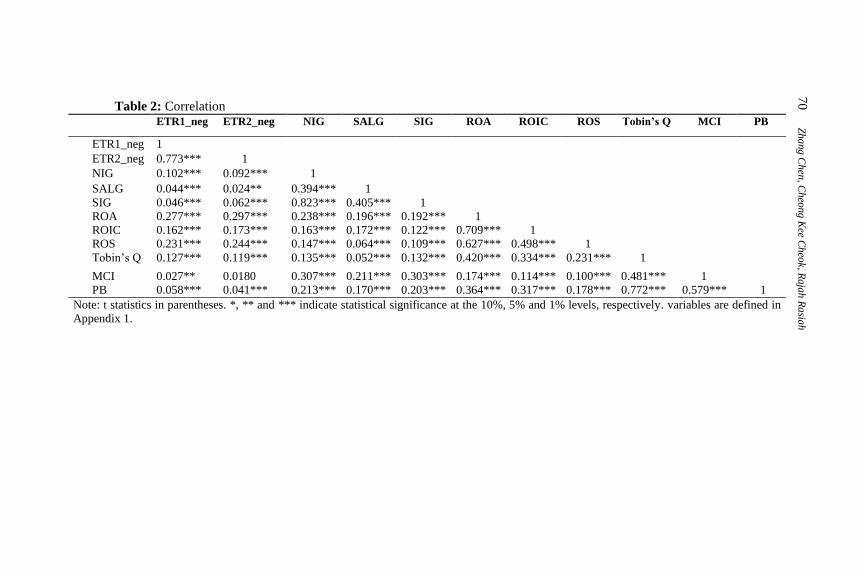
process is shown in Table 1. All estimations were done using AMOS
Version 21. Table 2 shows the correlation coefficients between variables.
Table 1: Sample selection
Non-financial Chinese A-share listed companies Total sample
Initial observations 19,184
Less: observations with ETRs less than 0 or over than 1 17,330
Less: ETRs with missing value 10,183
Less: MV1 variables with missing value 8,556
Less: GP2 variables with missing value 7,653
Less: PP3 variables with missing value 7,651
Number of observations in the final analysis 7,651 Source: from China Stock Market and Accounting Database (CSMAR). 1 MV, latent variable of Market value performance, including P/B ratio, Tobin’s Q and
MCI; 2 GP, latent variable of Growth performance, including sales growth, net income growth,
and sales income growth; 3 PP, latent variable of Profitability performance, including ROA, ROS, ROIC.
3.4 Data analysis
Structural equation modeling (SEM) is used for hypothesis testing. The
SEM methodology is used for three reasons. First, this study examines tax
avoidance and firm performance by looking at three parts of firm financial
performance, implying a series of causal relationships, which the SEM is
well suited to handle. Second, this study uses 14 observed variables in
which are embedded four latent variables which traditional multivariate
techniques cannot deal with (Byrne, 2009). Third, the study tests mediation
effects, which again can be done using SEM (Anderson & Gerbing, 1992;
Baron & Kenny, 1986).
The SEM consists of the measurement model and the structural model.
First, we test the measurement model so as not to be affected by possible
interactions between the models. Confirmatory factor analysis (CFA) was
conducted on the full measurement model to examine model fit. Then, the
structural model was used to estimate the causal relationships among the
four latent constructs.
7
0 Z
ha
ng
Chen
, Cheo
ng
Kee C
heo
k, R
aja
h R
asia
h
Table 2: Correlation
ETR1_neg ETR2_neg NIG SALG SIG ROA ROIC ROS Tobin’s Q MCI PB
ETR1_neg 1
ETR2_neg 0.773*** 1
NIG 0.102*** 0.092*** 1
SALG 0.044*** 0.024** 0.394*** 1
SIG 0.046*** 0.062*** 0.823*** 0.405*** 1
ROA 0.277*** 0.297*** 0.238*** 0.196*** 0.192*** 1
ROIC 0.162*** 0.173*** 0.163*** 0.172*** 0.122*** 0.709*** 1
ROS 0.231*** 0.244*** 0.147*** 0.064*** 0.109*** 0.627*** 0.498*** 1
Tobin’s Q 0.127*** 0.119*** 0.135*** 0.052*** 0.132*** 0.420*** 0.334*** 0.231*** 1
MCI 0.027** 0.0180 0.307*** 0.211*** 0.303*** 0.174*** 0.114*** 0.100*** 0.481*** 1
PB 0.058*** 0.041*** 0.213*** 0.170*** 0.203*** 0.364*** 0.317*** 0.178*** 0.772*** 0.579*** 1
Note: t statistics in parentheses. *, ** and *** indicate statistical significance at the 10%, 5% and 1% levels, respectively. variables are defined in
Appendix 1.
Corporate Tax Avoidance and Performance: Evidence from China’s Listed Companies 71
Where the data are found to follow a multivariate non-normal
distribution, the bootstrap (Preacher & Hayes, 2008) and Mackinnon
PRODCLIN2 methods (MacKinnon, Fritz, Williams, & Lockwood, 2007)
are used in the analyses. The chi-square (x2) is used as the first fit index.
Where x2 is found to be heavily influenced by sample size (Byrne, 2009),
other goodness-of-fit indices are used (Byrne, 2009; Hair, Black, Babin, &
Anderson, 2009; MacCallum & Austin, 2000). This study employs several
other model fit indices. These include the root mean square error of
approximation (RMSEA), root mean square residual (RMR), goodness of
fit index (GFI), adjusted goodness of fit index (AGFI), comparative fit
index (CFI), and normed fit index (NFI). In a model with good fit, the GFI,
CFI, AGFI and NFI should be above 0.9 (Byrne 2009, Hair, et al., 2009).
The RMSEA and RMR should be less than 0.08 (Hu & Bentler, 1998) to
signify acceptability.
4. Results
In this section, we first discuss the goodness-of-fit for both the models. In
addition, this section also presents the hypothesised relationships between
latent constructs.
4.1 Measurement model
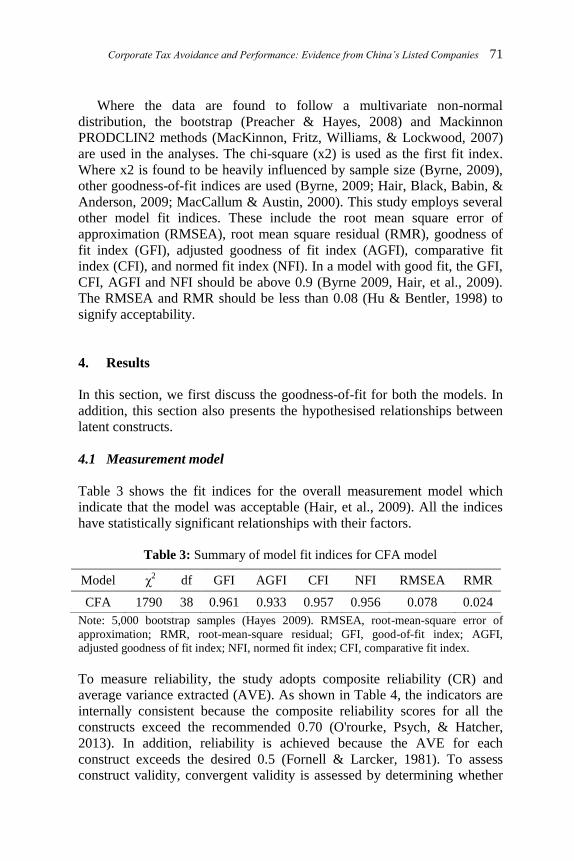
Table 3 shows the fit indices for the overall measurement model which
indicate that the model was acceptable (Hair, et al., 2009). All the indices
have statistically significant relationships with their factors.
Table 3: Summary of model fit indices for CFA model
Note: 5,000 bootstrap samples (Hayes 2009). RMSEA, root-mean-square error of
approximation; RMR, root-mean-square residual; GFI, good-of-fit index; AGFI,
adjusted goodness of fit index; NFI, normed fit index; CFI, comparative fit index.
To measure reliability, the study adopts composite reliability (CR) and
average variance extracted (AVE). As shown in Table 4, the indicators are
internally consistent because the composite reliability scores for all the
constructs exceed the recommended 0.70 (O'rourke, Psych, & Hatcher,
2013). In addition, reliability is achieved because the AVE for each
construct exceeds the desired 0.5 (Fornell & Larcker, 1981). To assess
construct validity, convergent validity is assessed by determining whether
Model χ2 df GFI AGFI CFI NFI RMSEA RMR
CFA 1790 38 0.961 0.933 0.957 0.956 0.078 0.024
72 Zhang Chen, Cheong Kee Cheok, Rajah Rasiah
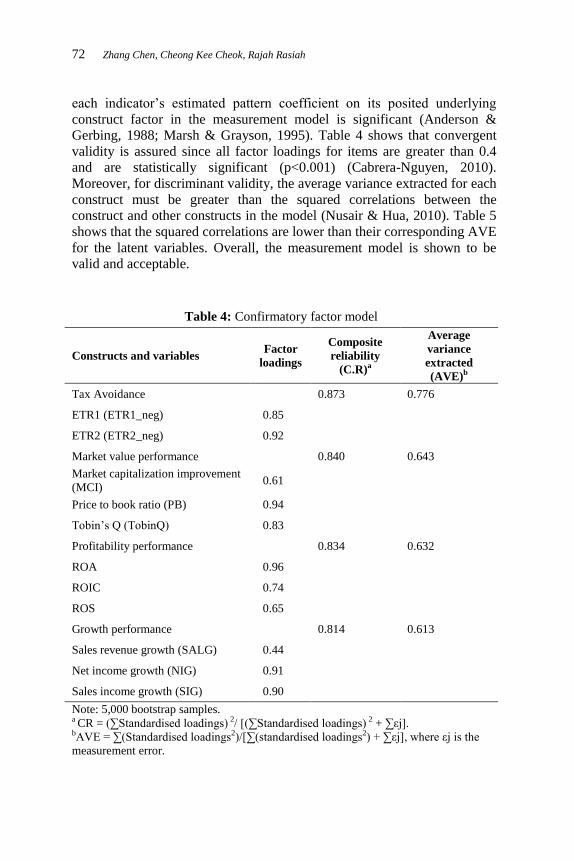
each indicator’s estimated pattern coefficient on its posited underlying
construct factor in the measurement model is significant (Anderson &
Gerbing, 1988; Marsh & Grayson, 1995). Table 4 shows that convergent
validity is assured since all factor loadings for items are greater than 0.4
and are statistically significant (p<0.001) (Cabrera-Nguyen, 2010).
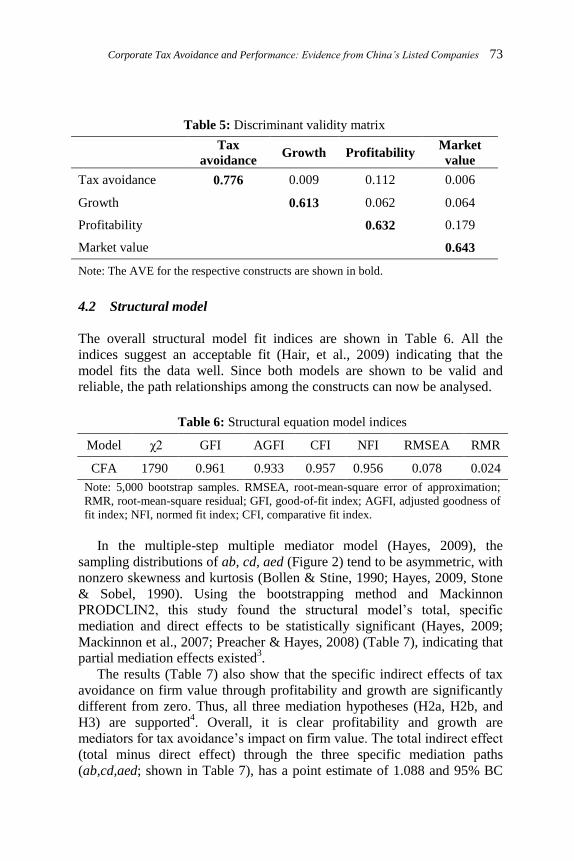
Moreover, for discriminant validity, the average variance extracted for each
construct must be greater than the squared correlations between the
construct and other constructs in the model (Nusair & Hua, 2010). Table 5
shows that the squared correlations are lower than their corresponding AVE
for the latent variables. Overall, the measurement model is shown to be
valid and acceptable.
Table 4: Confirmatory factor model
Constructs and variables Factor
loadings
Composite
reliability
(C.R)a
Average
variance
extracted
(AVE)b
Tax Avoidance
0.873 0.776
ETR1 (ETR1_neg) 0.85
ETR2 (ETR2_neg) 0.92
Market value performance
0.840 0.643
Market capitalization improvement
(MCI) 0.61
Price to book ratio (PB) 0.94
Tobin’s Q (TobinQ) 0.83
Profitability performance
0.834 0.632
ROA 0.96
ROIC 0.74
ROS 0.65
Growth performance
0.814 0.613
Sales revenue growth (SALG) 0.44
Net income growth (NIG) 0.91
Sales income growth (SIG) 0.90
Note: 5,000 bootstrap samples. a CR = (∑Standardised loadings) 2/ [(∑Standardised loadings) 2 + ∑εj]. bAVE = ∑(Standardised loadings2)/[∑(standardised loadings2) + ∑εj], where εj is the
measurement error.
Corporate Tax Avoidance and Performance: Evidence from China’s Listed Companies 73
Table 5: Discriminant validity matrix
Tax
avoidance Growth Profitability
Market
value
Tax avoidance 0.776 0.009 0.112 0.006
Growth
0.613 0.062 0.064
Profitability
0.632 0.179
Market value
0.643
Note: The AVE for the respective constructs are shown in bold.
4.2 Structural model
The overall structural model fit indices are shown in Table 6. All the
indices suggest an acceptable fit (Hair, et al., 2009) indicating that the
model fits the data well. Since both models are shown to be valid and
reliable, the path relationships among the constructs can now be analysed.
Table 6: Structural equation model indices
Model χ2 GFI AGFI CFI NFI RMSEA RMR
CFA 1790 0.961 0.933 0.957 0.956 0.078 0.024
Note: 5,000 bootstrap samples. RMSEA, root-mean-square error of approximation;
RMR, root-mean-square residual; GFI, good-of-fit index; AGFI, adjusted goodness of
fit index; NFI, normed fit index; CFI, comparative fit index.
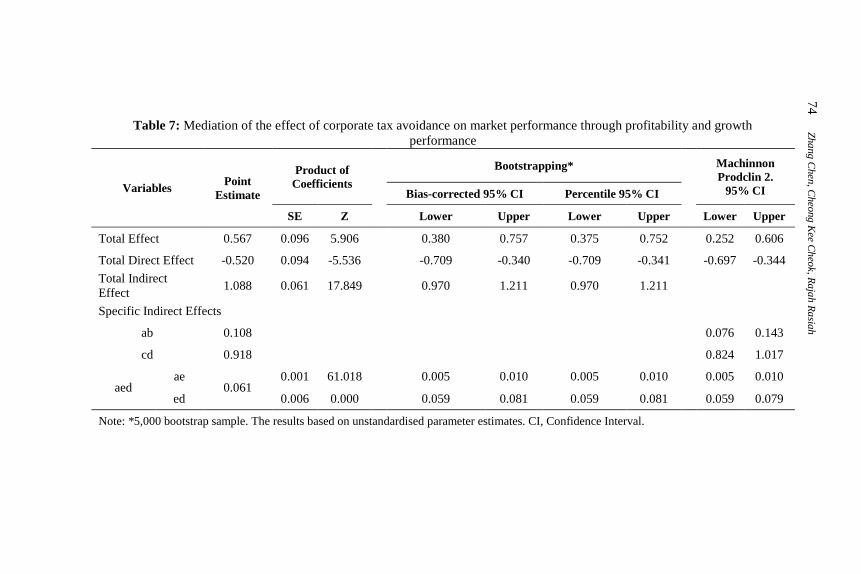
In the multiple-step multiple mediator model (Hayes, 2009), the
sampling distributions of ab, cd, aed (Figure 2) tend to be asymmetric, with
nonzero skewness and kurtosis (Bollen & Stine, 1990; Hayes, 2009, Stone
& Sobel, 1990). Using the bootstrapping method and Mackinnon
PRODCLIN2, this study found the structural model’s total, specific
mediation and direct effects to be statistically significant (Hayes, 2009;
Mackinnon et al., 2007; Preacher & Hayes, 2008) (Table 7), indicating that
partial mediation effects existed3.
The results (Table 7) also show that the specific indirect effects of tax
avoidance on firm value through profitability and growth are significantly
different from zero. Thus, all three mediation hypotheses (H2a, H2b, and
H3) are supported4. Overall, it is clear profitability and growth are
mediators for tax avoidance’s impact on firm value. The total indirect effect
(total minus direct effect) through the three specific mediation paths
(ab,cd,aed; shown in Table 7), has a point estimate of 1.088 and 95% BC
74 Z
ha
ng
Chen
, Cheo
ng
Kee C
heo
k, R
aja
h R
asia
h
Table 7: Mediation of the effect of corporate tax avoidance on market performance through profitability and growth
performance
Variables Point
Estimate
Product of
Coefficients
Bootstrapping*
Machinnon
Prodclin 2.
95% CI Bias-corrected 95% CI Percentile 95% CI
SE Z Lower Upper Lower Upper Lower Upper
Total Effect 0.567 0.096 5.906
0.380 0.757 0.375 0.752
0.252 0.606
Total Direct Effect -0.520 0.094 -5.536
-0.709 -0.340 -0.709 -0.341
-0.697 -0.344
Total Indirect
Effect 1.088 0.061 17.849
0.970 1.211 0.970 1.211
Specific Indirect Effects
ab 0.108
0.076 0.143
cd 0.918
0.824 1.017
aed ae
0.061 0.001 61.018
0.005 0.010 0.005 0.010
0.005 0.010
ed 0.006 0.000
0.059 0.081 0.059 0.081
0.059 0.079
Note: *5,000 bootstrap sample. The results based on unstandardised parameter estimates. CI, Confidence Interval.
Corporate Tax Avoidance and Performance: Evidence from China’s Listed Companies 75
and Percentile bootstrap CI of 0.970 to 1.211. This difference is non-zero.
The specific indirect effect through profitability (Point estimate = 0.918) is
larger than that through growth (Point estimate = 0.108) and
growth*profitability (Point estimate = 0.061).
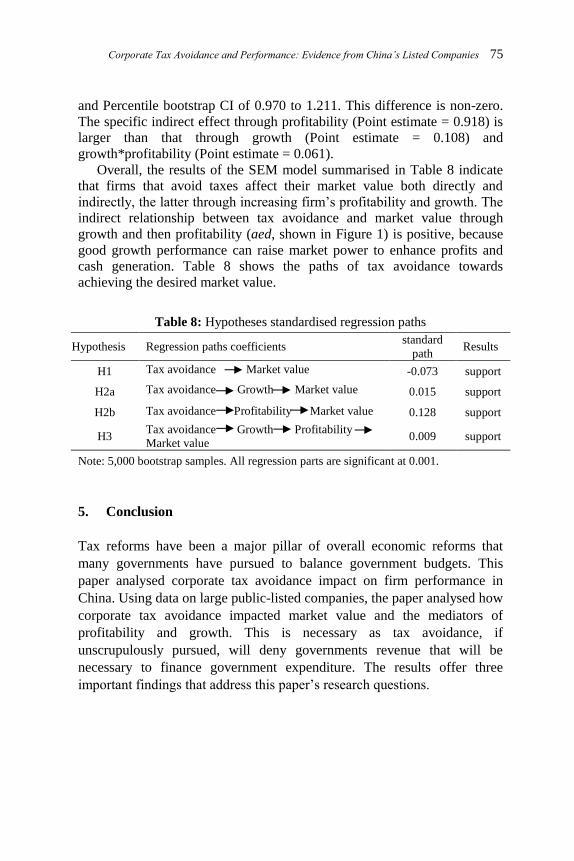
Overall, the results of the SEM model summarised in Table 8 indicate
that firms that avoid taxes affect their market value both directly and
indirectly, the latter through increasing firm’s profitability and growth. The
indirect relationship between tax avoidance and market value through
growth and then profitability (aed, shown in Figure 1) is positive, because
good growth performance can raise market power to enhance profits and
cash generation. Table 8 shows the paths of tax avoidance towards
achieving the desired market value.
5. Conclusion
Tax reforms have been a major pillar of overall economic reforms that
many governments have pursued to balance government budgets. This
paper analysed corporate tax avoidance impact on firm performance in
China. Using data on large public-listed companies, the paper analysed how
corporate tax avoidance impacted market value and the mediators of
profitability and growth. This is necessary as tax avoidance, if
unscrupulously pursued, will deny governments revenue that will be
necessary to finance government expenditure. The results offer three
important findings that address this paper’s research questions.
Table 8: Hypotheses standardised regression paths
Hypothesis Regression paths coefficients standard
path Results
H1 Tax avoidance Market value -0.073 support
H2a Tax avoidance Growth Market value 0.015 support
H2b Tax avoidance Profitability Market value 0.128 support
H3 Tax avoidance Growth Profitability
Market value 0.009 support
Note: 5,000 bootstrap samples. All regression parts are significant at 0.001.
76 Zhang Chen, Cheong Kee Cheok, Rajah Rasiah
First, in addressing the first research question, the results reveal that
corporate behaviour in China differs from those in most existing studies,
which show no direct impact of tax avoidance on firm value (Desai &
Dharmapala, 2009). We show a significant positive relationship that is
made up of significant direct (negative) and indirect (positive) impacts.
Second, the similarities between China and market economies suggest
that China’s corporate reforms have moved the Chinese corporate
environment closer to that of market economies. This answers the second
research question posited earlier.
Third, and in answering the third research question, we believe the
above results can be explained by China’s particular circumstances. The
significant negative direct relationship between tax avoidance and market
value in Chinese listed firms is consistent with the agency cost theory of
tax avoidance and its consequences on managerial rent extraction. China’s
still evolving market reforms show that there are imperfections that require
addressing through legal and other provisions to prevent managerial rent
extraction. However, the positive indirect relationship between tax
avoidance and market value through the mediating role of firm profitability
and growth performance suggest that tax avoidance could be continued but
they need to be bolstered by legal regulations to reduce the possible
negative consequences from managerial rent seeking.
The above results are obtained using the SEM approach which offers a
more robust set of results than past studies based on traditional regression
equations. Also, past studies have not investigated the impact of after-tax
cash from tax avoiding activities on firm value. Hence, this paper provides
direct evidence on how tax avoidance can help maximise firm performance.
What implications can be drawn from the findings?
First, with China’s corporate reforms applied to an enterprise system
that differ from but converging with the structure in most market
economies the question arises as to how urgent it is that China’s system
should be transformed to the latter, as has been repeatedly advised.
Second, and more specifically, these findings leave open the question of the
relevance of the agency perspective under state-ownership for the analysis
of tax policy. In China, state-ownership is an important firm characteristic
impacting on firms’ financial decisions, which require continued research
to track the consequences of enterprise reforms. A third implication relates
to the types of policies - governance, tax, regulatory, etc. - that can limit the
abuses of tax avoidance. Given that tax avoidance works directly as
Corporate Tax Avoidance and Performance: Evidence from China’s Listed Companies 77 well as indirectly to affect firm value, it is not sufficient to put in place
policies that directly address tax avoidance issues.
The findings of this paper also suggest several fruitful areas for further
research. One is the policy mix that would lead to minimisation of tax
avoidance abuses. Another is to determine if tax avoidance behaviour was
based on firm type, e.g. state enterprises, private enterprises, and foreign
invested enterprises, or by size of enterprises. A third research area is to
estimate the impact of specific major corporate reforms. Finally, given the
rapid pace of change in China’s economic scene, updating research
findings becomes an important exercise.
Notes
1. In China, due to the special split-share structure, some shares are non-
tradable in the stock market. We adopt the same method as to set the market
value of non-tradable shares as their book value (Qian, & Wu, 2003,
"China's Transition to a Market Economy," How Far Across the River?
Chinese Policy Reform at the Millennium, p. 31). In this study, the
calculation of the Tobin’s Q is the market price per share multiplied by the
number of tradable shares plus the book value of equity per share multiplied
by the number of non-tradable shares plus book value of total debt over the
book value of total assets. 2. All stocks labeled ST have seen their business in the red for two consecutive
years representing the firms with financial problem or other abnormal
conditions, which are technically on the brink of delisting. ST or Special
Treatment shares and the original idea behind this classification is that it
would act as a warning to investors. 3. For bootstrapping percentile and bias-corrected methods, and Mackinnon
PRODCLIN2, if zero is not between the lower and upper bound, then the
effect is not zero with 95% confidence Hayes, A. F. (2009) "Beyond Baron
and Kenny: Statistical Mediation Analysis in the New Millennium,"
Communication Monographs, 76, 408-420. Percentile and bias-corrected
methods are used to identify the existence of indirect effects. Then,
Mackinnon PRODCLIN2 is used to identify and distinguish the specific
indirect effects. 4. In Table 7, because zero is not contained in the interval; therefore, the
specific indirect effects can be distinguished in terms of magnitude.
References
Abdolmohammadi, M.J. (2005). Intellectual capital disclosure and market
capitalization. Journal of Intellectual Capital, 6(3), 397-416.
78 Zhang Chen, Cheong Kee Cheok, Rajah Rasiah
Adhikari, A., Derashid, C., & Zhang, H. (2006). Public policy, political
connections, and effective tax rates: Longitudinal evidence from
Malaysia. Journal of Accounting and Public Policy, 25(5), 574-595.
Anderson, J.C., & Gerbing, D.W. (1988). Structural equation modeling in
practice: A review and recommended two-step approach.
Psychological bulletin, 103(3), 411-423.
Anderson, J.C., & Gerbing, D.W. (1992). Assumptions and comparative
strengths of the two-step approach. Sociological Methods and
Research, 20(3), 321-333.
Anthony, J.H., & Ramesh, K. (1992). Association between accounting
performance measures and stock prices: A Test of the life cycle
hypothesis. Journal of Accounting and Economics, 15(2), 203-227.
Badertscher, B.A., Katz, S.P., & Rego, S.O. (2013). The separation of
ownership and control and corporate tax avoidance. Journal of
Accounting and Economics, 56(2), 228-250.
Baron, R.M., & Kenny, D.A. (1986). The moderator-mediator variable
distinction in social psychological research, conceptual, strategic, and
statistical considerations. Journal of Personality and Social
Psychology, 51(6), 1173-1182.
Bollen, K.A., & Stine, R. (1990). Direct and indirect effects: Classical and
bootstrap estimates of variability. Sociological Methodology, 20(1),
15-140.
Brealey, R.A., & Myers, S.C. (2000). Principles of corporate finance.
Boston: McGraw-Hill.
Brush, T.H., Bromiley, P., & Hendrickx, M. (2000). The free cash flow
hypothesis for sales growth and firm performance. Strategic
Management Journal, 21(4), 455-472.
Byrne, B.M. (2009). Structural equation modeling with Amos: Basic concepts, applications, and programming. New York, NY: Taylor and
Francis Group.
Cable, J.R., & Mueller, D.C. (2008). Testing for persistence of profits’
differences across firms. International Journal of the Economics of
Business, 15(2), 201-228.
Cabrera-Nguyen, P. (2010). Author guidelines for reporting scale
development and validation results. Journal of the Society for Social
Work and Research, 1(2), 99-103.
Chen, K.P., & Chu, C. (2005). Internal control vs external manipulation: a
model of corporate income tax evasion. RAND Journal of Economics, 36(1), 151-164.
Chen, X., Hu, N., Wang, X., & Tang, X. (2014). Tax avoidance and firm
value: evidence from China. Nankai Business Review International, 5(1), 25-42.
Corporate Tax Avoidance and Performance: Evidence from China’s Listed Companies 79
Cheong, K.C., Ran, L., & Miao, Z. (2014). 2 the Chinese state, state
enterprises, and the global crisis. Government-Linked Companies and Sustainable, Equitable Development. New York, NY: Taylor and
Francis Group.
Claessens, S., & Fan, J.P.H. (2002). Corporate Governance in Asia: A
Survey. International Review of Finance, 3(2), 71-103.
Crocker, K.J., & Slemrod, J. (2005). Corporate tax evasion with agency
costs. Journal of Public Economics, 89(9), 1593-1610.
Damodaran, A. (2007). Return on Capital (Roc), Return on Invested
Capital (Roic) and Return on Equity (Roe): Measurement and
implications. SSRN Working Paper. Stern School of Business, New
York University. Delen, D., Kuzey, C., & Uyar, A. (2013). Measuring Firm performance
using financial ratios: A decision tree approach. Expert Systems with
Applications, 40(10), 3970-3983.
Demsetz, H., & Lehn, K. (1985). The structure of corporate ownership:
Causes and consequences. Journal of Political Economy, 93(6), 1155-
1177.
Desai, M.A., & Dharmapala, D. (2006). Corporate Tax avoidance and high-
powered incentives. Journal of Financial Economics, 79(1), 145-179.
Desai, M.A., & Dharmapala, D. (2009). Corporate tax avoidance and firm
value. The Review of Economics and Statistics, 91(3), 537-546.
Desai, M.A., & Dharmapala, D. (2009). Earnings management, corporate
tax shelters, and book-tax alignment. National Tax Journal, 169-186.
Desai, M.A., Dyck, A., & Zingales, L. (2007). Theft and taxes. Journal of Financial Economics, 84(3), 591-623.
Durnev, A., & Kim, E. (2005). To steal or not to steal: Firm attributes, legal
environment, and valuation. The Journal of Finance, 60(3), 1461-
1493.
Dyreng, S.D., Hanlon, M., & Maydew, E.L. (2008). Long-run corporate tax
avoidance. Accounting Review, 83(1), 61-82.
Erle, B. (2008). Tax risk management and board responsibility in W.Schon
(Ed.), Tax and Corporate Governance (pp. 205-220). Germany:
Springer Berlin Heidelberg.
Ette, E.I., & Onyiah, L.C. (2002). Estimating inestimable standard errors in
population pharmacokinetic studies: The bootstrap with winsorization.
European journal of drug metabolism and pharmacokinetics, 27(3),
213-224.
Fama, E.F., & French, K.R. (1998). Taxes, financing decisions, and firm
value. The Journal of Finance, 53(3), 819-843.
Firth, M., Gong, S.X., & Shan, L. (2013). Cost of government and firm
value. Journal of Corporate Finance, 21, 136-152.
80 Zhang Chen, Cheong Kee Cheok, Rajah Rasiah Fornell, C., & Larcker, D.F. (1981). Evaluating structural equation models
with unobservable variables and measurement error. Journal of Marketing Research, 18(1), 39-50.
Glick, W.H., Washburn, N.T., & Miller, C.C. (2005). The myth of firm
performance. Organization Science, 24(3), 948-964.
Gupta, S., & Newberry, K. (1997). Determinants of the variability in
corporate effective tax rates: Evidence from longitudinal data. Journal of Accounting and Public Policy, 16(1), 1-34.
Hair, J.F., Black, W.C., Babin, B.J., & Anderson, R.E. (2009). Multivariate
data analysis. United States of America, USA: Pearson Education, Inc.
Hanlon, M., & Heitzman, S. (2010). A review of tax research. Journal of
Accounting and Economics, 50(2), 127-178. Hanlon, M., & Slemrod, J. (2009). What does tax aggressiveness signal?
Evidence from stock price reactions to news about tax shelter
involvement. Journal of Public Economics, 93(1), 126-141.
Harford, J., Mansi, S., & Maxwell, W. (2012). Corporate governance and
firm cash holdings in the U.S in S. Boubaker, B. D. Nguyen & D. K.
Nguyen (Ed.), Corporate Governance (pp. 107-138). New York, NY:
Springer Berlin Heidelberg.
Hayes, A. F. (2009). Beyond Baron and Kenny: Statistical Mediation
analysis in the new millennium. Communication Monographs, 76(1),
408-420.
Hu, L.T., & Bentler, P.M. (1998). Fit indices in covariance structure
modeling: Sensitivity to underparameterized model misspecification.
Psychological Methods, 3(4), 424-453.
Jang, S., & Park, K. (2011). Inter-relationship between firm growth and
profitability. International Journal of Hospitality Management, 30(4),
1027-1035.
Lee, B.B., Dobiyanski, A., & Minton, S. (2015). Theories and empirical
proxies for corporate tax avoidance. The Journal of Applied Business
and Economics, 17(3), 21-34.
MacCallum, R.C., & Austin, J.T. (2000). Applications of structural
equation modeling in psychological research. Annual Review of Psychology, 51(1), 201-226.
MacKinnon, D.P., Fritz, M.S., Williams, J., & Lockwood, C.M. (2007).
Distribution of the product confidence limits for the indirect effect:
Program PRODCLIN. Behavior Research Methods, 39(3), 384-389.
Marsh, H.W., & Grayson, D. (1995). Latent Variable models of multitrait-
multimethod data. In R.H. Hoyle (Ed.), Structural equation modeling:
Concepts, issues, and applications (pp. 177-198). Thousand Oaks,
CA, US: Sage Publications.
Corporate Tax Avoidance and Performance: Evidence from China’s Listed Companies 81 Montgomery, C.A., Thomas, A.R., & Kamath, R. (1984). Divestiture,
market valuation, and strategy. Academy of Management Journal, 27(4), 830-840.
Naceur, S.B., & Goaied, M. (2002). The relationship between dividend
policy, financial structure, profitability and firm value. Applied Financial Economics, 12(12), 843-849.
Nusair, K., & Hua, N. (2010). Comparative Assessment of structural
equation modeling and multiple regression research methodologies: E-
Commerce context. Tourism Management, 31(3), 314-324.
O'Rourke, N., Psych, R., & Hatcher, L. (2013). A step-by-step approach to using sas for factor analysis and structural equation modeling. Cary,
NC: Sas Institute.
Peng, M.W., & Luo, Y. (2000). Managerial ties and firm performance in a
transition economy: The nature of a micro-macro link. Academy of
Management Journal, 43(3), 486-501.
Peni, E., & Vähämaa, S. (2012). Did good corporate governance improve
bank performance during the financial crisis?. Journal of Financial
Services Research, 41(1-2), 19-35.
Piotroski, J.D., Wong, T., & Zhang, T. (2015). Political incentives to
suppress negative information: evidence from Chinese listed firms.
Journal of Accounting Research, 53(2), 405-459.
Porcano, T. (1986). Corporate tax rates: Progressive, proportional, or
regressive. Journal of the American Taxation Association, 8(2), 17-31.
Preacher, K., & Hayes, A. (2008). Asymptotic and resampling strategies for
assessing and comparing indirect effects in multiple mediator models.
Behavior Research Methods, 40(3), 879-891.
Qian, Y., & Wu, J. (2003). China's transition to a market economy. In N.
Hope (Ed.), How Far Across the River? Chinese Policy Reform at the Millennium (pp. 31-63). Stanford, California: Stanford University
Press.
Robinson, J.R., Sikes, S.A., & Weaver, C.D. (2010). Performance
measurement of corporate tax departments. Accounting Review, 85(3),
1035-1064.
Rowe, W.G., & Morrow, J. (1999). A note on the dimensionality of the
firm financial performance construct using accounting, market and
subjective measures. Canadian Journal of Administrative Sciences,
16(1), 58-70.
Salihu, I.A., Obid, S.N.S., & Annuar, H.A. (2013). Measures of corporate
tax avoidance: Empirical evidence from an emerging economy.
International Journal of Business and Society, 14(3), 412-427.
Santos, J.B., & Brito, L.A.L. (2012). Toward a subjective measurement
model for firm performance. BAR. Brazilian Administration Review,
9(SPE), 95-117.
82 Zhang Chen, Cheong Kee Cheok, Rajah Rasiah Serrasqueiro, Z. (2009). Growth and profitability in portuguese companies:
a dynamic panel data approach. Economic Interferences, 11(26), 265-
279.
Sikka, P. (2010). Smoke and mirrors: Corporate social responsibility and
tax avoidance. Accounting Forum, 34(3), 153-168.
Stone, C.A., & Sobel, M.E. (1990). The robustness of estimates of total
indirect effects in covariance structure models estimated by maximum.
Psychometrika, 55(2), 337-352.
Swenson, C. (1999). Increasing Stock market value by reducing effective
tax rates. Tax Notes, 83, 1503-1505.
Varaiya, N., Kerin, R.A., & Weeks, D. (1987). The relationship between
growth, profitability, and firm value. Strategic Management Journal, 8(5), 487-497.
Wahab, N.S.A., & Holland, K. (2012). Tax planning, corporate governance
and equity value. The British Accounting Review, 44(2), 111-124.
Wang, Y., & You, J. (2012). Corruption and firm growth: Evidence from
China. China Economic Review, 23(2), 415-433.
Whetten, D.A. (1987). Organizational Growth and decline processes.
Annual Review of Sociol , 335-358.
Wu, L., Wang, Y., Luo, W., & Gillis, P. (2012). State ownership, tax status
and size effect of effective tax rate in China. Accounting and Business
Research, 42(2), 97-114.
Wu, W., Wu, C., Zhou, C., & Wu, J. (2012). Political Connections, tax
benefits and firm performance: Evidence from China. Journal of
Accounting and Public Policy, 31(3), 277-300.
Yen, S.W. (2005). Growth opportunities and governance structure choices.
SSRN Working Paper (No. 687003). City University of Hong Kong.
Yu, M. (2013). State ownership and firm performance: empirical evidence
from Chinese listed companies. China Journal of Accounting
Research, 6(2), 75-87.
Zhang, Y., Farrell, K.A., & Brown, T.A. (2008). Ex-dividend day price and
volume: The case of 2003 dividend tax cut. National Tax Journal,
61(1), 105-127.
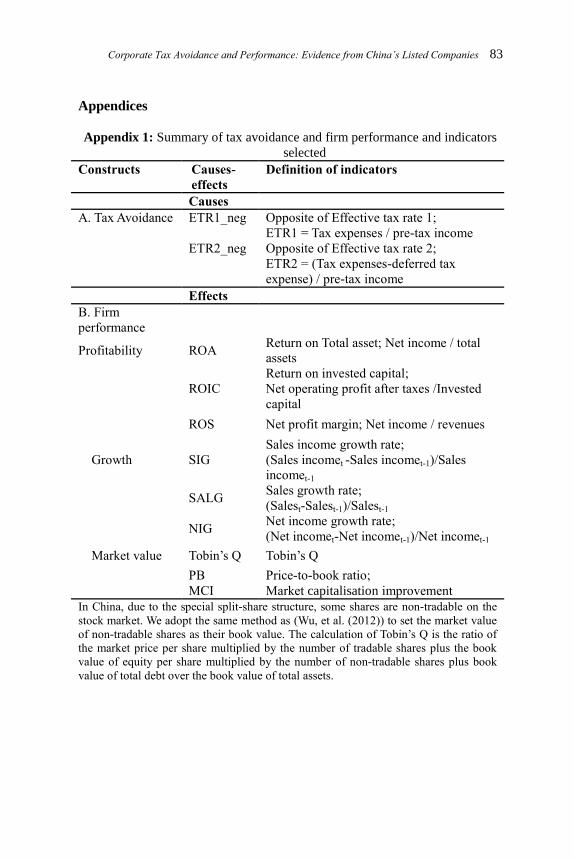
Corporate Tax Avoidance and Performance: Evidence from China’s Listed Companies 83 Appendices
Appendix 1: Summary of tax avoidance and firm performance and indicators
selected
Constructs Causes-
effects
Definition of indicators
Causes
A. Tax Avoidance ETR1_neg Opposite of Effective tax rate 1;
ETR1 = Tax expenses / pre-tax income
ETR2_neg Opposite of Effective tax rate 2;
ETR2 = (Tax expenses-deferred tax
expense) / pre-tax income
Effects
B. Firm
performance
Profitability ROA Return on Total asset; Net income / total
assets
ROIC
Return on invested capital;
Net operating profit after taxes /Invested
capital
ROS Net profit margin; Net income / revenues
Growth SIG
Sales income growth rate;
(Sales incomet -Sales incomet-1)/Sales
incomet-1
SALG Sales growth rate;
(Salest-Salest-1)/Salest-1
NIG Net income growth rate;
(Net incomet-Net incomet-1)/Net incomet-1
Market value Tobin’s Q Tobin’s Q
PB Price-to-book ratio;
MCI Market capitalisation improvement
In China, due to the special split-share structure, some shares are non-tradable on the
stock market. We adopt the same method as (Wu, et al. (2012)) to set the market value
of non-tradable shares as their book value. The calculation of Tobin’s Q is the ratio of
the market price per share multiplied by the number of tradable shares plus the book
value of equity per share multiplied by the number of non-tradable shares plus book
value of total debt over the book value of total assets.