Embed Size (px)
Citation preview
1
Managerial Ability and Tax Avoidance
1. Introduction
We examine the relation between managerial ability and corporate tax avoidance. Recent studies
show that tax avoidance practices are potentially value-enhancing but cost-engendering corporate
activities (e.g., Rego and Wilson 2012; Hasan et al. 2013). In reality, there is substantial
variation in the level of corporate tax avoidance (e.g., Weisbach 2002; Dyreng et al. 2008).
Although over the past decade there has been a surge in research that examines the determinants
of tax avoidance, Hanlon and Heitzman (2010, p.145) summarize that “overall, the field cannot
explain the variation in tax avoidance very well” and suggest that more work needs to be done on
this important topic. Recently, Dryeng et al. (2010) introduce the “upper echelons theory” into
the tax avoidance literature and find that managerial fixed effects are important determinants of
firms’ tax avoidance. However, the paper further finds that common individual characteristics
such as education, gender and age, cannot explain this variation. In this paper, we extend this line
of research by focusing on one previously unexplored yet important managerial characteristic:
managerial ability.
Prior studies show a significant relation between managerial talent and corporate policies
(e.g., Harris and Holmstrom 1982; Rose and Shepard 1997; Bertrand and Schoar 2003).
Dermerjian et al. (2012, 2013) quantify managerial talent by the measure of managerial ability.
They define managerial ability as how efficiently managers generate revenues from given
economic resources, and find that managerial ability is positively related to firm performance
and earnings quality. However, given that there are both significant benefits and costs associated
with tax avoidance activities and the mixed evidence on the relation between tax avoidance and
firm value (e.g., Desai and Dharmapala 2009; Hanlon and Slemrod 2009; Kim et al. 2011), it is
2
unclear whether managers with superior abilities are associated with more or less tax avoidance
activities.
As is the case with other investment opportunities, tax avoidance provides economic
benefits, which in this case are primarily from tax savings. For example, Mills et al. (1998) find
that an additional $1 investment in tax planning results in a $4 reduction in tax liabilities.
Scholes et al. (2009) conclude that potential tax savings from aggressive avoidance strategies
could be economically large. Dyreng et al. (2013) find that the use of Delaware subsidies as
domestic tax havens, on average, increases net income by 1.0 - 1.5%. Thus, if more able
managers are better at generating revenues from given economic resources, then by the same
token, we should expect that superior managers are more knowledgeable at exploring tax
avoidance opportunities to increase firm value.
However, tax avoidance also consumes valuable resources. Prior studies show that tax
avoidance activities are necessarily complex, obfuscated, and opaque, and are associated with
significant costs (e.g., Desai and Dharmapala 2006; Balakrishnan et al. 2012; Hasan et al. 2013).
Direct costs include tax planning, litigation and other expenses of mounting a defense against tax
authority challenges, back taxes, and potentially hefty penalties and fines imposed by tax
authorities. Indirect costs include political costs, potential damage to the firm’s reputation, and
cost of debt capital (e.g., Hanlon and Slemrod 2009; Graham et al. 2013; Hasan et al. 2013).
Another type of cost that is particularly important for this study is the opportunity cost of
managerial efforts. Rational managers should devote their time to projects that offer the highest
positive net present value. When a manager’s opportunity cost increases, the incremental value
added by tax avoidance is reduced and tax avoidance becomes a less attractive investment, given
3
other things equal. Therefore, we should expect that firms with more able managers to engage
less in tax avoidance activities.
Using a sample of 42,340 firm-year observations for 7,001 U.S. firms over the period
1988 through 2009, we empirically examine the relation between managerial ability (as
measured by Demerjian et al. (2012, 2013)) and tax avoidance. Given that we are interested in
broad tax avoidance strategies that could reduce the firm’s taxes relative to its pretax income,
following Dyreng et al. (2008), Hope et al. (2013), among others, we use the effective tax rate
(ETR) and the cash effective tax rate (CETR) as our primary measures of tax avoidance.
We find a negative and significant relation between managerial ability and tax avoidance
after controlling for firm-level factors that have been shown to impact tax avoidance in the
literature. Our results are robust to the inclusion of additional controls such as earnings quality,
governance quality and equity incentives, and when we use alternative measures to proxy for
managerial ability (i.e., historical stock returns) and tax avoidance (i.e., three book-tax difference
based measures). Our results are also robust to the use of firm fixed-effect regressions to mitigate
omitted variable bias, and when we use the Fama-MacBeth regression method to deal with
possible cross-sectional dependence of regression errors.
Importantly, our findings are also economically meaningful. For instance, results from
our baseline regressions show that a one standard deviation increase of managerial ability score,
on average, is associated with about 0.32% increase of ETR or 0.59% increase of CETR, which
translates to a $0.57 million increase in tax expense or $1.05 million increase in cash tax
payment each year. Overall, our results show that firms with managers that have superior
abilities are associated with lower levels of tax avoidance that are both statistically significant
and economically meaningful.
4
To mitigate endogeneity concerns, we employ a difference-in-differences approach using
information from CEO turnovers. Specifically, we identify a treatment sample of firms that prior
to the turnover were managed by low-managerial ability CEOs but came under the management
of high-managerial ability CEOs subsequent to the turnover. We also construct a control sample
of firms that were managed by low-managerial ability CEOs and remained that way following
the CEOs turnover. The difference-in-differences results show that a low-to-high managerial
ability switch leads to a significant reduction in the level of tax avoidance compared to a low-to-
low managerial ability switch. Using a similar identification strategy, we further find that a high-
to-low managerial ability switch leads to a significant increase in the level of tax avoidance
compared to a high-to-high managerial ability switch. Thus, our two sets of results provide
strong evidence of a negative and causal effect of managerial ability on tax avoidance.
We further examine the relation between managerial ability and tax aggressiveness, the
most extreme subset of tax avoidance that can be considered as “pushing the envelope of tax law”
(Hanlon and Heitzman 2010, p. 137). We use tax sheltering probability (Wilson 2009), predicted
tax reserve balance (Lisowsky et al. 2013), and the usage of international tax haven subsides
(Dyreng et al. 2009) to capture tax aggressiveness that likely engenders greater risks and costs.
We find consistent results that managerial ability is negatively and significantly associated with
all these measures of tax aggressiveness.
Prior studies show that tax aggressiveness is associated with higher likelihood of stock
price crash risk (Kim et al. 2011) and negative market reactions (Hanlon and Slemrod 2009). Our
finding of the negative relation between managerial ability and tax aggressiveness suggests that
more able managers engage less in such activities which could hurt shareholders’ value. It is
therefore, interesting to examine if those firms that do engage in tax aggressive activities such as
5
shelters, whether investors would value managerial ability when assessing the potential damages
caused by such behaviors. Our results from the cross-sectional analysis of the market reactions to
tax sheltering news indicate that investors consider managerial ability in a positive way when
reacting to tax sheltering news.
Thus, our results provide support for the argument that because of their superior abilities
to increase firm value through normal business operations, more able managers have less
incentives to engage in tax avoidance activities than less able managers. If this is the case, we
should observe that the negative relation is more evident for firms with lower managerial ability
because the opportunity costs of those managers are lower. To test our conjecture, we separate
the full sample into two groups: firms with high ability managers and those with low ability
managers based on the median value of managerial ability score. Consistent with our
expectations, we find that the negative relation between managerial ability and tax avoidance for
firms with low managerial ability is more significant, both statistically and economically, than
that for firms with high managerial ability.
Finally, we examine the impact of governance on a firm’s tax avoidance behavior. Desai
and Dharmapala (2009) find that, on average, the effect of tax avoidance on firm value is not
significant, but is significantly positive in well-governed firms. We therefore examine whether
the identified negative relation between managerial ability and tax avoidance is conditional on
the quality of firm governance. Specifically, we separate the sample into two groups: firms with
good corporate governance and firms with weak corporate governance based on the median
values of various governance measures (e.g., G-index, institutional ownership, and analyst
coverage). Our results show that there is no significantly different effect of managerial ability on
tax avoidance between these two subsamples, indicating that managerial ability is an inherent
6
individual characteristic that affects tax avoidance, and that it is not affected by firms’
governance environment.
Our paper contributes to the growing literature on corporate tax avoidance. We shed light
on this topic by examining the impact of managerial ability on firm’s tax avoidance. Given that
managerial ability is shown to increase firm value and that tax avoidance does not necessarily
increase firm value, it is not a priori apparent what the relation is between managerial ability and
tax avoidance. We contend that it is important that firms’ tax avoidance policies be viewed as
investment decisions that provide economic benefits as well as consume resources. As such, we
further contend that managers with greater ability are better able to convert firm resources into
revenue and thus, tax avoidance becomes a less attractive option because of the significant costs
associated with it. Our main result of a significant negative relation between managerial ability
and tax avoidance (as well as tax aggressiveness) provides support for these arguments and
therefore, furthers our understanding of the determinants of tax avoidance and extends the
findings of Dyreng et al. (2010).
Our paper also contributes to the growing research on attributes of managers, particularly
managerial ability. Recent studies find that managerial ability is an important factor which
affects firm performance and corporate decisions such as earnings quality and management
earnings forecast (Baik et al. 2011; Demerjian et al. 2012, 2013). Our finding of a negative
relation between managerial ability and corporate tax avoidance is consistent with prior research
(Baik et al. 2011; Demerjian et al. 2013) that shows a positive relation between managerial
ability and accounting quality. Our paper complements and extends this stream of literature.
Furthermore, our findings, especially results on tax aggressiveness, have important public policy
implications for regulators, investors, and managerial labor markets.
7
The rest of the paper proceeds as follows. Section 2 reviews the relevant literature and
develops our hypotheses. Section 3 describes the data and methodology. Section 4 presents the
results. Section 5 concludes.
2. Literature review and hypothesis development
2.1 Manager-specific effects and managerial ability
Many studies of corporate decisions assume a neoclassical view of top managers as
replaceable agents whose idiosyncratic differences do not affect corporate outcomes (Weintraub,
2002). Studies in strategic management come to a similar conclusion by arguing that managers
are constrained to make homogenous decisions by the entrenched norms and culture (e.g.,
Lieberson and O’Connor 1972; Hannan and Freeman 1977) or by the propensity to conform to
external expectations of rationality by imitating other managers (e.g., Spender 1989; Hambrick et
al. 1993; Chalmers and Godfrey 2004). In addition, the selection processes of top managers
further limit heterogeneity (Hitt and Tyler 1991; DiMaggio and Powell 1983; Hambrick 2007).
This homogeneity assumption, however, is not prevalent in the business press and among
managers themselves. They are often perceived, at least, to have their own styles.1
Furthermore,
the empirical evidence shows that there is a large proportion of heterogeneity in corporate
strategies that is left unexplained by firm- and industry-level factors (e.g., Bradley et al. 1984;
Titman and Wessels 1988; and Smith and Watts 1992). In fact, managers are often faced with
uncertain situations in which they have to make complicated decisions using complex
information (Hambrick and Manson 1984; Hambrick 2007). They therefore interpret those
1 For example, Bertrand and Schoar (2003) cite John Reed’s quote on style “In the old days I would have said it was
capital, history, the name of the bank. Garbage—it’s about the guy at the top. I am very much a process person, a
builder. Sandy [Weil] is an acquirer. Just totally different.” Another article in a May 2001 issue of Business Week
cited in their study is the so called “The Koszlowski Method,” describing the aggressive acquisition style of Dennis
Koszlowski, the CEO of Tyco.
8
situations and act on the basis of their experience, values and personalities, as suggested by
bounded rationality (March and Simon 1958; Cyert and March 1963).
Since the development of the “upper echelons theory” by Hambrick and Manson (1984),
studies have begun to examine the idiosyncratic differences of top managers in making corporate
policies and their effects on corporate performance. For example, Johnson et al. (1985) find that
there are abnormal stock price changes around unexpected deaths of senior corporate executives.
Bertrand and Schoar (2003) find that managerial fixed effects matter for a wide range of
corporate decisions and explain a significant portion of the heterogeneity in investment, financial
and organizational practices of firms. They refer to managers’ fixed effects as “style” and tie it
back to managers’ age and education. Bamber et al. (2010) track managers across firms over
time and find that top executives have unique and significant influence on their firms’ voluntary
disclosure; they tie those idiosyncratic effects, or “style”, to the managers’ personal backgrounds
and experiences such as finance, accounting, legal, age, and military experience.
While prior research suggests that managerial-specific features (experience, education,
age or style) significantly impact firm behavior and performance, few attempts to quantify
managerial ability or talent. Ultimately, it can be thought of as how efficiently managers can turn
resources (assets) into profits. One notable exception is the recent study by Demerjian et al.
(2012). These authors propose a measure of managerial ability based on their efficiency in
generating revenues and find that this manager-specific efficiency measure is strongly associated
with manager fixed effects. Using this measure, Demerjian et al. (2013) examine its relation with
earning quality and find that managerial ability is positively associated with earnings quality.
They explain the finding as “superior managers are more knowledgeable of their business,
9
leading to better judgments and estimates and, thus, higher quality earnings.” (Demerjian et al.
2013, p. 463)
Given that corporate tax policies could be very complex decisions, due in part to the
increasingly complex nature of large and diversified businesses and the likelihood of being
detected, manager-specific effects could be important factors in understanding the variation of
corporate tax decisions. In the next sub-section, we review related literatures in both the tax
avoidance and managerial ability areas and propose our hypothesis.
2.2 Managerial ability and tax avoidance
While the issue of tax avoidance has been studied extensively for individuals in public
economics (Slemrod and Yitzhaki 2002), the literature on corporate tax avoidance is relatively
young (e.g., Shevlin and Shackelford 2001; Shevlin 2007; Hanlon and Heitzman 2010). In
particular, a few recent studies indicate that top managers influence firms’ decisions about tax
policies (e.g., Dyreng et al. 2010; Armstrong et al. 2012; Rego and Wilson 2012; Chyz 2013).
Among these studies, Dryeng et al. (2010) focus on the individual impact of top managers.
Examining a group of executives that switch firms, they find that the top management team plays
a significant role in determining tax avoidance that cannot be explained by firm characteristics.
Although this study is an important first step in examining individual managers’ effects on tax
avoidance, the authors are not able to explain the variation among managers’ individual effects
in that they find that common observable characteristics such as education, gender, age, and
tenure are not associated with executives’ propensities to reduce taxes.
We believe that studying the effect of managerial ability on their firms’ tax avoidance
could yield meaningful insights. Viewing tax avoidance decisions as investment options (e.g.,
10
Mills et al. 1998), a rational manager should decide on the level of tax avoidance depending on
whether this particular investment generates positive incremental NPVs and how it compares
with their firms’ other investment opportunities.
The conjecture that tax avoidance provides direct benefits is based on the intuition that
tax avoidance produces tax savings. For instance, with a statutory tax rate of 35 percent, the
firm’s tax bill could be up to one-third of its firm’s pre-tax profits. Thus, potential tax savings
from aggressive avoidance strategies could be economically large. For example, Mills et al.
(1998) find that an additional $1 investment in tax planning results in a $4 reduction in tax
liabilities. Dyreng et al. (2013) find that the use of Delaware subsidizes as domestic tax havens,
on average, increases net income of 1-1.5%. While, Bloomberg News reported that Google
avoided $2 billion in worldwide income taxes in 2011 by channeling $10 billion of revenue into
a Bermuda shell company.
However, as with other investments, tax avoidance entails consumption of resources or at
times liabilities. Direct costs include tax planning costs, litigation and other expenses of
mounting a defense against tax authority challenges, back taxes, potentially hefty penalties and
fines imposed by tax authorities, and more rigorous scrutiny from tax authorities in the long run
(e.g., blacklisted by the IRS). Anecdotal evidence indicates that the direct costs alone could be
quite substantial.2 There are indirect costs that include political costs, potential damage to the
firm’s reputation and significant agency costs. For example, Hanlon and Slemrod (2009) argue
that firms engaging in tax sheltering activities are being labeled as “poor corporate citizens.” In
responding to the survey by Graham et al. (2013), 69% of top executives agree that potential
2 For example, GlaxoSmithKline P.L.C. settled with the IRS with a $3.4 billion payment for transfer pricing
practices that seek to avoid taxes (Wall Street Journal, 2006). AstraZeneca P.L.C. paid $1.1 billion to settle a similar
dispute with the IRS in 2011. Merck & Co. settled several disputed tax issues including its use of minority equity
interest financing transactions with the IRS in 2007 by paying a settlement amount of $2.3 billion including back
taxes, penalties, and interest.
11
harm to their firms’ reputations is very important when deciding what tax planning strategies to
implement. Chen et al. (2010) find that family firms have lower levels of tax avoidance when
compared to their non-family counterparts, indicating that family owner-managers are willing to
forego tax benefits to avoid the potential price discount. Khurana and Moser (2013) argue that if
long-term institutional investors anticipate a strong positive feedback effect between corporate
tax avoidance and rent diversion, they might seek to constrain managers’ ability to avoid taxes.
Hasan et al. (2013) find corporate tax avoidance is positively related to the cost of both public
and private debt.
In sum, it is therefore possible that the combined costs could potentially offset the tax
savings from tax avoidance, and the substantial costs related with tax avoidance could explain
the mixed results of the relation between tax avoidance and firm value. For instance, Desai and
Dharmapala (2009) find a positive relation between tax avoidance and firm value for well-
governed firms. Desai and Hines (2002) find a positive market reaction to announcements of
corporate investment decisions. In contrast, Hanlon and Slemrod (2009) find a negative stock
market reaction to news concerning company involvement in tax shelters. Kim et al. (2011) find
a positive relation between tax avoidance and stock price crash risk.
In the decision-making models of managers, there is also opportunity cost of their efforts.
Rational managers should devote their time in projects that offer the highest positive net present
value. For example, more able managers who can turn resources into revenues more efficiently
may invest more of their effort in operations than in designing tax avoidance plans, all else equal.
Aggressive tax planning could be complicated given that it could involve corporation with a
foreign municipality, transfer pricing with a foreign subsidiary, management of corporate life
insurance, or cross-border dividend capture, as pointed out by Graham and Tucker (2005). In
12
sum, we contend that although there are benefits to tax avoidance, because of the significant
costs associated with it both directly and indirectly, managers with superior ability will be less
likely to pursue all potential tax avoidance strategies. The following equation summarizes how
managerial ability impacts the net present value from tax planning of avoidance activities,
including the other costs discussed above.
NPV(TA)j. t=PV ∑ j, t)–PV ∑
j,t)-PV(∑ j,t) (1)
Where NPV(TA)j.t is the incremental value added by tax avoidance by firm j at time t;
PV ∑ j,t) is the present value of all the tax savings as a consequence of today’s tax
policies; PV ∑ j,t) is the present value of all the costs including litigation costs and
fines if detected, and reputation loss; lastly, PV(∑ j,t) measures the
present value of the managerial opportunity cost which is the potential value given up when
managers devote time and resources on tax avoidance. The last term of Equation (1) suggests
that when a manager’s opportunity cost increases, the incremental value added by tax avoidance
reduces and tax avoidance becomes a less attractive investment, given other things equal.
In sum, Equation (1) suggests a negative relationship between managerial ability and tax
avoidance, where firms with more able managers are likely to engage in less tax avoidance
because they could devote their time to other investments which could lead to greater benefits.
Our prediction on how managerial ability impacts tax avoidance should even hold when
managers are self-interested. The proposed negative relation between managerial ability and tax
avoidance, therefore, should be robust even after we control for corporate governance and
13
managerial equity incentives. Based on the discussion above, we formalize our main hypothesis
as follows:
H1: Managerial ability is negatively related to the level of corporate tax avoidance.
3. Research design, sample selection and summary statistics
3.1. Measures of managerial ability
Following Demerjian et al. (2013), we use Demerjian et al. (2012) measures as our
primary proxies for managerial ability. Their estimation of managerial ability is a two-stage
process that begins with the estimation of total firm efficiency using data envelopment analysis
(DEA). According to Demerjian et al. (2012, p. 4), “DEA is a statistical procedure used to
evaluate the relative efficiency of separable entities, termed ‘decision-making units (DMUs)’,
where each DMU converts certain inputs (labor, capital, etc.) into outputs (revenue, income,
etc.).”
In their model, individual firms serve as the DMUs. Revenues represent outputs, and
seven financial items (net property, plant, and equipment; net operating leases; net research and
development costs; purchased goodwill; other intangible assets; cost of inventory; and selling,
general, and administrative expenses) represent inputs. In the first stage, total firm efficiency is
estimated through an optimization procedure that allows varying weights for each of the inputs
and outputs. In the second stage, by regressing total firm efficiency on various company
characteristics (i.e., size, market share, cash availability, life cycle, operational complexity, and
foreign operations), total firm efficiency is decomposed into firm and managerial parts.3
Demerjian et al. (2012) point out the DEA approach to calculate efficiency allows
efficiency to be calculated based on the practical optimum level rather than average performance.
3 Please see Demerjian et al. (2012) for more details.
14
As such they contend that it is superior to other proxies (e.g., abnormal returns or performance,
compensation, tenure, and media coverage) with respect to its association with managerial fixed
effects, price reactions to CEO turnover announcements, and subsequent performance of
companies with new CEOs. Nonetheless, we acknowledge that it is still subject to measurement
errors, mainly because the residuals from the second stage model may still contain omitted
factors that affect firm efficiency which cannot be attributed to management. In our robustness
checks, we also use historical stock returns as an alternative measure of managerial ability.
Demerjian et al. (2012) provide two measures of managerial ability. One is a continuous
score for managerial ability for each firm/year (MA score), the other is industry/year deciles
ranking for each firm/year (MA rank). In our empirical tests, we use both to triangulate our
findings.
3.2. Measures of tax avoidance
Hanlon and Heitzman (2010, p.137) state that “if tax avoidance represents a continuum of
tax planning strategies where something like municipal bond investments are at one end, then
terms such as ‘noncompliance,’ ‘evasion,’ ‘aggressiveness,’ and ‘sheltering’ would be closer to
the other end of the continuum.” Given our conceptual framework, we are interested in broad tax
avoidance strategies that could reduce the firm’s taxes relative to its pretax income. Following
Dyreng et al. (2008) and Hope et al. (2013), we use two standard measures to capture broad tax
avoidance. The first is the firm’s effective tax rate (ETR), the ratio of total tax expenses (total
current tax expense plus deferred tax expense) over pretax income adjusted for special items.
The second one is the firm’s cash effective tax rate (CETR), the ratio of cash tax paid over pretax
15
income adjusted for special items. By definition, both measures imply that higher values imply
less tax avoidance.
Dyreng et al. (2008) point out that these two measures are appropriate measures of tax
avoidance because they capture various objectives managers could have with regard to tax
avoidance. To the extent that managers are concerned with reducing tax expenses for financial
reporting purposes, ETR captures the executive’s incentives to affect this metric. While CETR
captures managerial incentives to reduce the actual taxes paid. Therefore, we use ETR and
CETR as our primary measures of tax avoidance.
However, it should be noted that measures of corporate tax avoidance are necessarily
complicated and there is no single measure that could satisfy all research purposes. Hanlon and
Heitzman (2010) discuss the usage and limitations of each tax avoidance measure in the
literature in detail. In our supplemental analyses, we also use three book-tax difference based
measures (Manzon and Plesko 2002; Desai and Dharmapala 2006; Frank et al. 2009) to capture
tax avoidance. Additionally, we use tax sheltering probability, predicted uncertain tax positions
(UTB) (Wilson 2009; Rego and Wilson 2012), the usage of international tax haven subsides
(Dyreng et al. 2009) to capture more aggressive tax avoidance. Appendix A provides detailed
description of these tax avoidance/tax aggressiveness measures. If results across all measures are
consistent, one can be more confident that our results are robust.
3.3. Baseline regression model
We use the following empirical model to test our hypothesis:
Tax avoidancet = f (Managerial abilityt-1, Firm attributest-1, Industry effects, and Year
effects); (2)
16
where Tax avoidancet and Managerial abilityt-1 are as discussed above. We compute managerial
ability measures and firm attributes using lagged information from the year immediately prior to
the tax avoidance measure to partially mitigate potential endogeneity issues.
Following Rego (2003), Chen et al. (2010), Hope et al. (2013), and Hoi et al. (2013), we
include the following firm attributes in our model. Size is the natural logarithm of the market
value of equity (PRCC_F × CSHO); M/B is the market-to-book ratio measured as market value
of equity (PRCC_F × CSHO) scaled by book value of equity (CEQ); Leverage is leverage
measured as long-term debt (DLTT) scaled by lagged assets (AT); Cash holding is cash ratio
measured as Cash and Short-Term Investments (CHE) scaled by lagged assets (AT); NOL is a
dummy variable coded as one if loss carry forward (TLCF) is positive; ΔNOL is the change in
loss carry forward (TLCF) scaled by lagged assets (AT); ROA is the return on assets measured as
operating income (PI – XI) scaled by lagged assets (AT); Foreign income is foreign income
(PIFO) scaled by lagged assets (AT); Equity income is the equity income in earnings (ESUB)
scaled by lagged assets (AT); PPE is the property, plant, and equipment (PPENT) scaled by
lagged assets (AT); Intangible assets is the intangible assets (INTAN) scaled by lagged assets
(AT). Lastly, we include dummy variables to control for year and industry (two-digit SIC codes)
fixed effects.
3.4. Sample selection, summary statistics and correlation coefficients
We estimate the baseline regression model in Equation (2) using data from two sources.
We obtain managerial ability data from Sarah McVay’s website and the corresponding financial
information from Standard and Poor’s Compustat database. We then merge the two datasets.
17
After removing firms with incomplete information, we obtain a final sample of 42,340 firm-year
observations for 7,001 unique firms for the period 1988-2009.4
Table 1, Panel A reports sample statistics. The mean value of ETR is 0.304, and the mean
value of CETR is 0.267. These values are similar to those reported in prior studies. For example,
Hope et al. (2013) report the mean values of ETR and CETR as 0.29 and 0.27. Chyz et al. (2013)
report the mean values of ETR and CETR as 0.33 and 0.27. We find that the mean value of MA
Score is 0.017, and the mean value of MA Rank is 0.599. Other sample firm-year statistics are in
the range of those reported in earlier studies.
[Insert Table 1 here]
Panel B reports Pearson correlations. Not surprisingly, the two measures of managerial
ability are positively and significantly correlated. The correlation coefficient between ETR and
CETR is 0.324, which is consistent with prior studies, such as Chen et al. (2010). We also find
that the two measures of managerial ability are significantly and positively correlated with the
two measures of tax rate, suggesting a negative relation between managerial ability and tax
avoidance. As expected, most control variables are systematically associated with the tax
avoidance measures as well.
In summary, Panel B of Table 1 provides preliminary results that support our hypothesis
that there is a negative correlation between managerial ability and tax avoidance. In the next
section, we use multivariate analyses to further investigate the relationship between managerial
ability and tax avoidance.
4 To mitigate the influence of outliers, all control variables are winsorized at the 1% and 99%.
18
4. The relation between managerial ability and tax avoidance
In the ensuing analyses, we use the regression model in Equation (2)—hereafter the
baseline model—as the main empirical model. The full sample contains 42,340 firm-year
observations. We use ETR and CETR to measure tax avoidance. A positive coefficient on each
of the two managerial ability measures would indicate that higher levels of managerial ability are
associated with lower levels of tax avoidance, thus, providing support for hypothesis.
4.1. Baseline regression results
Table 2 presents the results of the baseline model using ordinary least squares (OLS)
regressions with firm-clustered, heteroskedasticity-robust standard errors. We use the MA score
as the test variable in Columns 1 and 3 and the MA rank as the test variable in columns 2 and 4.
Column 1 results show that the coefficient on the MA score is 0.078 and is significant at the 1%
level (t value=8.09) when we use ETR as the measure of tax avoidance. In Column 3, the
coefficient on the MA score is 0.142 and is significant at the 1% level (t value=12.39) when we
use CETR as the measure of tax avoidance. We also find that the results are consistent when we
use the MA rank as the measure of managerial ability. Overall, these results show that firms with
higher managerial ability are associated with lower tax avoidance after controlling for firm
characteristics, industry and year effects.
[Insert Table 2 here]
The results are also economically meaningful. For example, a one-percentage-point
increase in the MA score is associated with 0.078 percentage-point increase in ETR. Similarly,
19
given that the average ETR of the sample firms is 30.41%, a one standard deviation increase of
the MA score (about 13.57 percentage-points) is associated with around 0.32%
(0.32%=0.00087×30.41%×13.57) increase of ETR. Because the mean sample pretax income is
about $178 million, a one-standard-deviation increase in the MA score is associated with about
$0.57 million (0.57 = 178×0.0032) additional tax expenses each year. The results for CETR as
our tax avoidance measure are even more economically important. Specifically, we find that a
one-standard-deviation increase in the MA score is associated with an approximately 0.59%
increase of CETR, and consequently is associated with about $1.05 million additional cash tax
paid each year.
The coefficients on the control variables are generally consistent with those reported in
the extant literature (e.g., Chen et al. 2010; Hope et al. 2013; Hoi et al. 2013). Small firms, those
with high M/B, leverage, NOL, cash holdings and a low change of NOL are more likely to avoid
taxes.
Overall, the results from the baseline regressions show that firms with higher managerial
ability are associated with lower levels of tax avoidance compared to firms with lower
managerial ability. These results are supportive of our hypothesis.
4.2. Sensitivity tests and robustness checks
4.2.1. Additional controls
There is evidence that earnings quality is positively related to managerial ability
(Demerjian et al. 2012) and negatively related to tax avoidance (Frank et al. 2009). Therefore,
we include Discretionary accruals as an additional control in the baseline regression models to
ensure that the association between managerial ability and tax avoidance is not driven by
20
earnings quality. We use the performance-adjusted modified cross-sectional Jones model to
measure Discretionary accruals. Furthermore, various monitoring mechanisms could affect tax
avoidance. We use the following three variables to capture both internal and external monitoring
mechanisms. First, following Hartzell and Starks (2003), we use a Herfindahl Index of
institutional investor ownership concentration to capture the intensity of internal monitoring by
institutional investors. Institutional ownership (13f) data are from Thomson Reuters Ownership
Database. Second, we use Auditor industry expertise and Big N to control for external auditor
quality. Following Casterella et al. (2004) and Dunn and Mayhew (2004), we define Auditor
industry expertise as an indicator variable equal to one if the client’s audit-firm audits at least 20%
of sales in the client’s two-digit SIC-code industry, and zero otherwise. Big N is an indicator
variable which equals one if a firm is audited by a Big N auditor, and zero otherwise. The auditor
quality data is obtained from Compustat database. Third, we use Analyst coverage to control for
the intensity of external monitoring from analysts. Analyst coverage is measured as the number
of analyst following the firm. We obtain the information from the Institutional Brokers’ Estimate
System (I/B/E/S).
We report the results in Panel A of Table 3. Our sample size is reduced by more than
one-half after adding those additional controls. Nonetheless, we find that the coefficients on all
measures of managerial ability remain positive and statistically significant at the 1% level. Thus,
our main finding is not driven by earnings quality and the intensity of monitoring mechanisms.
With regard to their impact on ETR and CETR, we find, consistent with Kim et al. (2011), that
Analyst coverage is negatively related, indicating that high analyst coverage is associated with
higher tax avoidance. One possible explanation could be the higher market pressures from
financial analysts which lead managers to engage in more aggressive tax avoidance as a means
21
of meeting their forecasts. This type of behavior is also documented by Malmendier and Tate
(2009) who find that CEOs who receive substantial press coverage conduct more earnings
management. In contrast, consistent with the findings of Khurana and Moser (2013), there is
some evidence that firms with higher institutional ownership are less likely to avoid taxes.
Specifically, the coefficients on Institutional ownership concentration are positive and significant
when ETR is the dependent variable. Lastly, we do not find significant coefficients on earnings
quality and auditor quality measures.
Finally, we also estimated additional regressions where we used the CEO’s Vega to
control for managerial equity incentives and a corporate governance index (G-Index) to control
for managerial entrenchment. All our results hold and for brevity, we do not tabulate the results.
[Insert Table 3 here]
4.2.2. Omitted variable bias
We include common determinants of tax avoidance in our baseline model. In Section
4.2.1, we also include earnings quality and various monitoring mechanisms. However, our model
specifications could still be omitting unknown firm characteristics which could lead to
alternative explanations of our findings. To ease this concern, we run firm fixed-effect
regressions to control for the influence of unknown firm-level factors. We report the results in
Table 3, Panel B. The firm fixed-effect regression results are similar to those from the baseline
model. In particular, all coefficients on managerial ability measures are positive and significant
at the 1% level, indicating that that baseline regression results are not plagued by serious omitted
variable problems.
22
4.2.3. Fama-MacBeth regression results
To mitigate statistical concerns arising from serial dependence of regression errors, we
estimate the baseline model of Equation (2) using the Fama-MacBeth (1973) method. More
specifically, we drop the year dummies from the specification, estimate the revised models by
year, and then test the statistical significance of the average coefficients using a t-test. The results
are reported in Panel C of Table 3. Overall, the Fama-MacBeth regression results are consistent
with the baseline regression results. That is, the coefficients on all managerial ability measures
are positive and statistically significant at the 1% level.
4.2.4. Difference-in-differences analyses
To mitigate the endogenous concern, we apply a difference-in-differences approach. We
focus on two types of CEO turnovers made by firms initially run by low-managerial ability
CEOs. In the first type, firms make a lateral change by switching to another low-managerial
ability CEOs (the control sample). In the second type, firms increase managerial ability by
switching to a high-managerial ability CEOs (the treatment sample). We use Dummy (Low-to-
high firms) to define whether a firm is a treatment firm or a control firm. This variable (Low-to-
high firms) equals one if a firm has an average MA rank below 0.5 for the pre-transition period
and an average MA rank above 0.5 for the post-transition period, and it equals zero if a firm has
an average MA rank below 0.5 for the pre-transition period and an average MA rank still below
0.5 for the whole post-transition period.5 We use the dummy variable Post to denote observations
following CEO turnovers. We estimate the following specification:
5 Alternatively, we define that Dummy (Low-to-high firms) equals one if a firm has MA rank below 0.5 each year
for the pre-transition period and MA rank above 0.5 each year for the post-transition period, and it equals zero if a
23
Tax avoidancet = f (Dummy(Low-to-high firms), Post, Dummy(Low-to-high firms)*Post,
Firm attributest-1, Industry effects, and Year effects); (3)
If managerial ability has a causal effect on tax avoidance, then firms that switch from a
low-managerial ability to a high-managerial ability (the treatment sample) should have a
significant decrease in tax avoidance following the switch compared to firms that switch from a
low-managerial ability to a low-managerial ability (the control sample).
We obtain CEO turnover information from ExecuComp. We construct our CEO turnover
samples using the following filters: (1) Both pre- and post-transition CEOs have to be CEOs for
three consecutive years excluding the transition year; (2) To avoid the confounding effect of
multiple CEO turnovers on our results, if a firm changes its CEO more than once, we only count
the first CEO turnover and discard subsequent CEO turnovers in our sample period. The
resulting sample is then merged with our tax avoidance sample. Defining our data in this manner,
our treatment sample consists of 38 low-to-high firms and our control sample consists of 110
low-to-low firms.
Panel A of Table 4 reports the difference-in-differences test results. Columns 1 and 2
contain results where ETR and CETR are the dependent variables. We find that for both models,
the coefficients on Dummy(Low-to-high firms)*Post are significantly positive. The results
suggest that if a firm switches from a low-managerial ability CEO to a high-managerial ability
CEO, its tax avoidance is significantly reduced compared to a firm that switches from a low-
managerial ability CEO to a low-managerial ability CEO. These results show that managerial
ability has a negative causal effect on tax avoidance and they further mitigate the endogeneity
concern.
firm has MA rank below 0.5 each year for the pre-transition period and MA rank still below 0.5 each year for the
post-transition period. All our results in the difference-in-difference analyses hold.
24
[Insert Table 4 here]
To the extent that managerial ability is a factor that drives tax avoidance changes
following CEO turnovers, we would expect an increase in the degree of tax avoidance if firms
change their CEOs from high-managerial ability to low-managerial ability. To examine if this is
the case, we construct a treatment sample of firms switching from high-managerial ability to
low-managerial ability using the same criteria as described above. We also construct a control
sample of firms switching from high-managerial ability to high-managerial ability. Our final
sample includes 50 high-to-low transition firms (the treatment sample) and 228 high-to-high
transition firms (the control sample). We run difference-in-difference regressions using a
specification similar to Equation (3).
The results are reported in Panel B of Table 4. Again, we use ETR and CETR as the
dependent variables in columns 1 and 2, respectively. For brevity, we do not report results on
control variables. We find that for both models, the coefficients on Dummy(High-to-low
firms)*Post are significantly negative, indicating that if a firm switches from a high-managerial
ability CEO to a low-managerial ability CEO, its tax avoidance level is significantly increased
compared to a firm that switches from a high-managerial ability CEO to a high-managerial
ability CEO. These results triangulate the findings from the high-to-low transition sample and
they mitigate endogeneity concerns.
4.2.5. Alternative measures of tax avoidance
25
Prior studies find that book-tax differences could reflect tax avoidance practices. Mills
(1998) finds that firms with large book-tax differences are more likely to be audited by the IRS
and have larger proposed audit adjustments. Wilson (2009) finds that book-tax differences are
larger for firms accused of engaging in tax shelters than for a matched sample of non-accused
firms. These findings indicate that book-tax differences reflect tax avoidance activities. In this
section, we use three commonly used measures based on book-tax differences to capture tax
avoidance. We use the Manzon and Plesko (2002) book-tax difference, BT, as the first measure
of tax avoidance. Appendix A provides detailed information of all tax avoidance measures,
including BT and those we discuss below.
Book-tax differences could reflect earnings management. Desai and Dharmapala (2006)
use a regression method to remove the influence of earnings management on book-tax
differences. They argue that the residual from this regression method is a more precise measure
of tax avoidance activities. We use the Desai and Dharmapala (2006) measure, DD_BT, as our
second alternative measure of tax avoidance.
Frank et al. (2009) argue that book-tax differences have a temporary and a permanent
component, and it is the permanent book-tax differences, DTAX, that captures a firm’s
aggressive tax planning strategies. Frank et al. (2009) find that DTAX is significantly related to
actual cases of tax sheltering. Recent studies have used DTAX to capture tax avoidance practices
(Balakrishnan et al. 2012; Rego and Wilson 2012). Following this practice, we use DTAX as the
third alternative measure of tax avoidance.
Table 5 presents the regression results using OLS with clustered standard errors at the
firm level. The dependent variables are BT (Columns 1 and 2), DD_BT (Columns 3 and 4), and
DTAX (Columns 5 and 6). In Columns 1, 3 and 5, we use the MA score as the measure of
26
managerial ability, and in Columns 2, 4 and 6, we use the MA rank as the measure of managerial
ability. Table 6 shows that all six coefficients on managerial ability measures are negative and
statistically significant at the 1% level. These estimates indicate that, based on all three measures
of book-tax differences, firms with higher managerial abilities have a significantly lower level of
tax avoidance., The results triangulate results from ETR and CETR and they lend further support
to our hypothesis.
[Insert Table 5 here]
4.2.6. Alternative measures of managerial ability
Our main managerial ability measure is the managerial efficiency metric developed by
Demerjian et al. (2012). As we discussed earlier, although it is a better measure of managerial
ability compared to other measures, it is still possibly measured with error. In this section,
following Fee and Hadlock (2003), we further use the historical stock returns as an alternative
measure of managerial ability. We define R as the five-year stock returns (year t-5, t-1) using
monthly CRSP data. We also create Adjusted R as the five-year value-weighted industry-
adjusted stock returns (year t-5, t-1). Similar to Demerjian et al. (2013), we find that the
spearman correlation coefficient between MA score and R is 0.187, consistent with these two
variables measuring different aspects of managerial ability (Demerjian et al. 2013).
In Table 6, we report results using R and Adjusted R as alternative measures of
managerial ability. We find that the coefficients on R are positive and statistically significant at
the 1% level, and those on Adjusted R are also positive and statistically significant at the 5%
level. The results triangulate our prior findings using MA score as the measure of managerial
27
ability, and further support our hypothesis that managerial ability is negatively related to tax
avoidance.
[Insert Table 6 here]
4.2.7. Using different samples
We use three alternate samples to assess the sensitivity of our findings with respect to
sampling methods. For brevity, we do not tabulate these results. Our baseline regressions are
based on a sample of non-utility and non-finance firm-years. We first expand the sample by
including utility and finance firm-years. Second, there were two important regulatory events in
1993 which could affect the consistent measurement of our tax avoidance variables. First,
FAS109, accounting for income taxes was enacted. Second, the statutory corporate income tax
rate increased from 34% to 35%. Therefore, we use a reduced sample excluding observations
before 1994. Third, our sample period contains a major financial crisis during 2008-2009. To
purge the impact of the financial crisis on our results, we construct a reduced sample using only
firm-year observations during the pre-crisis period. Our results remain unchanged in all three
samples; the estimates on the managerial ability variables retain the same signs and statistical
significance in all empirical models.
4.3. Managerial ability and tax aggressiveness
So far our results provide strong evidence that managerial ability is negatively related to
tax avoidance. Our measures of tax avoidance (ETR, CETR, BT, DD_BT and DTAX) are more
likely to capture broad tax avoidance including both certain and uncertain tax positions. It is
28
important, especially from a policy implication perspective, to establish a more direct association
between managerial ability and more aggressive tax avoidance practices (hereafter tax
aggressiveness) such as tax sheltering and tax noncompliance. Hanlon and Heitzman (2010, p.
137) refer to tax aggressiveness as the most extreme subset of tax planning activities that are
“pushing the envelope of tax law”. In this section, we provide empirical evidence on the relation
between managerial ability and tax aggressiveness.
4.3.1. Using Wilson’s (2009) tax sheltering probability to capture tax aggressiveness
Prior studies use the incidences of a tax audit adjustment from the IRS as a proxy for
noncompliance (Mills 1998; Mills and Sansing 2000). Likewise, incidences of a tax shelter
position disclosed in the firm’s tax return on Form 8886 or IRS Schedule M-3 (Lisowsky 2010;
Lisowsky et al. 2012) and public disclosures of large tax shelter cases (Graham and Tucker 2006)
have been used as proxies for tax sheltering activities. However, empirical analyses based on
these measures may be subject to selection bias and endogeneity issues (Hanlon and Heitzman
2010). Moreover, data requirements for cases of tax sheltering and IRS audit adjustment have
limited prior studies to analyzing small samples that require access to confidential IRS data.
Using actual sheltering cases, Wilson (2009) develops a model to predict the likelihood
that a firm engages in tax sheltering activities. Kim et al. (2011) and Rego and Wilson (2012)
find that Wilson’s (2009) sheltering probabilities have construct validity. Recent studies find that
sheltering probabilities are associated with the stock price crash risk (Kim et al. 2011), the
sensitivity of a manager’s wealth to stock return volatility (Rego and Wilson 2012), and
irresponsible corporate social activities (Hoi et al. 2013). Following these studies, we use
29
Wilson’s tax sheltering probability to capture incidence of the most aggressive avoidance
practices as follows. The tax sheltering probability equation is:
Shelter = –4.86 + 5.20 × BT+ 4.08 ×|Discretional accruals|– 0.41 × Leverage + 0.76 ×
AT+ 3.51 × ROA + 1.72 × Foreign income+ 2.43× R&D, (4)
where Shelter is the tax sheltering probability; AT is the log of total assets; R&D is the research
and development expenses divided by total assets; and other variables are as defined before. We
use Shelter as the dependent variable and estimate the baseline model again using OLS
regressions with robust standard errors clustered at the firm level.
[Insert Table 7 here]
Columns 1 and 2 of Table 7 report results when we use Shelter as the dependent variable
to measure tax aggressiveness. We find that the coefficient on MA score is negative and
statistically significant at the 1% level, indicating that firms with higher managerial ability are
associated with lower probabilities of engaging in tax sheltering activities. We find consistent
result when we use MA rank as the measure of managerial ability. Overall, the results show that
managerial ability is negatively related to tax aggressiveness.
4.3.2. Using Rego and Wilson (2013) predicted UTB to capture tax aggressiveness
FIN 48 was enacted in June 2006 and became effective for all publicly listed companies
with fiscal year beginning after December 15, 2006. It represents a dramatic and abrupt change
in the accounting and the disclosure of the tax reserve for uncertain tax positions. Uncertain tax
positions are tax positions that may or may not be sustained upon IRS audit. The tax reserves
30
associated with a firm’s uncertain tax positions are termed uncertain tax benefits, henceforth
UTB.
Prior studies suggest that FIN 48 tax reserves could provide incremental information
concerning the aggressiveness of a firm’s tax planning strategies. There is evidence of a positive
association between the UTB level and aggressive tax avoidance practices (Frischmann et al.
2008; Cazier et al. 2009). Moreover, Lisowsky et al. (2013) find that the UTB level is positively
associated with tax sheltering activities.
As actual UTBs are only available after 2006, Rego and Wilson (2013) develop a model
to predict UTB levels of firms. They find that the predicted UTB is positively related to
executives’ risk-incentives. Following Rego and Wilson (2013), we use the following model to
estimate the predicted UTB level for each firm/year;
PredictedUTB=0.004+0.011×ROA+0.001×AT+0.01×Foreign_income+0.092×R&D+0.002×Disc
retionary_accruals+0.003×Leverage+(0.001)×M/B+0.014×SG&A-0.018×Sale_growth,(5)
where SG&A is selling, general & administrative expenses divided by beginning of year total
assets; Sale growth is the three-year average sales growth rate; and other variables are as defined
before.
Columns 3 and 4 of Table 7 report results when we use predicted UTB as the dependent
variable to measure tax aggressiveness. We find that the both coefficients on managerial ability
measures are negative and statistically significant at the 1% level, indicating firms with higher
managerial ability is associated with lower levels of predicted UTB. The results further confirm
the negative relation between managerial ability and tax aggressiveness.
4.3.3. Using International tax haven subsidies to capture tax aggressiveness
31
We next examine whether our results still hold if we use an alternative measure of tax
aggressiveness- namely the usage of international tax haven subsidies. Prior studies (e.g., Hines
and Rice 1994; Dyreng and Lindsay 2009) find that firms with the usage of tax haven countries
for financial and operating activities have extensive transfer pricing activities and lower effective
tax rates. We expect that firms with higher managerial abilities have lower incentives to use
international tax haven subsidies to avoid taxes.
We obtain tax haven data from Scott Dyreng personal webpage.6 Scott Dyreng provides
data on the number of haven countries reported in firms’ Exhibit 21 in their10-K. Exhibit 21 is a
required element of a firm’s 10-K and includes a listing of all of the firms subsidiaries with
material operations. We create an indicator variable Tax haven which equals one if a firm has at
least one tax haven country subsidy, and zero otherwise. The tax haven countries are defined in
Table 1 in Dyreng and Lindsay (2009).
We use Tax haven as the dependent variable and estimate Logit regressions with robust
standard errors clustered at the firm level. The results are reported in Columns 5 and 6 of Table 7.
We find that both coefficients on managerial ability measures are negative and statistically
significant, indicating that firms with higher managerial ability are less likely to use international
tax haven subsidies to avoid taxes.7
4.3.4. Cross-sectional analysis on the market reactions to tax sheltering news
News of company involvement in tax shelters could convey incremental information
about the firm’s tax aggressiveness. Hanlon and Slemrod (2009) find a small but negative stock
market reaction when there is news about a firm’s involvement in tax shelters. In this section, we
6 The website link is https://sites.google.com/site/scottdyreng/Home/data-and-code.
7 Following Donohoe and Knechel (2013), we also use dummy variables of industry adjusted top quintile of ETR
and CETR to capture tax aggressiveness and we find consistent results.
32
further investigate the cross-sectional relation between managerial ability and the tax shelter
event window returns. We expect a positive relation between managerial ability and cumulative
abnormal returns (CAR) if investors consider managerial ability when reacting to tax shelter
news.
Hanlon and Slemrod (2009) identify a comprehensive sample of 108 news-events
concerning company involvement in tax shelters during the period 1990-2004. We use this
sample for our tax-shelter news analysis.8 We run event studies to get the three-day CAR (-1, 1)
and one-day CAR (0, 0). We run OLS regressions using CAR (-1, 1) and CAR (0, 0) as
dependent variables. Our test variables and control variables are those used in the baseline
regression model. Due to the missing information of independent variables, our final simple size
is 47 observations.
Table 8 reports the results. When we use CAR (-1, 1) as the dependent variable, both
coefficients on managerial ability measures are positive and statistically significant at the 5%
level. When we use CAR (0, 0) as the dependent variable, both coefficients on managerial ability
measures are positive and statistically significant at the 1% level. Overall, the results indicate
that investors do consider managerial ability in a positive way when reacting to tax sheltering
news.
[Insert Table 8 here]
4.4. Subsample tests
In this paper, we hypothesize that because of their superior abilities to increase firm value,
higher ability managers have less incentives to engage in tax avoidance activities than lower
ability managers. To justify our conjecture, we provide subsample tests to directly test it.
8 We thank Michelle Hanlon and Joel Slemrod for providing the data.
33
We separate the full sample into two groups: high ability firms and low ability firms
based on the median value of MA score. We then run the baseline regression model for each
subsample. We are interested in comparing coefficients on tax avoidance measures between
these two groups. We expect that if managerial ability is the underlying driver of tax avoidance,
we should observe higher coefficient on low ability firms compared to that on high ability firms.
The results are reported in Panel A of Table 9. For brevity, we do not report results on the
control variables. We first use ETR as the dependent variable and the results are in Columns 1
and 2. We find that the coefficient on ETR for high ability firms is 0.049 while it is 0.099 for low
ability firms. We conduct an F-test and find that the difference (0.049-0.099 = -0.050) is
statistically significant at the 10% level. In Columns 3 and 4, we report results when we use
CETR as the dependent variable. We find that the coefficient for high ability firms is 0.098 while
it is 0.221 for low ability firms, and the coefficient difference between the two subsamples is
statistically significant at the 1% level. Overall, our results from the subsample tests support our
hypothesis and show that firms with lower managerial ability have stronger incentives to avoid
tax compared to firms with higher managerial ability.
[Insert Table 9 here]
Desai and Dharmapala (2009) find that there is a positive impact of tax avoidance on firm
value for firms with good governance. They explain the results from the agency cost (managerial
rent extraction) perspective. In our earlier tests, we controlled for both internal and external
governance mechanisms and find that our results hold. In this subsection, we further explore
whether the negative relation between managerial ability and tax avoidance varies with the level
of corporate governance.
34
Following Desai and Dharmapala (2006, 2009), we use the Gompers et al. (2003) G-
index to capture the quality of corporate governance. In particular, we separate the full sample
into two subsamples based on the median value of G-indxe (= 9). A higher G-index value
indicates lower corporate governance. We run the baseline regressions for the two subsamples
separately and then compare the two coefficients on the MA score for the two samples.
The results are reported in Panel B of Table 9. Again, for brevity, we do not report results
on the control variables. We first use ETR as the dependent variable and the results are in
Columns 1 and 2. We find that the coefficient on ETR for good governance firms is 0.057.
Although the coefficient (= 0.068) on ETR for bad governance firms is slightly higher, there is
no statistically difference between the two subsample coefficients. In columns 3 and 4, we report
results when we use CETR as the dependent variable. We find that the coefficient for good
governance firms is 0.054 and it is 0.071 for bad governance firms, and the coefficient difference
between two subsamples is statistically insignificant. We further use institutional ownership and
analyst coverage as alternative proxies for corporate governance. Again, we do not find any
significant differences between firms with good governance and firms with bad governance. For
brevity, we do not tabulate the results. Overall, our results from these subsample tests indicate
that as managerial ability is an inherent individual characteristic, the impact of managerial ability
on tax avoidance is not conditional on the level of corporate governance.
5. Conclusion
We examine the relation between managerial ability and corporate tax avoidance.
Although managerial ability is shown to increase firm value, tax avoidance is not necessarily a
value enhancing strategy. Therefore, it is not theoretically clear whether more able managers are
associated with more tax avoidance. We argue that the optimal level of tax avoidance should be
35
determined by the incremental value of tax avoidance policies but not the amount of tax savings
alone. Rational managers should devote their time in projects that offer the highest positive value.
When manager’s opportunity cost increases, the incremental value added by tax avoidance is
reduced and tax avoidance becomes a less attractive investment, given other things equal.
Using a sample of 42,340 firm-year observations for 7,001 U.S. firms between 1988 and
2009, we find that firms with more able managers are associated with significantly lower level of
tax avoidance after controlling for firm characteristics, industry effect and year effect. Our
results hold for a series of robustness checks used to mitigate measurement error bias, omitted
variable bias, and endogeneity concerns of our results.
Our study makes several contributions to the literature. First, we provide strong evidence
regarding the role of managers in corporate decisions by showing that the ability of managers
matters in corporate tax avoidance. Second, we extend the work by Dyreng et al. (2010) by
providing a potential explanation (managerial ability) of managerial fixed effects on tax
avoidance. Third, our paper also relates to Demerjian et al. (2013). Along with Demerjian et al.
(2013), we show that higher ability managers are associated with higher accounting qualities,
including both financial reporting quality and tax reporting quality. Thus, our findings have
important public policy implications.
36
References
Armstrong, C., Blouin, J., Larcker, D., 2012. The Incentives for Tax Planning. Journal of
Accounting and Economics 53, 391-411.
Baik, B., D. Farber, and S. Lee. 2011. CEO ability and management earnings forecasts.
Contemporary Accounting Research 28, 1645–1668.
Balakrishnan, K., Blouin, J., Guay, W., 2012. Does tax aggressiveness reduce financial reporting
transparency? Working paper, University of Pennsylvania.
Bamber, L. S., J. Jiang, and I. Y. Wang. 2010. What's my style? The influence of top managers
on voluntary corporate financial disclosure. The Accounting Review 85 (4): 1131-1162.
Bertrand, M., Schoar, A., 2003. Managing with Style: The Effects of Managers on Firm Policies.
The Quarterly Journal of Economics 118, 1169-1208.
Bradley, M., Jarrell, G. A., Kim, E. H., 1984. On the Existence of an Optimal Capital Structure.
Journal of Finance 34 (1984), 857–878.
Casterella, J.R., Francis, J. R., Lewis, P. L., Walker, P. L., 2004. Auditor Industry Specialization,
Client Bargaining Power, and Audit Pricing, Auditing: A Journal of Theory and Practice 23,
123-140.
Cazier, R., S. Rego, X. Tian, and R. Wilson. 2009. Early evidence on the determinants of
unrecognized tax benefits. Working paper, University of Iowa.
Chalmers, K., Godfrey, G., 2004. Reputation Costs: The Impetus for Voluntary Derivative
Financial Instrument Reporting. Accounting, Organizations and Society 29, 95–125.
Chen, S., Chen, X., Cheng, Q., Shevlin, T., 2010. Are Family Firms More Tax Aggressive than
non-family firms? Journal of Financial Economics 95, 41-61.
Chyz, J.A., Leung, W.S., Li, O.Z., Rui, O.M., 2013. Labor unions and tax aggressiveness.
Journal of Financial Economics 108, 675–698.
Chyz, J.A., 2013. Personally Tax aggressive Executives and Corporate Tax Sheltering. Journal
of Accounting Economics 56, 311-328.
Cloyd, C.B., Mills, L., Weaver, C., 2003. Firm Valuation Effects of the Expatriation of U.S.
Corporations to Tax-haven Countries. Journal of the American Taxation Association 25, 87-109.
Cyert, R. M., March, J. G., 1963. A Behavioral Theory of the Firm. Englewood Cliffs, NJ:
Prentice-Hall.
DiMaggio, P., Powell, W., 1983. The Iron Cage Revisited: Institutional Isomorphism and
Collective Rationality in Organizational Fields. American Sociological Review 48, 147–160.
37
Demerjian, P., Lev, B., McVay, S., 2012. Quantifying Managerial Ability: A New Measure and
Validation Tests. Managerial Science 58, 1229-1248.
Demerjian, P., Lev, B., McVay, S., 2013. Managerial Ability and Earning Quality. The
Accounting Review 88, 463-498.
Desai, M., Dharmapala D., 2006. Corporate Tax Avoidance and High-powered Incentives.
Journal of Financial Economics 79, 145-179.
Desai, M., Dharmapala, D., 2009. Corporate Tax Avoidance and Firm Value. The Review of
Economics and Statistics 91, 537-546.
Desai, M., Hines, J., 2002. Expectations and Expatriations: Tracing the Causes and
Consequences of Corporate inversions. National Tax Journal 55, 409-440.
Donohoe, M., Knechel, W.R., 2013. Does corporate tax aggressiveness influence audit pricing.
Contemporary Accounting Research, forthcoming.
Dyreng, S., Lindsay, B., 2009. Using Financial Accounting Data to Examine the Effect of
Foreign Operations Located in Tax Havens and other Countries on US Multinational Firms' Tax
Rates. Journal of Accounting Research47, 1283-1316.
Dyreng, S., Hanlon, M., Maydew, E., 2010. The effects of executives on corporate tax avoidance.
The Accounting Review, Forthcoming.
Dunn, K., Mayhew, B. W., 2004. Audit Firm Industry Specialization and Client Disclosure
Quality. Review of Accounting Studies 9, 35-58.
Fama, E. F., MacBeth, J. D., 1973. Risk, Return, and Equilibrium: Empirical Tests. The Journal
of Political Economy 81, 607-636.
Fazzari, S., Hubbard, R. G., Petersen, B., 1988. Financing Constraints and Corporate Investment.
Brookings Papers on Economic Activity 1, 141–195.
Fee C., Hadlock, C., 2003. Raids, Rewards, and Reputations in the Market for Managerial Talent.
Review of Financial Studies 16, 1315–1357.
Frank, M., Lynch, L., Rego, S., 2009. Tax reporting aggressiveness and its relation to aggressive
financial reporting. The Accounting Review 84, 467-496.
Frischmann, P., Shevlin, T., Wilson, R., 2008. Economic Consequences of Increasing the
Conformity in Accounting for Uncertain Tax Benefits. Journal of Accounting and Economics 46,
261-278.
38
Gompers, P., Ishii, J., Metrick, A., 2003. Corporate governance and equity prices. The Quarterly
Journal of Economics 118, 107–155.
Graham, J., Tucker, A., 2006. Tax Shelters and Corporate Debt Policy. Journal of Financial
Economics 81, 563-594.
Graham, J. R., M. Hanlon, T. J. Shevlin, and N. Shroff. 2013. Incentives for Tax Planning and
Avoidance: Evidence from the Field. The Accounting Review, Forthcoming.
Hambrick, D., 2007. Upper Echelons Theory: An Update. Academy of Management Review 32,
334–343.
Hambrick, D. C., Mason, P. A., 1984. Upper Echelons: The Organization as a Reflection of its
Top Managers. Academy of Management Review 9, 193–206.
Hambrick, D., Geletkanycz, M., Fredrickson, J., 1993. Top Executive Commitment to the Status
Quo: Some Tests of Its Determinants. Strategic Management Journal 14, 401–418.
Hanlon, M., Slemrod. J., 2009. What Does Tax Aggressiveness Signal? Evidence from Stock
Price Reactions to News about Tax Shelter Involvement. Journal of Public Economics 93, 126-
141.
Hanlon, M., Heitzman, S., 2010. A Review of Tax Research. Journal of Accounting and
Economics 50, 127-178.
Hannan, M., Freeman, J., 1977. The Population Ecology of Organizations. American Journal of
Sociology 82, 929–964.
Harris, M., Holmstrom, B., 1987. A Theory of Wage Dynamics. The Review of Economic
Studies 49, 315-333.
Hartzell, J. C., Starks, L. T., 2003. Institutional Investors and Executive Compensation. Journal
of Finance 58, 2351-2374.
Hasan, I., S. Hoi, Q. Wu, and H., Zhang. 2013. Beauty Is in the Eye of the Beholder: The Effect
of Corporate Tax Avoidance on the Cost of Bank Loans. Journal of Financial Economics,
forthcoming.
Hines, J., Rice, E., 1994. Fiscal paradise: foreign tax havens and American business. Quarterly
Journal of Economics 109, 149-182.
Hitt, M., Tyler, B., 1991. Strategic Decision Models: Integrating Different Perspectives.
Strategic Management Journal 12, 327–351.
39
Hoi, C. K., Wu, Q., Zhang, H., 2013. Is Corporate Social Responsibility (CSR) Associated with
Tax Avoidance? Evidence from Irresponsible CSR Activities. The Accounting Review 88, 2025-
2059
Hope, O., Ma, M., Thomas, W. B., 2013. Tax Avoidance and Geographic Earnings Disclosure,
Journal of Accounting and Economics 56, 170-189.
Johnson, B., Magee, R., Nagarajan, N., Newman, H., 1985. An Analysis of the Stock Price
Reaction to Sudden Executive Deaths: Implications for the Managerial Labor Market, Journal of
Accounting Economics 7, 151-174.
Kaplan, S., Zingales, L., 1997. Do Investment-Cash Flow Sensitivities Provide Useful Measures
of Financing Constraints? Quarterly Journal of Economics 112, 169–215.
Kim, J., Li, Y., Zhang, L., 2011. Corporate Tax Avoidance and Stock Price Crash Risk: Firm-
Level Analysis. Journal of Financial Economics 100, 639-662.
Khurana, I. K., Moser, W. J., 2013. Institutional Shareholders' Investment Horizons and Tax
Avoidance. The Journal of the American Taxation Association35, 111-134.
Lieberson, S., O’Connor, J., 1972. Leadership and Organizational Performance: A Study of
Large Corporations. American Sociological Review 37, 117–130.
Lisowsky, P., 2010. Seeking Shelter: Empirically Modeling Tax Shelters using Financial
Statement Information. The Accounting Review 85, 1693-1720.
Lisowsky, P., Robinson, L., Schmidt, A., 2010. An examination of FIN 48: Tax Shelters, auditor
independence, and corporate governance. Working paper, University of Illinois.
Lisowsky, P., Robinson, L., Schmidt, A., 2013. Do Publicly Disclosed Tax Reserves Tell Us
About Privately Disclose d Tax Shelter Activity? Journal of Accounting Research, Forthcoming.
Malmendier, I., Tate, G., 2009. Superstar CEOs. The Quarterly Journal of Economics 124, 1593-
1638.
Manzon, J. B., Plesko, G. A., 2002. The Relation Between Financial and Tax Reporting
Measures of Income. Tax Law Review 55, 175-214.
March, J. G., Simon, H. A., 1958. Organizations. New York: Wiley.
Mills, L., 1998. Book-tax Differences and Internal Revenue Service adjustments. Journal of
Accounting Research 36, 343-356.
Mills, L., Erickson, M.M., Maydew, E.L., 1998. Investments in tax planning. Journal of the
American Taxation Association 20, 1–20.
40
Mills, L. F., Sansing, R. C., 2000. Strategic Tax and Financial Reporting Decisions: Theory and
Evidence. Contemporary Accounting Research 17, 85–106.
Pérez-González, F., 2006. Inherited Control and Firm Performance. American Economic Review
96, 1559-1588.
Rego, S. O., 2003. Tax-Avoidance Activities of U.S. Multinational Corporations. Contemporary
Accounting Research 20, 805-833.
Rego, S. O., Wilson, R. J., 2012. Equity Risk Incentives and Corporate Tax Aggressiveness.
Journal of Accounting Research 50, 775-810.
Rose, N. L., Shepard, A., 1997. Firm Diversification and CEO Compensation: Managerial
Ability or Executive Entrenchment. The RAND Journal of Economics 28, 489-514.
Shackelford, D., Shevlin,T., 2001. Empirical Tax Research in Accounting, Journal of
Accounting and Economics 31, 321-387.
Scholes, M., Wolfson, M., Erickson, M., Maydew, E., Shevlin, T., 2009. Taxes and Business
Strategy: A Planning Approach (4th edition), Pearson Prentice Hall, Upper Saddle River, NJ.
Shevlin, T., 2007. The Future of Tax Research: From an Accounting Professor’s Perspective.
Journal of the American Taxation Association 29, 87-93.
Shevlin, T., Shackelford, D. A., 2001. Empirical Tax Research in Accounting. Journal of
Accounting and Economics 31, 321-387.
Slemrod, J., Yitzhaki, S. 2002. Tax avoidance, evasion, and administration. In: Auerbach, A.,
Feldstein, M., (Eds.). Handbook of Public Economics, Vol. 3. Amsterdam: Elsevier Science.
1423-1470.
Slemrod, J., 2004. The Economics of corporate tax selfishness. National Tax Journal 57, 877-899.
Smith, C. W., Watts, R. L., 1992. The Investment Opportunity Set and Corporate Financing,
Dividend and Compensation Policies. Journal of Financial Economics 32, 263–292.
Spender, J., 1989. Industry Recipes: An Enquiry into the Nature and Sources of Managerial
Judgment. Oxford, U.K.: Blackwell.
Titman, S., Wessels, R., 1988. The Determinants of Capital Structure. Journal of Finance 43, 1–
19.
Weintraub, E. 2002. Neoclassical Economics. In The Concise Encyclopedia of Economics,
edited by D. Henderson. Indiannapolis, IN: Liberty Fund, Inc. Available from
http://www.econlib.org/Library/Encl/NeoclassicalEconomics.html.

41
Wilson, R., 2009. An Examination of Corporate Tax Shelter Participants. The Accounting
Review 84, 969-999.
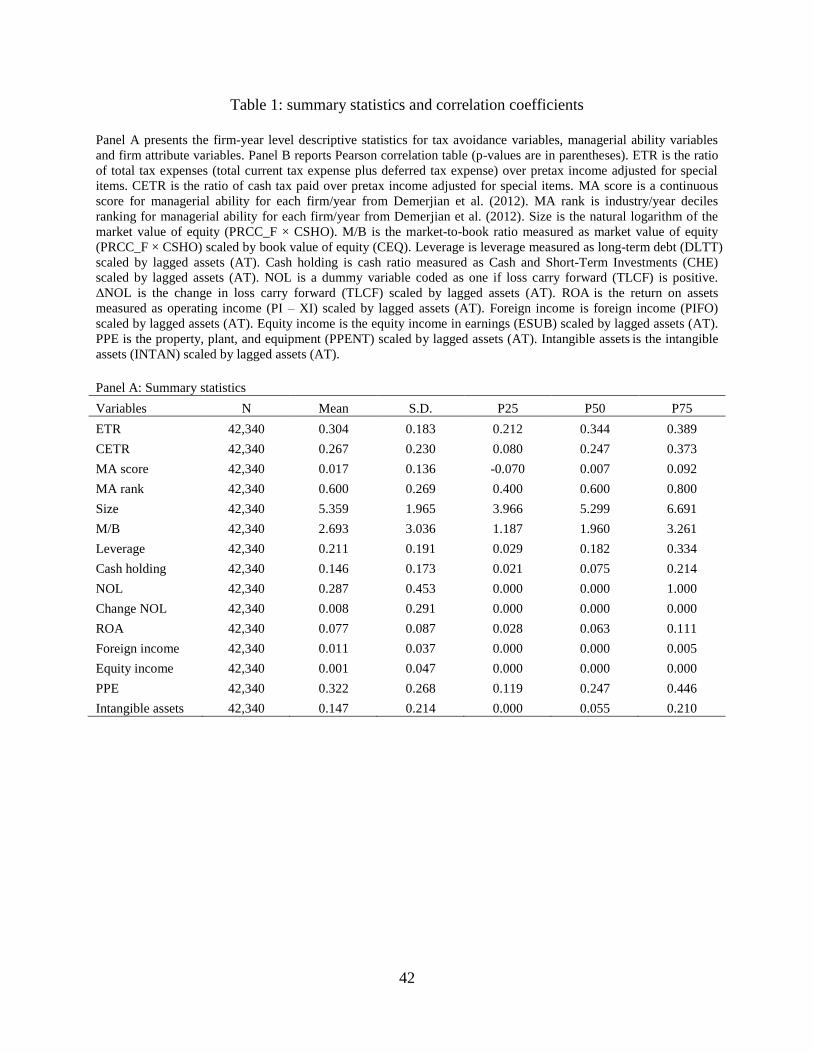
42
Table 1: summary statistics and correlation coefficients
Panel A presents the firm-year level descriptive statistics for tax avoidance variables, managerial ability variables
and firm attribute variables. Panel B reports Pearson correlation table (p-values are in parentheses). ETR is the ratio
of total tax expenses (total current tax expense plus deferred tax expense) over pretax income adjusted for special
items. CETR is the ratio of cash tax paid over pretax income adjusted for special items. MA score is a continuous
score for managerial ability for each firm/year from Demerjian et al. (2012). MA rank is industry/year deciles
ranking for managerial ability for each firm/year from Demerjian et al. (2012). Size is the natural logarithm of the
market value of equity (PRCC_F × CSHO). M/B is the market-to-book ratio measured as market value of equity
(PRCC_F × CSHO) scaled by book value of equity (CEQ). Leverage is leverage measured as long-term debt (DLTT)
scaled by lagged assets (AT). Cash holding is cash ratio measured as Cash and Short-Term Investments (CHE)
scaled by lagged assets (AT). NOL is a dummy variable coded as one if loss carry forward (TLCF) is positive.
ΔNOL is the change in loss carry forward (TLCF) scaled by lagged assets (AT). ROA is the return on assets
measured as operating income (PI – XI) scaled by lagged assets (AT). Foreign income is foreign income (PIFO)
scaled by lagged assets (AT). Equity income is the equity income in earnings (ESUB) scaled by lagged assets (AT).
PPE is the property, plant, and equipment (PPENT) scaled by lagged assets (AT). Intangible assets is the intangible
assets (INTAN) scaled by lagged assets (AT).
Panel A: Summary statistics
Variables N Mean S.D. P25 P50 P75
ETR 42,340 0.304 0.183 0.212 0.344 0.389
CETR 42,340 0.267 0.230 0.080 0.247 0.373
MA score 42,340 0.017 0.136 -0.070 0.007 0.092
MA rank 42,340 0.600 0.269 0.400 0.600 0.800
Size 42,340 5.359 1.965 3.966 5.299 6.691
M/B 42,340 2.693 3.036 1.187 1.960 3.261
Leverage 42,340 0.211 0.191 0.029 0.182 0.334
Cash holding 42,340 0.146 0.173 0.021 0.075 0.214
NOL 42,340 0.287 0.453 0.000 0.000 1.000
Change NOL 42,340 0.008 0.291 0.000 0.000 0.000
ROA 42,340 0.077 0.087 0.028 0.063 0.111
Foreign income 42,340 0.011 0.037 0.000 0.000 0.005
Equity income 42,340 0.001 0.047 0.000 0.000 0.000
PPE 42,340 0.322 0.268 0.119 0.247 0.446
Intangible assets 42,340 0.147 0.214 0.000 0.055 0.210
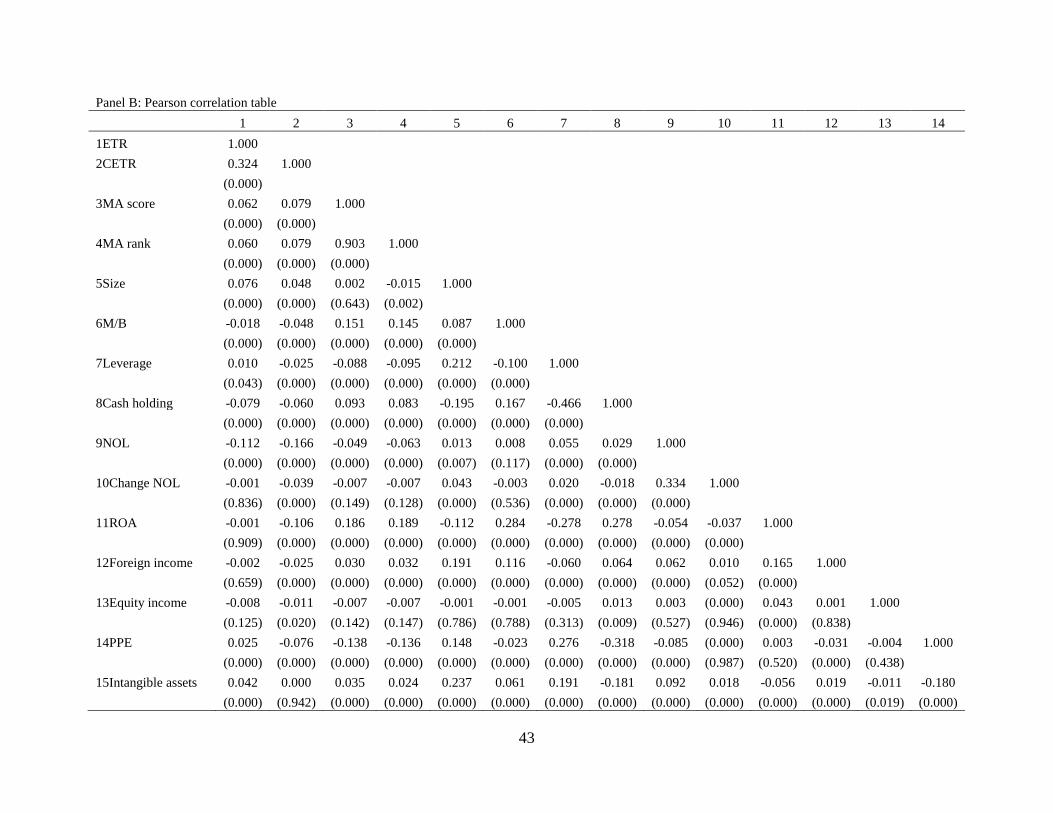
43
Panel B: Pearson correlation table
1 2 3 4 5 6 7 8 9 10 11 12 13 14
1ETR 1.000
2CETR 0.324 1.000
(0.000)
3MA score 0.062 0.079 1.000
(0.000) (0.000)
4MA rank 0.060 0.079 0.903 1.000
(0.000) (0.000) (0.000)
5Size 0.076 0.048 0.002 -0.015 1.000
(0.000) (0.000) (0.643) (0.002)
6M/B -0.018 -0.048 0.151 0.145 0.087 1.000
(0.000) (0.000) (0.000) (0.000) (0.000)
7Leverage 0.010 -0.025 -0.088 -0.095 0.212 -0.100 1.000
(0.043) (0.000) (0.000) (0.000) (0.000) (0.000)
8Cash holding -0.079 -0.060 0.093 0.083 -0.195 0.167 -0.466 1.000
(0.000) (0.000) (0.000) (0.000) (0.000) (0.000) (0.000)
9NOL -0.112 -0.166 -0.049 -0.063 0.013 0.008 0.055 0.029 1.000
(0.000) (0.000) (0.000) (0.000) (0.007) (0.117) (0.000) (0.000)
10Change NOL -0.001 -0.039 -0.007 -0.007 0.043 -0.003 0.020 -0.018 0.334 1.000
(0.836) (0.000) (0.149) (0.128) (0.000) (0.536) (0.000) (0.000) (0.000)
11ROA -0.001 -0.106 0.186 0.189 -0.112 0.284 -0.278 0.278 -0.054 -0.037 1.000
(0.909) (0.000) (0.000) (0.000) (0.000) (0.000) (0.000) (0.000) (0.000) (0.000)
12Foreign income -0.002 -0.025 0.030 0.032 0.191 0.116 -0.060 0.064 0.062 0.010 0.165 1.000
(0.659) (0.000) (0.000) (0.000) (0.000) (0.000) (0.000) (0.000) (0.000) (0.052) (0.000)
13Equity income -0.008 -0.011 -0.007 -0.007 -0.001 -0.001 -0.005 0.013 0.003 (0.000) 0.043 0.001 1.000
(0.125) (0.020) (0.142) (0.147) (0.786) (0.788) (0.313) (0.009) (0.527) (0.946) (0.000) (0.838)
14PPE 0.025 -0.076 -0.138 -0.136 0.148 -0.023 0.276 -0.318 -0.085 (0.000) 0.003 -0.031 -0.004 1.000
(0.000) (0.000) (0.000) (0.000) (0.000) (0.000) (0.000) (0.000) (0.000) (0.987) (0.520) (0.000) (0.438)
15Intangible assets 0.042 0.000 0.035 0.024 0.237 0.061 0.191 -0.181 0.092 0.018 -0.056 0.019 -0.011 -0.180
(0.000) (0.942) (0.000) (0.000) (0.000) (0.000) (0.000) (0.000) (0.000) (0.000) (0.000) (0.000) (0.019) (0.000)
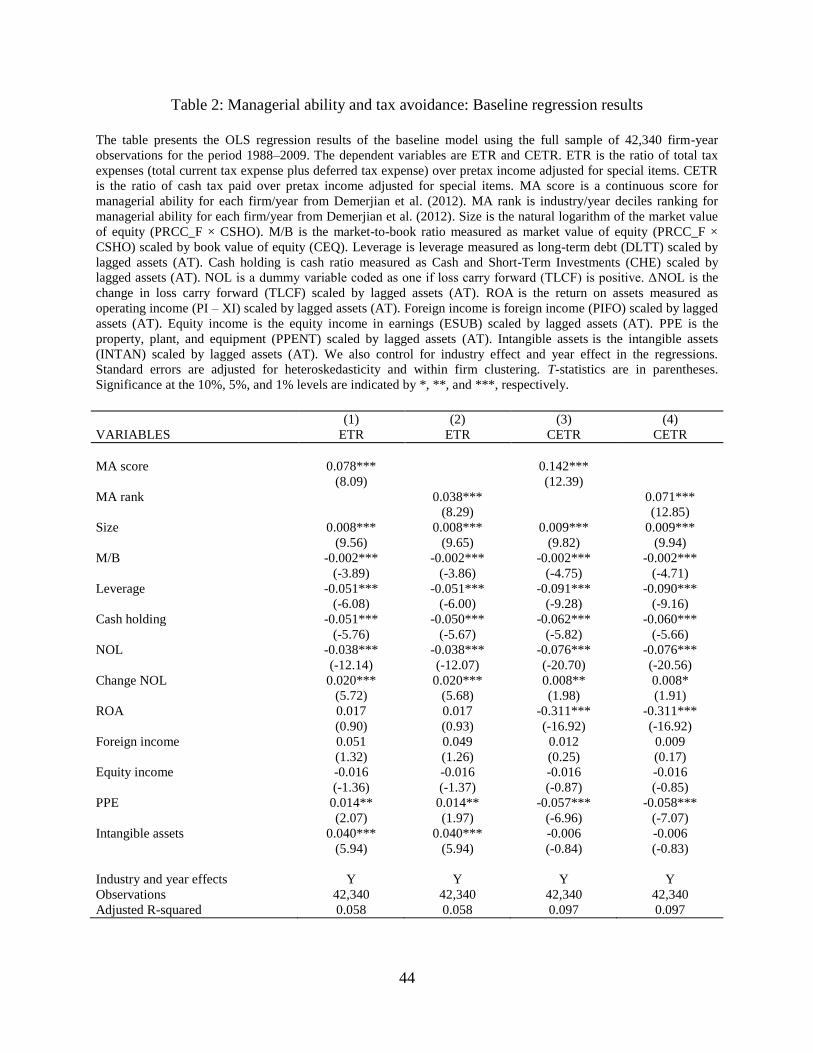
44
Table 2: Managerial ability and tax avoidance: Baseline regression results
The table presents the OLS regression results of the baseline model using the full sample of 42,340 firm-year
observations for the period 1988–2009. The dependent variables are ETR and CETR. ETR is the ratio of total tax
expenses (total current tax expense plus deferred tax expense) over pretax income adjusted for special items. CETR
is the ratio of cash tax paid over pretax income adjusted for special items. MA score is a continuous score for
managerial ability for each firm/year from Demerjian et al. (2012). MA rank is industry/year deciles ranking for
managerial ability for each firm/year from Demerjian et al. (2012). Size is the natural logarithm of the market value
of equity (PRCC_F × CSHO). M/B is the market-to-book ratio measured as market value of equity (PRCC_F ×
CSHO) scaled by book value of equity (CEQ). Leverage is leverage measured as long-term debt (DLTT) scaled by
lagged assets (AT). Cash holding is cash ratio measured as Cash and Short-Term Investments (CHE) scaled by
lagged assets (AT). NOL is a dummy variable coded as one if loss carry forward (TLCF) is positive. ΔNOL is the
change in loss carry forward (TLCF) scaled by lagged assets (AT). ROA is the return on assets measured as
operating income (PI – XI) scaled by lagged assets (AT). Foreign income is foreign income (PIFO) scaled by lagged
assets (AT). Equity income is the equity income in earnings (ESUB) scaled by lagged assets (AT). PPE is the
property, plant, and equipment (PPENT) scaled by lagged assets (AT). Intangible assets is the intangible assets
(INTAN) scaled by lagged assets (AT). We also control for industry effect and year effect in the regressions.
Standard errors are adjusted for heteroskedasticity and within firm clustering. T-statistics are in parentheses.
Significance at the 10%, 5%, and 1% levels are indicated by *, **, and ***, respectively.
(1) (2) (3) (4)
VARIABLES ETR ETR CETR CETR
MA score 0.078*** 0.142***
(8.09) (12.39)
MA rank 0.038*** 0.071***
(8.29) (12.85)
Size 0.008*** 0.008*** 0.009*** 0.009***
(9.56) (9.65) (9.82) (9.94)
M/B -0.002*** -0.002*** -0.002*** -0.002***
(-3.89) (-3.86) (-4.75) (-4.71)
Leverage -0.051*** -0.051*** -0.091*** -0.090***
(-6.08) (-6.00) (-9.28) (-9.16)
Cash holding -0.051*** -0.050*** -0.062*** -0.060***
(-5.76) (-5.67) (-5.82) (-5.66)
NOL -0.038*** -0.038*** -0.076*** -0.076***
(-12.14) (-12.07) (-20.70) (-20.56)
Change NOL 0.020*** 0.020*** 0.008** 0.008*
(5.72) (5.68) (1.98) (1.91)
ROA 0.017 0.017 -0.311*** -0.311***
(0.90) (0.93) (-16.92) (-16.92)
Foreign income 0.051 0.049 0.012 0.009
(1.32) (1.26) (0.25) (0.17)
Equity income -0.016 -0.016 -0.016 -0.016
(-1.36) (-1.37) (-0.87) (-0.85)
PPE 0.014** 0.014** -0.057*** -0.058***
(2.07) (1.97) (-6.96) (-7.07)
Intangible assets 0.040*** 0.040*** -0.006 -0.006
(5.94) (5.94) (-0.84) (-0.83)
Industry and year effects Y Y Y Y
Observations 42,340 42,340 42,340 42,340
Adjusted R-squared 0.058 0.058 0.097 0.097
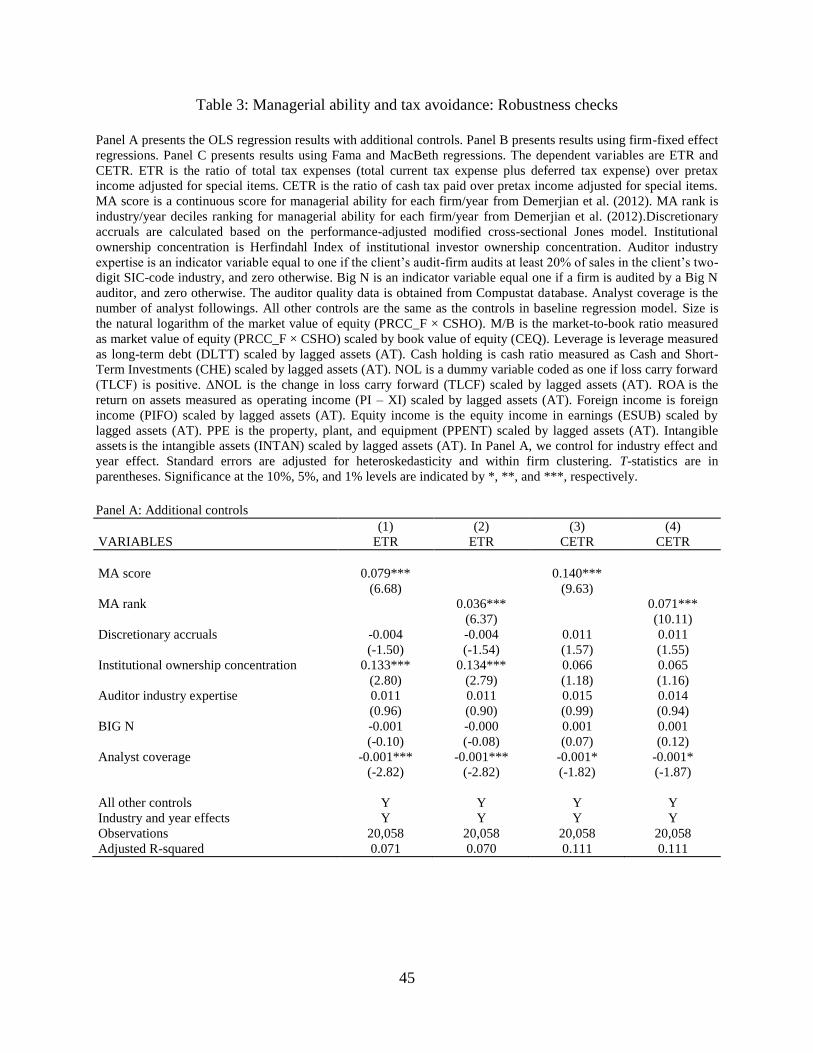
45
Table 3: Managerial ability and tax avoidance: Robustness checks
Panel A presents the OLS regression results with additional controls. Panel B presents results using firm-fixed effect
regressions. Panel C presents results using Fama and MacBeth regressions. The dependent variables are ETR and
CETR. ETR is the ratio of total tax expenses (total current tax expense plus deferred tax expense) over pretax
income adjusted for special items. CETR is the ratio of cash tax paid over pretax income adjusted for special items.
MA score is a continuous score for managerial ability for each firm/year from Demerjian et al. (2012). MA rank is
industry/year deciles ranking for managerial ability for each firm/year from Demerjian et al. (2012).Discretionary
accruals are calculated based on the performance-adjusted modified cross-sectional Jones model. Institutional
ownership concentration is Herfindahl Index of institutional investor ownership concentration. Auditor industry
expertise is an indicator variable equal to one if the client’s audit-firm audits at least 20% of sales in the client’s two-
digit SIC-code industry, and zero otherwise. Big N is an indicator variable equal one if a firm is audited by a Big N
auditor, and zero otherwise. The auditor quality data is obtained from Compustat database. Analyst coverage is the
number of analyst followings. All other controls are the same as the controls in baseline regression model. Size is
the natural logarithm of the market value of equity (PRCC_F × CSHO). M/B is the market-to-book ratio measured
as market value of equity (PRCC_F × CSHO) scaled by book value of equity (CEQ). Leverage is leverage measured
as long-term debt (DLTT) scaled by lagged assets (AT). Cash holding is cash ratio measured as Cash and Short-
Term Investments (CHE) scaled by lagged assets (AT). NOL is a dummy variable coded as one if loss carry forward
(TLCF) is positive. ΔNOL is the change in loss carry forward (TLCF) scaled by lagged assets (AT). ROA is the
return on assets measured as operating income (PI – XI) scaled by lagged assets (AT). Foreign income is foreign
income (PIFO) scaled by lagged assets (AT). Equity income is the equity income in earnings (ESUB) scaled by
lagged assets (AT). PPE is the property, plant, and equipment (PPENT) scaled by lagged assets (AT). Intangible
assets is the intangible assets (INTAN) scaled by lagged assets (AT). In Panel A, we control for industry effect and
year effect. Standard errors are adjusted for heteroskedasticity and within firm clustering. T-statistics are in
parentheses. Significance at the 10%, 5%, and 1% levels are indicated by *, **, and ***, respectively.
Panel A: Additional controls
(1) (2) (3) (4)
VARIABLES ETR ETR CETR CETR
MA score 0.079*** 0.140***
(6.68) (9.63)
MA rank 0.036*** 0.071***
(6.37) (10.11)
Discretionary accruals -0.004 -0.004 0.011 0.011
(-1.50) (-1.54) (1.57) (1.55)
Institutional ownership concentration 0.133*** 0.134*** 0.066 0.065
(2.80) (2.79) (1.18) (1.16)
Auditor industry expertise 0.011 0.011 0.015 0.014
(0.96) (0.90) (0.99) (0.94)
BIG N -0.001 -0.000 0.001 0.001
(-0.10) (-0.08) (0.07) (0.12)
Analyst coverage -0.001*** -0.001*** -0.001* -0.001*
(-2.82) (-2.82) (-1.82) (-1.87)
All other controls Y Y Y Y
Industry and year effects Y Y Y Y
Observations 20,058 20,058 20,058 20,058
Adjusted R-squared 0.071 0.070 0.111 0.111
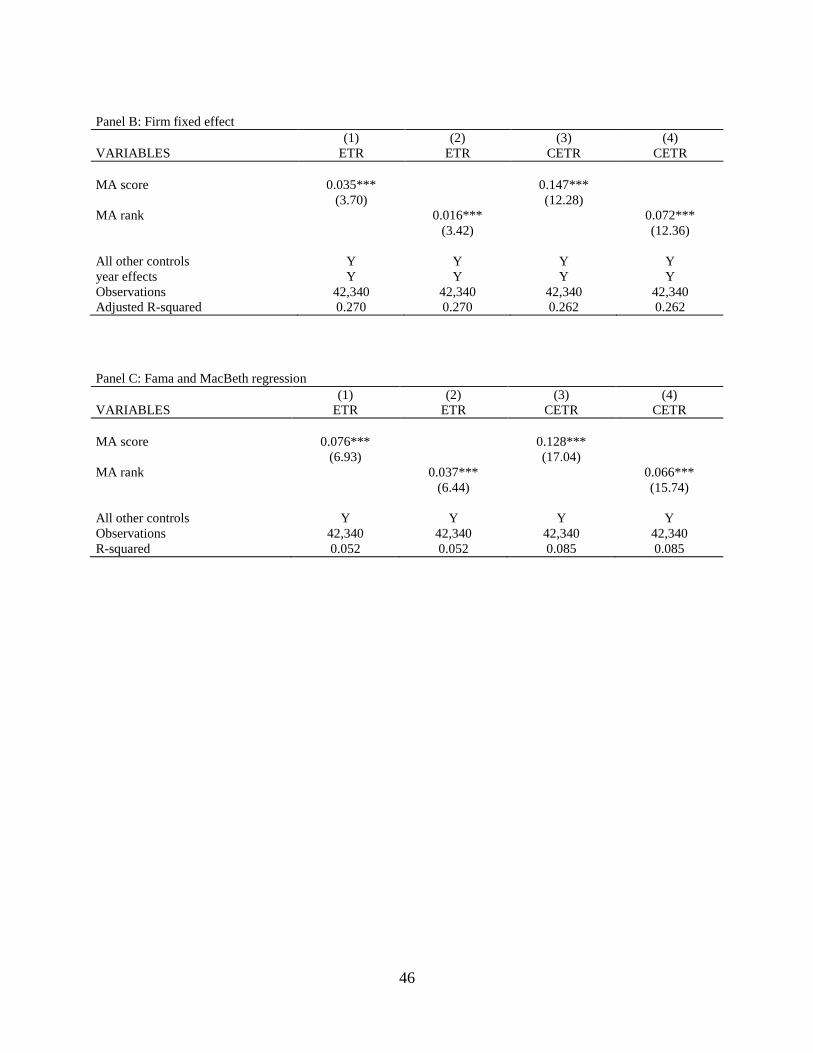
46
Panel B: Firm fixed effect
(1) (2) (3) (4)
VARIABLES ETR ETR CETR CETR
MA score 0.035*** 0.147***
(3.70) (12.28)
MA rank 0.016*** 0.072***
(3.42) (12.36)
All other controls Y Y Y Y
year effects Y Y Y Y
Observations 42,340 42,340 42,340 42,340
Adjusted R-squared 0.270 0.270 0.262 0.262
Panel C: Fama and MacBeth regression
(1) (2) (3) (4)
VARIABLES ETR ETR CETR CETR
MA score 0.076*** 0.128***
(6.93) (17.04)
MA rank 0.037*** 0.066***
(6.44) (15.74)
All other controls Y Y Y Y
Observations 42,340 42,340 42,340 42,340
R-squared 0.052 0.052 0.085 0.085
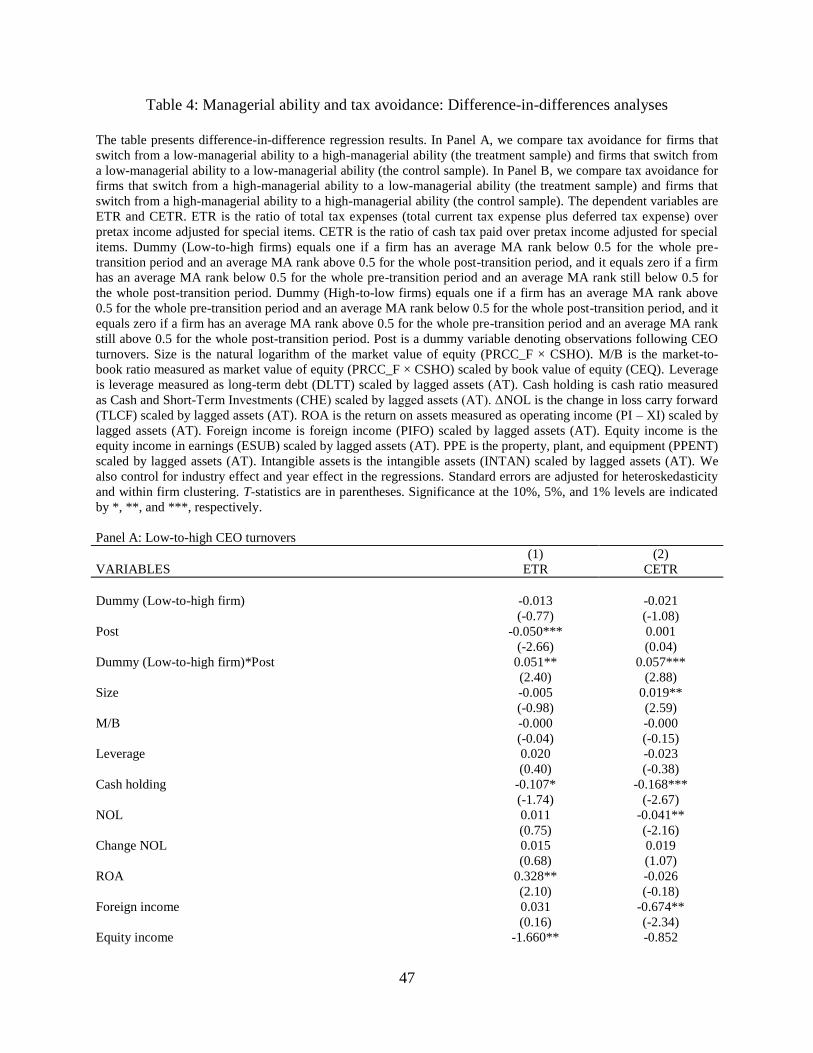
47
Table 4: Managerial ability and tax avoidance: Difference-in-differences analyses
The table presents difference-in-difference regression results. In Panel A, we compare tax avoidance for firms that
switch from a low-managerial ability to a high-managerial ability (the treatment sample) and firms that switch from
a low-managerial ability to a low-managerial ability (the control sample). In Panel B, we compare tax avoidance for
firms that switch from a high-managerial ability to a low-managerial ability (the treatment sample) and firms that
switch from a high-managerial ability to a high-managerial ability (the control sample). The dependent variables are
ETR and CETR. ETR is the ratio of total tax expenses (total current tax expense plus deferred tax expense) over
pretax income adjusted for special items. CETR is the ratio of cash tax paid over pretax income adjusted for special
items. Dummy (Low-to-high firms) equals one if a firm has an average MA rank below 0.5 for the whole pre-
transition period and an average MA rank above 0.5 for the whole post-transition period, and it equals zero if a firm
has an average MA rank below 0.5 for the whole pre-transition period and an average MA rank still below 0.5 for
the whole post-transition period. Dummy (High-to-low firms) equals one if a firm has an average MA rank above
0.5 for the whole pre-transition period and an average MA rank below 0.5 for the whole post-transition period, and it
equals zero if a firm has an average MA rank above 0.5 for the whole pre-transition period and an average MA rank
still above 0.5 for the whole post-transition period. Post is a dummy variable denoting observations following CEO
turnovers. Size is the natural logarithm of the market value of equity (PRCC_F × CSHO). M/B is the market-to-
book ratio measured as market value of equity (PRCC_F × CSHO) scaled by book value of equity (CEQ). Leverage
is leverage measured as long-term debt (DLTT) scaled by lagged assets (AT). Cash holding is cash ratio measured
as Cash and Short-Term Investments (CHE) scaled by lagged assets (AT). ΔNOL is the change in loss carry forward
(TLCF) scaled by lagged assets (AT). ROA is the return on assets measured as operating income (PI – XI) scaled by
lagged assets (AT). Foreign income is foreign income (PIFO) scaled by lagged assets (AT). Equity income is the
equity income in earnings (ESUB) scaled by lagged assets (AT). PPE is the property, plant, and equipment (PPENT)
scaled by lagged assets (AT). Intangible assets is the intangible assets (INTAN) scaled by lagged assets (AT). We
also control for industry effect and year effect in the regressions. Standard errors are adjusted for heteroskedasticity
and within firm clustering. T-statistics are in parentheses. Significance at the 10%, 5%, and 1% levels are indicated
by *, **, and ***, respectively.
Panel A: Low-to-high CEO turnovers
(1) (2)
VARIABLES ETR CETR
Dummy (Low-to-high firm) -0.013 -0.021
(-0.77) (-1.08)
Post -0.050*** 0.001
(-2.66) (0.04)
Dummy (Low-to-high firm)*Post 0.051** 0.057***
(2.40) (2.88)
Size -0.005 0.019**
(-0.98) (2.59)
M/B -0.000 -0.000
(-0.04) (-0.15)
Leverage 0.020 -0.023
(0.40) (-0.38)
Cash holding -0.107* -0.168***
(-1.74) (-2.67)
NOL 0.011 -0.041**
(0.75) (-2.16)
Change NOL 0.015 0.019
(0.68) (1.07)
ROA 0.328** -0.026
(2.10) (-0.18)
Foreign income 0.031 -0.674**
(0.16) (-2.34)
Equity income -1.660** -0.852
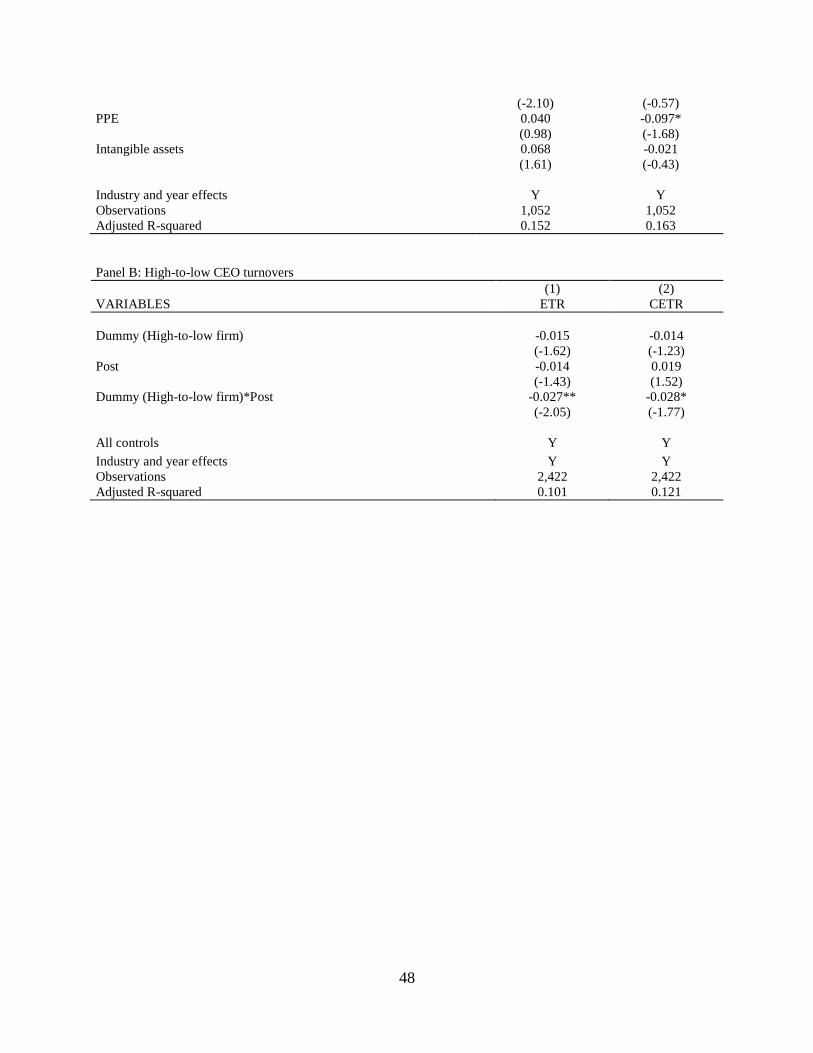
48
(-2.10) (-0.57)
PPE 0.040 -0.097*
(0.98) (-1.68)
Intangible assets 0.068 -0.021
(1.61) (-0.43)
Industry and year effects Y Y
Observations 1,052 1,052
Adjusted R-squared 0.152 0.163
Panel B: High-to-low CEO turnovers
(1) (2)
VARIABLES ETR CETR
Dummy (High-to-low firm) -0.015 -0.014
(-1.62) (-1.23)
Post -0.014 0.019
(-1.43) (1.52)
Dummy (High-to-low firm)*Post -0.027** -0.028*
(-2.05) (-1.77)
All controls Y Y
Industry and year effects Y Y
Observations 2,422 2,422
Adjusted R-squared 0.101 0.121
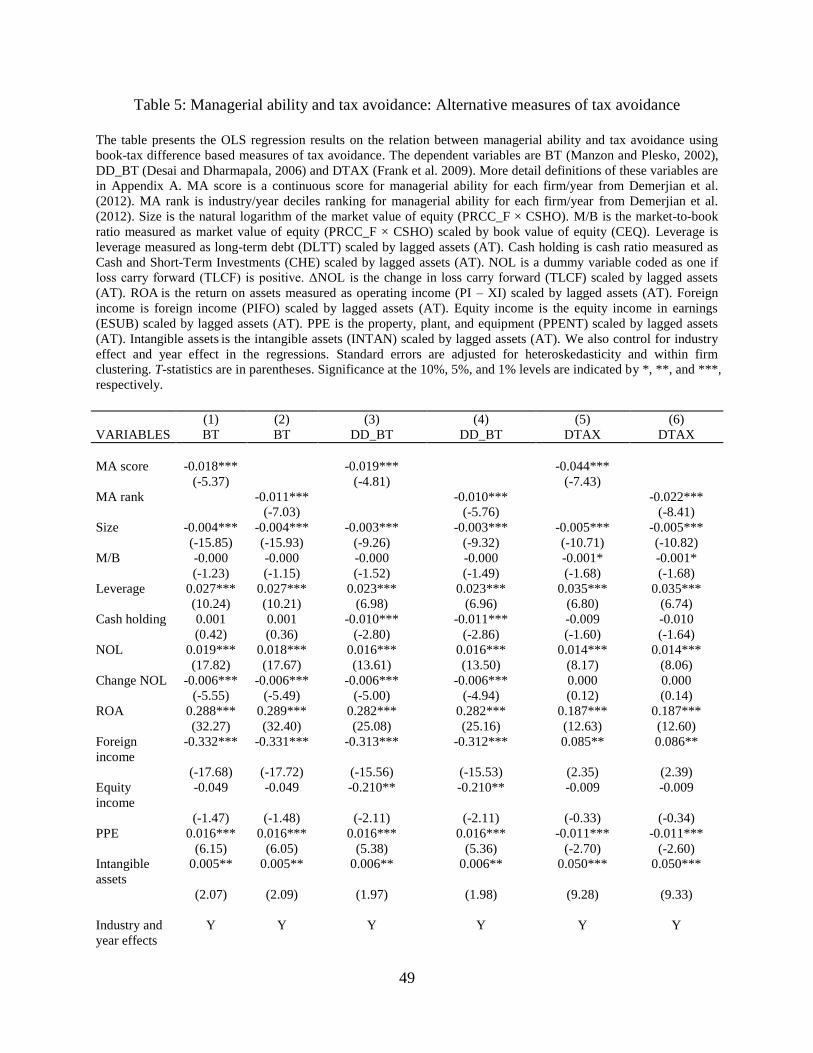
49
Table 5: Managerial ability and tax avoidance: Alternative measures of tax avoidance
The table presents the OLS regression results on the relation between managerial ability and tax avoidance using
book-tax difference based measures of tax avoidance. The dependent variables are BT (Manzon and Plesko, 2002),
DD_BT (Desai and Dharmapala, 2006) and DTAX (Frank et al. 2009). More detail definitions of these variables are
in Appendix A. MA score is a continuous score for managerial ability for each firm/year from Demerjian et al.
(2012). MA rank is industry/year deciles ranking for managerial ability for each firm/year from Demerjian et al.
(2012). Size is the natural logarithm of the market value of equity (PRCC_F × CSHO). M/B is the market-to-book
ratio measured as market value of equity (PRCC_F × CSHO) scaled by book value of equity (CEQ). Leverage is
leverage measured as long-term debt (DLTT) scaled by lagged assets (AT). Cash holding is cash ratio measured as
Cash and Short-Term Investments (CHE) scaled by lagged assets (AT). NOL is a dummy variable coded as one if
loss carry forward (TLCF) is positive. ΔNOL is the change in loss carry forward (TLCF) scaled by lagged assets
(AT). ROA is the return on assets measured as operating income (PI – XI) scaled by lagged assets (AT). Foreign
income is foreign income (PIFO) scaled by lagged assets (AT). Equity income is the equity income in earnings
(ESUB) scaled by lagged assets (AT). PPE is the property, plant, and equipment (PPENT) scaled by lagged assets
(AT). Intangible assets is the intangible assets (INTAN) scaled by lagged assets (AT). We also control for industry
effect and year effect in the regressions. Standard errors are adjusted for heteroskedasticity and within firm
clustering. T-statistics are in parentheses. Significance at the 10%, 5%, and 1% levels are indicated by *, **, and ***,
respectively.
(1) (2) (3) (4) (5) (6)
VARIABLES BT BT DD_BT DD_BT DTAX DTAX
MA score -0.018*** -0.019*** -0.044***
(-5.37) (-4.81) (-7.43)
MA rank -0.011*** -0.010*** -0.022***
(-7.03) (-5.76) (-8.41)
Size -0.004*** -0.004*** -0.003*** -0.003*** -0.005*** -0.005***
(-15.85) (-15.93) (-9.26) (-9.32) (-10.71) (-10.82)
M/B -0.000 -0.000 -0.000 -0.000 -0.001* -0.001*
(-1.23) (-1.15) (-1.52) (-1.49) (-1.68) (-1.68)
Leverage 0.027*** 0.027*** 0.023*** 0.023*** 0.035*** 0.035***
(10.24) (10.21) (6.98) (6.96) (6.80) (6.74)
Cash holding 0.001 0.001 -0.010*** -0.011*** -0.009 -0.010
(0.42) (0.36) (-2.80) (-2.86) (-1.60) (-1.64)
NOL 0.019*** 0.018*** 0.016*** 0.016*** 0.014*** 0.014***
(17.82) (17.67) (13.61) (13.50) (8.17) (8.06)
Change NOL -0.006*** -0.006*** -0.006*** -0.006*** 0.000 0.000
(-5.55) (-5.49) (-5.00) (-4.94) (0.12) (0.14)
ROA 0.288*** 0.289*** 0.282*** 0.282*** 0.187*** 0.187***
(32.27) (32.40) (25.08) (25.16) (12.63) (12.60)
Foreign
income
-0.332*** -0.331*** -0.313*** -0.312*** 0.085** 0.086**
(-17.68) (-17.72) (-15.56) (-15.53) (2.35) (2.39)
Equity
income
-0.049 -0.049 -0.210** -0.210** -0.009 -0.009
(-1.47) (-1.48) (-2.11) (-2.11) (-0.33) (-0.34)
PPE 0.016*** 0.016*** 0.016*** 0.016*** -0.011*** -0.011***
(6.15) (6.05) (5.38) (5.36) (-2.70) (-2.60)
Intangible
assets
0.005** 0.005** 0.006** 0.006** 0.050*** 0.050***
(2.07) (2.09) (1.97) (1.98) (9.28) (9.33)
Industry and
year effects
Y Y Y Y Y Y

50
Observations 35,326 35,326 30,877 30,877 25,058 25,058
Adjusted R-
squared
0.254 0.255 0.187 0.187 0.068 0.068
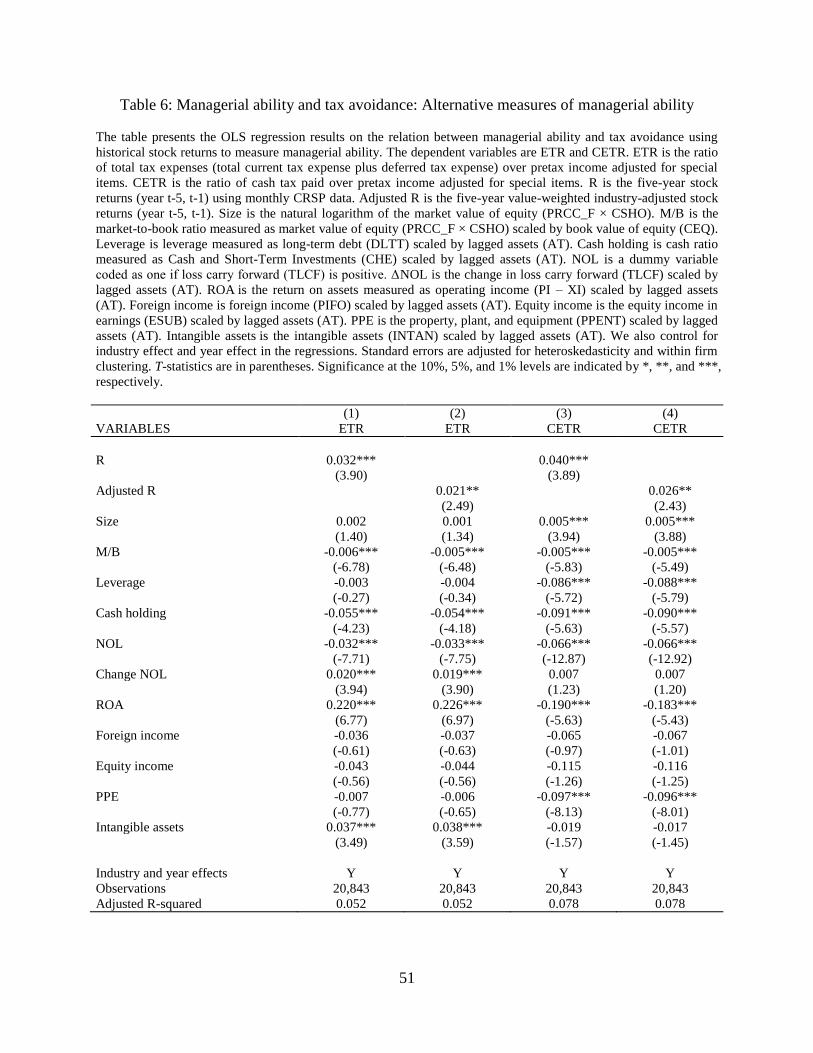
51
Table 6: Managerial ability and tax avoidance: Alternative measures of managerial ability
The table presents the OLS regression results on the relation between managerial ability and tax avoidance using
historical stock returns to measure managerial ability. The dependent variables are ETR and CETR. ETR is the ratio
of total tax expenses (total current tax expense plus deferred tax expense) over pretax income adjusted for special
items. CETR is the ratio of cash tax paid over pretax income adjusted for special items. R is the five-year stock
returns (year t-5, t-1) using monthly CRSP data. Adjusted R is the five-year value-weighted industry-adjusted stock
returns (year t-5, t-1). Size is the natural logarithm of the market value of equity (PRCC_F × CSHO). M/B is the
market-to-book ratio measured as market value of equity (PRCC_F × CSHO) scaled by book value of equity (CEQ).
Leverage is leverage measured as long-term debt (DLTT) scaled by lagged assets (AT). Cash holding is cash ratio
measured as Cash and Short-Term Investments (CHE) scaled by lagged assets (AT). NOL is a dummy variable
coded as one if loss carry forward (TLCF) is positive. ΔNOL is the change in loss carry forward (TLCF) scaled by
lagged assets (AT). ROA is the return on assets measured as operating income (PI – XI) scaled by lagged assets
(AT). Foreign income is foreign income (PIFO) scaled by lagged assets (AT). Equity income is the equity income in
earnings (ESUB) scaled by lagged assets (AT). PPE is the property, plant, and equipment (PPENT) scaled by lagged
assets (AT). Intangible assets is the intangible assets (INTAN) scaled by lagged assets (AT). We also control for
industry effect and year effect in the regressions. Standard errors are adjusted for heteroskedasticity and within firm
clustering. T-statistics are in parentheses. Significance at the 10%, 5%, and 1% levels are indicated by *, **, and ***,
respectively.
(1) (2) (3) (4)
VARIABLES ETR ETR CETR CETR
R 0.032*** 0.040***
(3.90) (3.89)
Adjusted R 0.021** 0.026**
(2.49) (2.43)
Size 0.002 0.001 0.005*** 0.005***
(1.40) (1.34) (3.94) (3.88)
M/B -0.006*** -0.005*** -0.005*** -0.005***
(-6.78) (-6.48) (-5.83) (-5.49)
Leverage -0.003 -0.004 -0.086*** -0.088***
(-0.27) (-0.34) (-5.72) (-5.79)
Cash holding -0.055*** -0.054*** -0.091*** -0.090***
(-4.23) (-4.18) (-5.63) (-5.57)
NOL -0.032*** -0.033*** -0.066*** -0.066***
(-7.71) (-7.75) (-12.87) (-12.92)
Change NOL 0.020*** 0.019*** 0.007 0.007
(3.94) (3.90) (1.23) (1.20)
ROA 0.220*** 0.226*** -0.190*** -0.183***
(6.77) (6.97) (-5.63) (-5.43)
Foreign income -0.036 -0.037 -0.065 -0.067
(-0.61) (-0.63) (-0.97) (-1.01)
Equity income -0.043 -0.044 -0.115 -0.116
(-0.56) (-0.56) (-1.26) (-1.25)
PPE -0.007 -0.006 -0.097*** -0.096***
(-0.77) (-0.65) (-8.13) (-8.01)
Intangible assets 0.037*** 0.038*** -0.019 -0.017
(3.49) (3.59) (-1.57) (-1.45)
Industry and year effects Y Y Y Y
Observations 20,843 20,843 20,843 20,843
Adjusted R-squared 0.052 0.052 0.078 0.078
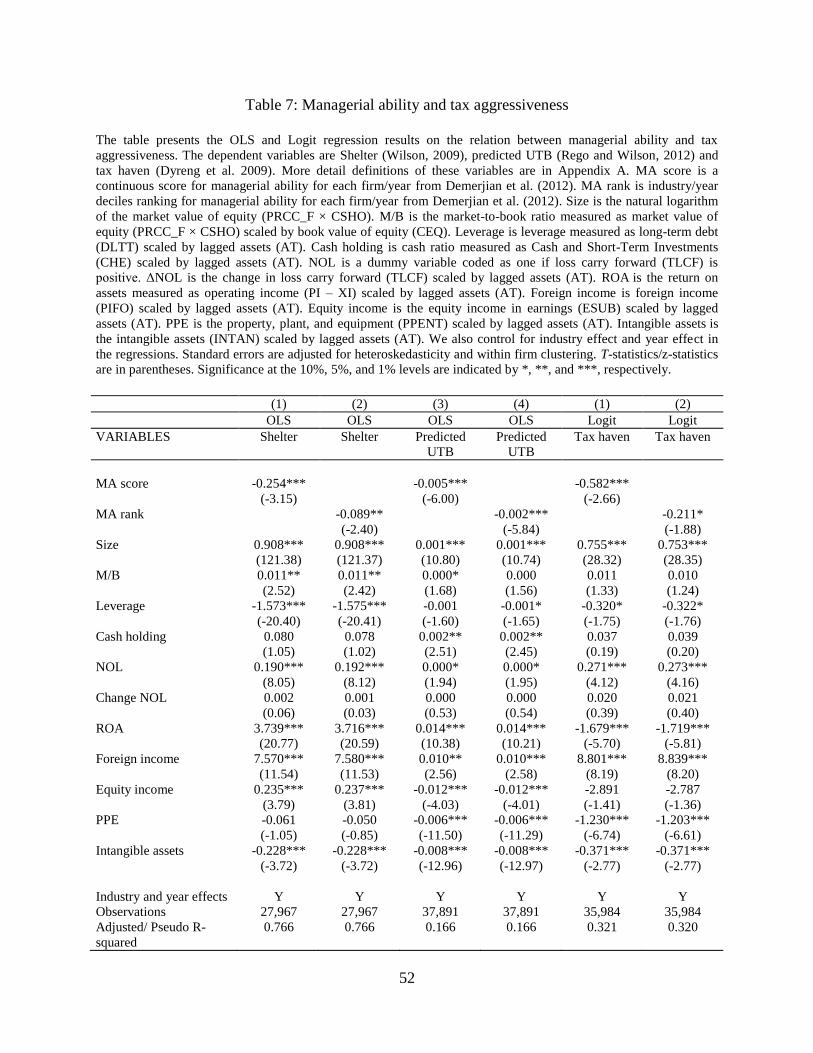
52
Table 7: Managerial ability and tax aggressiveness
The table presents the OLS and Logit regression results on the relation between managerial ability and tax
aggressiveness. The dependent variables are Shelter (Wilson, 2009), predicted UTB (Rego and Wilson, 2012) and
tax haven (Dyreng et al. 2009). More detail definitions of these variables are in Appendix A. MA score is a
continuous score for managerial ability for each firm/year from Demerjian et al. (2012). MA rank is industry/year
deciles ranking for managerial ability for each firm/year from Demerjian et al. (2012). Size is the natural logarithm
of the market value of equity (PRCC_F × CSHO). M/B is the market-to-book ratio measured as market value of
equity (PRCC_F × CSHO) scaled by book value of equity (CEQ). Leverage is leverage measured as long-term debt
(DLTT) scaled by lagged assets (AT). Cash holding is cash ratio measured as Cash and Short-Term Investments
(CHE) scaled by lagged assets (AT). NOL is a dummy variable coded as one if loss carry forward (TLCF) is
positive. ΔNOL is the change in loss carry forward (TLCF) scaled by lagged assets (AT). ROA is the return on
assets measured as operating income (PI – XI) scaled by lagged assets (AT). Foreign income is foreign income
(PIFO) scaled by lagged assets (AT). Equity income is the equity income in earnings (ESUB) scaled by lagged
assets (AT). PPE is the property, plant, and equipment (PPENT) scaled by lagged assets (AT). Intangible assets is
the intangible assets (INTAN) scaled by lagged assets (AT). We also control for industry effect and year effect in
the regressions. Standard errors are adjusted for heteroskedasticity and within firm clustering. T-statistics/z-statistics
are in parentheses. Significance at the 10%, 5%, and 1% levels are indicated by *, **, and ***, respectively.
(1) (2) (3) (4) (1) (2)
OLS OLS OLS OLS Logit Logit
VARIABLES Shelter Shelter Predicted
UTB
Predicted
UTB
Tax haven Tax haven
MA score -0.254*** -0.005*** -0.582***
(-3.15) (-6.00) (-2.66)
MA rank -0.089** -0.002*** -0.211*
(-2.40) (-5.84) (-1.88)
Size 0.908*** 0.908*** 0.001*** 0.001*** 0.755*** 0.753***
(121.38) (121.37) (10.80) (10.74) (28.32) (28.35)
M/B 0.011** 0.011** 0.000* 0.000 0.011 0.010
(2.52) (2.42) (1.68) (1.56) (1.33) (1.24)
Leverage -1.573*** -1.575*** -0.001 -0.001* -0.320* -0.322*
(-20.40) (-20.41) (-1.60) (-1.65) (-1.75) (-1.76)
Cash holding 0.080 0.078 0.002** 0.002** 0.037 0.039
(1.05) (1.02) (2.51) (2.45) (0.19) (0.20)
NOL 0.190*** 0.192*** 0.000* 0.000* 0.271*** 0.273***
(8.05) (8.12) (1.94) (1.95) (4.12) (4.16)
Change NOL 0.002 0.001 0.000 0.000 0.020 0.021
(0.06) (0.03) (0.53) (0.54) (0.39) (0.40)
ROA 3.739*** 3.716*** 0.014*** 0.014*** -1.679*** -1.719***
(20.77) (20.59) (10.38) (10.21) (-5.70) (-5.81)
Foreign income 7.570*** 7.580*** 0.010** 0.010*** 8.801*** 8.839***
(11.54) (11.53) (2.56) (2.58) (8.19) (8.20)
Equity income 0.235*** 0.237*** -0.012*** -0.012*** -2.891 -2.787
(3.79) (3.81) (-4.03) (-4.01) (-1.41) (-1.36)
PPE -0.061 -0.050 -0.006*** -0.006*** -1.230*** -1.203***
(-1.05) (-0.85) (-11.50) (-11.29) (-6.74) (-6.61)
Intangible assets -0.228*** -0.228*** -0.008*** -0.008*** -0.371*** -0.371***
(-3.72) (-3.72) (-12.96) (-12.97) (-2.77) (-2.77)
Industry and year effects Y Y Y Y Y Y
Observations 27,967 27,967 37,891 37,891 35,984 35,984
Adjusted/ Pseudo R-
squared
0.766 0.766 0.166 0.166 0.321 0.320
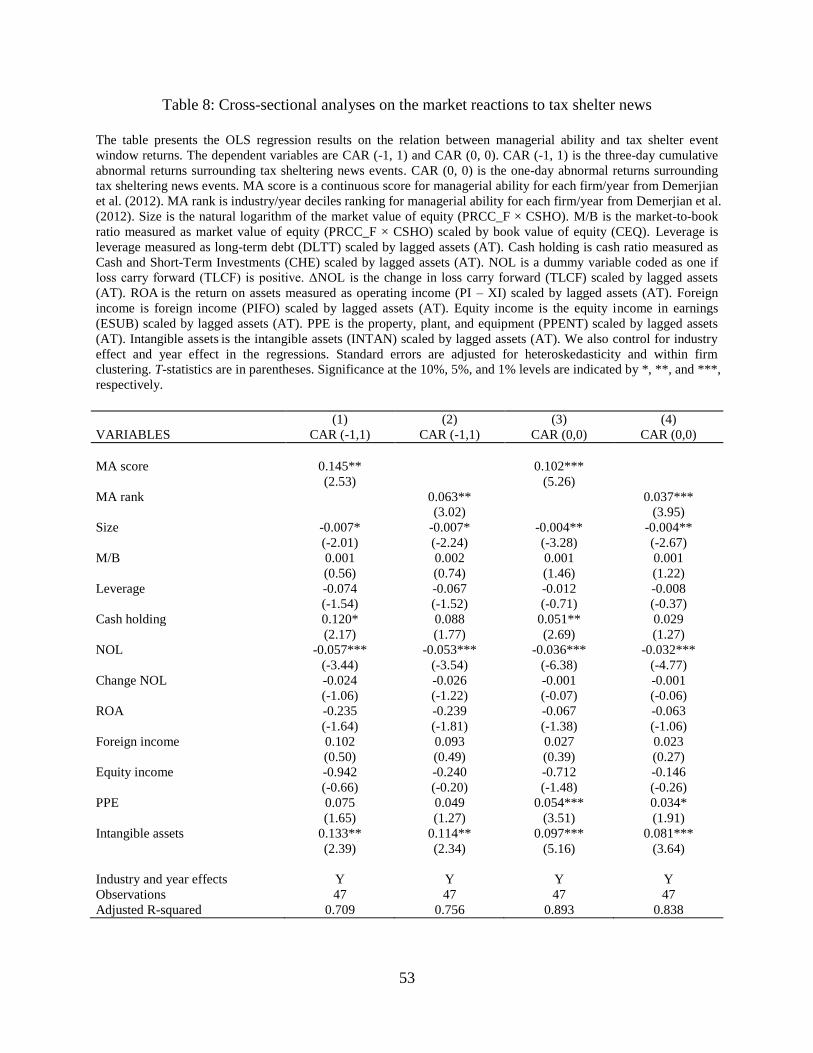
53
Table 8: Cross-sectional analyses on the market reactions to tax shelter news
The table presents the OLS regression results on the relation between managerial ability and tax shelter event
window returns. The dependent variables are CAR (-1, 1) and CAR (0, 0). CAR (-1, 1) is the three-day cumulative
abnormal returns surrounding tax sheltering news events. CAR (0, 0) is the one-day abnormal returns surrounding
tax sheltering news events. MA score is a continuous score for managerial ability for each firm/year from Demerjian
et al. (2012). MA rank is industry/year deciles ranking for managerial ability for each firm/year from Demerjian et al.
(2012). Size is the natural logarithm of the market value of equity (PRCC_F × CSHO). M/B is the market-to-book
ratio measured as market value of equity (PRCC_F × CSHO) scaled by book value of equity (CEQ). Leverage is
leverage measured as long-term debt (DLTT) scaled by lagged assets (AT). Cash holding is cash ratio measured as
Cash and Short-Term Investments (CHE) scaled by lagged assets (AT). NOL is a dummy variable coded as one if
loss carry forward (TLCF) is positive. ΔNOL is the change in loss carry forward (TLCF) scaled by lagged assets
(AT). ROA is the return on assets measured as operating income (PI – XI) scaled by lagged assets (AT). Foreign
income is foreign income (PIFO) scaled by lagged assets (AT). Equity income is the equity income in earnings
(ESUB) scaled by lagged assets (AT). PPE is the property, plant, and equipment (PPENT) scaled by lagged assets
(AT). Intangible assets is the intangible assets (INTAN) scaled by lagged assets (AT). We also control for industry
effect and year effect in the regressions. Standard errors are adjusted for heteroskedasticity and within firm
clustering. T-statistics are in parentheses. Significance at the 10%, 5%, and 1% levels are indicated by *, **, and ***,
respectively.
(1) (2) (3) (4)
VARIABLES CAR (-1,1) CAR (-1,1) CAR (0,0) CAR (0,0)
MA score 0.145** 0.102***
(2.53) (5.26)
MA rank 0.063** 0.037***
(3.02) (3.95)
Size -0.007* -0.007* -0.004** -0.004**
(-2.01) (-2.24) (-3.28) (-2.67)
M/B 0.001 0.002 0.001 0.001
(0.56) (0.74) (1.46) (1.22)
Leverage -0.074 -0.067 -0.012 -0.008
(-1.54) (-1.52) (-0.71) (-0.37)
Cash holding 0.120* 0.088 0.051** 0.029
(2.17) (1.77) (2.69) (1.27)
NOL -0.057*** -0.053*** -0.036*** -0.032***
(-3.44) (-3.54) (-6.38) (-4.77)
Change NOL -0.024 -0.026 -0.001 -0.001
(-1.06) (-1.22) (-0.07) (-0.06)
ROA -0.235 -0.239 -0.067 -0.063
(-1.64) (-1.81) (-1.38) (-1.06)
Foreign income 0.102 0.093 0.027 0.023
(0.50) (0.49) (0.39) (0.27)
Equity income -0.942 -0.240 -0.712 -0.146
(-0.66) (-0.20) (-1.48) (-0.26)
PPE 0.075 0.049 0.054*** 0.034*
(1.65) (1.27) (3.51) (1.91)
Intangible assets 0.133** 0.114** 0.097*** 0.081***
(2.39) (2.34) (5.16) (3.64)
Industry and year effects Y Y Y Y
Observations 47 47 47 47
Adjusted R-squared 0.709 0.756 0.893 0.838
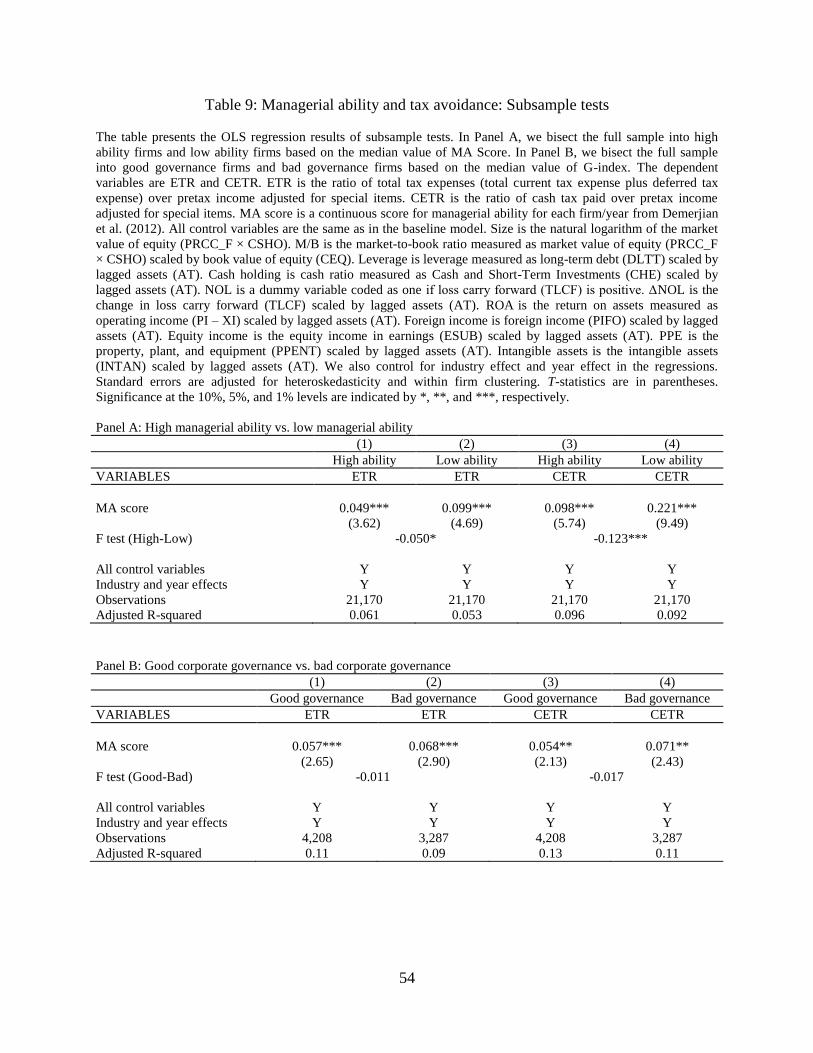
54
Table 9: Managerial ability and tax avoidance: Subsample tests
The table presents the OLS regression results of subsample tests. In Panel A, we bisect the full sample into high
ability firms and low ability firms based on the median value of MA Score. In Panel B, we bisect the full sample
into good governance firms and bad governance firms based on the median value of G-index. The dependent
variables are ETR and CETR. ETR is the ratio of total tax expenses (total current tax expense plus deferred tax
expense) over pretax income adjusted for special items. CETR is the ratio of cash tax paid over pretax income
adjusted for special items. MA score is a continuous score for managerial ability for each firm/year from Demerjian
et al. (2012). All control variables are the same as in the baseline model. Size is the natural logarithm of the market
value of equity (PRCC_F × CSHO). M/B is the market-to-book ratio measured as market value of equity (PRCC_F
× CSHO) scaled by book value of equity (CEQ). Leverage is leverage measured as long-term debt (DLTT) scaled by
lagged assets (AT). Cash holding is cash ratio measured as Cash and Short-Term Investments (CHE) scaled by
lagged assets (AT). NOL is a dummy variable coded as one if loss carry forward (TLCF) is positive. ΔNOL is the
change in loss carry forward (TLCF) scaled by lagged assets (AT). ROA is the return on assets measured as
operating income (PI – XI) scaled by lagged assets (AT). Foreign income is foreign income (PIFO) scaled by lagged
assets (AT). Equity income is the equity income in earnings (ESUB) scaled by lagged assets (AT). PPE is the
property, plant, and equipment (PPENT) scaled by lagged assets (AT). Intangible assets is the intangible assets
(INTAN) scaled by lagged assets (AT). We also control for industry effect and year effect in the regressions.
Standard errors are adjusted for heteroskedasticity and within firm clustering. T-statistics are in parentheses.
Significance at the 10%, 5%, and 1% levels are indicated by *, **, and ***, respectively.
Panel A: High managerial ability vs. low managerial ability
(1) (2) (3) (4)
High ability Low ability High ability Low ability
VARIABLES ETR ETR CETR CETR
MA score 0.049*** 0.099*** 0.098*** 0.221***
(3.62) (4.69) (5.74) (9.49)
F test (High-Low) -0.050* -0.123***
All control variables Y Y Y Y
Industry and year effects Y Y Y Y
Observations 21,170 21,170 21,170 21,170
Adjusted R-squared 0.061 0.053 0.096 0.092
Panel B: Good corporate governance vs. bad corporate governance
(1) (2) (3) (4)
Good governance Bad governance Good governance Bad governance
VARIABLES ETR ETR CETR CETR
MA score 0.057*** 0.068*** 0.054** 0.071**
(2.65) (2.90) (2.13) (2.43)
F test (Good-Bad) -0.011 -0.017
All control variables Y Y Y Y
Industry and year effects Y Y Y Y
Observations 4,208 3,287 4,208 3,287
Adjusted R-squared 0.11 0.09 0.13 0.11
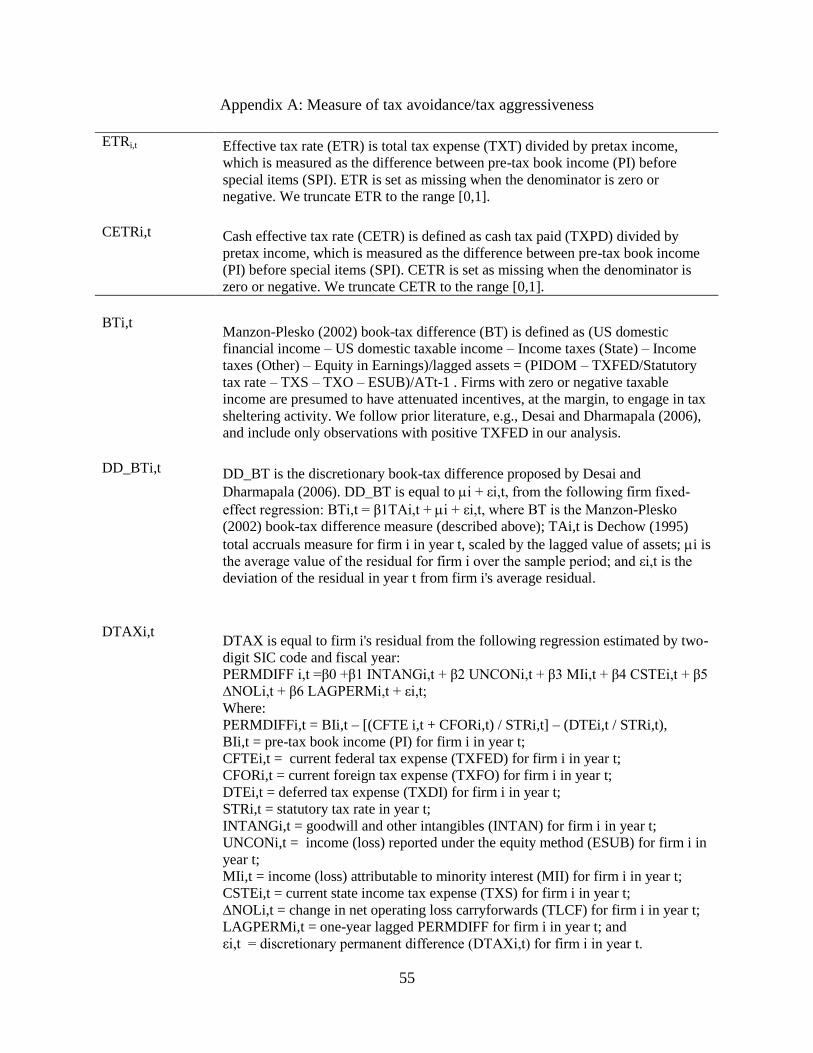
55
Appendix A: Measure of tax avoidance/tax aggressiveness
ETRi,t
Effective tax rate (ETR) is total tax expense (TXT) divided by pretax income,
which is measured as the difference between pre-tax book income (PI) before
special items (SPI). ETR is set as missing when the denominator is zero or
negative. We truncate ETR to the range [0,1]. CETRi,t
Cash effective tax rate (CETR) is defined as cash tax paid (TXPD) divided by
pretax income, which is measured as the difference between pre-tax book income
(PI) before special items (SPI). CETR is set as missing when the denominator is
zero or negative. We truncate CETR to the range [0,1].
BTi,t
Manzon-Plesko (2002) book-tax difference (BT) is defined as (US domestic
financial income – US domestic taxable income – Income taxes (State) – Income
taxes (Other) – Equity in Earnings)/lagged assets = (PIDOM – TXFED/Statutory
tax rate – TXS – TXO – ESUB)/ATt-1 . Firms with zero or negative taxable
income are presumed to have attenuated incentives, at the margin, to engage in tax
sheltering activity. We follow prior literature, e.g., Desai and Dharmapala (2006),
and include only observations with positive TXFED in our analysis. DD_BTi,t
DD_BT is the discretionary book-tax difference proposed by Desai and
Dharmapala (2006). DD_BT is equal to i + εi,t, from the following firm fixed-
effect regression: BTi,t = β1TAi,t + i + εi,t, where BT is the Manzon-Plesko
(2002) book-tax difference measure (described above); TAi,t is Dechow (1995)
total accruals measure for firm i in year t, scaled by the lagged value of assets; i is
the average value of the residual for firm i over the sample period; and εi,t is the
deviation of the residual in year t from firm i's average residual.
DTAXi,t
DTAX is equal to firm i's residual from the following regression estimated by two-
digit SIC code and fiscal year: PERMDIFF i,t =β0 +β1 INTANGi,t + β2 UNCONi,t + β3 MIi,t + β4 CSTEi,t + β5
∆NOLi,t + β6 LAGPERMi,t + εi,t; Where: PERMDIFFi,t = BIi,t – [(CFTE i,t + CFORi,t) / STRi,t] – (DTEi,t / STRi,t), BIi,t = pre-tax book income (PI) for firm i in year t; CFTEi,t = current federal tax expense (TXFED) for firm i in year t; CFORi,t = current foreign tax expense (TXFO) for firm i in year t; DTEi,t = deferred tax expense (TXDI) for firm i in year t; STRi,t = statutory tax rate in year t; INTANGi,t = goodwill and other intangibles (INTAN) for firm i in year t; UNCONi,t = income (loss) reported under the equity method (ESUB) for firm i in year t; MIi,t = income (loss) attributable to minority interest (MII) for firm i in year t; CSTEi,t = current state income tax expense (TXS) for firm i in year t; ∆NOLi,t = change in net operating loss carryforwards (TLCF) for firm i in year t; LAGPERMi,t = one-year lagged PERMDIFF for firm i in year t; and εi,t = discretionary permanent difference (DTAXi,t) for firm i in year t.
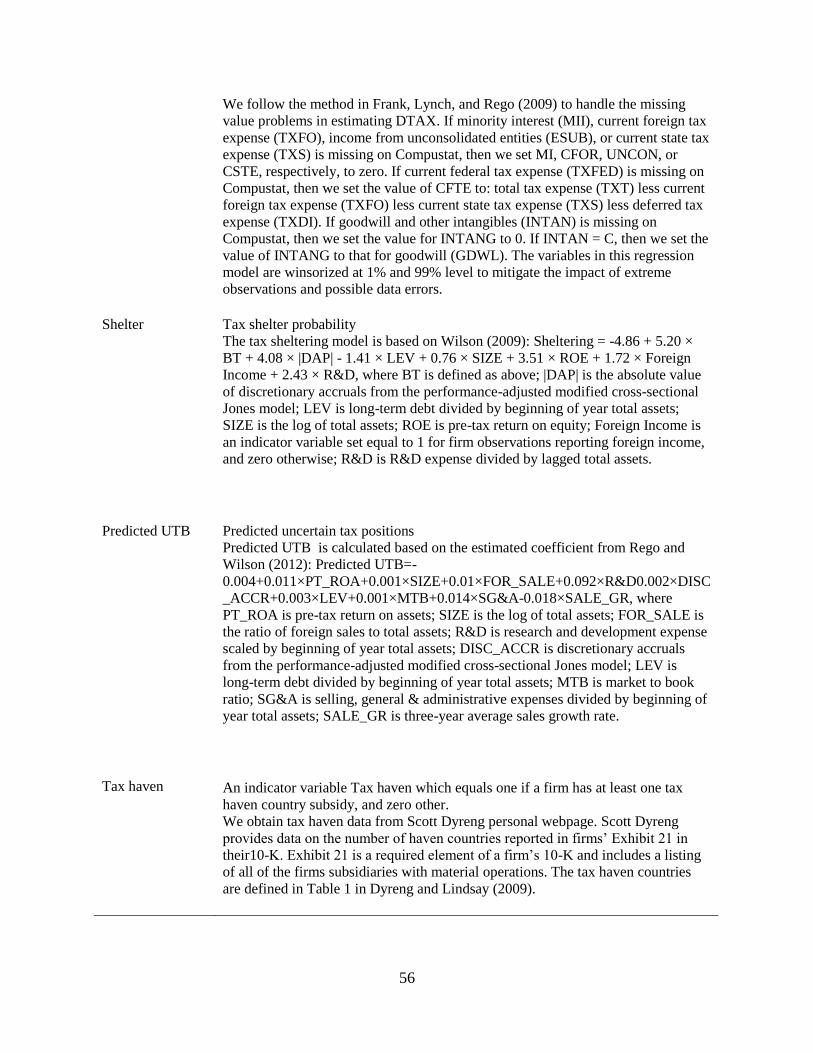
56
We follow the method in Frank, Lynch, and Rego (2009) to handle the missing
value problems in estimating DTAX. If minority interest (MII), current foreign tax
expense (TXFO), income from unconsolidated entities (ESUB), or current state tax
expense (TXS) is missing on Compustat, then we set MI, CFOR, UNCON, or
CSTE, respectively, to zero. If current federal tax expense (TXFED) is missing on
Compustat, then we set the value of CFTE to: total tax expense (TXT) less current
foreign tax expense (TXFO) less current state tax expense (TXS) less deferred tax
expense (TXDI). If goodwill and other intangibles (INTAN) is missing on
Compustat, then we set the value for INTANG to 0. If INTAN = C, then we set the
value of INTANG to that for goodwill (GDWL). The variables in this regression
model are winsorized at 1% and 99% level to mitigate the impact of extreme
observations and possible data errors. Shelter Tax shelter probability
Predicted UTB
The tax sheltering model is based on Wilson (2009): Sheltering = -4.86 + 5.20 ×
BT + 4.08 × |DAP| - 1.41 × LEV + 0.76 × SIZE + 3.51 × ROE + 1.72 × Foreign
Income + 2.43 × R&D, where BT is defined as above; |DAP| is the absolute value
of discretionary accruals from the performance-adjusted modified cross-sectional
Jones model; LEV is long-term debt divided by beginning of year total assets;
SIZE is the log of total assets; ROE is pre-tax return on equity; Foreign Income is
an indicator variable set equal to 1 for firm observations reporting foreign income,
and zero otherwise; R&D is R&D expense divided by lagged total assets.
Predicted uncertain tax positions
Tax haven
Predicted UTB is calculated based on the estimated coefficient from Rego and
Wilson (2012): Predicted UTB=-
0.004+0.011×PT_ROA+0.001×SIZE+0.01×FOR_SALE+0.092×R&D0.002×DISC
_ACCR+0.003×LEV+0.001×MTB+0.014×SG&A-0.018×SALE_GR, where
PT_ROA is pre-tax return on assets; SIZE is the log of total assets; FOR_SALE is
the ratio of foreign sales to total assets; R&D is research and development expense
scaled by beginning of year total assets; DISC_ACCR is discretionary accruals
from the performance-adjusted modified cross-sectional Jones model; LEV is
long-term debt divided by beginning of year total assets; MTB is market to book
ratio; SG&A is selling, general & administrative expenses divided by beginning of
year total assets; SALE_GR is three-year average sales growth rate.
An indicator variable Tax haven which equals one if a firm has at least one tax
haven country subsidy, and zero other.
We obtain tax haven data from Scott Dyreng personal webpage. Scott Dyreng
provides data on the number of haven countries reported in firms’ Exhibit 21 in
their10-K. Exhibit 21 is a required element of a firm’s 10-K and includes a listing
of all of the firms subsidiaries with material operations. The tax haven countries
are defined in Table 1 in Dyreng and Lindsay (2009).