Embed Size (px)
Citation preview
RESEARCH CIRCULAR 184 MARCH 1971
Analysis of Quality Factors
in Mashed Potatoes and Peas as
Meal Components Processed by Freezing
WILBUR A. GOULD
MARION CREMER
OHIO AGRICULTURAL RESEARCH AND DEVELOPMENT CENTER
WOOSTER, OHIO
CONTENTS • * *
Introduction ________________________________________________ 3
Procedure-------------------------------------------------- 4
Design ________________________________________________ 4
Variables ______________________________________________ 4
Mea I Pre pa ration_______ _ _ _ _ _ _ _ _ _ _ _ _ _ _ _ _ _ _ _ _ _ _ _ _ _ _ _ _ _ _ _ _ 4
Reconstitution and Service________________________________ 6
Eva I uation _ _ _ _ _ _ _ _ _ _ _ _ _ _ _ _ _ _ _ _ _ _ _ _ _ _ _ _ _ _ _ _ _ _ _ _ _ _ _ _ _ _ _ _ _ 6
Analyses _________________ ·- _ _ _ _ _ _ _ _ _ _ _ _ _ _ _ _ _ _ _ _ _ _ _ _ _ _ _ _ 7
Results and Discussion _____________ ------------------------- 7
Potatoes _______________________________________________ 7
Peas __________________________________________________ l2
Comparison of Components _______________________________ 16
Sum ma ry __________________________________________________ l 8
References _________________________________________________ 20
Appendix A-----------------------------------------------21
AGDEX 259/73 3-71-2.SM
Analysis of Quality Factors in Mashed Potatoes and Peas as Meal Components
Processed by Freezing
WILBUR A. GOULD and MARION CREMER
INTRODUCTION
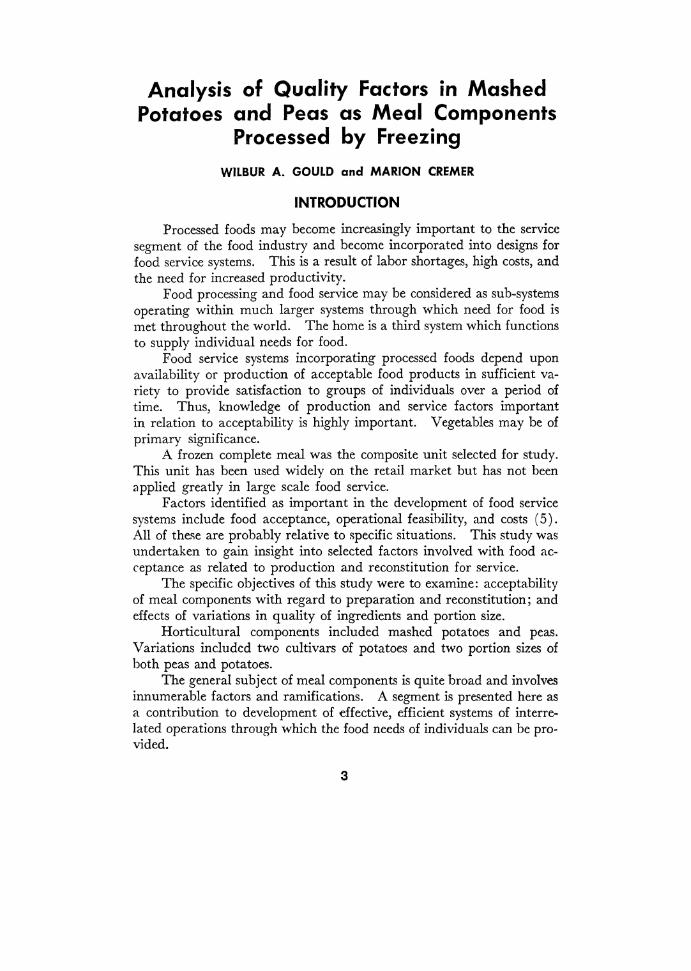
Processed foods may become increasingly important to the service segment of the food industry and become incorporated into designs for food service systems. This is a result of labor shortages, high costs, and the need for increased productivity.
Food processing and food service may be considered as sub-systems operating within much larger systems through which need for food i5 met throughout the world. The home is a third system which functions to supply individual needs for food.
Food service systems incorporating processed foods depend upon availability or production of acceptable food products in sufficient variety to provide satisfaction to groups of individuals over a period of time. Thus, knowledge of production and service factors important in relation to acceptability is highly important. Vegetables may be of primary significance.
A frozen complete meal was the composite unit selected for study. This unit has been used widely on the retail market but has not been applied greatly in large scale food service.
Factors identified as important in the development of food service systems include food acceptance, operational feasibility, and costs ( 5). All of these are probably relative to specific situations. This study was undertaken to gain insight into selected factors involved with food acceptance as related to production and reconstitution for service.
The specific objectives of this study were to examine: acceptability of meal components with regard to preparation and reconstitution; and effects of variations in quality of ingredients and portion size.
Horticultural components included mashed potatoes and peas. Variations included two cultivars of potatoes and two portion sizes of both peas and potatoes.
The general subject of meal components is quite broad and involves innumerable factors and ramifications. A segment is presented here as a contribution to development of effective, efficient systems of interrelated operations through which the food needs of individuals can be provided.
3
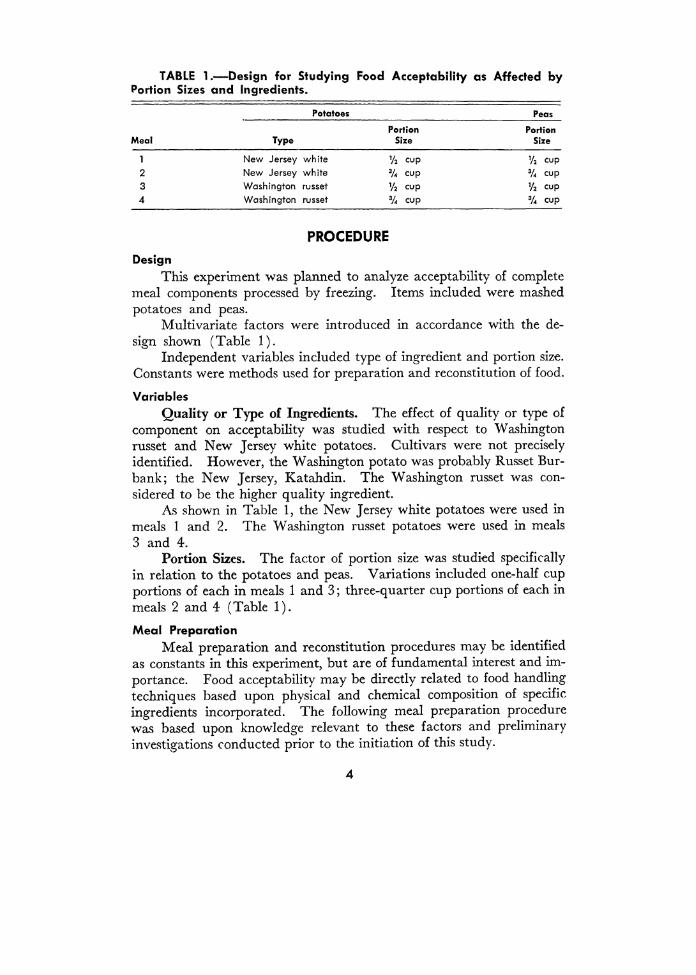
TABLE 1.-Design for Studying Food Acceptability as Affected by Portion Sixes and Ingredients.
Potatoes Peas
Portion Portion Meal Type Size Size
1 New Jersey white Vz cup v. cup 2 New Jersey white 3/. cup % cup 3 Washington russet Vz cup V2 cup 4 Washington russet % cup 3/. cup
PROCEDURE
Design This experiment was planned to analyze acceptability of complete
meal components processed by freezing. Items included were mashed potatoes and peas.
Multivariate factors were introduced in accordance with the design shown (Table 1).
Independent variables included type of ingredient and portion size. Constants were methods used for preparation and reconstitution of food.
Variables Quality or Type of Ingredients. The effect of quality or type of
component on acceptability was studied with respect to Washington russet and New Jersey white potatoes. Cultivars were not precisely identified. However, the Washington potato was probably Russet Burbank; the New Jersey, Katahdin. The Washington russet was considered to be the higher quality ingredient.
As shown in Table 1, the New Jersey white potatoes were used in meals 1 and 2. The Washington russet potatoes were used in meals 3 and 4.
Portion Sizes. The factor of portion size was studied specifically in relation to the potatoes and peas. Variations included one-half cup portions of each in meals 1 and 3; three-quarter cup portions of each in meals 2 and 4 (Table 1).
Meal Preparation Meal preparation and reconstitution procedures may be identified
as constants in this experiment, but are of fundamental interest and importance. Food acceptability may be directly related to food handling techniques based upon physical and chemical composition of specific ingredients incorporated. The following meal preparation procedure was based upon knowledge relevant to these factors and preliminary investigations conducted prior to the initiation of this study.
4
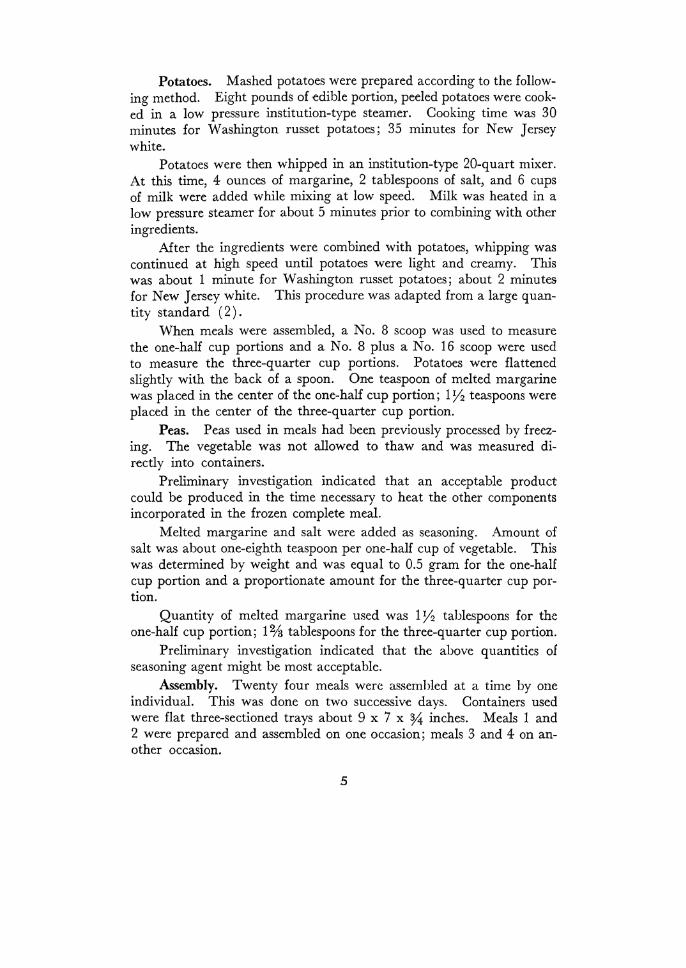
Potatoes. Mashed potatoes were prepared according to the following method. Eight pounds of edible portion, peeled potatoes were cooked in a low pressure institution-type steamer. Cooking time was 30 minutes for Washington russet potatoes; 35 minutes for New Jersey white.
Potatoes were then whipped in an institution-type 20-quart mixer. At this time, 4 ounces of margarine, 2 tablespoons of salt, and 6 cups of milk were added while mixing at low speed. Milk was heated in a low pressure steamer for about 5 minutes prior to combining with other ingredients.
After the ingredients were combined with potatoes, whipping was continued at high speed until potatoes were light and creamy. This was about 1 minute for Washington russet potatoes; about 2 minutes for New Jersey white. This procedure was adapted from a large quantity standard ( 2).
When meals were assembled, a No. 8 scoop was used to measure the one-half cup portions and a No. 8 plus a No. 16 scoop were used to measure the three-quarter cup portions. Potatoes were flattened slightly with the back of a spoon. One teaspoon of melted margarine was placed in the center of the one-half cup portion; 1 Y2 teaspoons were placed in the center of the three-quarter cup portion.
Peas. Peas used in meals had been previously processed by freezing. The vegetable was not allowed to thaw and was measured directly into containers.
Preliminary investigation indicated that an acceptable product could be produced in the time necessary to heat the other components incorporated in the frozen complete meal.
Melted margarine and salt were added as seasoning. Amount of salt was about one-eighth teaspoon per one-half cup of vegetable. This was determined by weight and was equal to 0.5 gram for the one-half cup portion and a proportionate amount for the three-quarter cup portion.
Quantity of melted margarine used was 1 Y2 tablespoons for the one-half cup portion; 1 % tablespoons for the three-quarter cup portion.
Preliminary investigation indicated that the above quantities of seasoning agent might be most acceptable.
Assembly. Twenty four meals were assembled at a time by one individual. This was done on two successive days. Containers used were flat three-sectioned trays about 9 x 7 x % inches. Meals 1 and 2 were prepared and assembled on one occasion; meals 3 and 4 on another occasion.
5
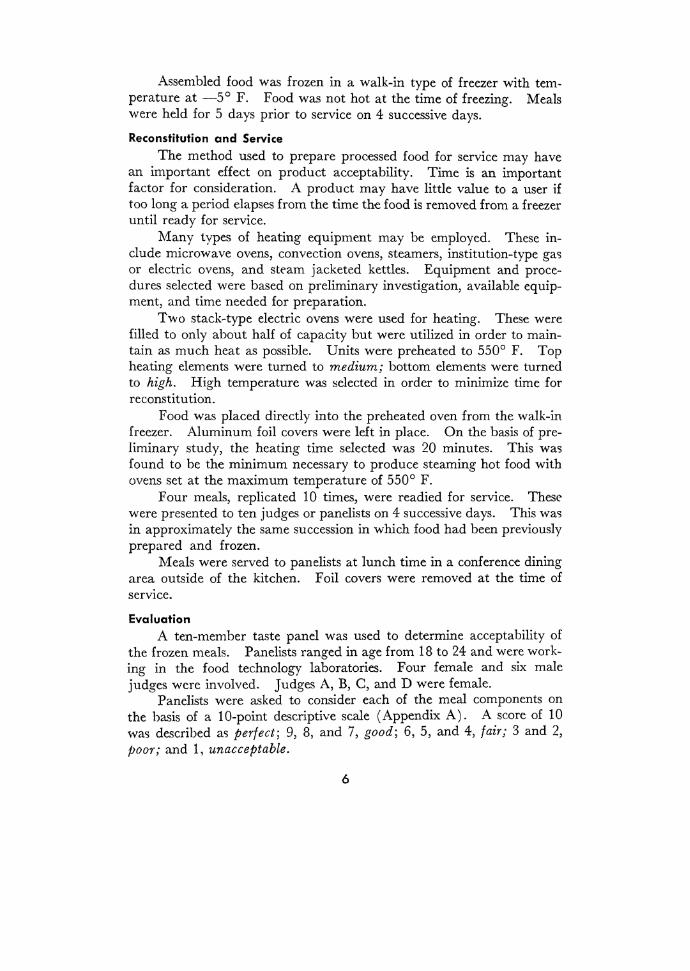
Assembled food was frozen in a walk-in type of freezer with temperature at -5° F. Food was not hot at the time of freezing. Meals were held for 5 days prior to service on 4 successive days.
Reconstitution and Service
The method used to prepare processed food for service may have an important effect on product acceptability. Time is an important factor for consideration. A product may have little value to a user if too long a period elapses from the time the food is removed from a freezer until ready for service.
Many types of heating equipment may be employed. These include microwave ovens, convection ovens, steamers, institution-type gas or electric ovens, and steam jacketed kettles. Equipment and procedures selected were based on preliminary investigation, available equipment, and time needed for preparation.
Two stack-type electric ovens were used for heating. These were filled to only about half of capacity but were utilized in order to maintain as much heat as possible. Units were preheated to 550° F. Top heating elements were turned to medium; bottom elements were turned to high. High temperature was selected in order to minimize time for reconstitution.
Food was placed directly into the preheated oven from the walk-in freezer. Aluminum foil covers were left in place. On the basis of preliminary study, the heating time selected was 20 minutes. This was found to be the minimum necessary to produce steaming hot food with ovens set at the maximum temperature of 550° F.
Four meals, replicated 10 times, were readied for service. These were presented to ten judges or panelists on 4 successive days. This wag in approximately the same succession in which food had been previously prepared and frozen.
Meals were served to panelists at lunch time in a conference dining area outside of the kitchen. Foil covers were removed at the time of service.
Evaluation A ten-member taste panel was used to determine acceptability of
the frozen meals. Panelists ranged in age from 18 to 24 and were working in the food technology laboratories. Four female and six male judges were involved. Judges A, B, C, and D were female.
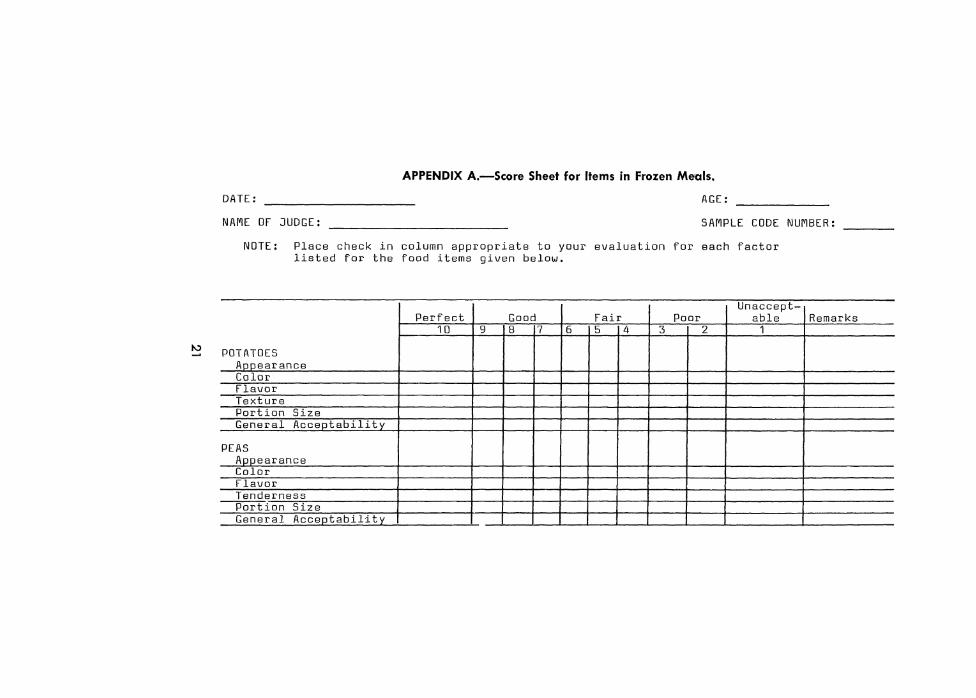
Panelists were asked to consider each of the meal components on the basis of a 10-point descriptive scale (Appendix A). A score of 10 was described a'> perfect; 9, 8, and 7, good; 6, 5, and 4, fair; 3 and 2, poor; and 1, unacceptable.
6
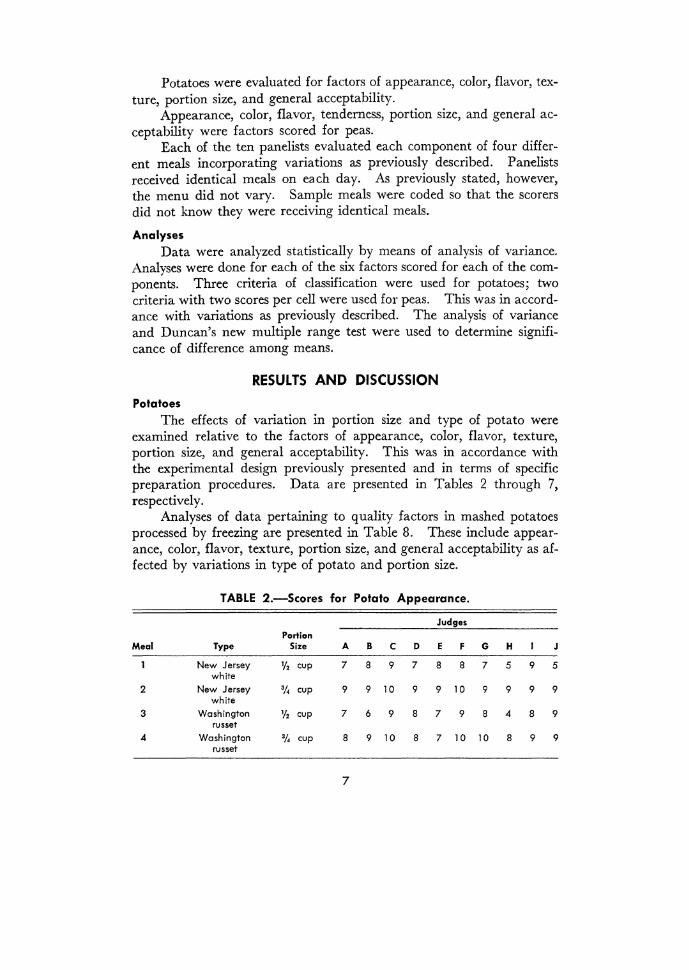
Potatoes were evaluated for factors of appearance, color, flavor, texture, portion size, and general acceptability.
Appearance, color, flavor, tenderness, portion size, and general acceptability were factors scored for peas.
Each of the ten panelists evaluated each component of four different meals incorporating variations as previously described. Panelists received identical meals on each day. As previously stated, however, the menu did not vary. Sample meals were coded so that the scorers did not know they were receiving identical meals.
Analyses Data were analyzed statistically by means of analysis of variance.
Analyses were done for each of the six factors scored for each of the components. Three criteria of classification were used for potatoes; two criteria with two scores per cell were used for peas. This was in accordance with variations as previously described. The analysis of variance and Duncan's new multiple range test were used to determine significance of difference among means.
RESULTS AND DISCUSSION Potatoes
The effects of variation in portion size and type of potato were examined relative to the factors of appearance, color, flavor, texture, portion size, and general acceptability. This was in accordance with the experimental design previously presented and in terms of specific preparation procedures. Data are presented in Tables 2 through 7, respectively.
Analyses of data pertaining to quality factors in mashed potatoes processed by freezing are presented in Table 8. These include appearance, color, flavor, texture, portion size, and general acceptability as affected by variations in type of potato and portion size.
TABLE 2.-Scores for Potato Appearance.
Judges Portion
Meal Type Size ABCDEFGH J
New Jersey Y2 cup 7 8 9 7 8 8 7 5 9 5 white
2 New Jersey % cup 9 9 10 9 9 10 9 9 9 9 white
3 Washington v. cup 7 6 9 8 7 9 8 4 8 9 russet
4 Washington % cup 8 9 10 8 7 10 10 8 9 9 russet
7
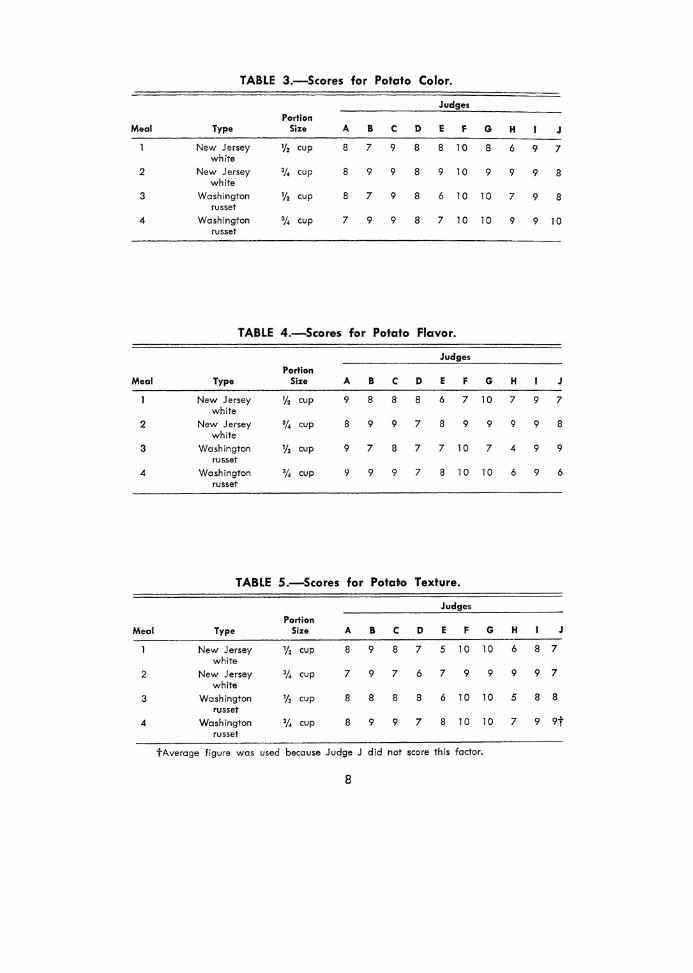
TABLE 3.-Scores for Potato Color.
Judges
Portion Meo I Type Size A B c D E F G H J
New Jersey 1;, cup 8 7 9 8 8 10 8 6 9 7 white
2 New Jersey % cup 8 9 9 8 9 10 9 9 9 8 white
3 Washington 1/, cup 8 7 9 8 6 10 10 7 9 8 russet
4 Washington % cup 7 9 9 8 7 10 10 9 9 10 russet
TABLE 4.-Scores for Potato Flavor.
Judges
Portion Meal Type Size A B c D E F G H J
New Jersey 1;, cup 9 8 8 8 6 7 10 7 9 7 white
2 New Jersey % cup 8 9 9 7 8 9 9 9 9 8 white
3 Washington 1/, cup 9 7 8 7 7 10 7 4 9 9 russet
4 Washington % cup 9 9 9 7 8 10 10 6 9 6 russet
TABLE 5.-Scores for Potato Texture.
Judges
Portion Meal Type Size A B c D E F G H J
New Jersey 1/2 cup 8 9 8 7 5 10 10 6 8 7 white
2 New Jersey % cup 7 9 7 6 7 9 9 9 9 7 white
3 Washington % cup 8 8 8 8 6 10 10 5 8 8 russet
4 Washington •1. cup 8 9 9 7 8 10 10 7 9 9t russet
tAverage figure was used because Judge J did not score this factor.
8
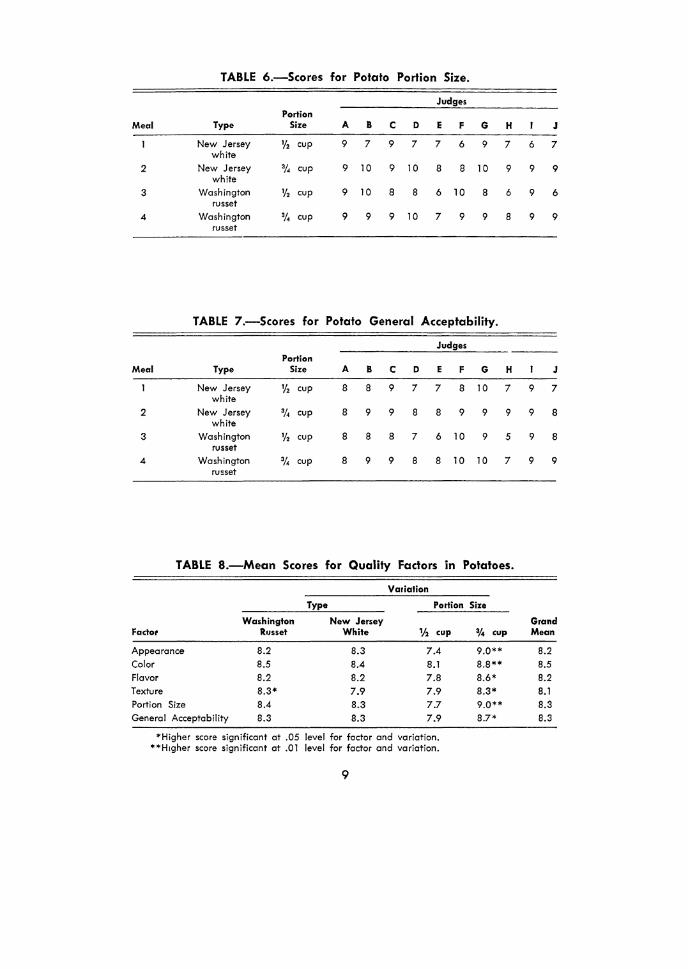
TABLE 6.-Scores for Potato Portion Size.
Judges Portion
Meal Type Size A B c D E F G H
New Jersey '!. cup 9 7 9 7 7 6 9 7 white
2 New Jersey 31. cup 9 10 9 l 0 8 8 10 9 white
3 Washington Y2 cup 9 10 8 8 6 10 8 6 russet
4 Washington 31. cup 9 9 9 10 7 9 9 8 russet
TABLE 7.-Scores for Potato General Acceptability.
Judges Portion
Meal Type Size A B c D E F G H
New Jersey '!. cup 8 8 9 7 7 8 10 7 white
2 New Jersey % cup 8 9 9 8 8 9 9 9 white
3 Washington v. cup 8 B 8 7 6 10 9 5 russet
4 Washington 3/. cup 8 9 9 B 8 10 10 7 russet
TABLE 8.-Mean Scores for Quality Factors in Potatoes.
Variation
Type Portion
Washington New Jersey Factot R1Jsset White 111 cup
Appearance 8.2 8.3 7.4 Color 8.5 8.4 8.1 Flavor 8.2 8.2 7.8 Texture 8.3* 7.9 7.9 Portion Size 8.4 8.3 7.7 General Acceptability B.3 8.3 7.9
*Higher score significant at .05 level for factor and variation. **Higher score significant at .01 level for factor and variation.
9
Size
% cup
9.0** 8.8** 8.6* 8.3* 9.0** 8.7*
J
6 7
9 9
9 6
9 9
J
9 7
9 8
9 8
9 9
Grand Mean
8.2 8.5 8.2 8.1 8.3 8.3
Appearance. Portion size was found to have a highly significant effect (.01) on appearance of potatoes (Table 8). Average score was 9 for the three-quarter cup portion as opposed to 7 .4 for the one-half cup portion. This may be related to browning which was observed during reconstitution of the smaller volume of potatoes.
Types of potatoes used in this study made no significant ( .05) difference in average scores for appearance. These were 8.2 for Washington russet and 8.3 for New Jersey white.
Color. Variation in portion size was found to produce highly significant (.01) differences in scores for color (Table 8). Average score for the three-quarter cup portion was 8.8 as compared to 8.1 for the one-half cup portion. Differences may be accounted for in terms of the browning reaction ( 6) .
Significant ( .05) differences in scores for color were not found in relation to the two types of potatoes used.
Flavor. Portion size was found to significantly ( .05) affect average scores for flavor in mashed potatoes (Table 8). The three-quarter cup portion was 8.6 as compared to 7 .8 for the half cup portion. Potato type did not significantly ( .05) affect scores for flavor.
Texture. Texture evaluations for potatoes were significantly ( .05) affected by both variation in type of potato and by portion size (Table 8). Texture in the mashed potatoes prepared from Washington russet potatoes was better than in the New Jersey white. The average was 8.3 as compared to 7.9.
Portion Size. Differences in scores for portion size of potatoes were highly significant ( .01). The larger size portion was scored higher than the smaller (Table 8). Mean score was 9.0 as compared to 7.7. Type of potato, as might be expected, made no significant ( .05) difference in scores for this factor.
General Acceptability. No significant ( .05) differences in general acceptability were shown in relation to the two types of potatoes used (Table 8). However, portion size was shown to make highly significant ( .01) differences. Average score was 8. 7 for the three-quarter cup portion as compared to 7 .9 for the half cup portion.
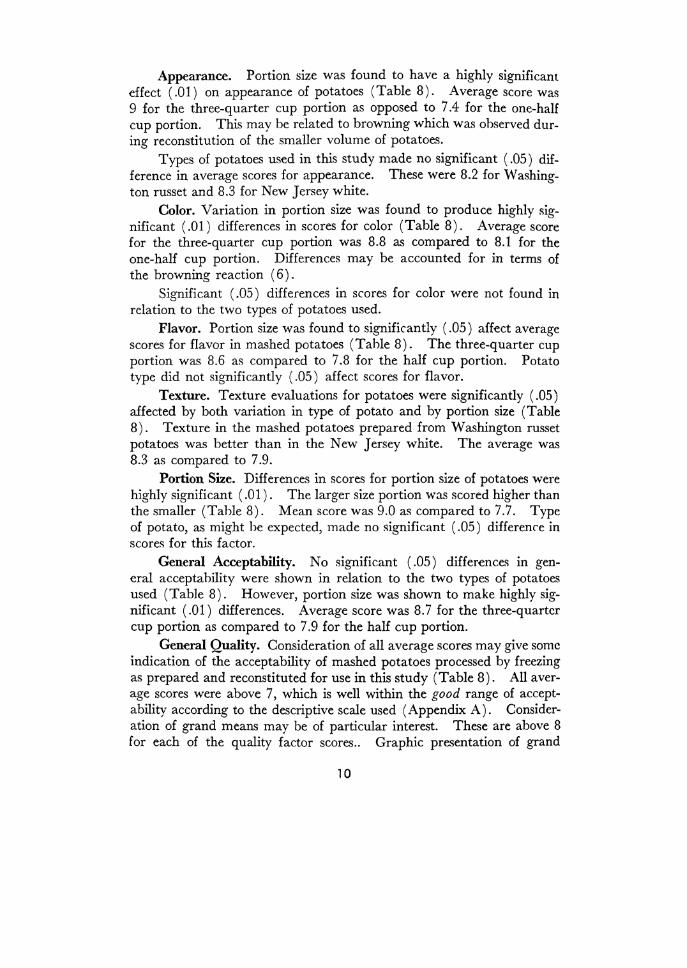
General Quality. Consideration of all average scores may give some indication of the acceptability of mashed potatoes processed by freezing as prepared and reconstituted for use in this study (Table 8). All average scores were above 7, which is well within the good range of acceptability according to the descriptive scale used (Appendix A). Consideration of grand means may be of particular interest. These are above 8 for each of the quality factor scores.. Graphic presentation of grand
10
means is made in Figure 1. This may indicate levels of acceptability of the product as prepared and served.
Summary. Certain items of interest may be noted with reference to variables incorporated and quality factors scored for potatoes.
The larger portion size, although not perfect, was more acceptable to judges than the smaller. This was at the .01 level of significance.
Perfect
Pooc {
Means on 10-Point Seale 10
9
8.2 8
7
6
5
4
3
2
Unacceptable
Q) u c: "' s...
"' Q) 0. 0.
c:c
8.5
s... 0 ~
0 u
8.2 8. l 8.3 8.3
Q) ~ N
~
(/) :c Q) i:: ,.... "' s... s... 0 "'+> 0 ::I ::::; s... 0.
> +> Q) Q)
"' x s... c: u u::: Q) 0 QJ u
I- Q.. <.!:> c:c
QUALITY FACTORS
FIG. 1.-Mean Scores for Acceptability of Pota~oes (Four Samples, Ten Judges).
11
In addition, scores for all quality factors considered were significantly higher with respect to the larger size portion. These were for appearance, color, texture, flavor, and general acceptability. This may be due to individual predisposition to think more favorably in terms of th~ larger amount of food. However, pos'libility existed that it may have been partially due to the browning reaction which occurred to a greater extent in reconstituting the smaller portion size.
The only factor which was affected significantly ( .05) by type of potato used was texture. The two types of potatoes used made no difference relative to the other factors. With regard to texture, Washington russet was the higher scoring type. This does not mean that quality of ingredient has no effect on acceptability. Perhaps both types of potatoes were of high quality. This may be indicated by the fact that al! average scores were well above 7, which places all samples within the .r1.ood range of acceptability.
Peas Data relative to quality factors scored for peas as a meal component
processed by freezing are presented in Tables 9 through 14. These are for the factors of appearance, color, flavor, tenderness, portion size, and general acceptability, respectively.
Mean scores and results of data analyses for peas are shown in Table 15.
Data were analyzed by two-way analysis of variance. These analyses were with two scores per cell since duplicate samples were involved in the design.
Variation in peas as a component of the frozen complete meal was with regard to portion size only. Thus, any differences in scores among samples might be expected to result from the effect of heating or cooking the larger size portion the same period of time as the smaller.
Appearance. Appearance may he important relative to acceptability of food. Volume may affect this factor. The one-half cup portion may be seen to score slightly higher than the three-quarter cup (Table 15). Scores were 9.0 as compared to 8.8. This difference was not significant ( .05).
Color. Preservation of color in green peas may be a highly important factor in cooking or heating. Portion size might have an important effect in this regard. With reference to the portion sizes incorporated, however, no significant ( .05) differences in scores for color were found (Table 15).
Color in the peas sampled might be considered quite good. Average scores were 8.4 for the three-quarter cup portion and 8.8 for the
12
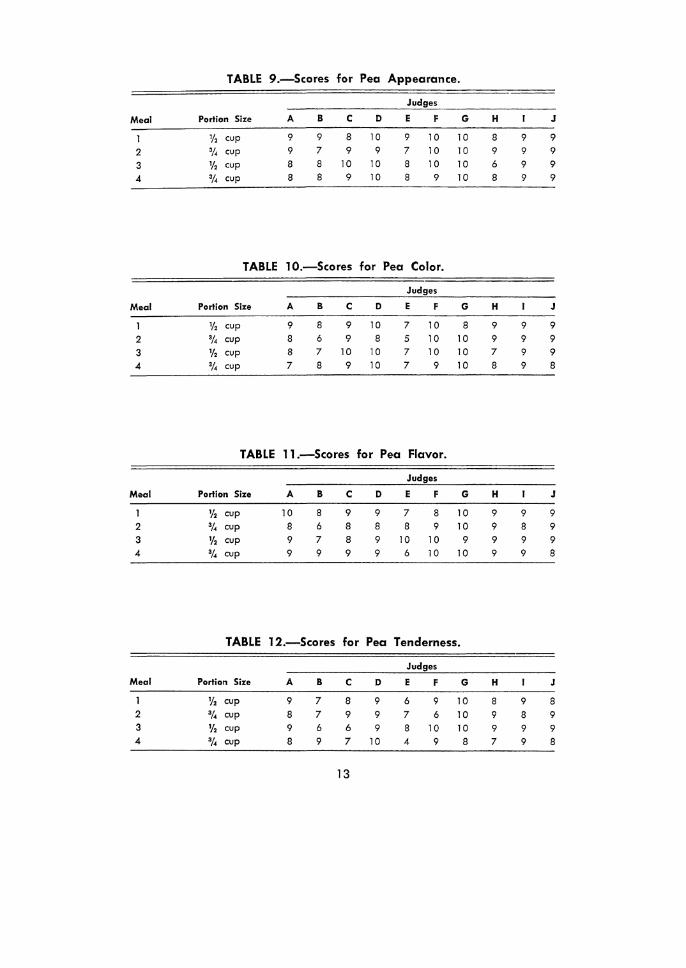
TABLE 9.-Scores for Pea Appearance.
Judges
Meal Portion Size A B c D E F G H J
V2 cup 9 9 8 10 9 10 10 8 9 9
2 31. cup 9 7 9 9 7 10 10 9 9 9
3 % cup 8 8 10 10 8 10 10 6 9 9
4 •1. cup 8 8 9 10 8 9 10 8 9 9
TABLE 10.-Scores for Pea Color.
Judges
Meal Portion Size A B c D E F G H J
V2 cup 9 8 9 10 7 10 8 9 9 9 2 •1. cup 8 6 9 8 5 10 10 9 9 9
3 1/2 cup 8 7 10 10 7 10 10 7 9 9
4 •1. cup 7 8 9 10 7 9 10 8 9 8
TABLE 11.-Scores for Pea Flavor.
Judges
Meal Portion Size A B c D E F G H J
1/2 cup 10 8 9 9 7 8 10 9 9 9 2 •1. cup 8 6 8 8 8 9 10 9 8 9 3 % cup 9 7 8 9 10 10 9 9 9 9 4 •f,. cup 9 9 9 9 6 10 10 9 9 8
TABLE 12.-Scores for Pea Tenderness.
Judges
Meal Portior1 Size A B c D E F G H J
1/2 cup 9 7 8 9 6 9 10 8 9 8 2 31. cup 8 7 9 9 7 6 10 9 8 9 3 1/2 cup 9 6 6 9 8 10 10 9 9 9 4 3/,. cup 8 9 7 10 4 9 8 7 9 8
13
one-half cup portion. This was well within the good range of acceptability on the 10-point scale used (Appendix A).
Although differences between means for the two portion sizes were not significant, the one-half cup portion was scored slightly higher for color than the three-quarter cup portion.
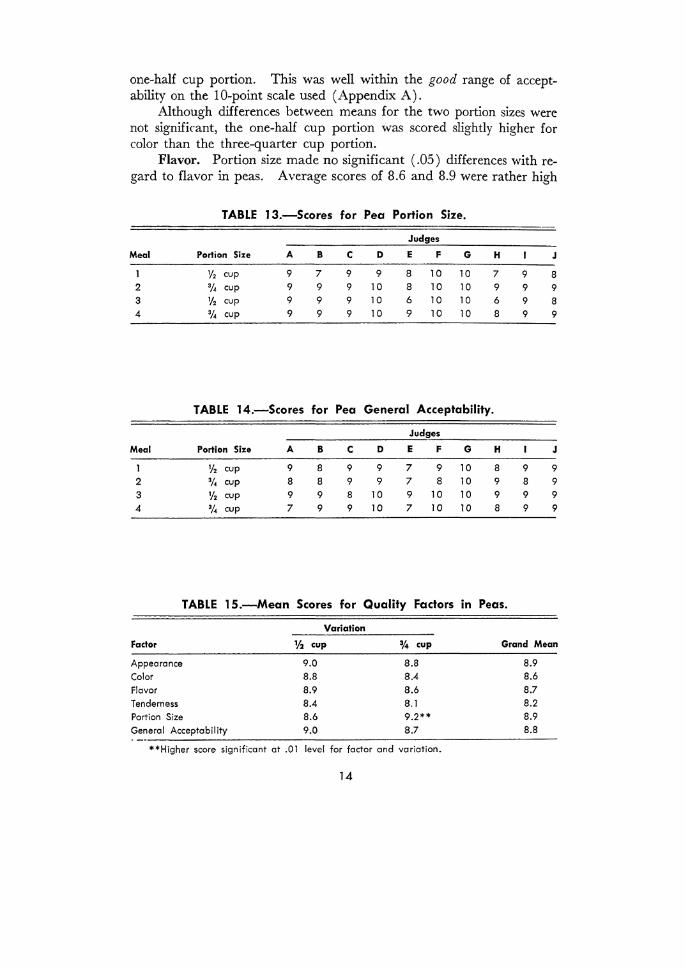
Flavor. Portion size made no significant ( .05) differences with regard to flavor in peas. Average scores of 8.6 and 8.9 were rather high
TABLE 13.-Scores for Pea Portion Size.
Judges
Meal Portion Sixe A B c D E F G H J
'12 cup 9 7 9 9 8 10 10 7 9 8 2 % cup 9 9 9 10 8 10 10 9 9 9 3 ''2 cup 9 9 9 10 6 10 10 6 9 8 4 % cup 9 9 9 10 9 10 10 8 9 9
TABLE 14.-Scores for Pea General Acceptability.
Judges
Meal Portion Size A B c D E F G H J
'/, cup 9 8 9 9 7 9 10 8 9 9 2 31. cup 8 8 9 9 7 8 10 9 8 9 3 '12 cup 9 9 8 10 9 10 10 9 9 9 4 % cup 7 9 9 10 7 10 10 8 9 9
TABLE 15.-Mean Scores for QuaHty Factors in Peas.
Variation
Factor % cup 314 cup
Appearance 9.0 8.8 Color 8.8 8.4 Flavor 8.9 8.6 Tenderness 8.4 8.1 Portion Size 8.6 9.2** General Acceptability 9.0 8.7
**Higher score significant at .01 level for factor and variation.
14
Grand Mean
8.9 8.6 8.7 8.2 8.9 8.8
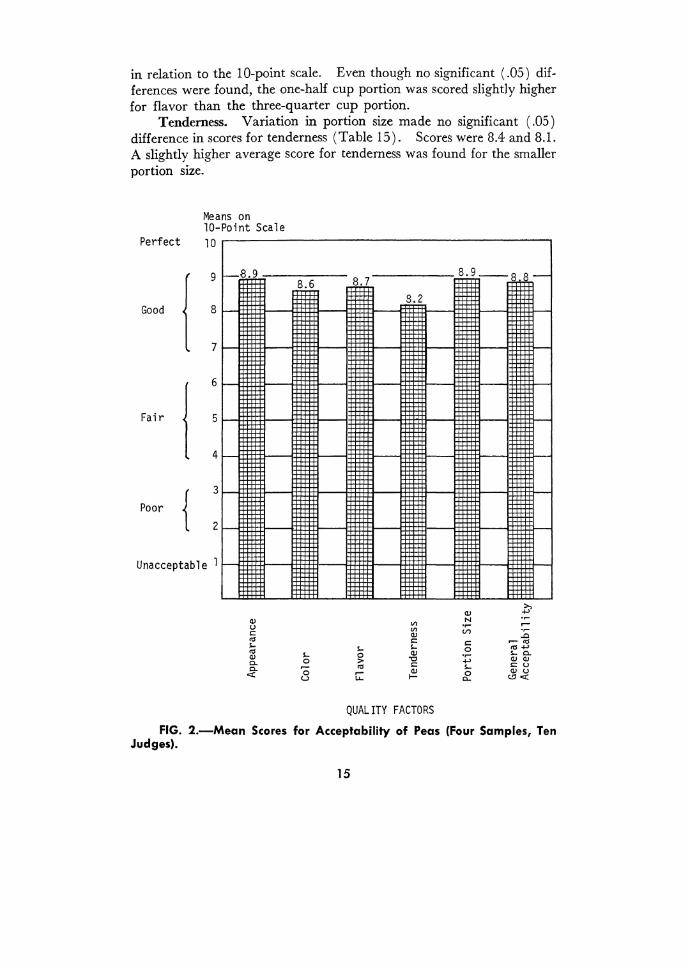
in relation to the 10-point scale. Even though no significant ( .05) differences were found, the one-half cup portion was scored slightly higher for flavor than the three-quarter cup portion.
Tenderness. Variation in portion size made no significant ( .05) difference in scores for tenderness (Table 15). Scores were 8.4 and 8.1. A slightly higher average score for tenderness was found for the smaller portion size.
Perfect
Good l Fair l Poor {
Means on 10-Point Scale 10
9 --8. 9
8
7
6
5
4
3
2
Unacceptable 1
Q) u c
"' ~ "' Q) 0.. 0..
"'
8.6
~ 0
0 u
8.9 ~-8-8.7
3.2
(I) ~
"' N
"' ..... .....
(I) (/')
..0 c c ~"' ~ ~ 0 "'....., 0 (I) ..... ~o..
> "C ....., Q) Q)
"' c: ~ c: u .- (I) 0 (I) u LI- f- 0.. t!l "'
QUALITY FACTORS
FIG. 2.-Mean Scores for Acceptability of Peas (Four Samples, Ten Judges).
15
Portion Size. The three-quarter cup portion size of peas was scored higher than the one-half cup portion size. This difference was highly significant ( .01) (Table 15). Very high levels of acceptability were found, with a score of 9.2 for the three-quarter cup portion and 9.6 for the one-half cup portion. The high score was near the top of the 10-point scale.
General Acceptability. Scores for general acceptability were not significantly ( .05) affected by variation in portion size of peas (Table 15). Average scores were rather high. These were 8. 7 for the three .. quarter cup portion and 9.0 for the one-half cup portion. The onehalf cup portion was scored slightly higher for general acceptability. However, the difference was not significant.
General Quality. Preparation of peas differed from potatoes in that the peas were not cooked prior to freezing. The level of acceptability with regard to this method of preparation was thus of some interest.
Mean scores may indicate a relatively high level of product acceptance and quality. Mean scores for all factors evaluated were above 8 (Table 15). This is well within the good range of acceptability according to the descriptive scale used for evaluation (Appendix A). Grand means may serve to indicate levels of acceptability. A graphic representation of the scores for the quality factors is shown in Figure 2.
Summary. Acceptability of peas as a component of a complete meal processed by freezing would appear to be quite good. Means for all of the quality factors scored were above 8 and some were as high as 9 on a 10-point scale.
The three-quarter cup portion of peas was scored higher than the smaller portion. Difference was highly ( .01) significant. Variation in portion size made no significant difference relative to any of the other factors scaled. However, the one-half cup portion was scored slightly higher than the three-quarter cup portion for all factors except portion size.
Comparison of Components Although each of the meal components was found to have relative
ly high levels of acceptability, consideration of quality factors in relation to each other may be of some interest.
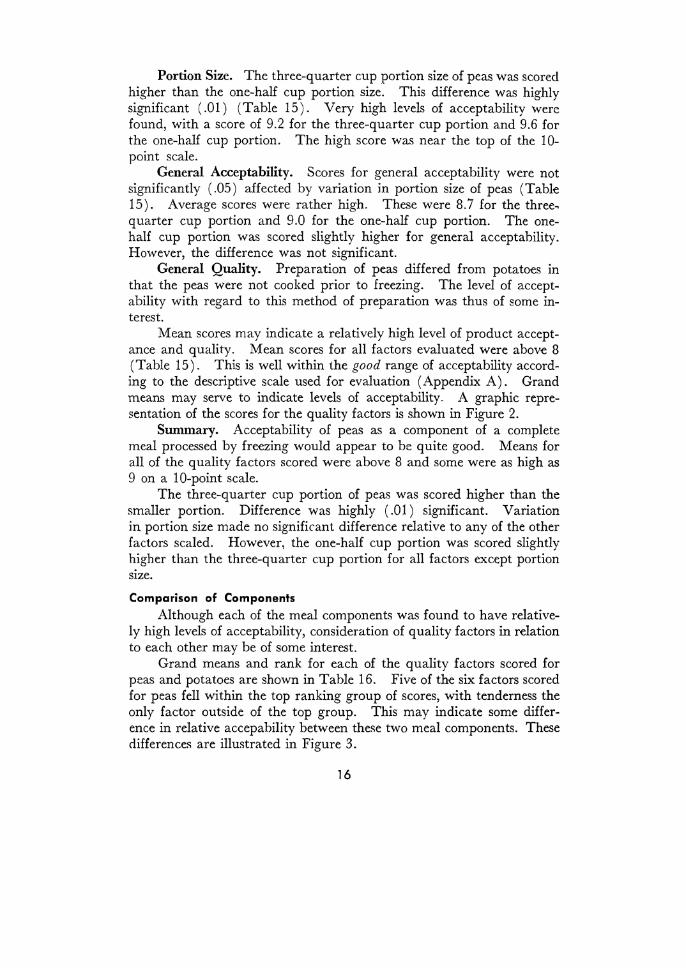
Grand means and rank for each of the quality factors scored for peas and potatoes are shown in Table 16. Five of the six factors scored for peas fell within the top ranking group of scores, with tenderness the only factor outside of the top group. This may indicate some difference in relative accepability between these two meal components. These differences are illustrated in Figure 3.
16
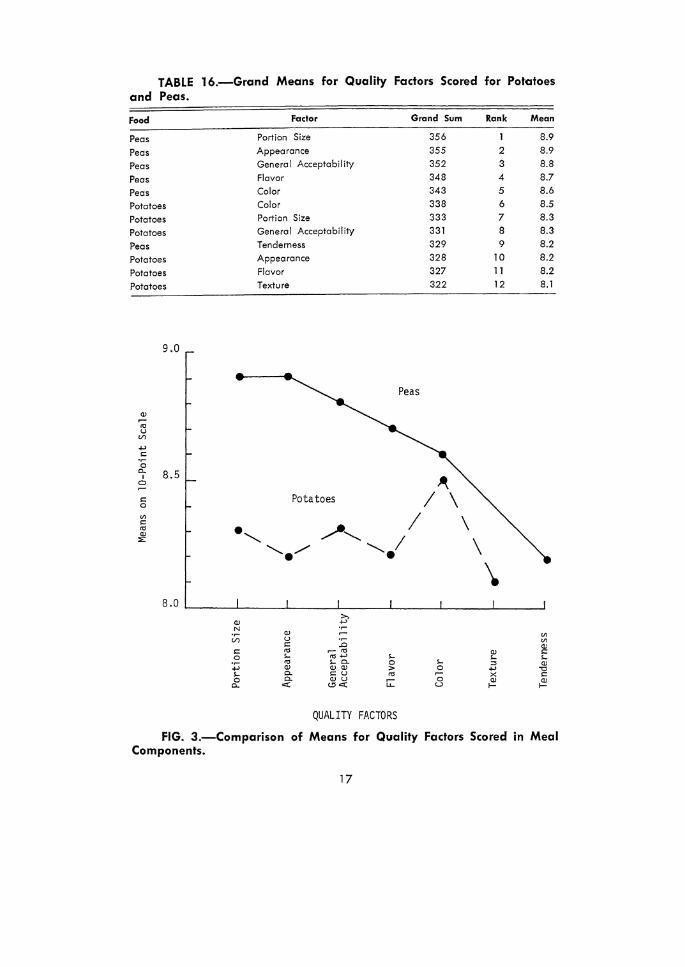
TABLE and Peas.
Food
Peas
Peas Peas Peas Peas Potatoes Potatoes Potatoes Peas Potatoes Potatoes Potatoes
9.0
QJ
':;; u
(/')
.µ i::: ·:; 0.. 8.5 I 0
i::: 0
tll i:::
"' QJ :E
16.-Grand Means for Quality Factors Scored for Potatoes
QJ N
(/')
i::: 0
:;::; ,._ 0 a.
Factor
Portion Size Appearance General Acceptability
Flavor Color Color Portion Size General Acceptability
Tenderness Appearance Flavor Texture
Potatoes
Grand Sum
Peas
356 355 352 348 343 338 333 331 329 328 327 322
~ I \
I \ ,,..,..'---- I \
'----•
~ QJ u :n i:::
"' .- "' ,._ "'.µ ,._
"' ,._ 0. 0 s... QJ QJ QJ > 0 0. i::: u "' 0 0. QJ u u: c:i:: <!l c:i:: u
QUALITY FACTORS
Rank Mean
1 8.9 2 8.9 3 8.8 4 8.7 5 8.6 6 8.5 7 8.3 8 8.3 9 8.2
10 8.2 11 8.2 12 8.1
\
tll
"' QJ QJ i::: ,._ s... ::s QJ .µ -0 x i::: QJ QJ f- f-
FIG. 3.-Comparison of Means for Quality Factors Scored in Meal Components.
17
Significance of differences among means for all quality factors scored in the total meal were determined by means of Duncan's new multiple range test calculated at the .05 level. General acceptability, portion size, appearance, and flavor were scored significantly higher for peas than for potatoes.
Variations incorporated in this study were based upon specific methods of preparation and reconstitution. The preceding comparisons may indicate the effectiveness of these procedures. Relatively high scores for peas may indicate effectiveness of methods used for preparation and reconstitution.
The need for further work with the potato component may be indicated. Particular consideration might be given to initial cooking time, whipping time, and proportion of milk added in terms of solids content of potatoes. Portion size and various methods for heating might also be studied with regard to this component.
SUMMARY
A study was made to determine the effects of variations in portion size and quality of ingredients on acceptability of complete meal components processed by freezing. Components included freshly mashed potatoes and pre-frozen peas. Variations were Washington russet or New Jersey white potatoes and three-quarter or one-half cup portions of both peas and potatoes.
Constants in the experiment were methods for food preparation and reconstitution. Pre-frozen peas were incorporated directly into the meal without further preparation except for addition of seasoning ingredients. Mashed potato preparation was based on a large-quantity standardized recipe. Reconstitution of both components was in an in~titution type stack oven at 550° F.
Acceptability was determined by a ten-member taste panel consist-ing of college age students working in the area of food technology. Each component was scored on a 10-point descriptive scale for six factors of quality. Appearance, color, flavor, texture, portion size, and general acceptability were factors scored for potatoes. Appearance, color, flavor, tenderness, portion size, and general acceptability were factors scored for peas.
The analysis of variance with three-way classification was used to analyze each of the six factors scored for potatoes. Two-way analysis of variance with two scores per cell was used to analyze the data for peas. Differences among all factors for quality were determined by Duncan's new multiple range test.
18
The three-quarter cup portion size of potatoes was scored significantly higher for all factors. This was at the .01 level for appearance, color, portion size, and general acceptability; at the .05 level for texture and flavor.
Variation in potato type made significant ( .05) differences in scores for that factor of texture. Preference was for the Washington russet potato.
Only one of the factors scored for peas was significantly affected by variation in portion size. This was the factor of portion size. The three-quarter cup portion was scored significantly ( .01) higher.
Acceptability of the two meal components as prepared in this study would seem to be high. Mean scores for each of the quality factors scored for all of the variations in potatoes were above 7, which is within the good range of acceptability according to the descriptive scale used for evaluation. Mean scores for each of the quality factors scored for peas were above 8.
Peas as a component of the meal were scored higher than mashed potatoes. When grand means for all quality factors scored in each component were rank ordered, the five top ranking scores were for peas. Portion size of peas was the highest scoring factor.
Grand means for the factor of general acceptability, portion size, appearance, and flavor were significantly higher ( .05) for peas than the same factors in potatoes. This was as determined by Duncan's new multiple range test.
Mean scores and their relative differences may indicate good methodology for preparation and reconstitution of peas as a meal component. Need for experimentation with methods of production and reconstitution of mashed potatoes as a component of frozen complete meals may be indicated.
This study indicates meals can be pre-assembled, frozen, and held for reheating prior to serving by using freshly mashed potatoes and prefrozen peas. Assembly line mass production of meals can cut kitchen time and costs and perhaps produce more uniform qualities. Portion size is a critical factor for high acceptance. When using peas and potatoes a<; meal components, high quality ingredients are important for acceptability.
19
REFERENCES
1. Cremer, Marion. 1969. Analysis of Quality Factors in Meal Components Processed by Freezing. Unpublished Ph.D. Dissertation, The Ohio State University.
2. Fowler, Sina Faye, West, Bessie Brooks, and Shugart, Grace Severance. 1961. Food for Fifty. Fourth edition. John Wiley and Sons, Inc., New York.
3. Griswold, Ruth M. 1962. The Experimental Study of Foods. Houghton Mifflin Co., Boston.
4. Johnson, Richard A., Kast, Fremont E., and Rosenzweig, James E. 1967. The Theory and Management of Systems. McGraw-Hill Book Co., New York.
5. Livingston, G. E. Jan. 1968. Design of a Food Service System. Food Technology 22:35-39.
6. Meyer, Lillian Hoagland. 1960. Food Chemistry. Reinhold Publishing Co., New York.
20
/\.:>
APPENDIX A.-Score Sheet for Items in Frozen Me·als.
DATE: AGE:
NAME OF JUDGE: SAMPLE CODE NUMBER:
NOTE: Place check in column appropriate to your evaluation for each factor listed for the food items given below.
Un accept-Perfect Good Fair Poor able
10 9 8 7 6 5 4 3 2 1
POTATOES Appearance Color Flavor Texture Portion Size General Acceotabilitv
PEAS Aooearance Color Flavor Tenderness Portion Size General Acceetabilitl:'.
Remarks
7~ State '74 ~ {3amftet4 p-e //~tee-eat i<e4ea'td ad Z'e<tdo{Pleent
NORTH CENTRAL e
NORTHyYESTERN e
I I
• MUCK CROPS
• MAHONING COUNTY
l ,. '
WESTERN e
; r
COLUMBUS
• THE OHIO STATE UNIVERSITY
t
WOOSTER
• i' CENTER
HEADQUARTERS
r EASTERN OHIO RESOURCE
DEVELOPMENT CENTER
• ' J'
,. "I
J l .,!
SOUTHEASTERN
• JACKSON•
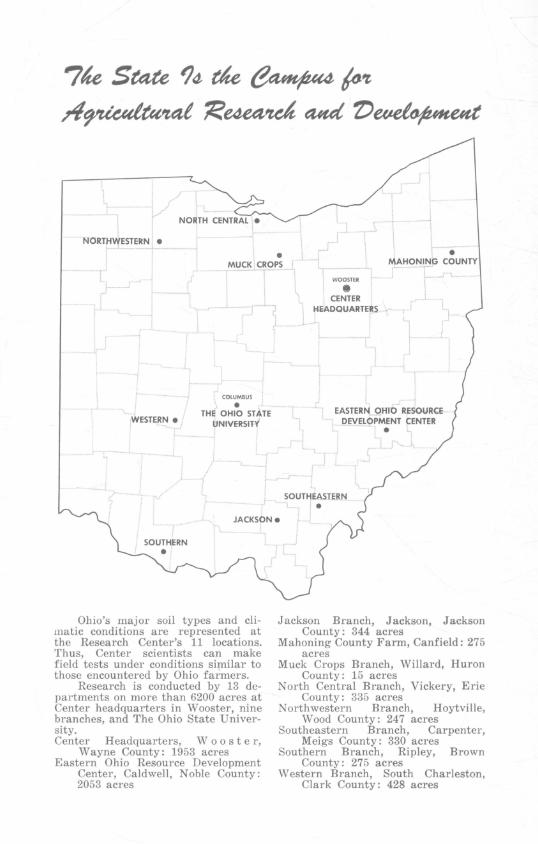
Ohio's major· soil types and climatic conditions are represented at the Research Center's 11 locations. Thus, Center scientists can make field tests under conditions similar to those encountered by Ohio fa1;mers.
Research is conducted by 13 departments on more than 6200 acres at Center headquarters in Wooster, nine branches, and The Ohio State University. Center Headquarters, Wooster,
Wayne County: 1953 acres Eastern Ohio Resource Development
Center, Caldwell, Noble County: 2053 acres
Jackson Branch, Jackson, Jackson County: 344 acres
Mahoning County Farm, Canfield: 275 acres
Muck Crops Branch, Willard, Huron County: 15 acres
North Central Branch, Vickery, Erie County : 335 acres
Northwestern Branch, Hoytville, Wood County: 247 acres
Southeastern Branch, Carpenter, Meigs County: 330 acres
Southern Branch, Ripley, Brown County: 275 acres
Western Branch, South Charleston, Clark County: 428 acres