Embed Size (px)
Citation preview
U S Departmentof Transportation
National HighwayTraffic SafetyAdministration
DOT HS 807 632 December 1989
Final Report
Analysis of Insurance Premiumsand Payouts for 1987-1988Designated High Theft RatePassenger CarsVolume I
This document is available to the public from the National Technical Information Service. Sprirstitie^'j \/irqim,,
The United States Government does not endorse products ormanufactures, Trade or manufacturer's names appear onlybecause they are considered essential to the object of this report.
Technical Report Documentation Page
1 . Report No.
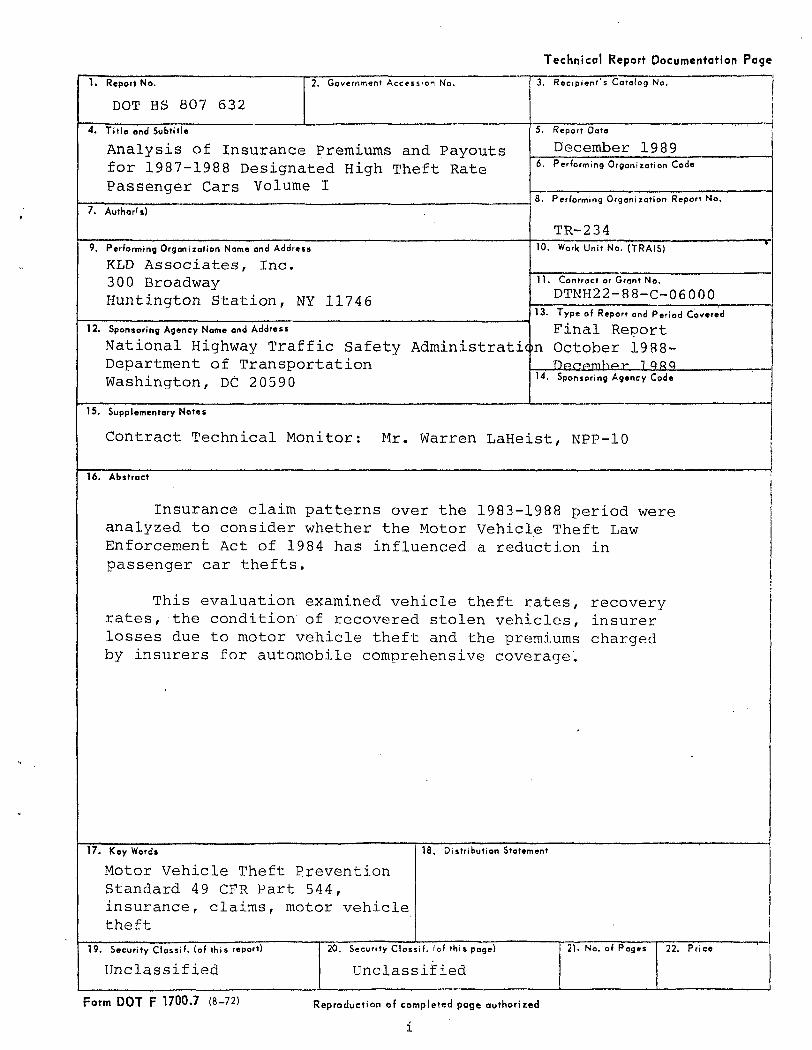
DOT HS 807 632
2. Government Accession No. 3. Recipient's Catalog No.
4. Title and Subtitle
Analysis of Insurance Premiums and Payoutsfor 1987-1988 Designated High Theft RatePassenger Cars Volume I
5. Report Dote
December 19896. Performing Orgonization Code
7. Author'*)8. Performing Organization Report No.
TR-2349. Performing Organization Name and Address
KLD Associates, Inc.300 BroadwayHuntington Station, NY 11746
10. Work Unit No. (TRAIS)
11. Contract or Grant No.
DTNH22-88-C-06 0 0013. Type of Report and Period Covered
12. Sponsoring Agency Nome and Address
National Highway Traffic Safety AdministrationDepartment of TransportationWashington, DC 20590
Final ReportOctober 1988-
14. Sponsoring Agency Code
15. Supplementary Notes
Contract Technical Monitor: Mr. Warren LaHeist, NPP-10
16. Abstract
Insurance claim patterns over the 1983-1988 period wereanalyzed to consider whether the Motor Vehicle Theft LawEnforcement Act of 1984 has influenced a reduction inpassenger car thefts.
This evaluation examined vehicle theft rates, recoveryrates, the condition' of recovered stolen vehicles, insurerlosses due to motor vehicle theft and the premiums chargedby insurers for automobile comprehensive coverage.
17. Key Words
Motor Vehicle Theft PreventionStandard 49 CFR Part 544,insurance, claims, motor vehicletheft
18. Distribution Statement
19. Security Classif. (of this report)
Unclassified
2 0 . S e c u r i t y C l a s s i f . ' o f t h i s p a g e )
Unclassified
21. No. of Poges 22. Price
Form DOT F 1700.7 (8-72) Reproduction of completed page authorized
i
PREFACE
The cooperation of the insurance industry was essential to thesuccess of this project. KLD especially wishes to thank theNational Automobile Theft Bureau, the Highway Loss Data Instituteand the following companies: Aetna, Allstate, Arnica, GEICO, StateFarm, Travelers and USAA for their cooperation and assistance.

TABLE OF CONTENTS
Section Title Page
EXECUTIVE SUMMARY ES-1
1 INTRODUCTION 11.1 Background 11.1.1 Legislative Action 21.1.2 Actions Required by the Theft Act 31.2 NHTSA Actions in Response to Legislation 61.2.1 Selection of Covered Parts and 6
Labelling Requirements1.2.2 Selection of High Theft Lines 81.2.3 Selection of Insurer Reporting 8
Requirements and Subject Insurers1.3 Role of This Study 111*4 Data Sources 111.5 Report Organization 12
2 THEFT RATES FOR INSURED VEHICLES DURING 141983-1988
2.1 Development of Theft Rates for 1983-1988 142.2 Variation in Theft Rates During 1983-1988 152.2.1 Variation in Theft Rates Over Time 152.2.2 Variation in Theft Rates by Vehicle 18
Type2.2.3 Variation in Theft Rates Between 19
Marked and Unmarked Passenger Cars2.2.4 Variation in Theft Rates Between 25
Vehicles with Anti-Theft Devices andMarked and Unmarked Cars
2.3 Implications of Theft Rate Trends on the 25Evaluation of the Theft Act
3 RECOVERY RATES FOR INSURED VEHICLES DURING 291983-1988
3.1 Determination of Recovery Rates For 291983-1988
3.1.1 Characteristics of NATB Recovery Data 293.2 Variation in Motor Vehicle Recoveries 3 0
During 1983-19883.2.1 Variation in Recovery Rates Over Time 31
by Vehicle Type3.2.2 Influence of Marking Program on 34
Recovery Rates of Marked Vehicles3.2.3 Recovery Rates for Vehicles with 37
Anti-Theft Devices3.3 Condition of Vehicles Upon Recovery 393.4 Implications of Recovery Trends on the 45
Effectiveness of the Theft PreventionStandard
v
TABLE OF CONTENTS
Section Title page
4 INSURER LOSS PAYMENTS DUE TO VEHICLE THEFT 47DURING 1983-1988
4.1 Determination of Insurance Losses During 471983-1988
4.2 Insurance Losses for Vehicle Theft 48During 1983-1988
4.2.1 Variation in Average Theft Payments 49During 1983-1988
4.2.2 Insurer Theft Losses Before and After 52Marking Program
4.3 Insurance Payments for Recovered Vehicles 55Before and After Start of Marking Program
4.4 Claims Costs for Recovered Damaged 57Vehicles Before and After the Start ofParts Marking
4.5 Implications of Theft Claim Payment 60Trends on Effectiveness of the MarkingProgram
5. AUTOMOBILE COMPREHENSIVE PREMIUMS CHARGED 63DURING 1983-1988
5.1 The Role of Theft in Determining 63Automobile Comprehensive Premiums
5.1.1 Ratemaking Process for Automobile 64Comprehensive Premiums
5.1.2 Rating Characteristics to Establish 66Automobile Comprehensive Premiums
5.1.3 Ratemaking Procedures to Reflect the 68Theft Act
5.2 Insurer Considerations of Theft Act in 69Determining 1983-1988 ComprehensivePremiums
5.3 Trends in Automobile Comprehensive 69Premiums During 1983-1988
5.3.1 Procedures to Analyze Premium Trends 70and Variability
5.3.2 Results of Analysis of Premium 71Trends and Variability
5.4 Implications of Analysis of Comprehensive 74Premiums on the Effectiveness of theMarking Program
6. CHARACTERISTICS OF THEFT CLAIMS FILED 75DURING 1987-1988
6.1 Characteristics of Insurance Claim 75Records
6.2 Distribution of Theft Claims by Vehicle 76Age
VI
TABLE OF CONTENTS
Section Title Page
6.3 Proportion of Automotive Theft Claims 79Without Payment
6.4 Recoveries Prior to Settlement 796.5 Implications of Theft Claim 85
Characteristics on NHTSA Evaluationof Theft Act
7. CONCLUSIONS 86
REFERENCES 89
APPENDIX A - Theft Rates for Insured Vehicles Stratified A-lby Calendar Year, Vehicle Age, Make and Series
APPENDIX B - Thefts and Recoveries of Insured Vehicles B-lStratified by Calendar Year, Vehicle Age,Make, Series and Model
APPENDIX C - Average Loss Payments for Stolen Vehicles C-lStratified by Calendar Year, Vehicle Age,Make, Series and Model
APPENDIX D - Trends in Automobile Comprehensive Premiums D-lDuring 1983-1988
Vll
LIST OF TABLES
No. Title Page
1 Major Parts Subject to Labelling Requirements 7
2 Insurer Reporting Requirements of Motor Vehicle 10Theft Law Enforcement Act of 1984
3 Theft Rates for Current Model Year Insured 17Vehicles by Vehicle Type
4 Theft Rates for Current Model Year Marked and 21Unmarked Passenger Cars (P.C.)
5 Results of Proportions Tests to Examine Changes 2 4in Theft Rates for Marked Passenger Cars Afterthe Marking Program Began
6 Results of Proportion Tests to Compare Theft 27Rates for Cars with Anti-Theft Devices withRates for Marked and Unmarked Cars
7 Recovery Rates for Current Model Year Vehicles 3 2by Vehicle Type
8 Results of Proportions Tests to Compare 35Recovery Rates Before and After Implementationof Theft Prevention Standard
9 Results of Proportions Tests to Examine Changes 3 6in Recovery Rates for Marked Passenger Cars Afterthe Marking Program Began
10 Results of Proportions Tests to Examine 3 8Recovery Rates of Vehicles with Anti-TheftDevices
11 Results of Proportions Tests to Compare Changes 4 0in the Proportion of Passenger Cars RecoveredIntact, In-Whole and In-Part After the MarkingProgram Began
12 Results of Proportions Tests to Compare Changes 43in the Maximum Proportion of Professional Thefts(Tp) After the Marking Program Began
13 Average Annual Insurer Loss Payments for CMY 51Vehicles Stolen During 1983-1988
viii
LIST OF TABLES
No,
14 Insurance Theft Costs for CMY Passenger Cars 54Before and After Marking Program
15 Results of Statistical Tests to Examine Changes 56in Average Claim Payments for Marked PassengerCars After the Marking Program Began
16 Results of Statistical Tests to Compare Changes 58in the Claim Costs of CMY Passenger CarsRecovered Intact, In-Whole and In-Part Beforeand After the Marking Program Began
17 Results of Analysis of Trends in Comprehensive 72Premiums During 1983-1988
IX
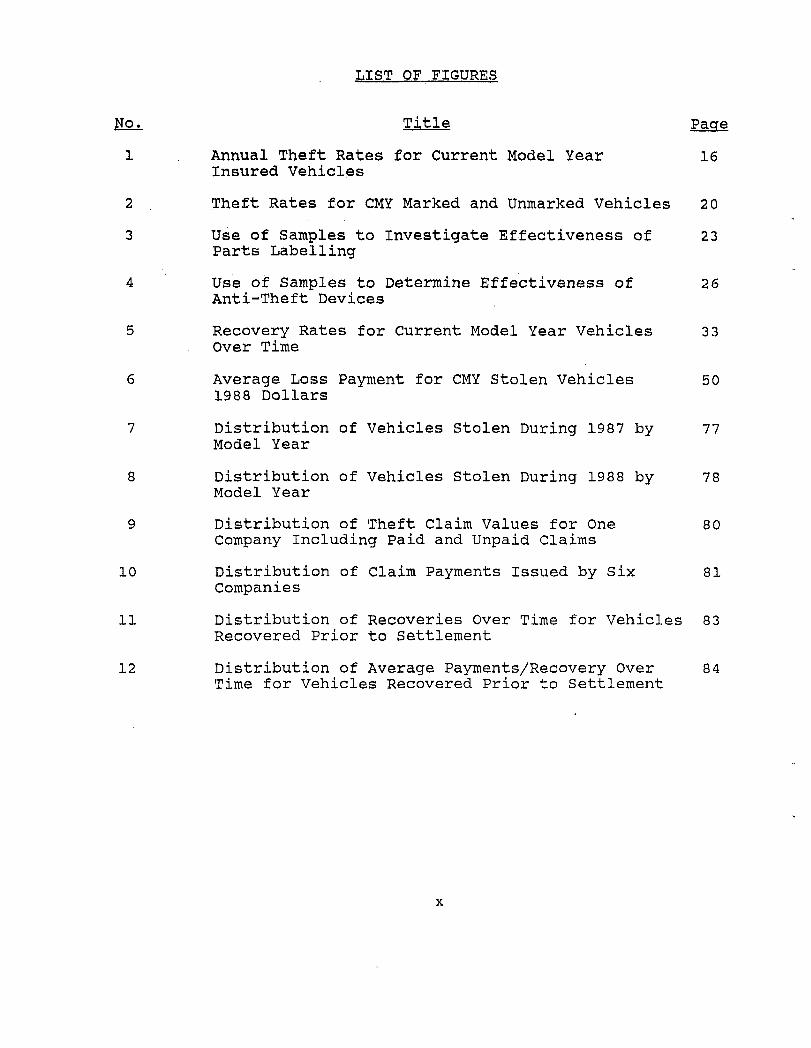
LIST OF FIGURES
page
1 Annual Theft Rates for Current Model Year 16Insured Vehicles
2 Theft Rates for CMY Marked and Unmarked Vehicles 20
3 Use of Samples to Investigate Effectiveness of 23Parts Labelling
4 Use of Samples to Determine Effectiveness of 2 6Anti-Theft Devices
5 Recovery Rates for Current Model Year Vehicles 3 3Over Time
6 Average Loss Payment for CMY Stolen Vehicles 501988 Dollars
7 Distribution of Vehicles stolen During 1987 by 77Model Year
8 Distribution of Vehicles Stolen During 1988 by 78Model Year
9 Distribution of Theft Claim Values for One 80Company Including Paid and Unpaid Claims
10 Distribution of Claim Payments Issued by Six 81Companies
11 Distribution of Recoveries Over Time for Vehicles 83Recovered Prior to Settlement
12 Distribution of Average Payments/Recovery Over 84Time for Vehicles Recovered Prior to Settlement
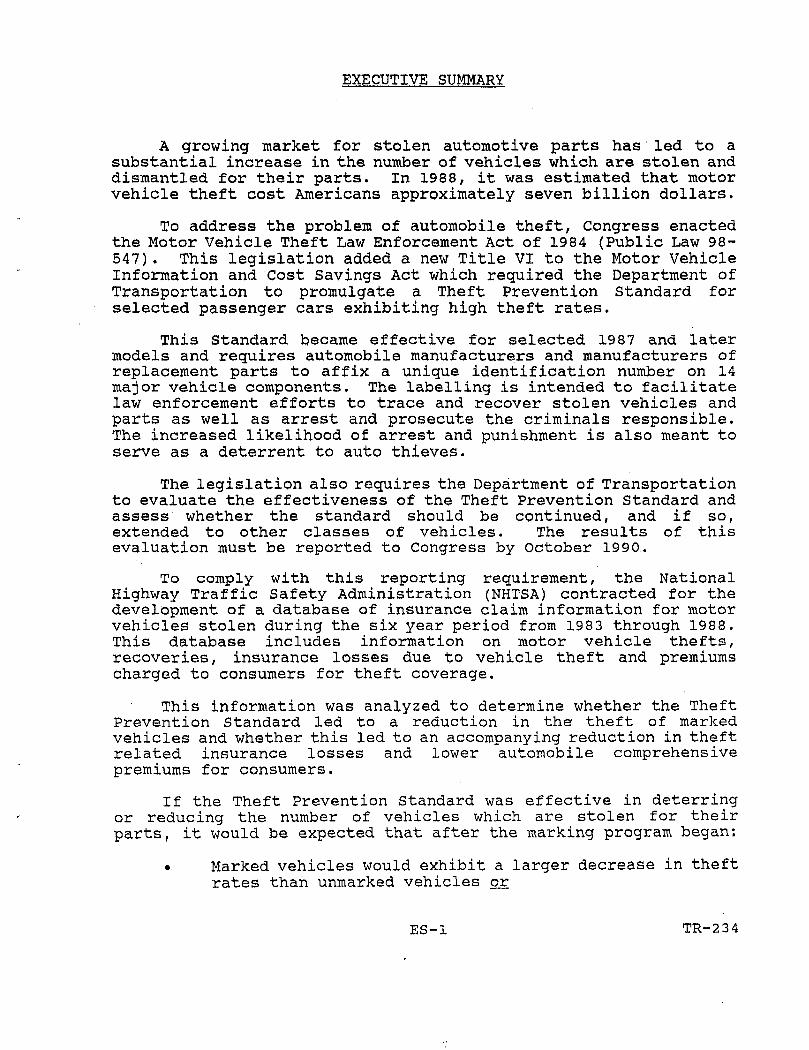
EXECUTIVE SUMMARY
A growing market for stolen automotive parts has led to asubstantial increase in the number of vehicles which are stolen anddismantled for their parts. In 1988, it was estimated that motorvehicle theft cost Americans approximately seven billion dollars.
To address the problem of automobile theft, Congress enactedthe Motor Vehicle Theft Law Enforcement Act of 1984 (Public Law 98-547). This legislation added a new Title VI to the Motor VehicleInformation and Cost Savings Act which required the Department ofTransportation to promulgate a Theft Prevention Standard forselected passenger cars exhibiting high theft rates.
This Standard became effective for selected 1987 and latermodels and requires automobile manufacturers and manufacturers ofreplacement parts to affix a unique identification number on 14major vehicle components. The labelling is intended to facilitatelaw enforcement efforts to trace and recover stolen vehicles andparts as well as arrest and prosecute the criminals responsible.The increased likelihood of arrest and punishment is also meant toserve as a deterrent to auto thieves.
The legislation also requires the Department of Transportationto evaluate the effectiveness of the Theft Prevention Standard andassess whether the standard should be continued, and if so,extended to other classes of vehicles. The results of thisevaluation must be reported to Congress by October 199 0.
To comply with this reporting requirement, the NationalHighway Traffic Safety Administration (NHTSA) contracted for thedevelopment of a database of insurance claim information for motorvehicles stolen during the six year period from 1983 through 1988.This database includes information on motor vehicle thefts,recoveries, insurance losses due to vehicle theft and premiumscharged to consumers for theft coverage.
This information was analyzed to determine whether the TheftPrevention Standard led to a reduction in the theft of markedvehicles and whether this led to an accompanying reduction in theftrelated insurance losses and lower automobile comprehensivepremiums for consumers.
If the Theft Prevention Standard was effective in deterringor reducing the number of vehicles which are stolen for theirparts, it would be expected that after the marking program began:
• Marked vehicles would exhibit a larger decrease in theftrates than unmarked vehicles or
ES-1 TR-234
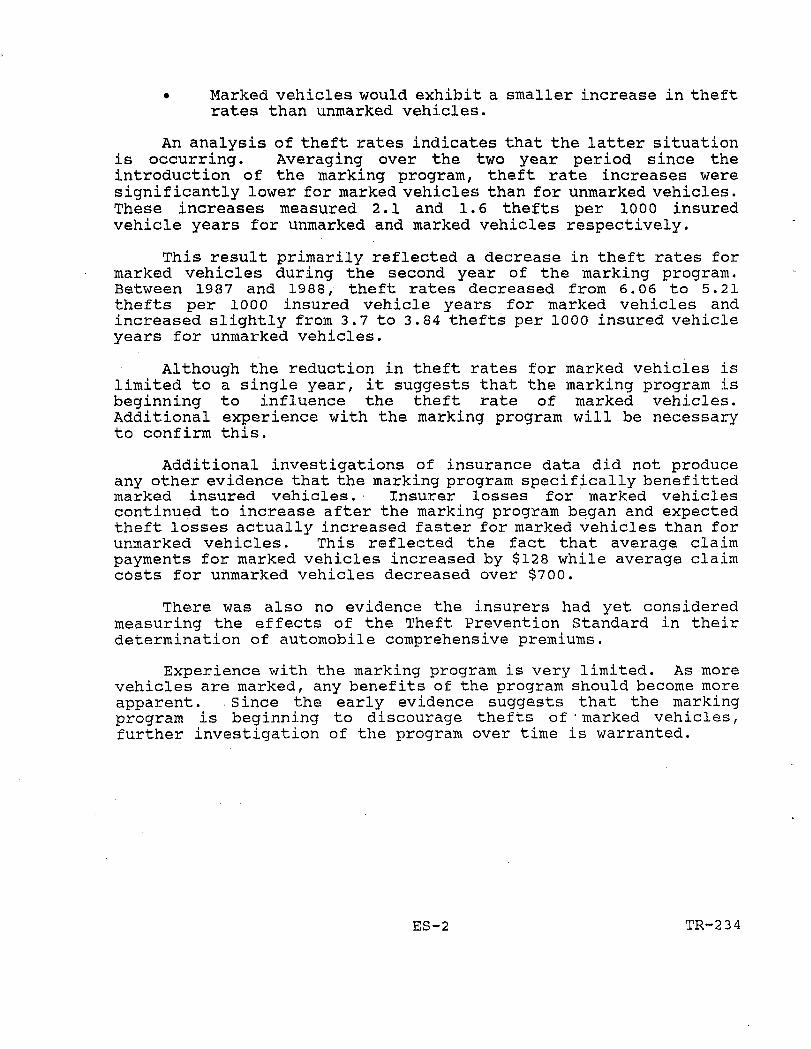
• Marked vehicles would exhibit a smaller increase in theftrates than unmarked vehicles.
An analysis of theft rates indicates that the latter situationis occurring. Averaging over the two year period since theintroduction of the marking program, theft rate increases weresignificantly lower for marked vehicles than for unmarked vehicles.These increases measured 2.1 and 1.6 thefts per 1000 insuredvehicle years for unmarked and marked vehicles respectively.
This result primarily reflected a decrease in theft rates formarked vehicles during the second year of the marking program.Between 1987 and 1988, theft rates decreased from 6.06 to 5.21thefts per 1000 insured vehicle years for marked vehicles andincreased slightly from 3.7 to 3.84 thefts per 1000 insured vehicleyears for unmarked vehicles.
Although the reduction in theft rates for marked vehicles islimited to a single year, it suggests that the marking program isbeginning to influence the theft rate of marked vehicles.Additional experience with the marking program will be necessaryto confirm this.
Additional investigations of insurance data did not produceany other evidence that the marking program specifically benefittedmarked insured vehicles. Insurer losses for marked vehiclescontinued to increase after the marking program began and expectedtheft losses actually increased faster for marked vehicles than forunmarked vehicles. This reflected the fact that average claimpayments for marked vehicles increased by $128 while average claimcosts for unmarked vehicles decreased over $700.
There was also no evidence the insurers had yet consideredmeasuring the effects of the Theft Prevention Standard in theirdetermination of automobile comprehensive premiums.
Experience with the marking program is very limited. As morevehicles are marked, any benefits of the program should become moreapparent. Since the early evidence suggests that the markingprogram is beginning to discourage thefts of •marked vehicles,further investigation of the program over time is warranted.
ES-2 TR-234

1- INTRODUCTION
This document constitutes the final report for researchperformed by KLD Associates, Inc. for the National Highway TrafficSafety Administration (NHTSA) under Contract DTNH22-88-C-06000.
The purpose of this project was to examine insurance claimdata over the 1983-1988 period to identify whether the MotorVehicle Theft Law Enforcement Act of 1984 has encouraged areduction in automobile theft.
This legislation was enacted by Congress to combat the steadyincrease in the number of vehicles which are stolen and dismantledfor their parts.
The legislation required the Department of Transportation topromulgate a Theft Prevention Standard for selected 1987 and latermodels with high theft rates. This standard requires automobilemanufacturers and manufacturers of replacement parts to affix aunique identification number on major vehicle components. Thelabelling is intended to facilitate law enforcement efforts totrace and recover stolen vehicles and parts as well as arrest andprosecute the criminals responsible. The increased likelihood ofarrest and punishment is also meant to serve as a deterrent to autothieves.
The legislation also requires the NHTSA to report to Congresson the effectiveness of the Theft Prevention Standard and providespecific recommendations for the future continuation of thisstandard.
As part of the NHTSA's efforts to comply with this reportingrequirement, the Agency contracted for the development of adatabase of insurance claim information describing periods bothbefore and after the introduction of the parts labelling program.This database includes information on: thefts and recoveries ofinsured motor vehicles; insurer's exposure to theft losses; dollarlosses resulting from vehicle theft; and premiums charged toconsumers for theft coverage.
This information was analyzed to determine whether the markingprogram has encouraged a reduction in the thefts of insured motorvehicles for their parts and whether this has led to anaccompanying reduction in theft related insurance losses and lowerautomobile comprehensive premium rates for consumers.
1.1 Background
Over the last 2 0 years, the profile of automotive thefthas changed dramatically. In 1960, theft was considered to beprimarily a juvenile problem with approximately 94% (1) of theftsattributed to "joyriders". In the 1980's, motor vehicle theft has
1 TR-234
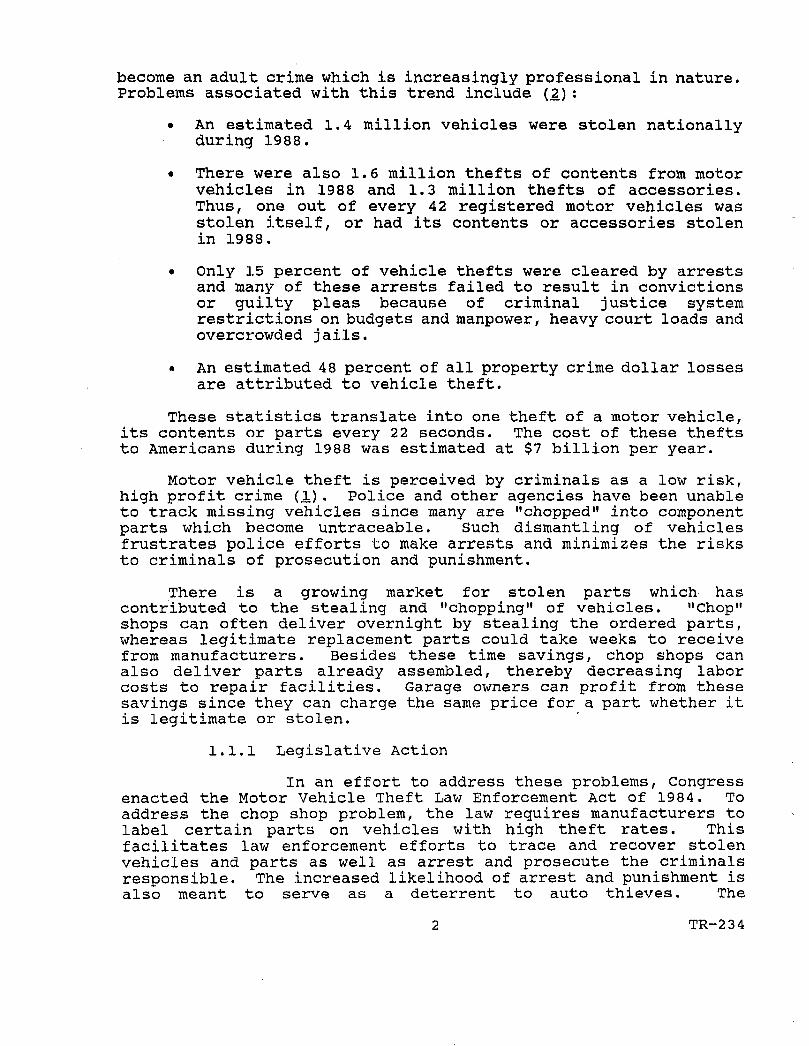
become an adult crime which is increasingly professional in nature.Problems associated with this trend include (2.) :
• An estimated 1.4 million vehicles were stolen nationallyduring 1988.
• There were also 1.6 million thefts of contents from motorvehicles in 1988 and 1.3 million thefts of accessories.Thus, one out of every 42 registered motor vehicles wasstolen itself, or had its contents or accessories stolenin 1988.
• Only 15 percent of vehicle thefts were cleared by arrestsand many of these arrests failed to result in convictionsor guilty pleas because of criminal justice systemrestrictions on budgets and manpower, heavy court loads andovercrowded jails.
• An estimated 48 percent of all property crime dollar lossesare attributed to vehicle theft.
These statistics translate into one theft of a motor vehicle,its contents or parts every 22 seconds. The cost of these theftsto Americans during 1988 was estimated at $7 billion per year.
Motor vehicle theft is perceived by criminals as a low risk,high profit crime (!). Police and other agencies have been unableto track missing vehicles since many are "chopped" into componentparts which become untraceable. Such dismantling of vehiclesfrustrates police efforts to make arrests and minimizes the risksto criminals of prosecution and punishment.
There is a growing market for stolen parts which hascontributed to the stealing and "chopping" of vehicles. "Chop"shops can often deliver overnight by stealing the ordered parts,whereas legitimate replacement parts could take weeks to receivefrom manufacturers. Besides these time savings, chop shops canalso deliver parts already assembled, thereby decreasing laborcosts to repair facilities. Garage owners can profit from thesesavings since they can charge the same price for a part whether itis legitimate or stolen.
1.1.1 Legislative Action
In an effort to address these problems, Congressenacted the Motor Vehicle Theft Law Enforcement Act of 1984. Toaddress the chop shop problem, the law requires manufacturers tolabel certain parts on vehicles with high theft rates. Thisfacilitates law enforcement efforts to trace and recover stolenvehicles and parts as well as arrest and prosecute the criminalsresponsible. The increased likelihood of arrest and punishment isalso meant to serve as a deterrent to auto thieves. The
2 TR-234
legislation also enacted criminal penalties for altering VehicleIdentification Numbers (VIN's) and for possessing, trafficking,importing or exporting stolen vehicles.
The purposes stated by Congress for this legislation were:
1) To provide for the identification of certain motorvehicles and their major replacement parts to impede motorvehicle thefts.
2) To augment Federal criminal penalties imposed upon personstrafficking in stolen motor vehicles.
3) To encourage decreases in premiums charged consumers formotor vehicle theft insurance.
4) To reduce opportunities for exporting or importing motorvehicle and off-highway mobile equipment.
Section 101(a) added a new Title VI to the Motor VehicleInformation and Cost Savings Act (15 US 1901), requiring theDepartment of Transportation to promulgate a Theft PreventionStandard for passenger cars with high theft rates. This is aminimum performance standard relating to the identification of newmotor vehicle parts and major replacement parts.
1.1.2 Actions Required by the Theft Act
The Theft Act calls for specific actions byseveral groups including:
• Automobile manufacturers (Original Equipment Manufacturersand Manufacturers of Replacement Parts)
• The Automobile Insurance Industry
• The National Highway Traffic Safety Administration (NHTSA)and Secretary of Transportation.
Under the Theft Act, manufacturers are held responsible forinscribing or affixing the appropriate identification numbers forthe affected parts and car lines.
1.1.2.1 Insurance Industry Requirements
The insurance industry is required toprovide information to the Secretary of Transportation underSection 612 of the Theft Act. The following information isrequired to be reported annually:
1) The thefts and recoveries of motor vehicles.
3 TR-234
2) The number of vehicles which have been recovered intact,in whole or in part.
3) The rating rules and plans, such as loss data and ratingcharacteristics, used by insurers to establish premiumsfor comprehensive insurance coverage for motor vehicles.Also to be included is the basis for such premiums andpremium penalties for those motor vehicles considered asmore likely to be stolen.
4) The actions taken by insurers to reduce premiums includingchanges in rate levels for automobile comprehensivecoverages due to a reduction in thefts of motor vehicles.
5) The actions taken by insurers to assist in deterring orreducing thefts of motor vehicles.
6) Other information as required by the Secretary ofTransportation to administer this title and produce thereport and findings required by this title.
1.1.2.2 Department of Transportation Requirements
Under the Title VI Theft PreventionStandard, the National Highway Traffic Safety Administration hasbeen given the responsibility to:
• Select the parts which are to be marked with theappropriate identification numbers.
• Select the high theft lines which are to be covered by therequirement.
• Establish the performance criteria for inscribing oraffixing the appropriate identification numbers.
• Specify the manner and form for compliance certificationand who will be authorized to certify compliance.
• Define specific annual insurer reporting requirements underSection 612.
• Identify insurers and leasing companies subject to theannual reporting requirements and grant exemptions fromthese requirements to insurers and small rental and leasingcompanies which qualify under Section 612.
• Grant an exemption from the standard if a line of vehiclesis manufactured with an anti-theft device which isdetermined to most likely be as effective as the standardin deterring theft.
4 TR-2 3 4
Under Section 614 of the legislation, the Secretary ofTransportation is required to submit two reports to Congress onMotor, Vehicle Theft. The first report was completed by NHTSA inOctdber 1987 ' (H) and describes the impact of automotive theft onthe insurance industry during calendar year 1985. This time framepreceded the implementation of the Theft Prevention Standard.
A second report is required, to be submitted to Congress inOctober 1990. This report will provide an extensive evaluation ofthe effectiveness of the Motor Vehicle Theft Prevention Standardincluding recommendations to Congress to either:
• Continue the standard without change.
• Modify the standard to include fewer passenger car lines.
• Modify the standard to include other classes of motorvehicles, such as trucks, vans and motorcycles.
• Terminate the standard.
As required by subsection 614 b, the report shall alsoinclude:
A) The methods and procedures used by public and privateentities for collecting, compiling and disseminatinginformation concerning the theft and recovery of motorvehicles including:
1) The accuracy, reliability and timeliness of the data.2) How such information can be improved.
B) Data on the number of motor vehicles stolen and recoveredannually compiled by vehicle class, make and line.
C) The extent to which motor vehicles stolen annually aredismantled or exported.
D) A description of the market for such stolen parts.
E) Information concerning costs incurred by manufacturers andcar purchasers in order to comply with the standard, aswell as the dollar benefits of the standard and the extentto which these benefits exceed costs.
F) The experience of Federal, State and local officials inmaking arrests and successfully prosecuting violators.
G) Information concerning comprehensive premiums charged byinsurers including any increase in these premiums chargedbecause a vehicle is a likely candidate for theft. Alsothe extent to which the standard may have led to reduced
5 TR-234
comprehensive premiums or alleviated premium increases.
H) The adequacy and effectiveness of Federal and State lawsaimed at preventing the distribution and sale of usedparts removed from stolen vehicles.
I) An assessment of whether the identification of part$ forclasses other than passenger cars would be beneficial.
J) Any other information available to theconcerning the impact of the Act,
1.2 NHTSA Actions in Response to Legislation
Secretary
As empowered under the Motor Vehicle Theft LawEnforcement Act of 1984, the NHTSA promulgated a series of rulesto implement the Theft Prevention Standard. These rules
M c h must be marked and the labelling
Vare covered by the requirement,
"irements and the insurers
•-r results are
':•/ ''
iitndto
,<-234
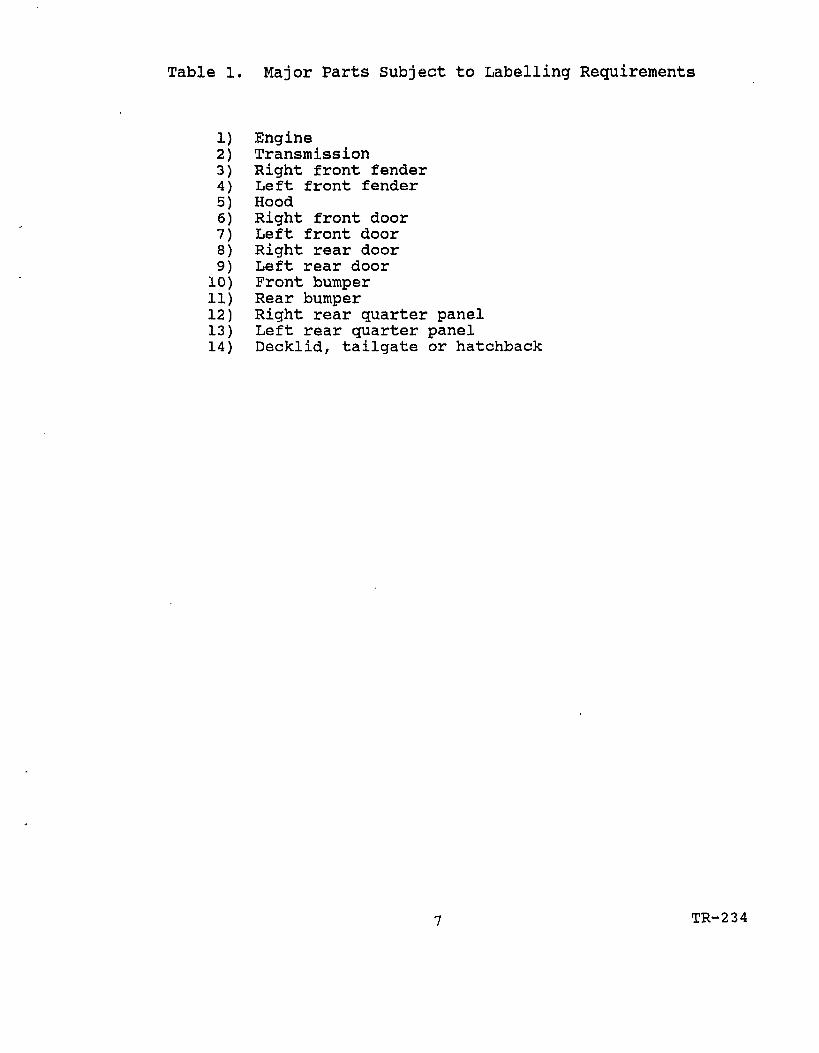
Table 1. Major Parts Subject to Labelling Requirements
1) Engine2) Transmission3) Right front fender4) Left front fender5) Hood6) Right front door7) Left front door8) Right rear door9) Left rear door10) Front bumper11) Rear bumper12) Right rear quarter panel13) Left rear quarter panel14) Decklid, tailgate or hatchback
TR-2 34
]p$ stolen and fenced with minimal risk.
Thus, the VIN marking requirements apply to twelve majorcomponents of two door vehicles and fourteen major components offour door vehicles.
1.2.2 Selection of High Theft Lines
The Theft Act defined three categories of carlines as high theft lines for purposes of the Theft PreventionStandard. These categories include:
1) Existing lines that had a theft rate exceeding the mediantheft rate in 1983 and 1984.
2) New lines likely to have a theft rate exceeding the mediantheft rate.
3) Existing or new lines that had a theft rate below themedian rate, but had a majority of major parts which areinterchangeable with lines whose theft rate exceeded oris likely to exceed the 1983 and 1984 median theft rate.
Existing lines were defined as lines first produced beforeJanuary 1, 1983.
The Theft Act also directed the Department of Transportationto compile and publish theft rate listings for model year 1983 andlater car lines offered for sale in the United States. The initiallisting was published in November 1985 for model years 1983 and1984 and covered 130 car lines. It also set the median theft ratefor car lines subject to the Standard at 3.2712 thefts per 1,000vehicles produced.
The requirements for labelling automotive parts becameeffective for 1987 model year vehicles. In April of 1986, NHTSAselected the 1987 car lines subject to these labellingrequirements. Existing lines were selected on the basis of actualtheft data. New lines were selected according to definedprocedures (5). Several of the car lines initially selected werefound to be equipped with anti-theft devices and-were subsequentlyexempted from the standard in November 1986.
Lines subject to the parts labelling requirements during 1987and 1988 are identified in Appendix B.
1.2.3 Selection of Insurer Reporting Requirements andSubject Insurers
In January 1987, the NHTSA promulgated a finalrule (6.) which defined the insurer reporting requirements underSection 612 of the Theft Act and identified 31 insurers who were
8 TR-234
subject to these reporting requirements. The information submittedby insurers under this rule is intended to aid NHTSA in its effortsto publish the required insurance information in a form that wouldbe helpful to the public, the law enforcement community and theCongress.
The insurer reports also provide the NHTSA with informationneeded to prepare the 1987 and 1990 evaluation reports for Congressas required in Section 614 of the legislation.
An initial list of the insurance reporting requirements wasspecified by Congress in the legislation as indicated in Section1.1.2.1 of this report. Under the authority given to NHTSA indeveloping its final rule, one additional reporting requirementwas added to assist the agency in determining whether anti-theftdevices are as effective as parts marking in deterring and reducingvehicle thefts.
Considering the Congressional intent of the insurer reportingrequirements, the agency formulated its reporting rule so that:
1) Insurers are required to report only information essentialto the purposes of the Theft Act.
2) The costs of time and money imposed upon the insurers tosupply information should be kept to the minimum necessaryto satisfy the need for information.
3) To the maximum extent possible, insurers should reportdata previously gathered for their own purposes. Thegeneration of new data could be justified only if thisdata was explicitly required by Section 612 of thelegislation.
Given these considerations, the final rule requires that onlytheft and recovery data be stratified according to model, make andline. Loss and rating information are to be provided to the NHTSAin the same categories used by the insurers for their own purposes.This approach imposes the minimum burden on the insurers becausethey do not have to reformat their data.
The actual reporting requirements under the NHTSAfs final ruleare presented in Table 2.
The first insurer reports were filed with the NHTSA Office ofRulemaking in January 1987 covering calendar year 1985. Theinformation in these reports was reviewed and analyzed by theOffice of Rulemaking and was incorporated in NHTSA"s October 1987report. Insurer reports for each calendar year after 1985 are dueapproximately 10 months after the year has concluded.
TR-2 34
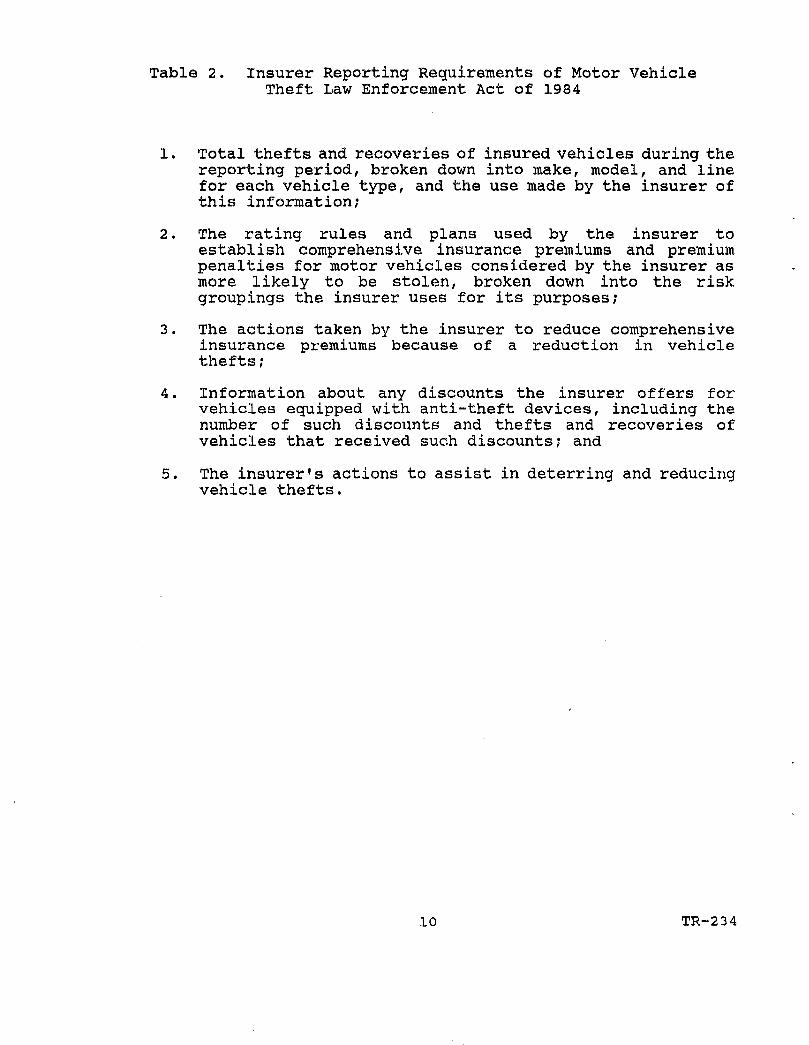
Table 2. Insurer Reporting Requirements of Motor VehicleTheft Law Enforcement Act of 1984
1. Total thefts and recoveries of insured vehicles during thereporting period, broken down into make, model, and linefor each vehicle type, and the use made by the insurer ofthis information;
2. The rating rules and plans used by the insurer toestablish comprehensive insurance premiums and premiumpenalties for motor vehicles considered by the insurer asmore likely to be stolen, broken down into the riskgroupings the insurer uses for its purposes;
3. The actions taken by the insurer to reduce comprehensiveinsurance premiums because of a reduction in vehiclethefts;
4. Information about any discounts the insurer offers forvehicles equipped with anti-theft devices, including thenumber of such discounts and thefts and recoveries ofvehicles that received such discounts; and
5. The insurer's actions to assist in deterring and reducingvehicle thefts.
10 TR-234
Insurer reports for calendar years 1986 and 1987 have already-been submitted to the Department of Transportation. Reports for1988 were submitted in November 1989,
1*3 Role of This Study
This study represents one of several efforts to provideinformation for NHTSA's evaluation of the effectiveness of theTheft Prevention Standard. This study examines the impact of theparts marking program on the thefts and recoveries of insured motorvehicles. The purpose of the Theft Act was not only to deterautomobile theft but also to encourage decreases in thecomprehensive premiums charged for motor vehicle theft insurance.Therefore, this study also examines whether the marking program hasresulted in any reduction in insiirer theft losses for vehicles withmarked parts and whether any such savings have been translated intoreduced comprehensive insurance premiums for consumers.
The information analyzed in this project was furnished by alimited number of major insurers who voluntarily cooperated withthe NHTSA to provide important data for the evaluation of the TheftPrevention Standard. The claim information provided for thisproject was much more detailed than the information supplied underthe mandatory insurer reporting requirements of Section 612 of theTheft Act.
Besides the additional detail, the information also includesannual theft data as far back as 1983 whereas Section 612 did notrequire annual insurer reporting information prior to 1985.
For purposes of evaluating the Theft Prevention Standard, itis important to consider theft data back to 1983 since the firstlines subjected to the parts labelling requirements in model year1987, were selected on the basis of their 1983-1984 theft rates.
1.4 Data Sources
The data base developed for the evaluation of the TheftPrevention Standard includes insurance claim information on motorvehicle thefts, recoveries, exposure to theft losses, payments dueto vehicle theft and automobile comprehensive premiums charged toconsumers during 1983-1988.
This information covers several years before and two yearsafter the marking program began.
The information provided by the insurance industry included:
• A computer file produced by the National Automobile TheftBureau (NATB) describing stolen insured vehicles and theircondition upon recovery. This sample represents the 1983-19 8 8 vehicle theft experience of seven companies including:
11 TR-234
Aetna, Allstate, Arnica, GEICO, State Farm, Travelers andUSAA.
• A computer file produced by the Highway Loss Data Institute(HLDI) describing individual insurer payments issued topolicyholders who sustained the theft of either a motorvehicle, its contents or components. This samplerepresents the 1983-1988 vehicle theft experience of fivecompanies including: Aetna, Allstate, GEICO, State Farm andTravelers.
• A computer file produced by the HLDI describing insurers'exposure to theft losses (in insured vehicle years) bymodel and model year for 1983 through 1988. This filecontains the aggregate exposure of six companies including:Aetna, Allstate, GEICO, State Farm, Travelers and USAA.
» Detailed theft claim records provided by one companyindicating costs to repair recovered damaged vehicles totheir pre-theft state.
• Data to identify the automobile comprehensive premiumscharged to consumers during 1983-1988. Premium chargeswere obtained for six companies: Aetna, Arnica, Geico, StateFarm, Travelers and USAA for all vehicle ratingclassifications in up to 10 states.
1-5 Report Organization
Section 2 examines theft rates for insured vehiclesbefore and after the marking program began to determine whetherparts labelling has encouraged a reduction in the rate of theftsof marked vehicles.
Section 3 similarly examines recovery rates and the conditionof recovered vehicles to determine whether the marking program hasinfluenced a reduction in the proportion of vehicles which arestolen either for their parts or for export.
Section 4 considers whether insurance losses for stolen markedvehicles were reduced after the marking program'began.
Section 5 examines the variability in automobile comprehensivepremiums charged during 1983-1988 and examines the influence ofchanges in theft losses on comprehensive rates.
Section 6 examines specific characteristics of passenger cartheft claims filed during 1987-1988. These characteristics includethe distribution of theft claims by vehicle age, the proportion ofinsurance claims settled without payments issued to policyholders,the proportion of recovered vehicles found before the claim wassettled and the cost to repair recovered vehicles to their pre-
12 TR-234

theft state.
Section 7 presents the conclusions of this research project.
The report also includes four Appendix sections. Appendix Apresents vehicle theft rates during 1983-1988. These rates arebased on insurance data and are presented by calendar year, modelyear, vehicle type and vehicle line. These tabulations arediscussed in Section 2.
Appendix B describes the number of vehicles stolen andrecovered during 1983-1988 stratified by calendar year, vehicleage, vehicle type, make, line and model. These tabulations arediscussed in Section 3.
Appendix C presents the average payments issued by insurersfor stolen vehicles during 1983-1988. This information isstratified by calendar year, vehicle age, vehicle type, make andline. These tabulations are discussed in Section 4.
Appendix D presents a set of graphs depicting trends inautomobile comprehensive insurance rates in various states over the1983-1988 period. These graphs are discussed in Section 5.
13 TR-234
2. THEFT RATES FOR INSURED VEHICLES DURING 1983-1988
An important goal of the Theft Act is to encourage a reductionin the number of vehicles stolen by professional thieves who exportor dismantle vehicles for their parts. To examine whether thisgoal was met, theft rates were computed and compared before andafter the parts marking program was initiated.
The sections which follow describe how theft rates weredetermined by model year and line and identify whether anyreduction in theft rates was observed which might be attributableto the marking program.
2.1 Development of Theft Rates for 1983-1988
The National Automobile Theft Bureau (NATB) receivesreports of motor vehicle thefts and recoveries from over 600insurance companies throughout the United States. A nationwidesample of these reports was obtained for vehicles insured by sevenmajor companies including: Aetna, Allstate, Arnica, GEICO, StateFarm, Travelers and USAA. These companies represented 33% of thepremiums written for all types of motor vehicle insurance in theUnited States during 1984 (7).
NATB records were obtained for stolen vehicles insured by theselected companies during 1983-1988. Each calendar year sampleincluded vehicles of specific ages as follows:
Calendar Year Samples Vehicle Acres Included
1985-1988 Current Model Year (CMY), 1 and
2 year old vehicles
1984 CMY and 1 year old vehicles
1983 CMY vehiclesThese samples included vehicles produced before and after the
VIN labelling requirements of the Theft Act took effect. Withinthese samples, the marking program applied to selected:
• CMY 1987 vehicles stolen during 1987.
• CMY 1988 and 1 year old 1987 vehicles stolen during 1988.
This information was used to determine theft rates by modelyear and line during 1983-1988. Each theft rate, TR was definedas:
The Number of Insured Vehicles Stolen '
Insurers1 Exposure to Potential Theft
14 TR-2 3 4
The exposure to theft represents the time interval that eachindividual vehicle is insured. The exposure is expressed in unitsof insured vehicle years. Exposure by calendar year, model year,and, line was provided on behalf of participating insurers by theHighway Loss Data Institute.
Annual thefts, exposure and theft rates are presented inAppendix A by calendar year, model year, and vehicle line. Thesetheft rates represent the number of current model year vehiclesstolen annually per 1000 insured vehicle years.
2.2 Variation in Theft Rates During 1983-1988
Theft rates were examined to consider:
• The variation in rates for CMY vehicles over the 1983-1988period.
• The variation in rates by vehicle type.
• The variation in rates between marked vehicles, unmarkedvehicles and vehicles equipped with an anti-theft devicewhich were exempted from the marking program.
These analyses were designed to consider whether theft ratesdecreased for selected lines after they were labelled and whetherother vehicles would benefit from the labelling program.
2.2.1 Variation in Theft Rates Over Time
Figure 1 illustrates the variation in annual theftrates for CMY insured vehicles during 1983-1988. After an 11percent decrease in rates between 1983 and 1984, the theft rate forCMY vehicles increased between 1984 and 1988 from 2.56 to 4.38thefts per 1000 insured vehicle years (Table 3). This representedan increase of 2 9 percent over the two year period prior to theintroduction of parts labelling with a further increase of 3 2percent over the two. year period after the labelling began.
Of particular interest: is the fact that theft rates for CMYvehicles climbed dramatically (31.1 percent) the first year afterlabelling was introduced and increased only 0.9 percent the secondyear after labelling began. At first glance, this might suggestthat the overall problem of vehicle theft leveled in 1988 andsuggests the possibility that the marking program might have begunto restrain the annual increases in theft rates for CMY vehicles.
Upon further investigation, neither of these possibilitiesseems likely. The problem of vehicle theft continued to increasebetween 1987 and 1988 with theft rates for one and two year old
; 15 TR-2 3 4
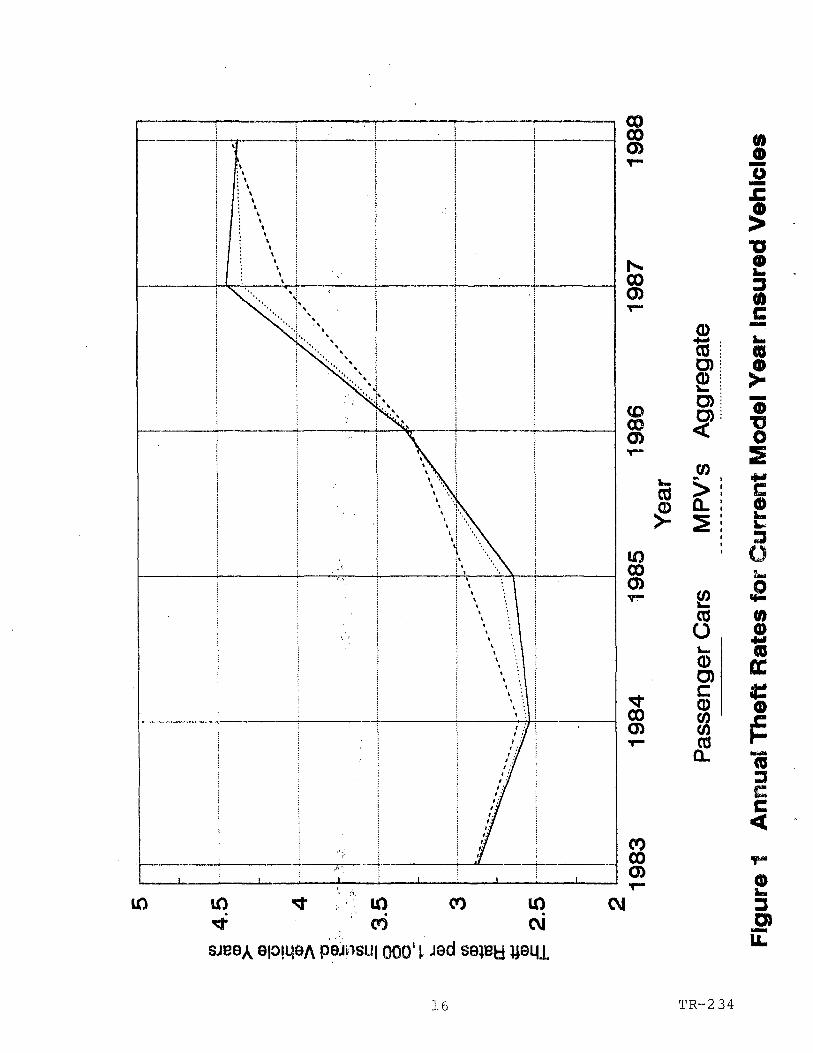
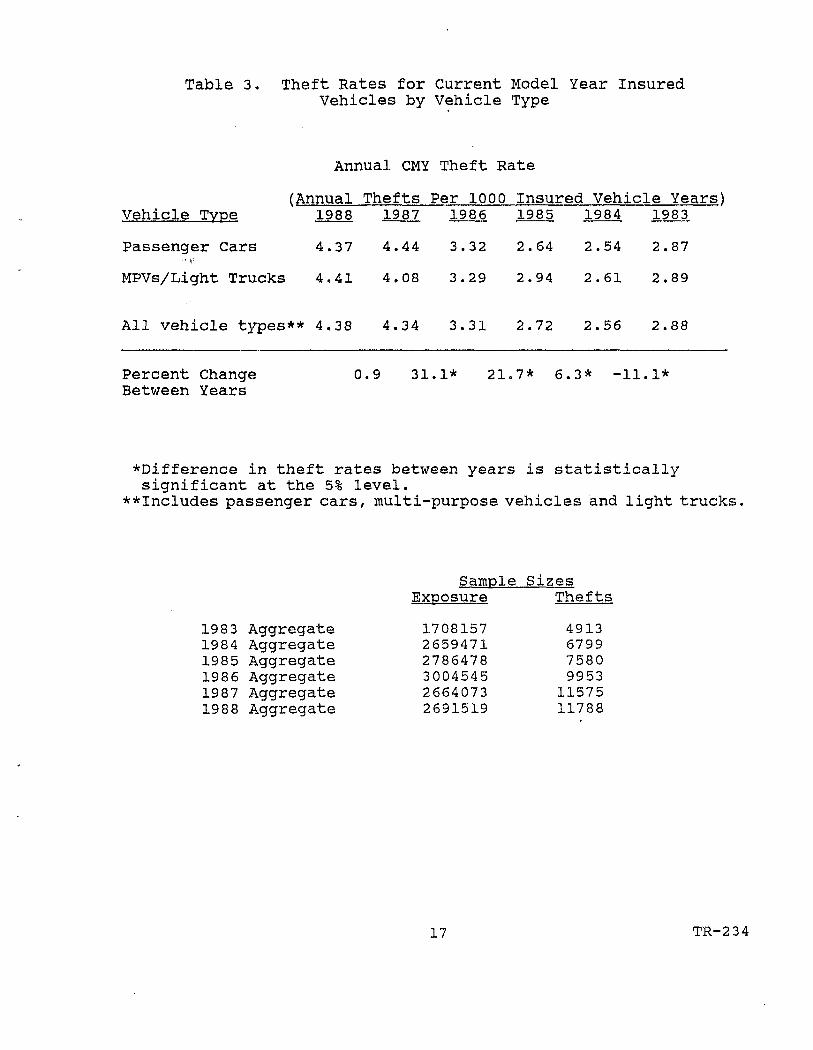
Table 3. Theft Rates for Current Model Year InsuredVehicles by Vehicle Type
Annual CMY Theft Rate
(Annual Thefts Per 1000 Insured Vehicle Years)Vehicle Type
Passenger Cars
MPVs/Light Trucks
1988
4.37
4.41
1987
4.44
4.08
1986
3.32
3.29
1985
2.64
2.94
1984
2.54
2.61
1983
2.87
2.89
All vehicle types** 4.38 4.34 3.31 2.72 2.56 2.88
Percent Change 0.9 31.1* 21.7* 6.3* -11.1*Between Years
*Difference in theft rates between years is statisticallysignificant at the 5% level.
**Includes passenger cars, multi-purpose vehicles and light trucks,
1983 Aggregate1984 Aggregate198 5 Aggregate198 6 Aggregate1987 Aggregate1988 Aggregate
SampleExposure
170815726594712786478300454526640732691519
SizesThefts
49136799758099531157511788
17 TR-234
vehicles increasing by 9.3 percent and 10.9 percent respectively(Appendix A). This is consistent with an 11.2 percent increase forall vehicle thefts between 1987 and 1988 reported by the NATB (2.) .
If the Theft Prevention Standard helped cause the rate ofincrease of thefts of CMY vehicles to slow between 1987-1988, itmight be expected that similar results would be observed between1987 and 1988 for one year old vehicles. Some of the one year oldvehicles were marked in 198 8 while none of the one year oldvehicles were marked in 1987. However, theft rates for one yearold vehicles continued to increase substantially between 1987-1988,even after some of these vehicles were marked. This would suggestthat the marking program did not play a substantive role in thechanges in overall theft rates for CMY vehicles observed between1987 and 1988.
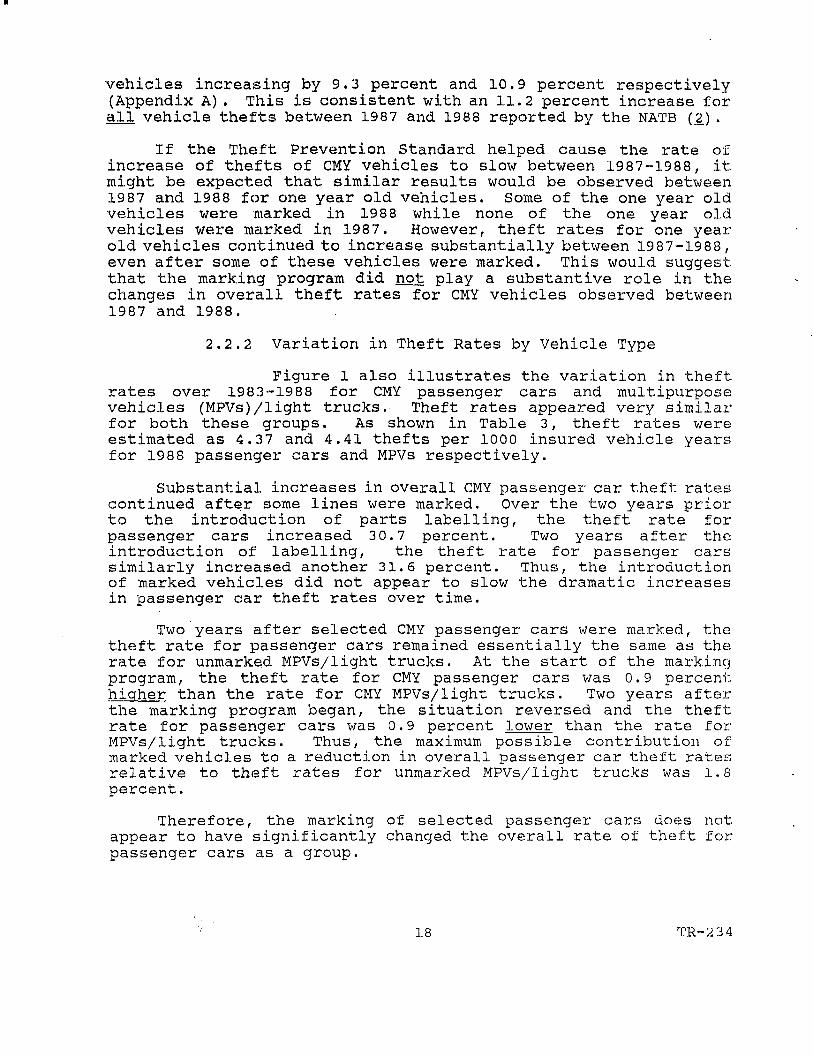
2.2.2 Variation in Theft Rates by Vehicle Type
Figure 1 also illustrates the variation in theftrates over 1983-1988 for CMY passenger cars and multipurposevehicles (MPVs)/light trucks. Theft rates appeared very similarfor both these groups. As shown in Table 3, theft rates wereestimated as 4.37 and 4.41 thefts per 1000 insured vehicle yearsfor 1988 passenger cars and MPVs respectively.
Substantial increases in overall CMY passenger car theft ratescontinued after some lines were marked. Over the two years priorto the introduction of parts labelling, the theft rate forpassenger cars increased 3 0.7 percent. Two years after theintroduction of labelling, the theft rate for passenger carssimilarly increased another 31.6 percent. Thus, the introductionof marked vehicles did not appear to slow the dramatic increasesin passenger car theft rates over time.
Two years after selected CMY passenger cars were marked, thetheft rate for passenger cars remained essentially the same as therate for unmarked MPVs/light trucks. At the start of the markingprogram, the theft rate for CMY passenger cars was 0.9 percenthigher than the rate for CMY MPVs/light trucks. Two years afterthe marking program began, the situation reversed and the theftrate for passenger cars was 0.9 percent lower than the rate forMPVs/light trucks. Thus, the maximum possible contribution ofmarked vehicles to a reduction in overall passenger car theft ratesrelative to theft rates for unmarked MPVs/light trucks was 1,8percent.
Therefore, the marking of selected passenger cars does notappear to have significantly changed the overall rate of theft forpassenger cars as a group.
18 TR-2 3 4
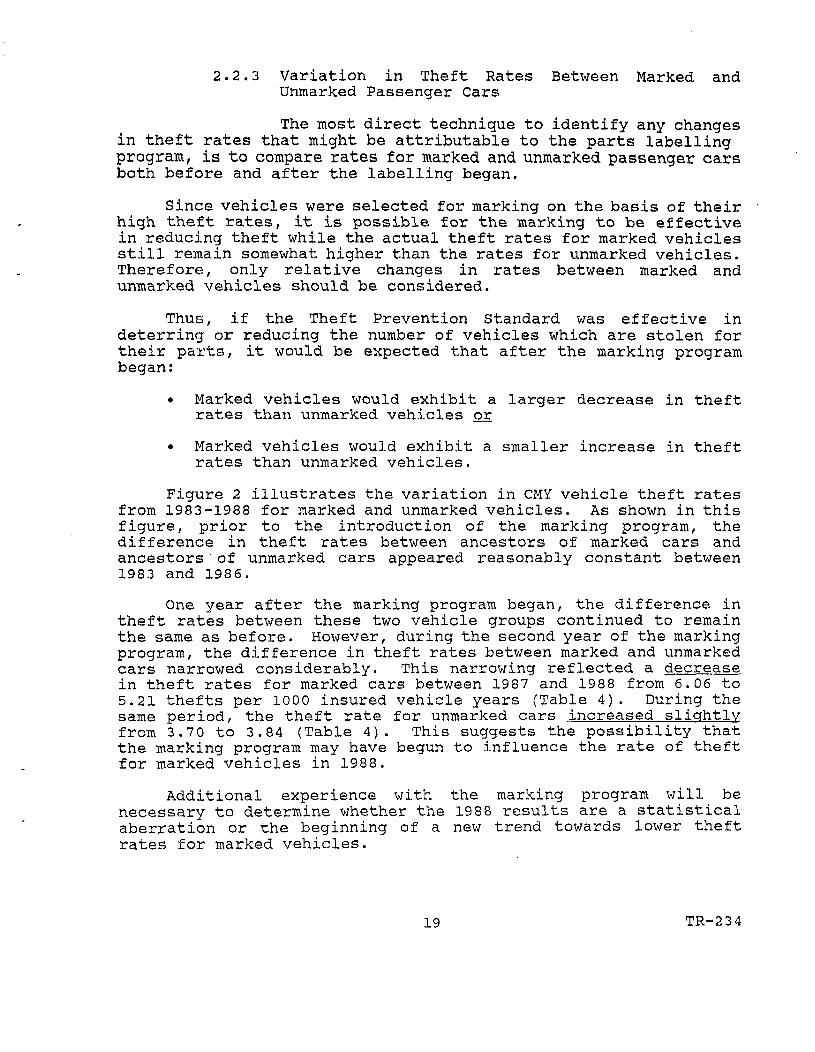
2.2.3 Variation in Theft Rates Between Marked andUnmarked Passenger Cars
The most direct technique to identify any changesin theft rates that might be attributable to the parts labellingprogram, is to compare rates for marked and unmarked passenger carsboth before and after the labelling began.
Since vehicles were selected for marking on the basis of theirhigh theft rates, it is possible for the marking to be effectivein reducing theft while the actual theft rates for marked vehiclesstill remain somewhat higher than the rates for unmarked vehicles.Therefore, only relative changes in rates between marked andunmarked vehicles should be considered.
Thus, if the Theft Prevention Standard was effective indeterring or reducing the number of vehicles which are stolen fortheir parts, it would be expected that after the marking programbegan:
• Marked vehicles would exhibit a larger decrease in theftrates than unmarked vehicles or
• Marked vehicles would exhibit a smaller increase in theftrates than unmarked vehicles.
Figure 2 illustrates the variation in CMY vehicle theft ratesfrom 1983-1988 for marked and unmarked vehicles. As shown in thisfigure, prior to the introduction of the marking program, thedifference in theft rates between ancestors of marked cars andancestors of unmarked cars appeared reasonably constant between1983 and 1986.
One year after the marking program began, the difference intheft rates between these two vehicle groups continued to remainthe same as before. However, during the second year of the markingprogram, the difference in theft rates between marked and unmarkedcars narrowed considerably. This narrowing reflected a decreasein theft rates for marked cars between 1987 and 1988 from 6.06 to5.21 thefts per 1000 insured vehicle years (Table 4). During thesame period, the theft rate for unmarked cars increased slightlyfrom 3.70 to 3.84 (Table 4). This suggests the possibility thatthe marking program may have begun to influence the rate of theftfor marked vehicles in 1988.
Additional experience with the marking program will benecessary to determine whether the 1988 results are a statisticalaberration or the beginning of a new trend towards lower theftrates for marked vehicles.
19 TR-234
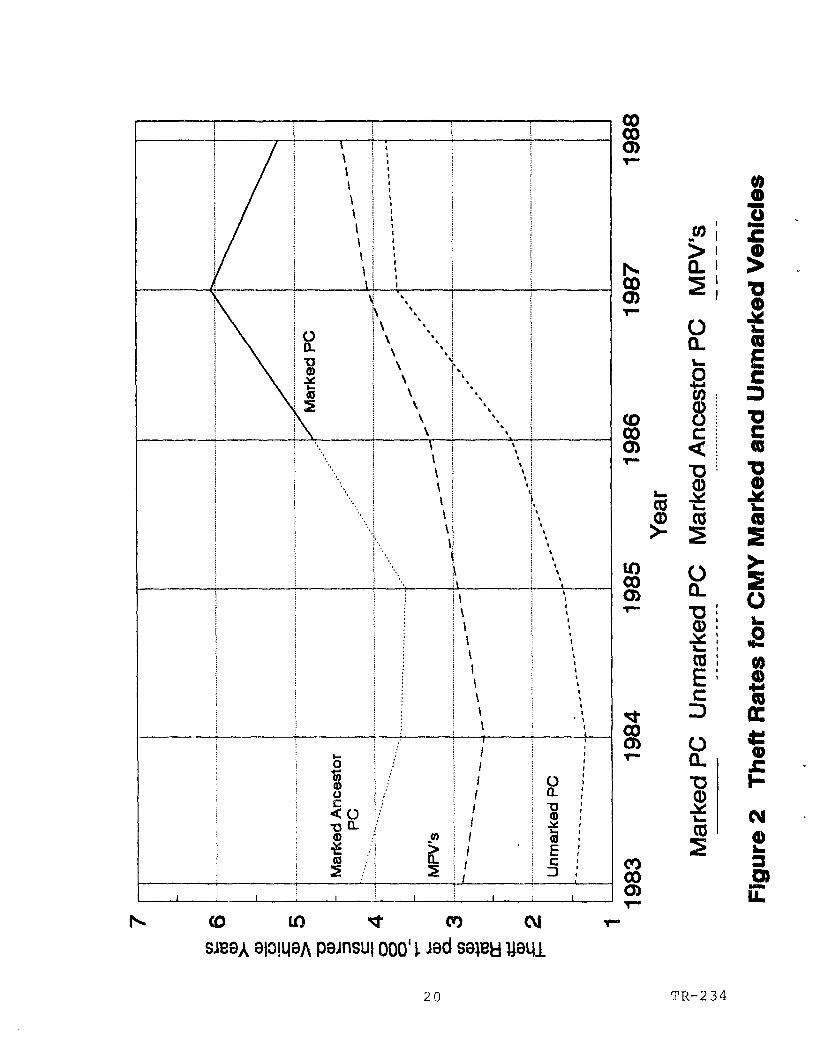
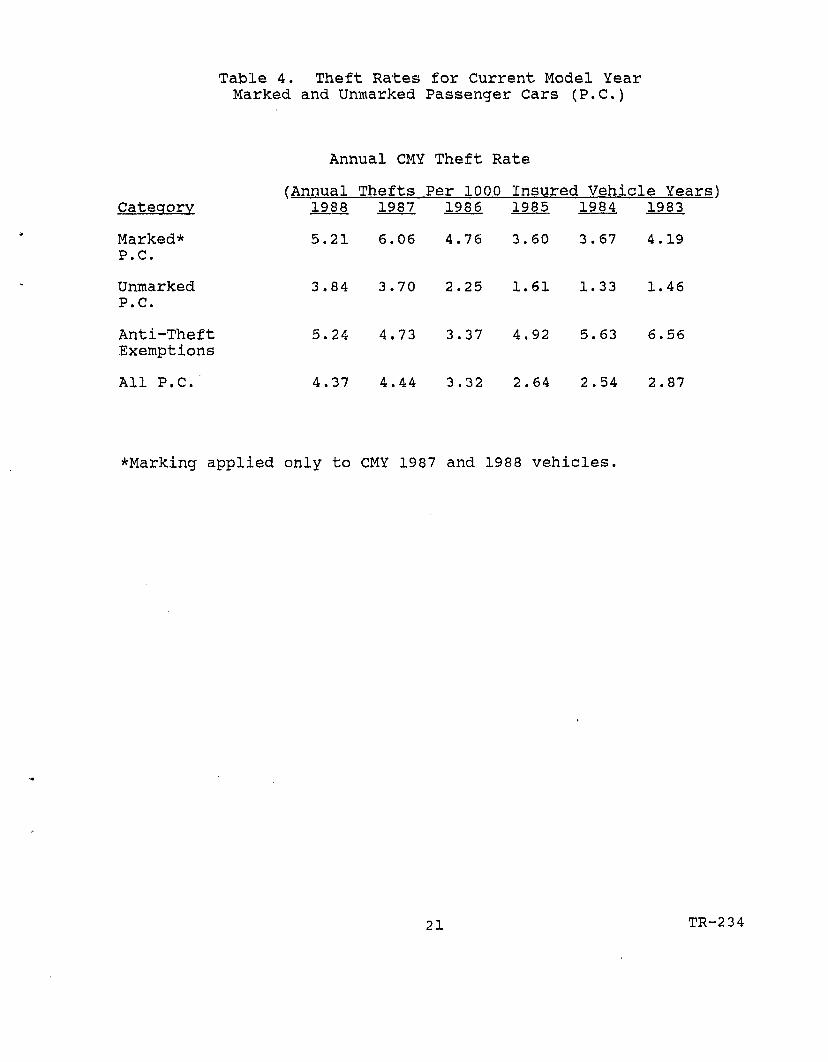
Table 4. Theft Rates for Current Model YearMarked and Unmarked Passenger Cars (P.C.)
Annual CMY Theft Rate
(Annual Thefts Per 1000 Insured Vehicle Years)Category 1988 1987 1986 1985 1984 1983
Marked* 5.21 6.06 4.76 3.60 3.67 4.19P.C.
Unmarked 3.84 3.70 2.25 1.61 1.33 1.46P.C.
Anti-Theft 5.24 4.73 3.37 4.92 5.63 6.56Exemptions
All P.C. 4.37 4.44 3.32 2.64 2.54 2.87
^Marking applied only to CMY 1987 and 1988 vehicles.
21 TR-2 3 4
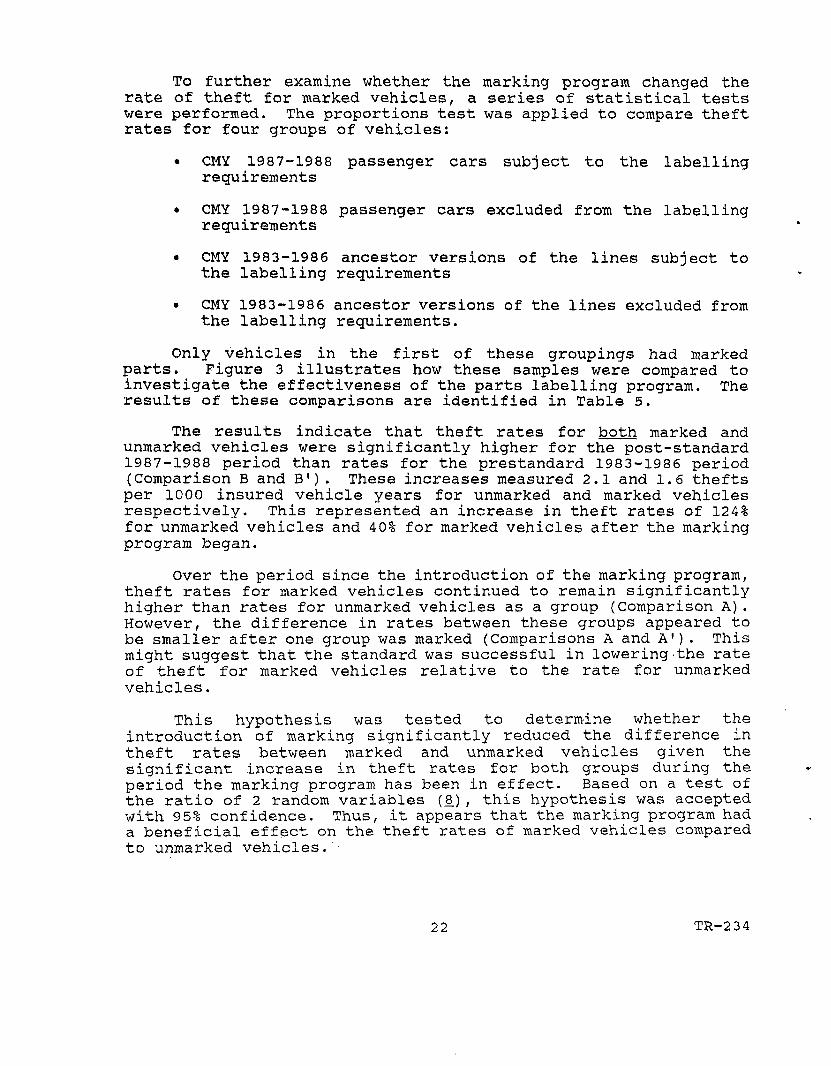
To further examine whether the marking program changed therate of theft for marked vehicles, a series of statistical testswere performed. The proportions test was applied to compare theftrates for four groups of vehicles:
• CMY 1987-1988 passenger cars subject to the labellingrequirements
• CMY 1987-1988 passenger cars excluded from the labellingrequirements
• CMY 1983-1986 ancestor versions of the lines subject tothe labelling requirements
• CMY 1983-1986 ancestor versions of the lines excluded fromthe labelling requirements.
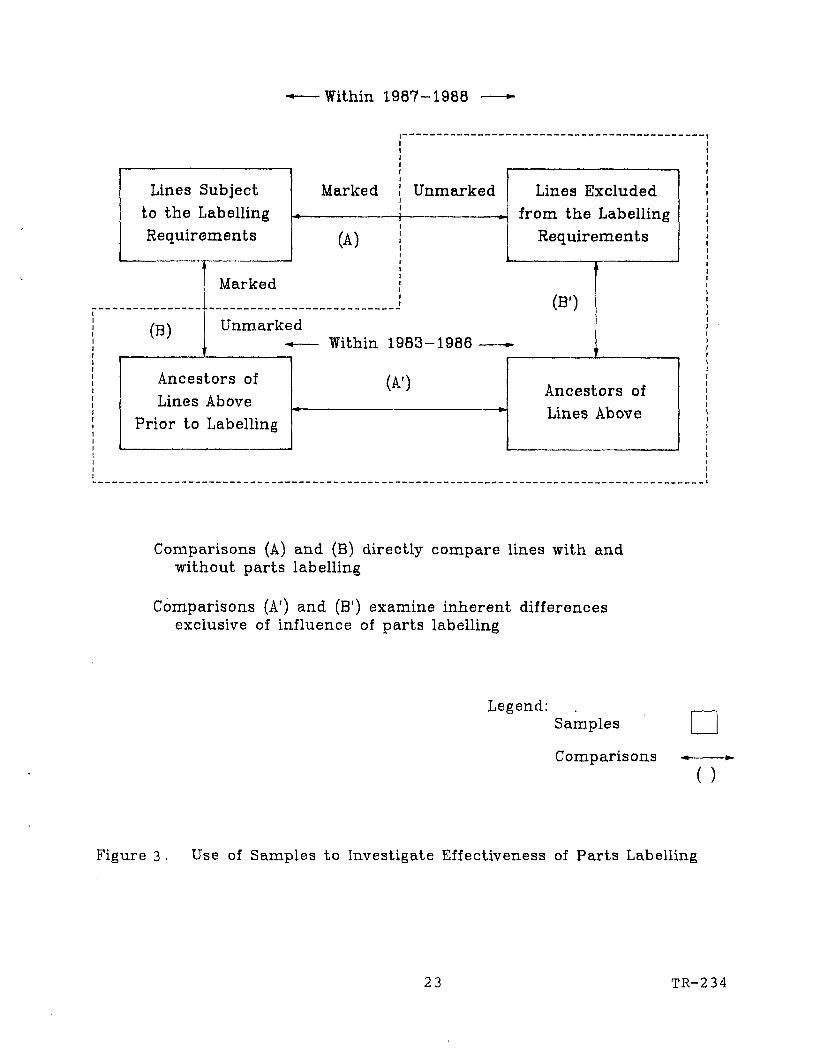
Only vehicles in the first of these groupings had markedparts. Figure 3 illustrates how these samples were compared toinvestigate the effectiveness of the parts labelling program. Theresults of these comparisons are identified in Table 5.
The results indicate that theft rates for both marked andunmarked vehicles were significantly higher for the post-standard1987-1988 period than rates for the prestandard 1983-1986 period(Comparison B and B1) . These increases measured 2.1 and 1.6 theftsper 1000 insured vehicle years for unmarked and marked vehiclesrespectively. This represented an increase in theft rates of 124%for unmarked vehicles and 4 0% for marked vehicles after the markingprogram began.
Over the period since the introduction of the marking program,theft rates for marked vehicles continued to remain significantlyhigher than rates for unmarked vehicles as a group (Comparison A).However, the difference in rates between these groups appeared tobe smaller after one group was marked (Comparisons A and A') . Thismight suggest that the standard was successful in lowering the rateof theft for marked vehicles relative to the rate for unmarkedvehicles.
This hypothesis was tested to determine whether theintroduction of marking significantly reduced the difference intheft rates between marked and unmarked vehicles given thesignificant increase in theft rates for both groups during theperiod the marking program has been in effect. Based on a test ofthe ratio of 2 random variables (8.) , this hypothesis was acceptedwith 95% confidence. Thus, it appears that the marking program hada beneficial effect on the theft rates of marked vehicles comparedto unmarked vehicles.
22 TR-2 34
Within 1987-1988
Lines Subjectto the LabellingRequirements
(B)
Marked
(A)
Marked
Unmarked
Unmarked- Within 1983-1986 .
Ancestors ofLines Above
Prior to Labelling
(A')
Lines Excludedfrom the Labelling
Requirements
(B')
Ancestors ofLines Above
Comparisons (A) and (B) directly compare lines with andwithout parts labelling
Comparisons (A') and (B1) examine inherent differencesexclusive of influence of parts labelling
Legend:Samples
Comparisons
Figure 3 . Use of Samples to Investigate Effectiveness of Parts Labelling
23 TR-234
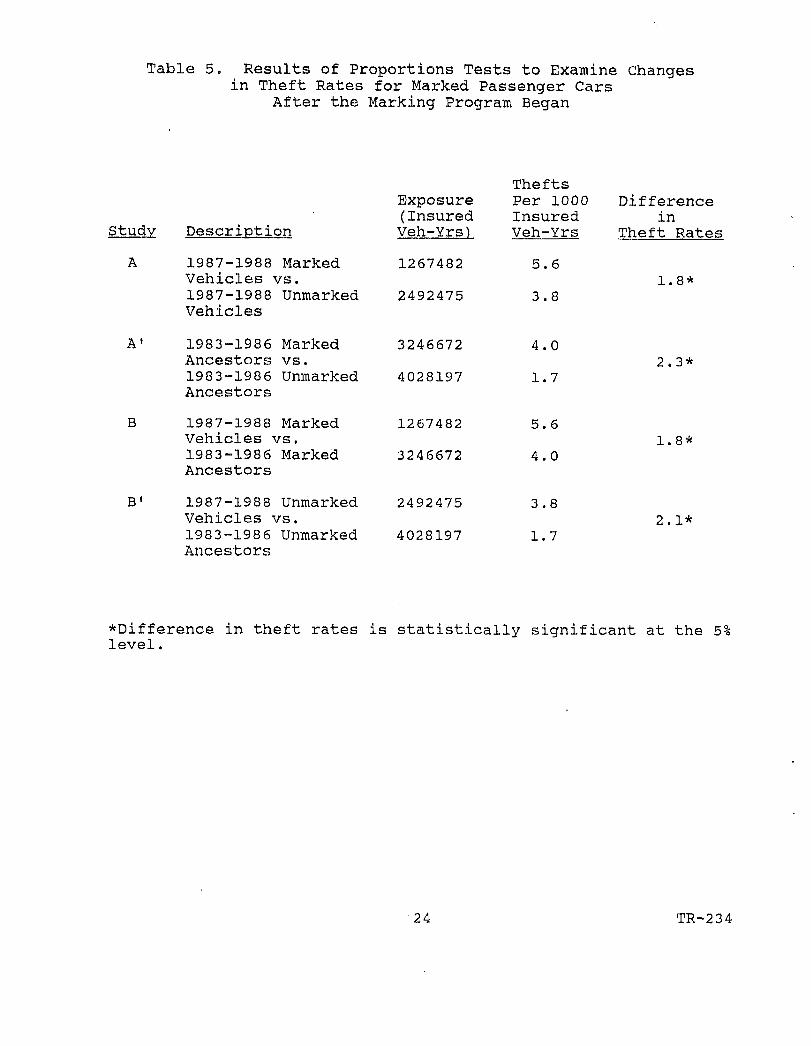
Table 5. Results of Proportions Tests to Examine Changesin Theft Rates for Marked Passenger Cars
After the Marking Program Began
Study
A
A1
B
B1
Description
1987-1988 MarkedVehicles vs.1987-1988 UnmarkedVehicles
1983-1986 MarkedAncestors vs.1983-1986 UnmarkedAncestors
1987-1988 MarkedVehicles vs.1983-1986 MarkedAncestors
1987-1988 UnmarkedVehicles vs.1983-1986 Unmarked
Exposure(InsuredVeh-Yrs)
1267482
2492475
3246672
4028197
1267482
3246672
2492475
4028197
TheftsPer 1000InsuredVeh-Yrs
5,
3,
4,
1,
5.
4.
3.
1.
.6
.8
.0
,7
,6
,0
,8
7
Differencein
Theft Rates
1.8*
2.3*
1.8*
2.1*
Ancestors
*Difference in theft rates is statistically significant at the 5%level.
24 TR-234
2.2.4 Variation in Theft Rates Between Vehicles withAnti-Theft Devices and Marked and Unmarked Cars
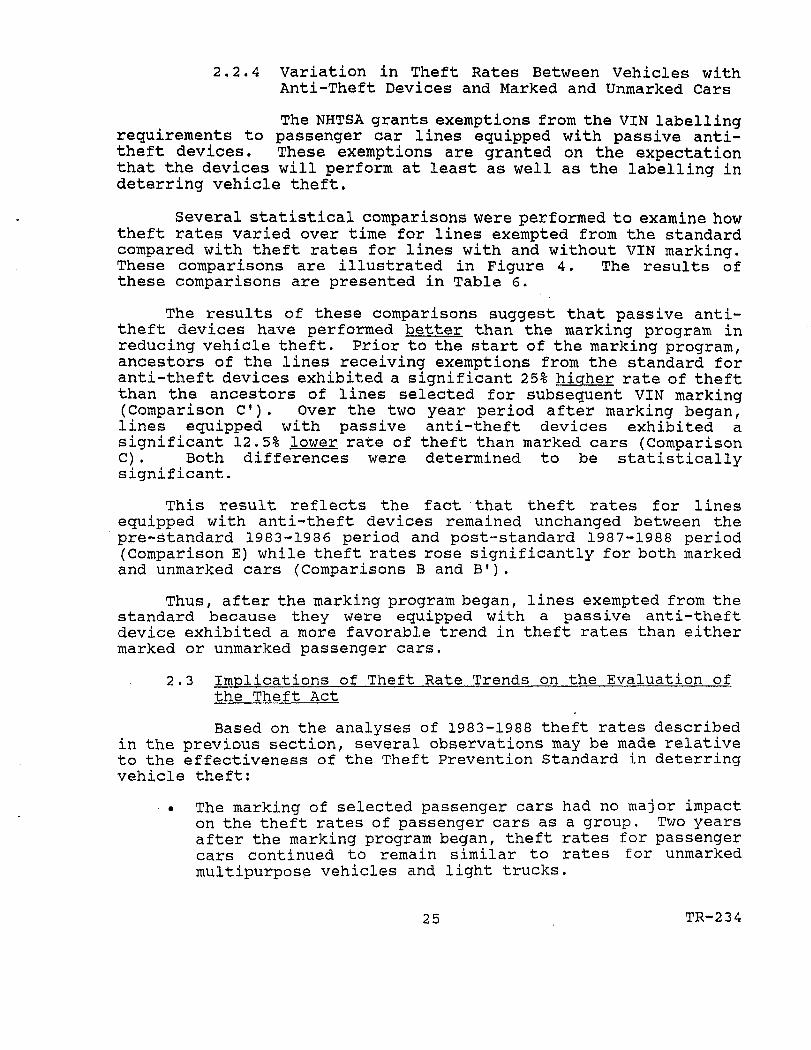
The NHTSA grants exemptions from the VIN labellingrequirements to passenger car lines equipped with passive anti-theft devices. These exemptions are granted on the expectationthat the devices will perform at least as well as the labelling indeterring vehicle theft.
Several statistical comparisons were performed to examine howtheft rates varied over time for lines exempted from the standardcompared with theft rates for lines with and without VIN marking.These comparisons are illustrated in Figure 4. The results ofthese comparisons are presented in Table 6.
The results of these comparisons suggest that passive anti-theft devices have performed better than the marking program inreducing vehicle theft. Prior to the start of the marking program,ancestors of the lines receiving exemptions from the standard foranti-theft devices exhibited a significant 25% higher rate of theftthan the ancestors of lines selected for subsequent VIN marking(Comparison C 1 ) . Over the two year period after marking began,lines equipped with passive anti-theft devices exhibited asignificant 12.5% lower rate of theft than marked cars (ComparisonC). Both differences were determined to be statisticallysignificant.
This result reflects the fact that theft rates for linesequipped with anti-theft devices remained unchanged between thepre-standard 1983-1986 period and post-standard 1987-1988 period(Comparison E) while theft rates rose significantly for both markedand unmarked cars (Comparisons B and B 1 ) .
Thus, after the marking program began, lines exempted from thestandard because they were equipped with a passive anti-theftdevice exhibited a more favorable trend in theft rates than eithermarked or unmarked passenger cars.
2.3 Implications of Theft Rate Trends on the Evaluation ofthe Theft Act
Based on the analyses of 1983-1988 theft rates describedin the previous section, several observations may be made relativeto the effectiveness of the Theft Prevention Standard in deterringvehicle theft:
• The marking of selected passenger cars had no major impacton the theft rates of passenger cars as a group. Two yearsafter the marking program began, theft rates for passengercars continued to remain similar to rates for unmarkedmultipurpose vehicles and light trucks.
25 TR-234
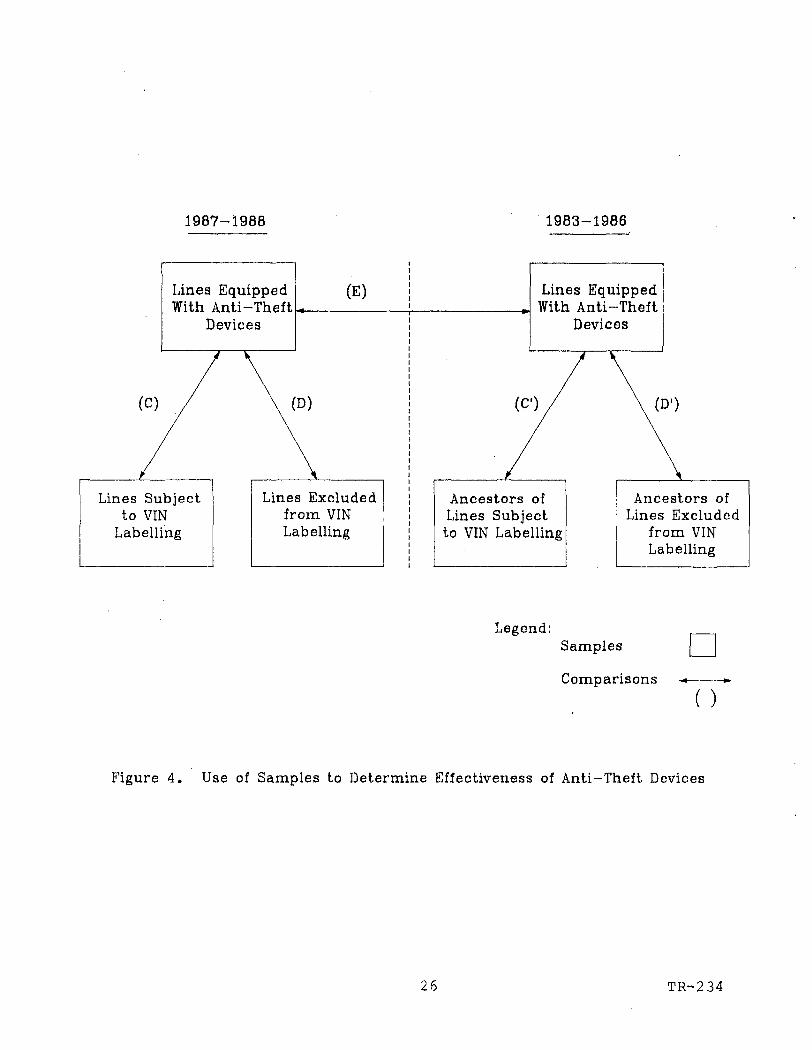
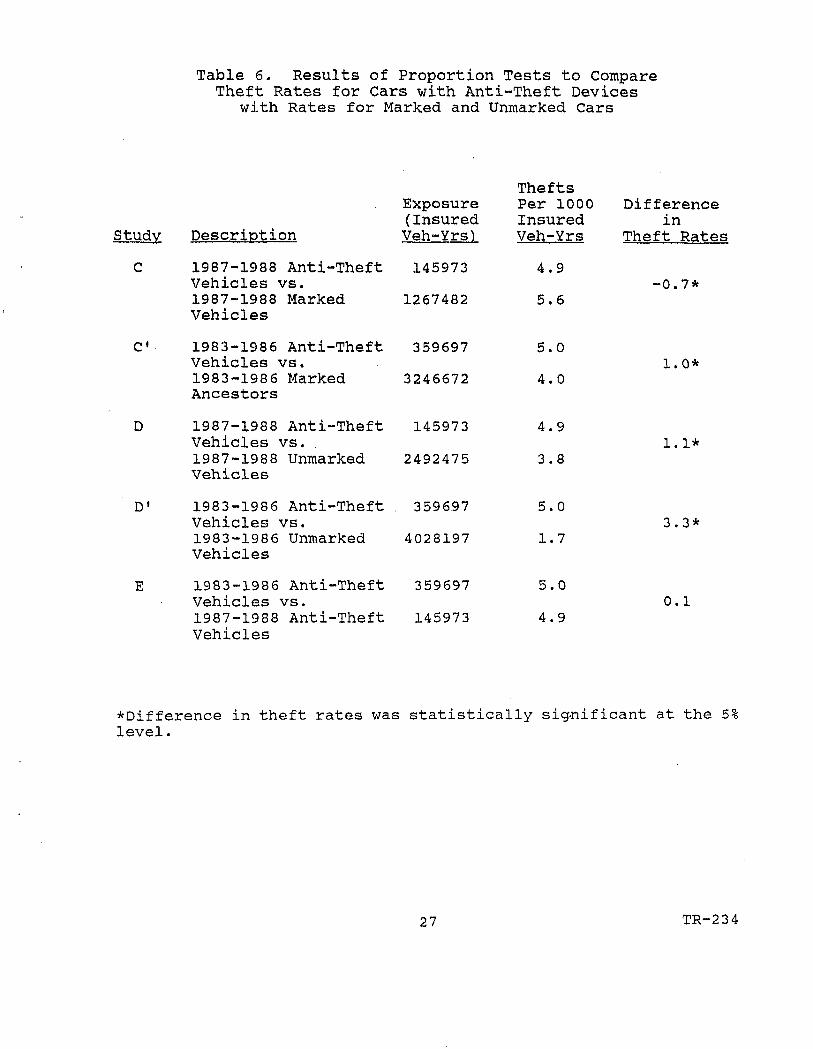
Table 6. Results of Proportion Tests to CompareTheft Rates for Cars with Anti-Theft Devices
with Rates for Marked and Unmarked Cars
Study Description
C 1987-1988 Anti-TheftVehicles vs.1987-1988 MarkedVehicles
C« 1983-1986 Anti-TheftVehicles vs.1983-1986 MarkedAncestors
D 1987-1988 Anti-TheftVehicles vs.1987-1988 UnmarkedVehicles
D1 1983-1986 Anti-TheftVehicles vs.1983-1986 UnmarkedVehicles
E 1983-1986 Anti-TheftVehicles vs.1987-1988 Anti-TheftVehicles
Exposure(InsuredVeh-Yrs)
145973
1267482
359697
3246672
145973
2492475
359697
4028197
359697
145973
TheftsPer 1000InsuredVeh-Yrs
4.9
5.6
5.0
4.0
4.9
3.8
5.0
1.7
5.0
4.9
Differencein
Theft Rates
-0.
1.
1.
3,
0,
,7*
.0*
. 1*
.3*
.1
*Difference in theft rates was statistically significant at the 5%level.
27 TR-2 3 4
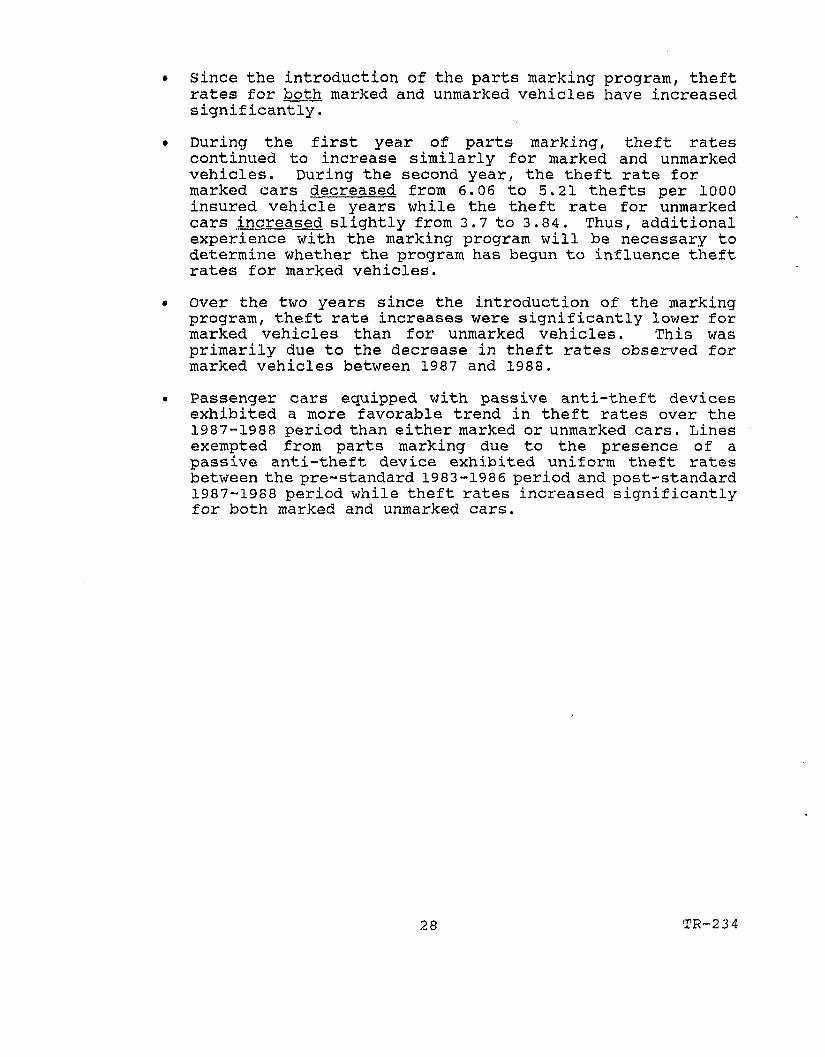
Since the introduction of the parts marking program, theftrates for both marked and unmarked vehicles have increasedsignificantly.
During the first year of parts marking, theft ratescontinued to increase similarly for marked and unmarkedvehicles. During the second year, the theft rate formarked cars decreased from 6.06 to 5.21 thefts per 1000insured vehicle years while the theft rate for unmarkedcars increased slightly from 3.7 to 3.84. Thus, additionalexperience with the marking program will be necessary todetermine whether the program has begun to influence theftrates for marked vehicles.
Over the two years since the introduction of the markingprogram, theft rate increases were significantly lower formarked vehicles than for unmarked vehicles. This wasprimarily due to the decrease in theft rates observed formarked vehicles between 1987 and 1988.
Passenger cars equipped with passive anti-theft devicesexhibited a more favorable trend in theft rates over the1987-1988 period than either marked or unmarked cars. Linesexempted from parts marking due to the presence of apassive anti-theft device exhibited uniform theft ratesbetween the pre-standard 1983-1986 period and post-standard1987-1988 period while theft rates increased significantlyfor both marked and unmarked cars.
28 TR-234

3. RECOVERY RATES FOR INSURED VEHICLES DURING 198 3-1988
If the Theft Act was successful in reducing the number ofvehicles which are stolen by professional thieves for export ordismantling, it might be expected that the recovery rate for stolenvehicles would increase after the marking program began independentof other factors. To examine whether this occurred, recovery rateswere computed and compared before and after the parts markingprogram was initiated.
The sections which follow describe how recovery rates weredetermined by model year, line and model and consider whether therewas any increase in recovery rates that may have resulted from themarking program.
3.1 Determination of Recovery Rates For 198 3-1988
Records of motor vehicles thefts and recoveries furnishedby the National Automobile Theft Bureau (NATB) were used toestablish recovery rates for current model year (CMY), one and twoyear old vehicles stolen during 1983-1988. As described in Section2.1 of this report, theft reports were provided by the NATB forseven major insurance companies including: Aetna, Allstate, Arnica,GEICO, State Farm, Travelers and USAA.
Each theft record identified whether the stolen vehicle wasrecovered, the date of the recovery and the condition of thevehicle upon recovery. This information was used to determinerecovery rates by model year, line and model during 1983-1988.Each recovery rate R was defined as:
The number of Insured Vehicles RecoveredR —
The number of Insured Vehicles Stolen
To compute these rates, a vehicle was considered recovered ifit had been recovered by December 31st of the year in which it wasstolen.
Recovery information for calendar years 1983-1988 is presentedby model year and by model in Appendix B of this report.
3.1.1 Characteristics of NATB Recovery Data
In 1986, to conform to the insurer reportingrequirements of the Motor Vehicle Theft Law Enforcement Act of1984, the NATB and the insurance industry modified their proceduresto describe the condition of a recovered stolen vehicle. In itsruling on insurer reporting requirements (6.) , the NHTSA definedthree categories of recoveries depending upon whether or not oneor more of the major vehicle parts listed in Table 1 were missingfrom the vehicle at the time of recovery. These categories
29 TR-2 34
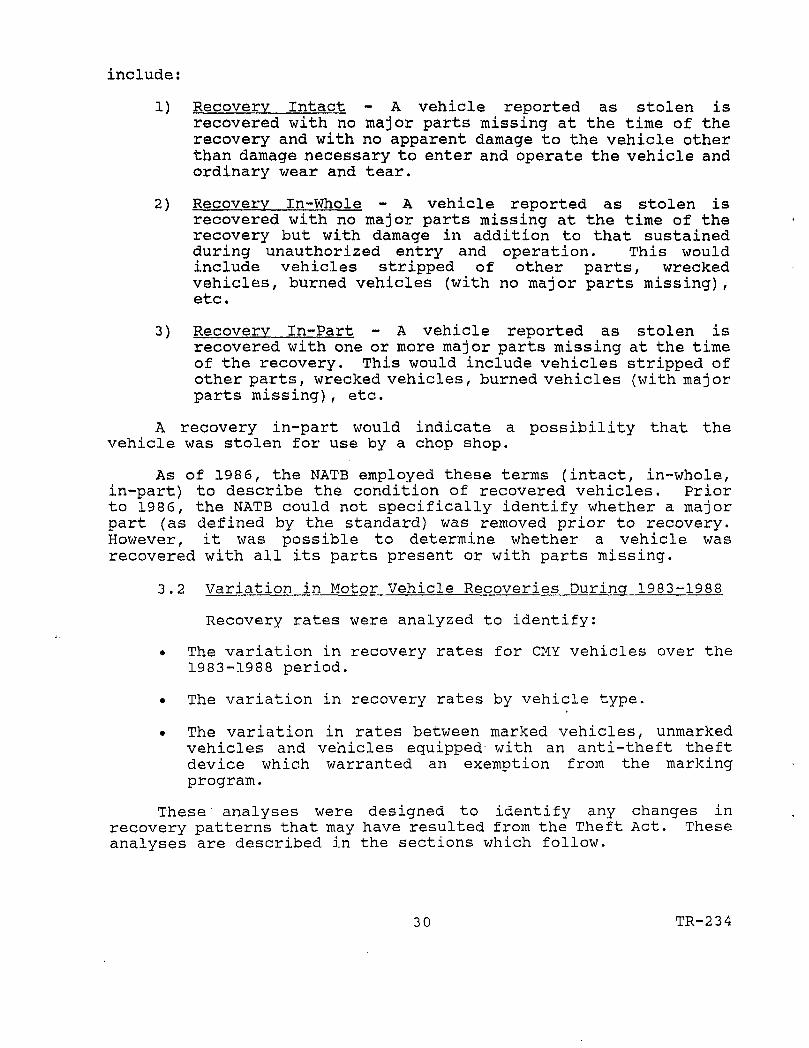
include:
1) Recovery Intact - A vehicle reported as stolen isrecovered with no major parts missing at the time of therecovery and with no apparent damage to the vehicle otherthan damage necessary to enter and operate the vehicle andordinary wear and tear.
2) Recovery In-Whole - A vehicle reported as stolen isrecovered with no major parts missing at the time of therecovery but with damage in addition to that sustainedduring unauthorized entry and operation. This wouldinclude vehicles stripped of other parts, wreckedvehicles, burned vehicles (with no major parts missing),etc.
3) Recovery In-Part - A vehicle reported as stolen isrecovered with one or more major parts missing at the timeof the recovery. This would include vehicles stripped ofother parts, wrecked vehicles, burned vehicles (with majorparts missing), etc.
A recovery in-part would indicate a possibility that thevehicle was stolen for use by a chop shop.
As of 198 6, the NATB employed these terms (intact, in-whole,in-part) to describe the condition of recovered vehicles. Priorto 1986, the NATB could not specifically identify whether a majorpart (as defined by the standard) was removed prior to recovery.However, it was possible to determine whether a vehicle wasrecovered with all its parts present or with parts missing.
3.2 Variation in Motor Vehicle Recoveries During 1983-1988
Recovery rates were analyzed to identify:
• The variation in recovery rates for CMY vehicles over the1983-1988 period.
• The variation in recovery rates by vehicle type.
• The variation in rates between marked vehicles, unmarkedvehicles and vehicles equipped with an anti-theft theftdevice which warranted an exemption from the markingprogram.
These' analyses were designed to identify any changes inrecovery patterns that may have resulted from the Theft Act. Theseanalyses are described in the sections which follow.
3 0 TR-2 34
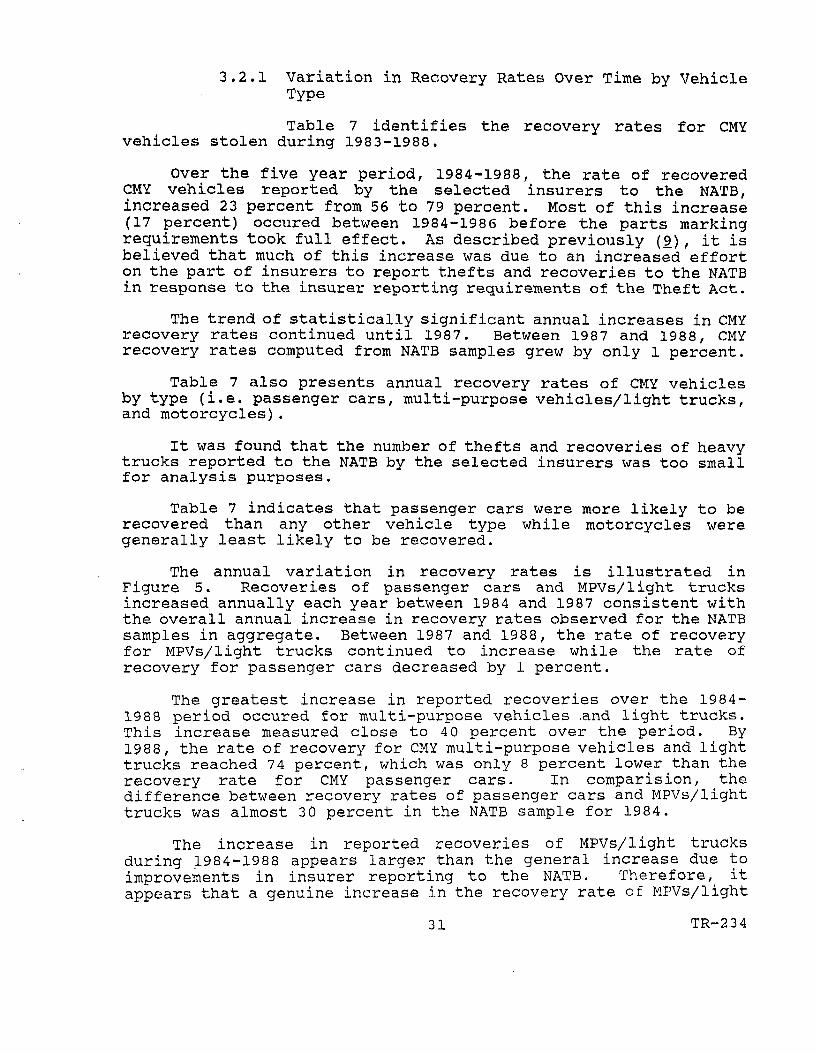
3.2.1 Variation in Recovery Rates Over Time by VehicleType
Table 7 identifies the recovery rates for CMYvehicles stolen during 1983-1988.
Over the five year period, 1984-1988, the rate of recoveredCMY vehicles reported by the selected insurers to the NATB,increased 23 percent from 56 to 79 percent. Most of this increase(17 percent) occured between 1984-1986 before the parts markingrequirements took full effect. As described previously (£), it isbelieved that much of this increase was due to an increased efforton the part of insurers to report thefts and recoveries to the NATBin response to the insurer reporting requirements of the Theft Act.
The trend of statistically significant annual increases in CMYrecovery rates continued until 1987. Between 1987 and 1988, CMYrecovery rates computed from NATB samples grew by only 1 percent.
Table 7 also presents annual recovery rates of CMY vehiclesby type (i.e. passenger cars, multi-purpose vehicles/light trucks,and motorcycles).
It was found that the number of thefts and recoveries of heavytrucks reported to the NATB by the selected insurers was too smallfor analysis purposes.
Table 7 indicates that passenger cars were more likely to berecovered than any other vehicle type while motorcycles weregenerally least likely to be recovered.
The annual variation in recovery rates is illustrated inFigure 5. Recoveries of passenger cars and MPVs/light trucksincreased annually each year between 1984 and 1987 consistent withthe overall annual increase in recovery rates observed for the NATBsamples in aggregate. Between 1987 and 1988, the rate of recoveryfor MPVs/light trucks continued to increase while the rate ofrecovery for passenger cars decreased by 1 percent.
The greatest increase in reported recoveries over the 1984-1988 period occured for multi-purpose vehicles .and light trucks.This increase measured close to 40 percent over the period. By1988, the rate of recovery for CMY multi-purpose vehicles and lighttrucks reached 74 percent, which was only 8 percent lower than therecovery rate for CMY passenger cars. In comparision, thedifference between recovery rates of passenger cars and MPVs/lighttrucks was almost 3 0 percent in the NATB sample for 1984.
The increase in reported recoveries of MPVs/light trucksduring 1984-1988 appears larger than the general increase due toimprovements in insurer reporting to the NATB. Therefore, itappears that a genuine increase in the recovery rate of MPVs/light
31 TR-2 3 4
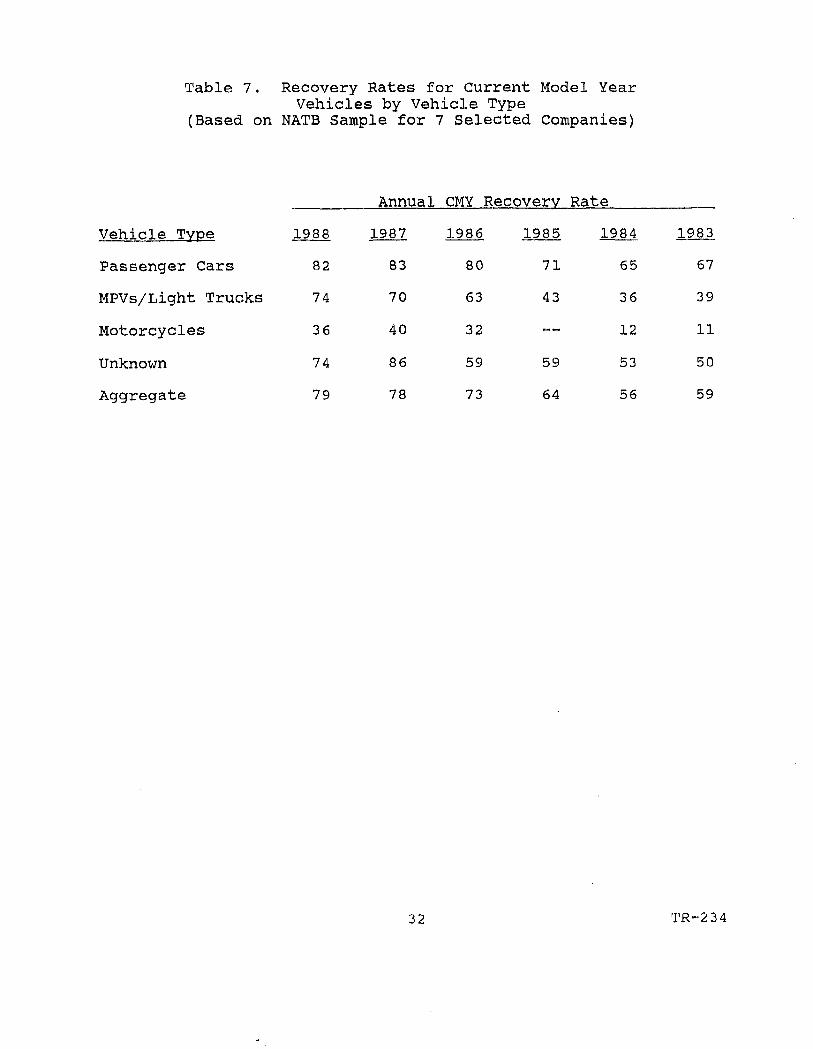
Table 7. Recovery Rates for Current Model YearVehicles by Vehicle Type
(Based on NATB Sample for 7 Selected Companies)
Annual CMY Recovery Rate
Vehicle Tvpe
Passenger Cars
MPVs/Light Trucks
Motorcycles
Unknown
Aggregate
1988
82
74
36
74
79
1987
83
70
40
86
78
1986
80
63
32
59
73
1985
71
43
.—
59
64
1984
65
36
12
53
56
1983
67
39
11
50
59
32 TR-2 3 4
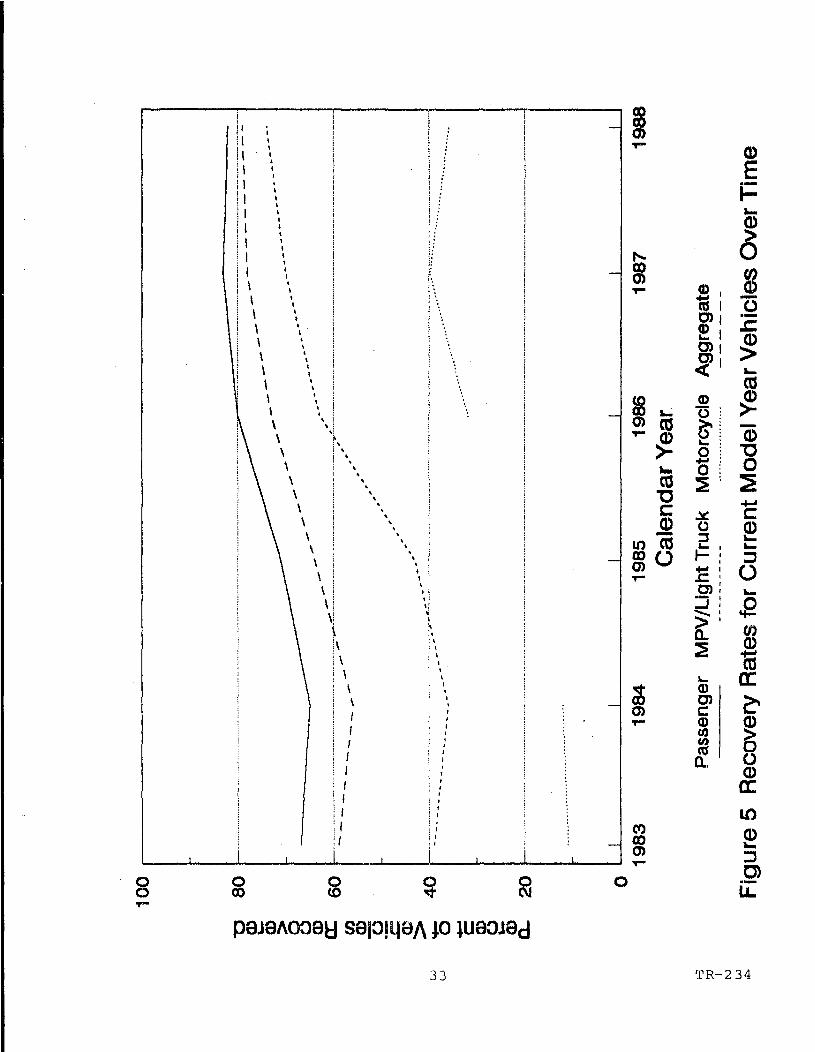
trucks is occurring. This is especially evident between 1986 and1988 when the recovery rate for passenger cars varied no more than3 percent while the recovery rate for MPVs/light trucks increased11 percent.
If the Theft Prevention Standard strongly influenced adecrease in the number of marked passenger cars which were stolento be exported or dismantled for their parts, it might be expectedthat the overall recovery rate for CMY passenger cars would besignificantly higher after the standard took effect while therecovery rate for unmarked MPVs and motorcycles remained unchangedindependent of other factors.
However, a statistical comparison of aggregate recovery ratesbefore (1983-1986) and after (1987-1988) the standard took effectrevealed that passenger cars, MPVs/light trucks and motorcyclesall experienced a significant increase in recovery rates after thestandard took effect. The results of these proportion analyses areshown in Table 8. No trend appeared which would suggest that thestandard may have influenced an increase in recovery rates forpassenger cars as a group beyond the general increases which areindependent of the standard.
This is explored further in the next section to determinewhether any unusual change in recovery rates occurred for markedvehicles after the marking program began.
3.2.2 influence.of Marking Program on Recovery Rates ofMarked Vehicles
A series of statistical tests were performed toexamine whether the parts labelling program encouraged an increasein the rate of recovery of marked vehicles. To perform thesetests, four samples of vehicles were considered:
• CMY 1987-1988 passenger cars subject to the labellingrequirements
• CMY 1987-1988 passenger cars excluded from the labellingrequirements
• CMY 1983-1986 ancestor versions of the lines subject tothe labelling requirements
• CMY 1983-1986 ancestor versions of the lines excluded fromthe labelling requirements.
Only vehicles in the first of these groupings had markedparts. Figure 3 in Section 2 illustrates how these samples werecompared to investigate the effectiveness of the parts labellingprogram. The results of these comparisons are identified in Table9.
34 TR-234
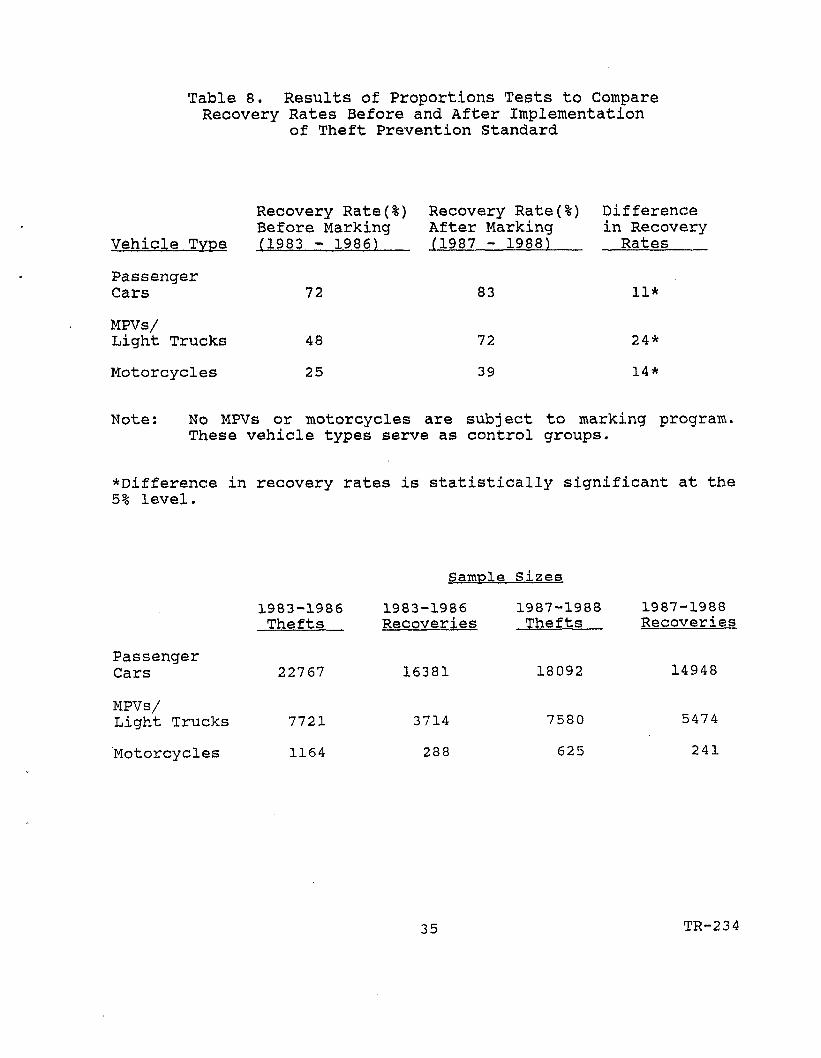
Table 8. Results of Proportions Tests to CompareRecovery Rates Before and After Implementation
of Theft Prevention Standard
Vehicle Type
PassengerCars
MPVs/Light Trucks
Motorcycles
Recovery Rate(%)Before Marking(1983 - 1986)
72
48
25
Recovery Rate(%)After Marking(1987 - 1988)
83
72
39
Differencein RecoveryRates
11*
24*
14*
Note: No MPVs or motorcycles are subject to marking program.These vehicle types serve as control groups.
*Difference in recovery rates is statistically significant at the5% level.
PassengerCars
MPVs/Light Trucks
Motorcycles
1983-1986Thefts
22767
7721
1164
Sample
1983-1986Recoveries
16381
3714
288
Sizes
1987-1988Thefts
18092
7580
625
1987-1988Recoveries
14948
5474
241
35 TR-2 34
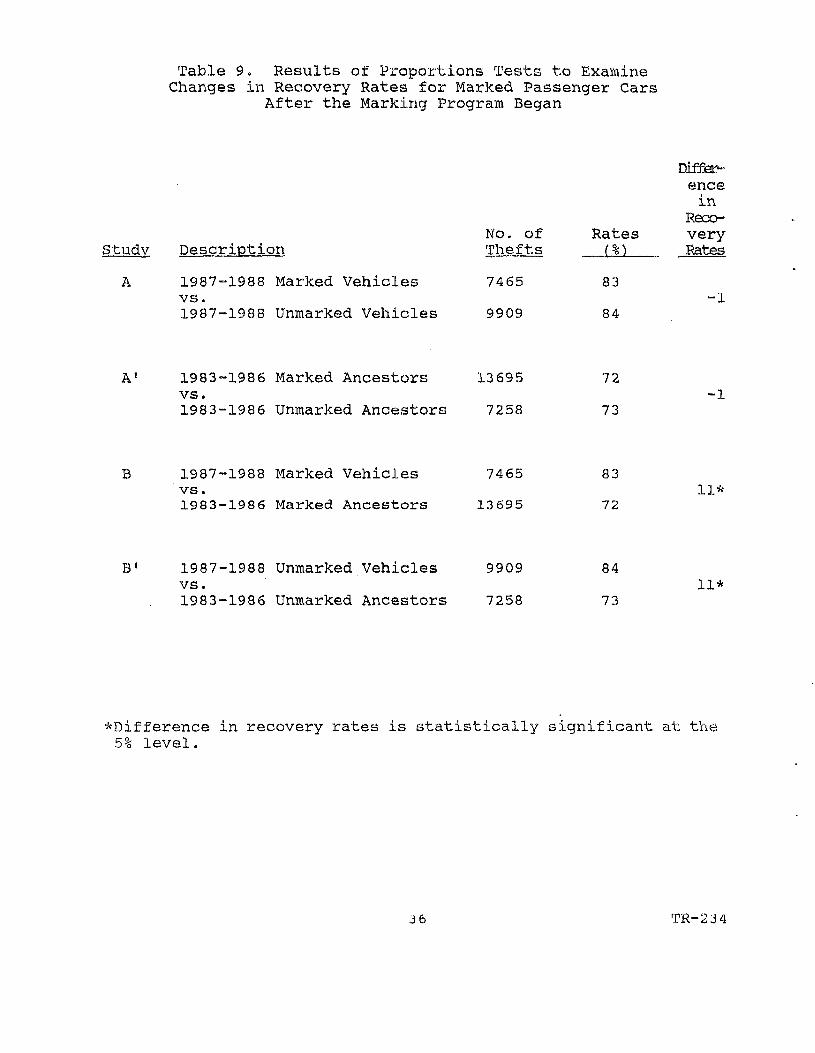
Table 9. Results of Proportions Tests to ExamineChanges in Recovery Rates for Marked Passenger Cars
After the Marking Program Began
Study Description
A 1987-1988 Marked Vehiclesvs.1987-1988 Unmarked Vehicles
1983-1986 Marked Ancestorsvs.1983-1986 Unmarked Ancestors
B 1987-1988 Marked Vehiclesvs.1983-1986 Marked Ancestors
B1 1987-1988 Unmarked Vehiclesvs.198 3-1986 Unmarked Ancestors
No. ofThefts
7465
9909
13695
7258
7465
13695
9909
7258
Rates
m83
84
72
73
83
72
84
73
Differ-ence
inReco-veryRates
- 1
1 1 *
1 1 *
••̂ Difference in recovery rates is statistically significant at the5% level.
TR-2J4
These results indicate that the labelling program has notimproved the rate of recovery of marked vehicles as might have beenexpected if the standard had served to reduce the number of markedvehicles stolen for export or dismantling. Although lines whichwere marked exhibited an 11 percent increase in recovery ratesrelative to their marked ancestors (Study B) , exactly the sameincrease was observed over the same time frame for lines excludedfrom the marking program (Study B'). Prior to the marking program,ancestors of 1987-1988 marked vehicles experienced the same rateof recovery as did ancestors of 1987-1988 unmarked vehicles (StudyA'). As shown in Table 9, this did not change after one group ofvehicles was marked (Study A). Thus, there is no evidence that themarking program has influenced any change in the recovery rate ofmarked vehicles.
The discovery that recovery rates were the same for bothmarked and unmarked vehicles as shown in comparisons A and A1 wasunanticipated. Since the marked vehicles were selected on thebasis of their high theft rate, it might be expected that theproportion of fraudulent claims and vehicles stolen for dismantlingof export (and thus unrecoverable) would be larger for markedvehicles than unmarked vehicles. It would then follow thatvehicles selected for marking would exhibit lower recovery ratesthan vehicles exempted from marking. Instead, it was found thatvehicles with high theft rates (i.e. marked vehicles) exhibited thesame rate of recovery as vehicles with relatively lower theft rates(i.e. unmarked vehicles).
These results indicate that the proportion of stolen vehicleswhich disappear (possibly fraudulent claims or vehicles exportedor completely dismantled and therefore untraceable) is the same forboth vehicles with high theft rates and those with low theft rates.Thus, stolen vehicles from lines with high theft rates are aslikely to be either fraudulent claims, exported or thoroughlydismantled as stolen vehicles from lines with low theft rates.
However, other analyses described in Section 3.3 suggest thatthe proportion of vehicles stolen for specific major parts islarger for lines with high theft rates than for lines with lowtheft rates. For these thefts, certain desired parts are removedwhile the remainder of the vehicle is left for recovery.
3.2.3 Recovery Rates for Vehicles With Anti-TheftDevices
Several statistical comparisons were performed toexamine how the recovery rates for lines with anti-theft devicescompared with recovery rates for lines with and without VINmarking. These comparisons are illustrated in Figure 4 in Section2. The results of these comparisons are presented in Table 10.
37 TR-234
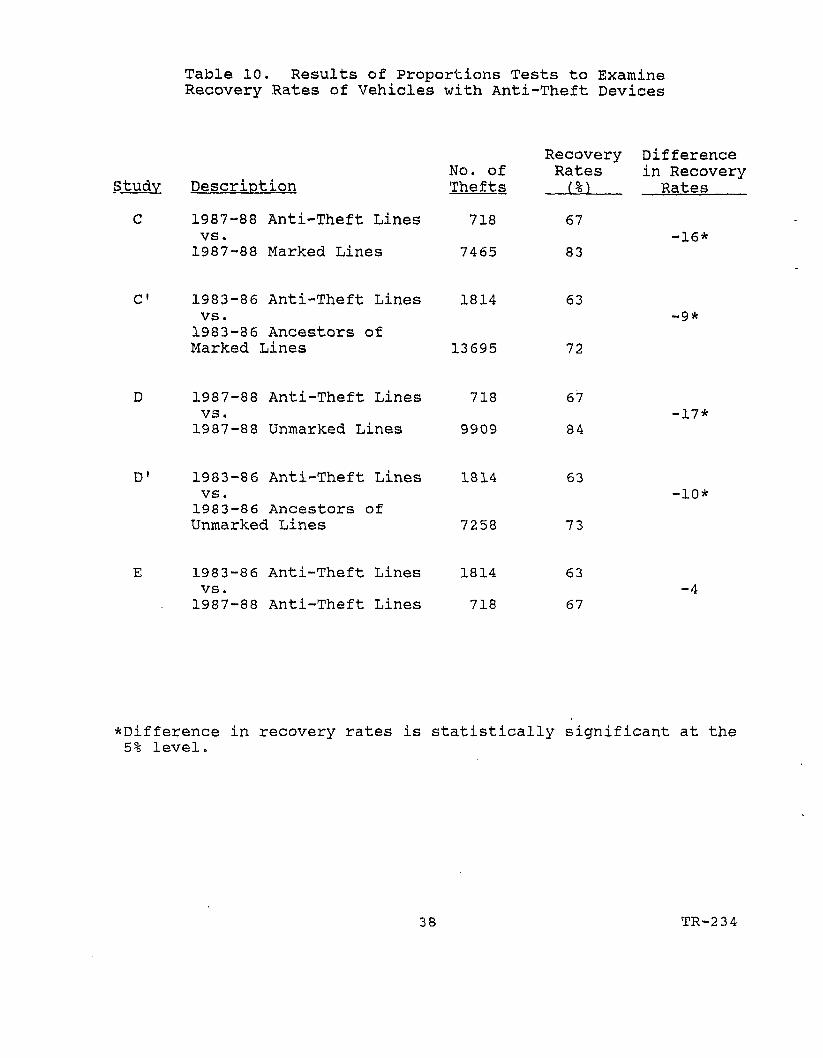
Table 10. Results of Proportions Tests to ExamineRecovery Rates of Vehicles with Anti-Theft Devices
Study Description
C 1987-88 Anti-Theft Linesvs.1987-88 Marked Lines
No. ofThefts
718
7465
Recovery DifferenceRates in Recovery(%) Rates
67
83-16*
1983-86 Anti-Theft Lines 1814vs.1983-86 Ancestors ofMarked Lines 13 695
63
72
-9*
D 1987-88 Anti-Theft Lines 718vs.1987-88 Unmarked Lines 9909
67
84-17*
D1 1983-86 Anti-Theft Lines 1814vs.1983-86 Ancestors ofUnmarked Lines 7258
63
73
-10*
E 1983-86 Anti-Theft Lines 1814vs.1987-88 Anti-Theft Lines 718
63
67
*Difference in recovery rates is statistically significant at the5% level.
38 TR-2 3 4
These results indicate that 1987-1988 lines equipped withanti-theft devices experienced significantly lower rates ofrecovery than both lines with and without marked parts (ComparisonsC and D) . Stolen vehicles equipped with anti-theft devicesconsistently experienced a significantly lower rate of recoverythan other vehicles (Comparisons C, C , D, D 1 ) . These differenceswere on the order of 9-17 percent.
Thus, thefts of lines with anti-theft devices more often leadto the complete disappearance of the vehicle (possibly throughfraud, export or total dismantling) than thefts of other lines.This is consistent with the assumption that determined,professional thieves are involved in selecting and performing thesethefts since it would be easier to steal a vehicle without an anti-theft device than one so equipped.
Over the 1983-1988 period, the recovery rate for vehicles withanti-theft devices did not show the statistical improvementsexhibited by other lines (Comparisons E, B, B 1 ) . In fact, thedifference in recovery rates between vehicles with anti-theftdevices and marked and unmarked vehicles continued to widen from9-10% to 16-17% after the marking program began (Comparisons C, C* ,D, D').
3.3 Condition of Vehicles Upon Recovery
If the marking program was successful in reducing thenumber of vehicles stolen for their parts, the proportion of markedvehicles which were recovered with major parts missing should havebeen reduced after the marking program began.
To verify whether this was the case, the proportion ofvehicles recovered intact, in-whole and in-part were computedbefore and after the standard was implemented. The proportionstest was used to compare results between marked and unmarkedvehicles. The results of these comparisons are shown in Table 11.
These results indicate that the marking program has notsignificantly benefitted marked vehicles relative to unmarkedvehicles. Both before and after the marking program began,vehicles selected for marking exhibited a 3-4 percent higher rateof recoveries with major parts missing than vehicles excluded frommarking (Comparisons F and G) . This difference was found to bestatistically significant.
During the post-standard 1987-1988 period, both marked andunmarked vehicles exhibited a significantly lower proportion ofrecoveries in which major parts were missing than during pre-standard 1986 (Comparisons L and L') . The proportion of recoveriesin-part decreased 5 percent from 21 to 16 percent for markedvehicles while decreasing 6 percent from 18 to 12 percent forunmarked vehicles. At the same time, in-whole recoveries increased
39 TR-234
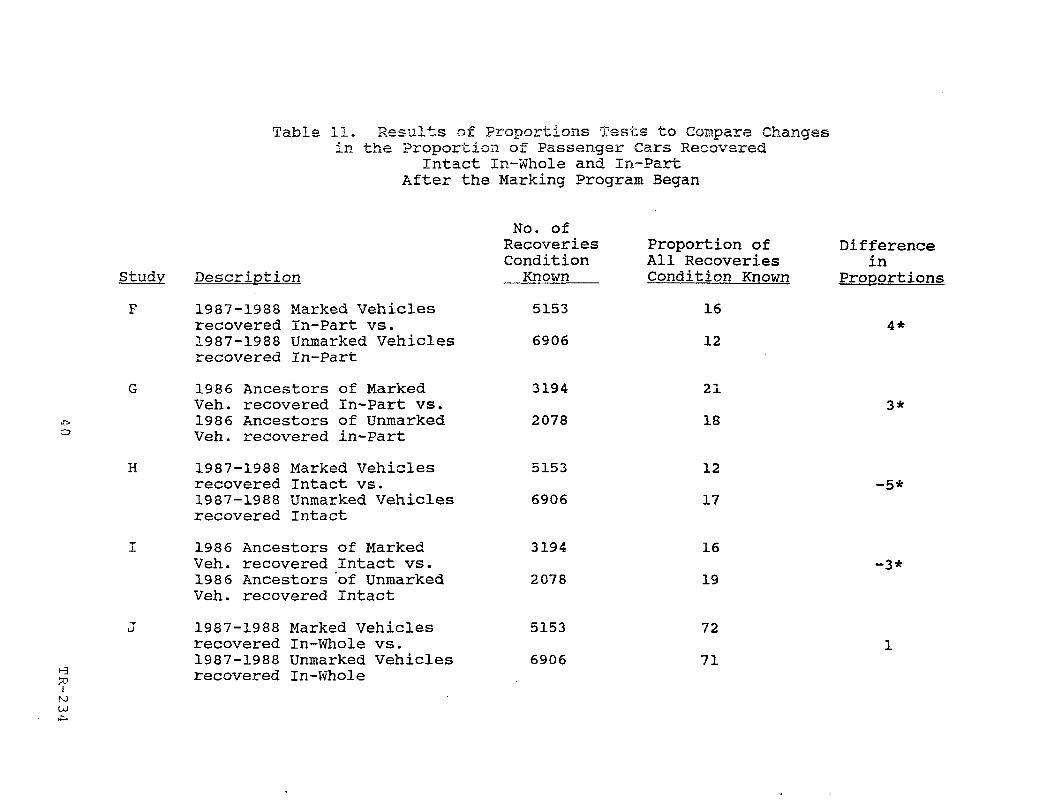
Table 11. Results of Proportions Tests to Compare Chang«in the Proportion of Passenger Cars Recovered
Intact In-Whole and In-PartAfter the Marking Program Began
O
H
50
Description
1987-1988 Marked Vehiclesrecovered In-Part vs.1987-1988 Unmarked Vehiclesrecovered In-Part
1986 Ancestors of MarkedVeh. recovered In-Part vs.1986 Ancestors of UnmarkedVeh. recovered in-Part
1987-1988 Marked Vehiclesrecovered Intact vs.1987-1988 Unmarked Vehiclesrecovered Intact
1986 Ancestors of MarkedVeh. recovered Intact vs.1986 Ancestors "of UnmarkedVeh. recovered Intact
1987-1988 Marked Vehiclesrecovered In-Whole vs.1987-1988 Unmarked Vehiclesrecovered In-Whole
No. ofRecoveriesConditionKnown
5153
6906
3194
2078
5153
6906
3194
2078
5153
6906
Proportion ofAll RecoveriesCondition Known
16
12
21
18
12
17
16
19
72
71
Differencein
Proportions
4*
3*
- 5 *
-3*
1
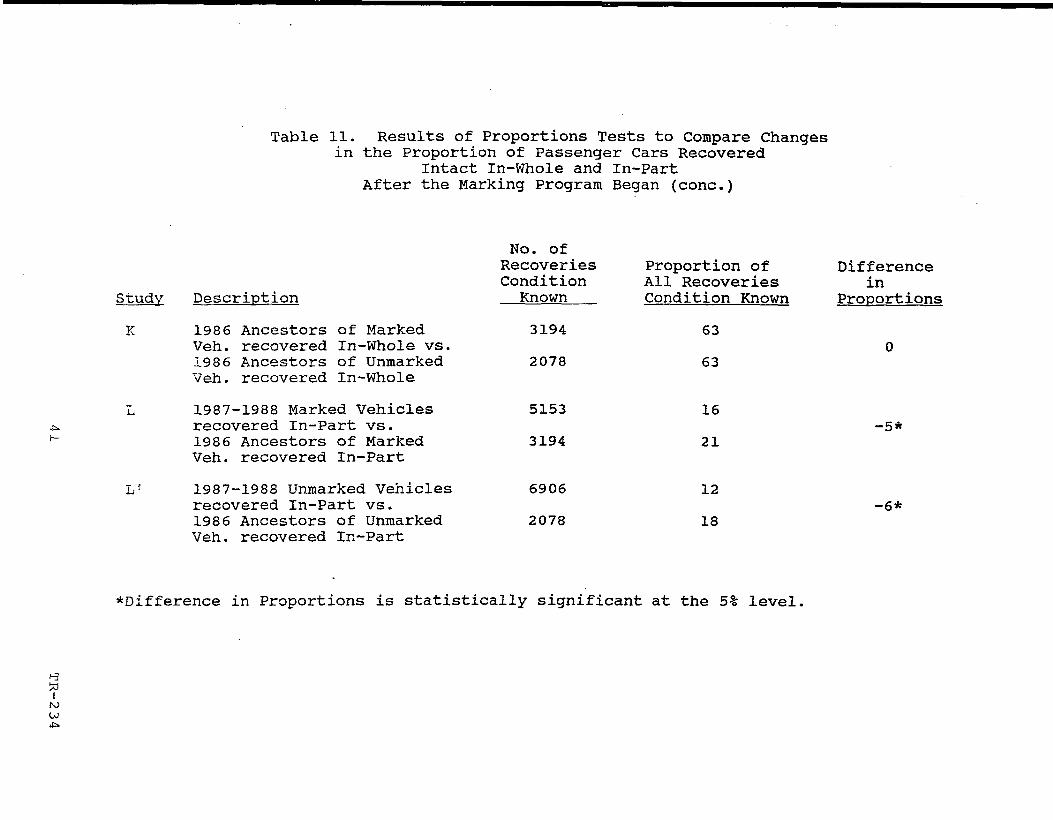
Table 11. Results of Proportions Tests to Compare Changesin the Proportion of Passenger Cars Recovered
Intact In-Whole and In-PartAfter the Marking Program Began (cone.)
h-
Study Description
K 1986 Ancestors of MarkedVeh. recovered In-Whole vs.1986 Ancestors of UnmarkedVeh. recovered In-Whole
L 1987-1988 Marked Vehiclesrecovered In-Part vs.1986 Ancestors of MarkedVeh. recovered In-Part
L* 1987-1988 Unmarked Vehiclesrecovered In-Part vs.198 6 Ancestors of UnmarkedVeh. recovered In-Part
No. ofRecoveriesConditionKnown
3194
2078
5153
3194
6906
2078
Proportion ofAll RecoveriesCondition Known
63
63
16
21
12
18
Differencein
Proportions
0
-5*
-6*
*Difference in Proportions is statistically significant at the 5% level.
Ito
approximately 9 percent for both marked and unmarked vehicles(Comparisons J and K) . This represents an increase in theproportion of vehicles recovered with damage or recovered with non-major parts missing.
These trends suggest the possibility that thieves may be lesswilling to steal parts designated for marking (whether actuallymarked or not) and that thefts for other parts may be increasing.
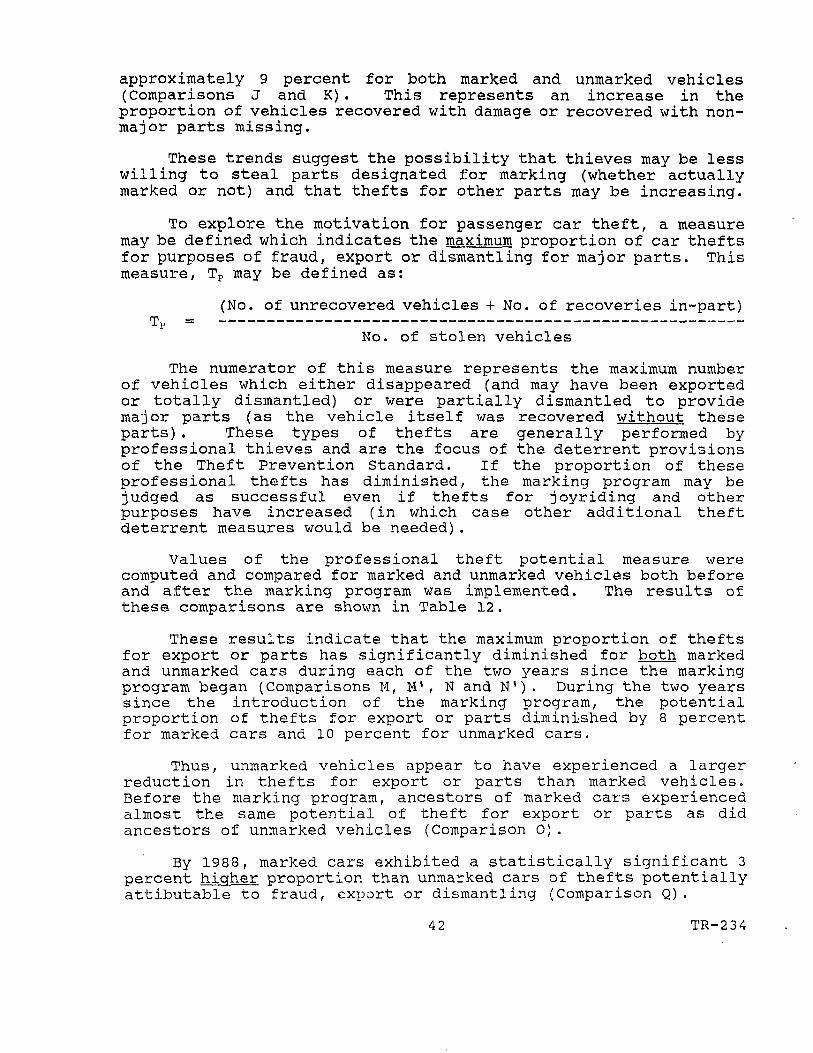
To explore the motivation for passenger car theft, a measuremay be defined which indicates the maximum proportion of car theftsfor purposes of fraud, export or dismantling for major parts. Thismeasure, TP may be defined as:
(No. of unrecovered vehicles + No. of recoveries in-part)
No. of stolen vehicles
The numerator of this measure represents the maximum numberof vehicles which either disappeared (and may have been exportedor totally dismantled) or were partially dismantled to providemajor parts (as the vehicle itself was recovered without theseparts). These types of thefts are generally performed byprofessional thieves and are the focus of the deterrent provisionsof the Theft Prevention Standard. If the proportion of theseprofessional thefts has diminished, the marking program may bejudged as successful even if thefts for joyriding and otherpurposes have increased (in which case other additional theftdeterrent measures would be needed).
Values of the professional theft potential measure werecomputed and compared for marked and unmarked vehicles both beforeand after the marking program was implemented. The results ofthese comparisons are shown in Table 12.
These results indicate that the maximum proportion of theftsfor export or parts has significantly diminished for both markedand unmarked cars during each of the two years since the markingprogram began (Comparisons M, M1 , N and N1) . During the two yearssince the introduction of the marking program, the potentialproportion of thefts for export or parts diminished by 8 percentfor marked cars and 10 percent for unmarked cars.
Thus, unmarked vehicles appear to have experienced a largerreduction in thefts for export or parts than marked vehicles.Before the marking program, ancestors of marked cars experiencedalmost the same potential of theft for export or parts as didancestors of unmarked vehicles (Comparison 0).
By 1988, marked cars exhibited a statistically significant 3percent higher proportion than unmarked cars of thefts potentiallyattibutable to fraud, export or dismantling (Comparison Q).
42 TR-234
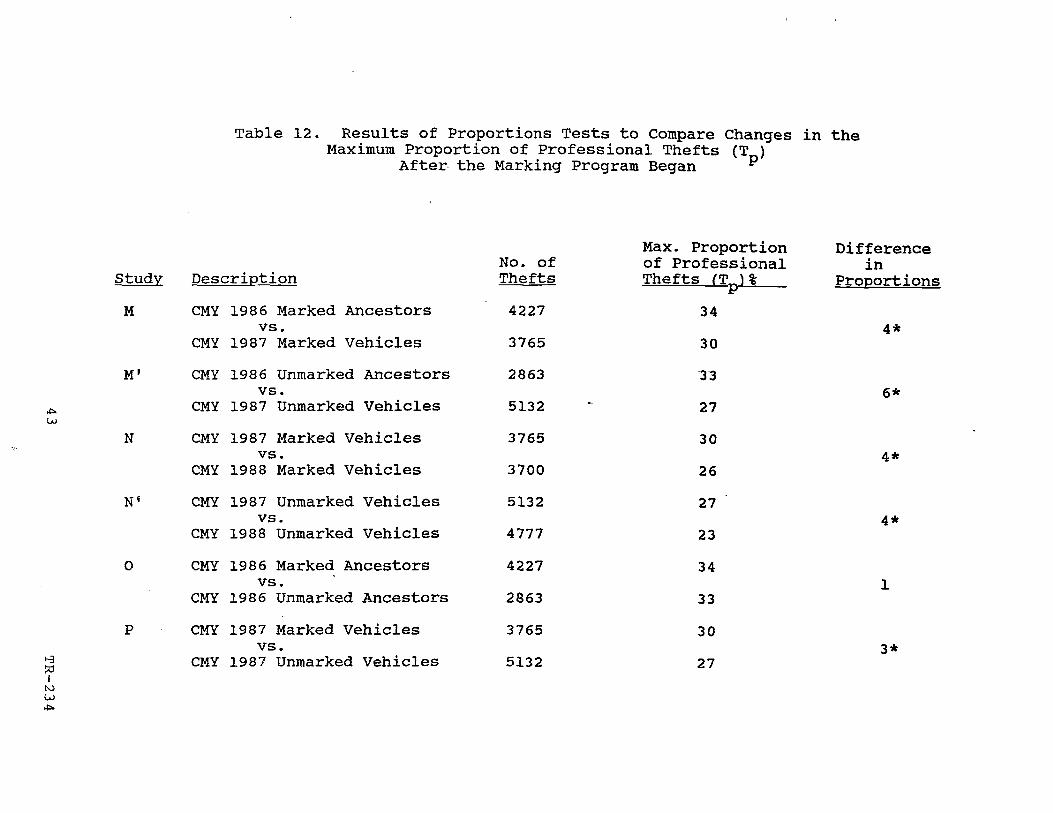
Table 12. Results of Proportions Tests to Compare Changes in theMaximum Proportion of Professional Thefts (T )
After the Marking Program Began ^
Ui
Study Description
M CMY 1986 Marked Ancestorsvs.
CMY 1987 Marked Vehicles
M1 CMY 1986 Unmarked Ancestorsvs.
CMY 1987 Unmarked Vehicles
N CMY 1987 Marked Vehiclesvs.
CMY 1988 Marked Vehicles
N1 CMY 1987 Unmarked Vehiclesvs.
CMY 1988 Unmarked Vehicles
0 CMY 1986 Marked Ancestorsvs.
CMY 1986 Unmarked Ancestors
P CMY 1987 Marked Vehiclesvs.
CMY 1987 Unmarked Vehicles
No. ofThefts
4227
3765
2863
5132
3765
3700
5132
4777
4227
2863
3765
5132
Max. Proportionof ProfessionalThefts (T\%
P34
30
33
27
30
26
27
23
34
33
30
27
Differencein
Proportions
4*
6*
4*
4*
1
3*
I
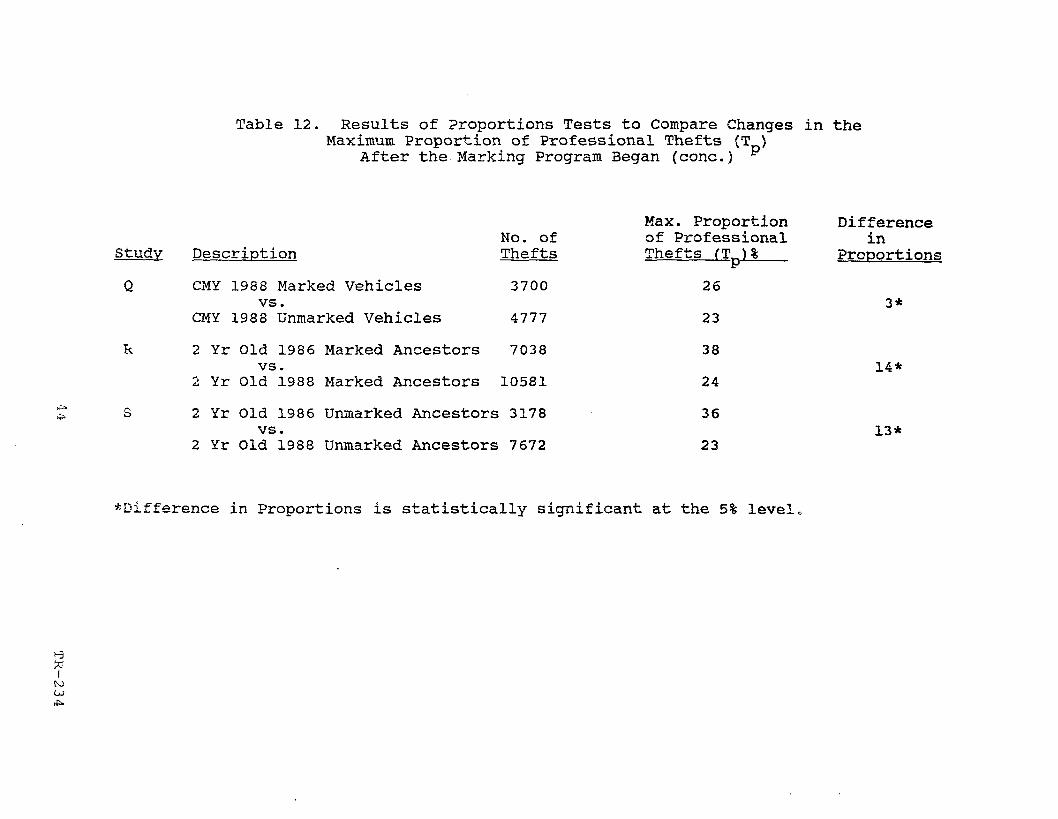
Table 12. Results of Proportions Tests to Compare Changes in theMaximum Proportion of Professional Thefts (T )
After the Marking Program Began (cone.) p
Study Description
Q CMY 1988 Marked Vehiclesvs.
CMY 1988 Unmarked Vehicles
No. ofThefts
3700
4777
70382 Yr Old 1986 Marked Ancestorsvs.
2 Yr Old 1988 Marked Ancestors 10581
2 Yr Old 1986 Unmarked Ancestors 3178vs.
2 Yr Old 1988 Unmarked Ancestors 7672
Max. Proportionof ProfessionalThefts (?)%
P26
23
38
24
36
23
Differencein
Proportions
3*
14*
13*
^Difference in Proportions is statistically significant at the 5% level.
I
U)

Thus, while the goal of the Theft Prevention Standard toreduce thefts for parts appears to be occurring, it is not clearwhether the marking program itself significantly contributed tothis result.
If it was the marking program which reduced the motivation ofthieves to steal current model year vehicles for their parts (sincesome of them have marked parts) , it might be expected that therewould be an increased motivation to steal older vehicles (none ofwhich are marked).
This was explored and found not to be the case. ComparisonsR and S in Table 12 indicate that unmarked two year old vehiclesexhibited the same reduction in the potential of theft for fraud,export or parts as did current model year vehicles.
Thus, the results do not seem to suggest that the markingprogram was responsible for the desirable reduction in the maximumproportion of thefts for fraud, export or parts that occurred sincethe marking program began.
3.4 Implications of Recovery Trends on the Effectiveness ofthe Theft Prevention Standard
Based on the analyses described in the previous sections,several important results have emerged which indicate theeffectiveness of the Theft Prevention Standard. These findingsinclude:
• There was no indication that the marking program influencedthe rate of recovery for CMY passenger cars as a group.Since the introduction of the marking program, passengercars exhibited similarly increasing recovery rates as didunmarked MPV's/light trucks and motorcycles. In fact, therecovery rate for unmarked MPV's/light trucks appears tohave grown faster than the recovery rate for passengercars.
• Furthermore, there was no indication that the markingprogram influenced any change in the rate of recovery ofmarked vehicles. Although lines which were markedexhibited an 11 percent increase in recoveries relative totheir unmarked ancestors, exactly the same increase wasobserved over the same time frame for lines excluded fromthe marking program.
• Thefts of cars exempted from the marking program becauseof an installed anti-theft device more often lead to thecomplete disappearance of the vehicle than thefts of eithermarked or unmarked cars. This is consistent with theassumption that determined, professional thieves selectand perform these thefts since it is easier to steal a
45 TR-234
vehicle without an anti-theft device than one so equipped.Thus, while cars receiving anti-theft exemptions were lesslikely to be stolen than marked cars, once they were stolenthey are also less likely to be recovered.
The maximum proportion of car thefts that might involvefraud, export or dismantling appears to have diminishedsignificantly (8-10 percent) over the two year period sincethe introduction of the marking program. While this is animportant goal of the Theft Prevention Standard, theevidence does not suggest that the marking program itselfwas responsible for this trend. Unmarked CMY cars appearedto have experienced a larger decrease in this measure thanmarked CMY cars. Also, the same decreases were observedfor older vehicles as for CMY vehicles. None of theseolder vehicles had marked parts. Because information onthe recovery of major parts was not maintained before 198 6,this result is based only on available 1986-1988information.
4 6 TR-2 3 4
4. INSURER LOSS PAYMENTS DUE TO VEHICLE THEFT DURING 1983-1988
Another goal of the Theft Act is to encourage a decrease inpremiums charged to consumers for motor vehicle theft insurance byinducing a reduction in insurer's losses for vehicle theft.Furthermore, if the marking program was successful in deterringthefts of vehicles for export or parts, it might be expected that*".he proportion of thefts attributable to joyriding and other causeswould increase. If so, it might also be expected that averageclaim costs for recovered vehicles would decrease independent ofother factors.
Insurance loss payments during 1983-1988 were examined toidentify whether these anticipated benefits were achieved after themarking program was initiated. Specifically, loss payment recordswere analyzed to identify whether:
• Insurer's total losses due to vehicle theft were decreasingas a result of the marking program
• The average payment for a recovered stolen vehicle wasdecreasing as a result of the marking program.
The sections which follow describe how insurer's theft losseswere determined and how these losses changed after the markingprogram began.
4.1 Determination of Insurance Losses During 1983-1988
The Highway Loss Data Institute (HLDI) maintains recordsof actual claim payments issued to policyholders resulting from thetheft of a motor vehicle or its contents. A nationwide sample ofthese records was obtained for vehicle theft claims paid by fivemajor' insurance companies during 1983-1988. The participatingcompanies included: Aetna, Allstate, GEICO, State Farm and USAA.The HLDI sample for each calendar year included the same groupingsof CMY, one and two-year old vehicles as the NATB samples of theftand recovery data described in Section 2.1.
Because the HLDI records reflect actual insurance claimpayments, they exclude theft claims valued below the policydeductible since no payments are issued for such claims. Theseclaims might often represent instances in which a stolen vehiclewas recovered intact or recovered with damage that could berepaired for less than the policy deductible.
Each loss payment record submitted by the HLDI included:
• Vehicle Identification Number (VIN)» Date of theft• Garaging location of the vehicle« Total disbursement by insurer
47 TR-234
• Policy deductible amount
Only claims involving the physical removal of a motor vehiclewere considered for analysis. Claims for stolen contents orcomponents were removed from the HLDI sample. This wasaccomplished by matching the VINs in HLDI loss payment records withthose in NATB vehicle theft records to identify the payments forstolen vehicles.
The claim records for stolen vehicles were used to determinethe average claim value and average claim payment for vehicle theftby model year and line during 1983-1988. The difference betweenaverage claim value and average claim payment reflects the averagedeductible amount not paid by the insurers. Average claim paymentswere also computed for recovered vehicles stratified by model yearand line.
These values are presented in Appendix C for calendar years1983 through 1988. All loss values for 1983-1988 are expressed in1988 dollars.
4«2 Insurance Losses for Vehicle Theft During 1983-1988
Since the Theft Prevention Standard was intended toencourage reductions in automobile comprehensive premiums, it isimportant to ascertain whether the marking program contributed toa reduction in insurance losses for vehicle theft. Without sucha reduction in losses, there could be no reasonable expectationthat the Standard contributed to lower automobile comprehensivepremiums.
To estimate how insurer's total vehicle theft losses changedafter the introduction of the marking program, a cost-effectivenessmeasure E, was defined as:
E = Theft Rate x Average payment per theft claim
The measure E, represents the insurer's expected cost ofvehicle theft per insured vehicle year. This measure representsan expected cost to the insurer for providing annual theft coverageper vehicle exclusive of profit, administrative and other expenses.Changes in the value of this measure indicate whether insurancecosts for vehicle theft are increasing or decreasing.
The cost-effectiveness measure E, considers both changes intheft rates and average theft claim payments. Changes in theftrates were explicitly considered in Section 2. The sections whichfollow consider the variation in average theft claim payments andthe resulting changes in insurance costs for vehicle theft.
48 TR-234
4.2.1 Variation in Average Theft Payments During 1983-1988
Figure 6 illustrates the variation in averageannual loss payments per claim for CMY vehicles stolen during 1983-1988. The actual dollar value of these losses is presented in Table13. To account for the effects of inflation, all losses wereexpressed in 1988 dollars. These loss payments reflect severalfactors including:
• The replacement value of a stolen vehicle which is notrecovered.
• The cost to repair recovered, damaged vehicles.
• Whether or not the vehicle was recovered prior tosettlement.
As seen from Figure 6 and Table 13, average theft claimpayments for CMY vehicles began to decrease in 1985 and decreased$1500 or 12 percent by 1987. This corresponded to a period inwhich overall recovery rates increased by 14 percent (Table 7).This increase in recovery rates undoubtedly contributed to loweraverage insurance payments during this period.
Between 1987 and 1988, average theft claim payments increased6 percent from $10,750 to $11,435 (Table 13). During the sameperiod, recovery rates increased by only 1 percent (Table 7) .Since these values were adjusted to reflect the average annualincreases in new car prices, the increase in payments between 1987and 1988 reflects either or both an increase in damage sustainedby recovered vehicles or a decrease in recoveries prior tosettlement.
Upon investigation, both of these hypothesis were found to betrue. An examination of Appendix Tables Cl and C4 indicate thatthe average payment for a recovered CMY vehicle increased between1987 and 1988, from $7,693 to $8,159 adjusted for inflation. Thiswas primarily caused by an $884 increase between 1987 and 1988 incosts for vehicles recovered in-whole. These recoveries representinstances in which the stolen vehicle was either damaged or non-major parts were removed.
It was also found that the proportion of vehicles recoveredprior to settlement decreased between 1987 and 1988. This decreaseis described further in Section 6.
As seen from Table 13, average claim payments wereconsistently higher for passenger cars with anti-theft devices thanfor other passenger cars or MPVs. This reflects the fact that oncethese vehicles are stolen, they are less likely to be recoveredthan other vehicles. It is also expected that these vehicles are
49 TR-234
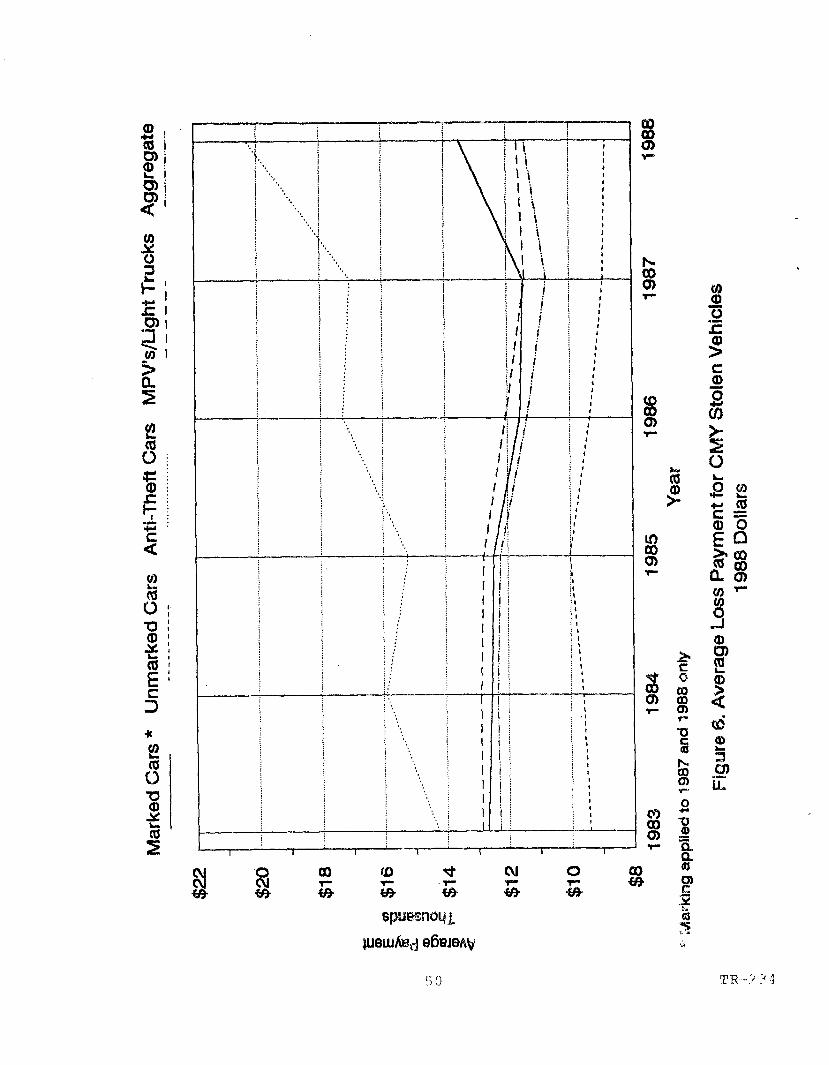
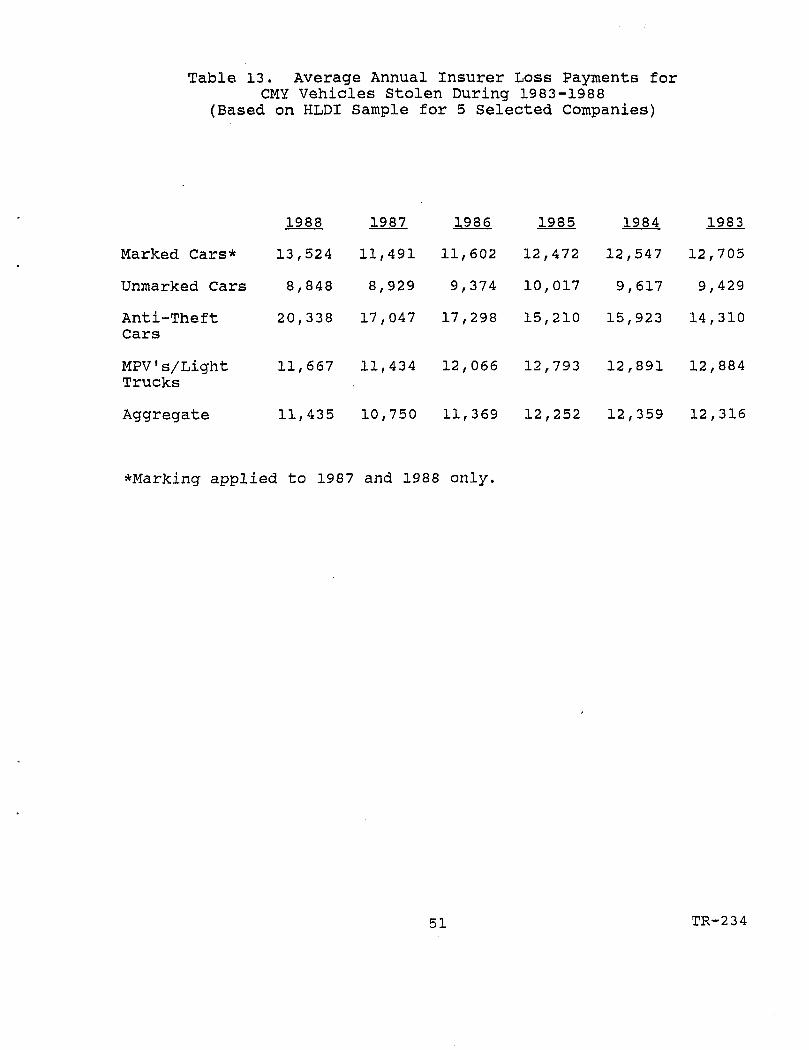
Table 13. Average Annual Insurer Loss Payments forCMY Vehicles Stolen During 1983-1988
(Based on HLDI Sample for 5 Selected Companies)
1988 1987 1986 1985 1984 1983
Marked Cars* 13,524 11,491 11,602 12,472 12,547 12,705
Unmarked Cars 8,848 8,929 9,374 10,017 9,617 9,429
Anti-Theft 20,338 17,047 17,298 15,210 15,923 14,310Cars
MPV's/Light 11,667 11,434 12,066 12,793 12,891 12,884Trucks
Aggregate 11,435 10,750 11,369 12,252 12,359 12,316
*Marking applied to 1987 and 1988 only.
51 TR-234
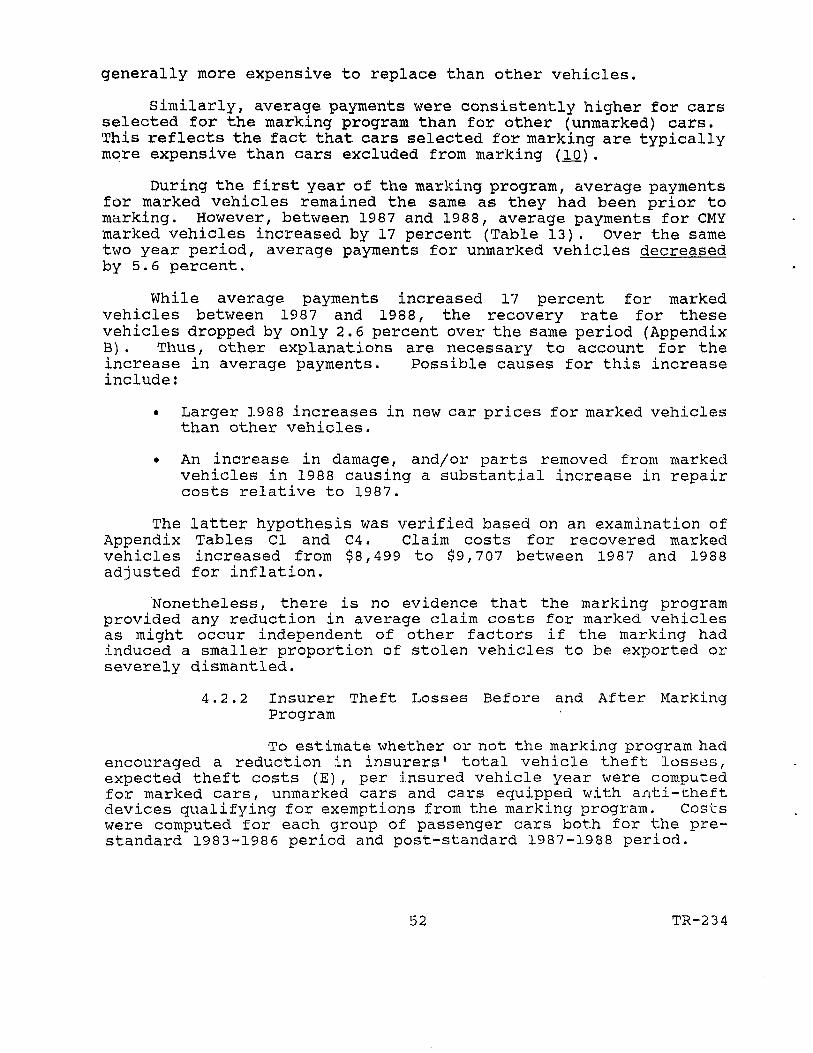
generally more expensive to replace than other vehicles.
Similarly, average payments were consistently higher for carsselected for the marking program than for other (unmarked) cars.This reflects the fact that cars selected for marking are typicallymore expensive than cars excluded from marking (1(3) .
During the first year of the marking program, average paymentsfor marked vehicles remained the same as they had been prior tomarking. However, between 1987 and 1988, average payments for CMYmarked vehicles increased by 17 percent (Table 13). Over the sametwo year period, average payments for unmarked vehicles decreasedby 5.6 percent.
While average payments increased 17 percent for markedvehicles between 1987 and 1988, the recovery rate for thesevehicles dropped by only 2.6 percent over the same period (AppendixB) . Thus, other explanations are necessary to account for theincrease in average payments. Possible causes for this increaseinclude:
• Larger 19 8 8 increases in new car prices for marked vehiclesthan other vehicles.
• An increase in damage, and/or parts removed from markedvehicles in 1988 causing a substantial increase in repaircosts relative to 1987.
The latter hypothesis was verified based on an examination ofAppendix Tables Cl and C4. Claim costs for recovered markedvehicles increased from $8,499 to $9,707 between 1987 and 1988adjusted for inflation.
Nonetheless, there is no evidence that the marking programprovided any reduction in average claim costs for marked vehiclesas might occur independent of other factors if the marking hadinduced a smaller proportion of stolen vehicles to be exported orseverely dismantled.
4.2.2 Insurer Theft Losses Before and After MarkingProgram
To estimate whether or not the marking program hadencouraged a reduction in insurers' total vehicle theft losses,expected theft costs (E), per insured vehicle year were computedfor marked cars, unmarked cars and cars equipped with anti-theftdevices qualifying for exemptions from the marking program. Costswere computed for each group of passenger cars both for the pre-standard 1983-1986 period and post-standard 1987-1988 period.
52 TR-234
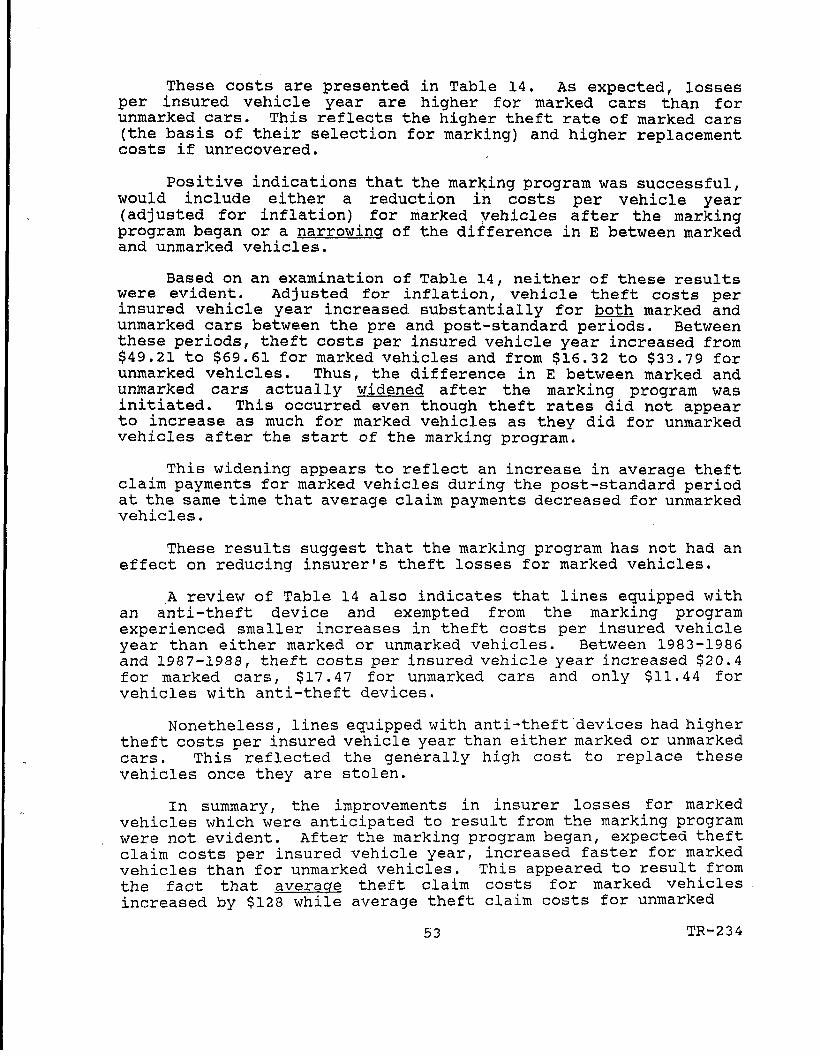
These costs are presented in Table 14. As expected, lossesper insured vehicle year are higher for marked cars than forunmarked cars. This reflects the higher theft rate of marked cars(the basis of their selection for marking) and higher replacementcosts if unrecovered.
Positive indications that the marking program was successful,would include either a reduction in costs per vehicle year(adjusted for inflation) for marked vehicles after the markingprogram began or a narrowing of the difference in E between markedand unmarked vehicles.
Based on an examination of Table 14, neither of these resultswere evident. Adjusted for inflation, vehicle theft costs perinsured vehicle year increased substantially for both marked andunmarked cars between the pre and post-standard periods. Betweenthese periods, theft costs per insured vehicle year increased from$49.21 to $69.61 for marked vehicles and from $16.32 to $33.79 forunmarked vehicles. Thus, the difference in E between marked andunmarked cars actually widened after the marking program wasinitiated. This occurred even though theft rates did not appearto increase as much for marked vehicles as they did for unmarkedvehicles after the start of the marking program.
This widening appears to reflect an increase in average theftclaim payments for marked vehicles during the post-standard periodat the same time that average claim payments decreased for unmarkedvehicles.
These results suggest that the marking program has not had aneffect on reducing insurer's theft losses for marked vehicles.
A review of Table 14 also indicates that lines equipped withan anti-theft device and exempted from the marking programexperienced smaller increases in theft costs per insured vehicleyear than either marked or unmarked vehicles. Between 1983-1986and 1987-1988, theft costs per insured vehicle year increased $20.4for marked cars, $17.47 for unmarked cars and only $11.44 forvehicles with anti-theft devices.
Nonetheless, lines equipped with anti-theft'devices had highertheft costs per insured vehicle year than either marked or unmarkedcars. This reflected the generally high cost to replace thesevehicles once they are stolen.
In summary, the improvements in insurer losses for markedvehicles which were anticipated to result from the marking programwere not evident. After the marking program began, expected theftclaim costs per insured vehicle year, increased faster for markedvehicles than for unmarked vehicles. This appeared to result fromthe fact that average theft claim costs for marked vehiclesincreased by $128 while average theft claim costs for unmarked
53 TR-234
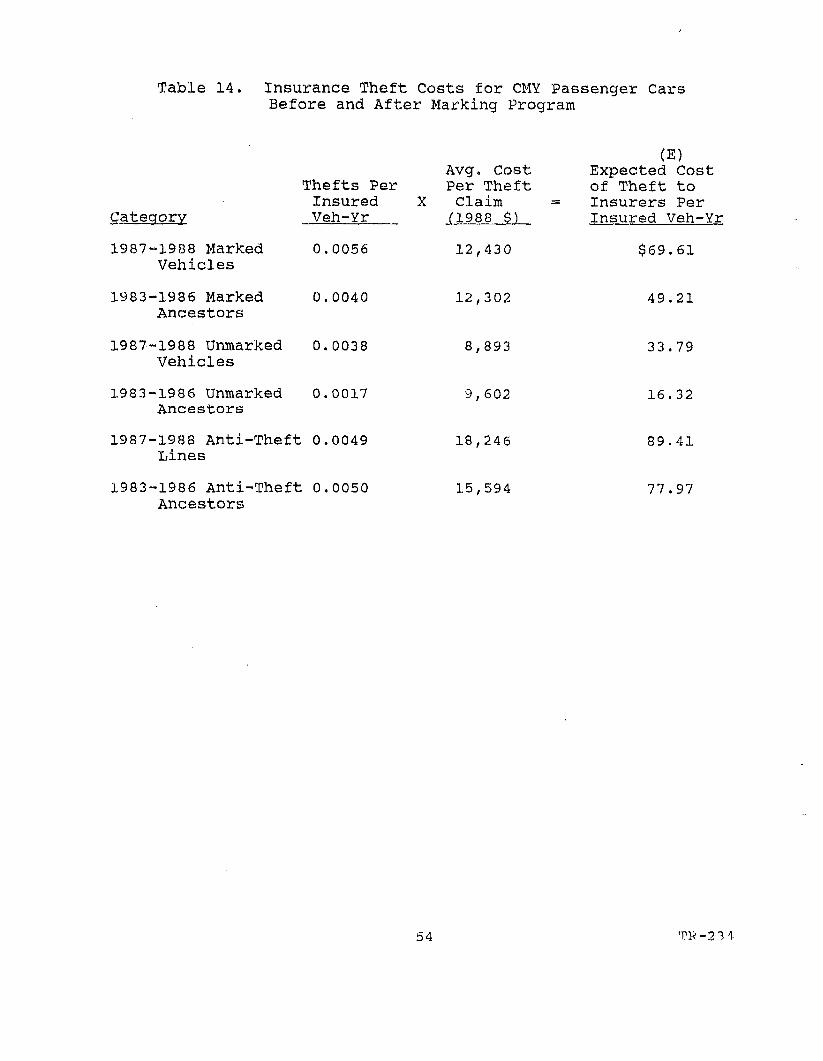
Table 14. Insurance Theft Costs for CMY Passenger CarsBefore and After Marking Program
Category
1987-1988 MarkedVehicles
1983-1986 MarkedAncestors
1987-1988 UnmarkedVehicles
1983-1986 UnmarkedAncestors
1987-1988 Anti-TheftLines
1983-1986 Anti-Theft
Thefts PerInsuredVeh-Yr
0.0056
0.0040
0.0038
0.0017
0.0049
0.0050
X
Avg. CostPer TheftClaim =(1988 $)
12,430
12,302
8,893
9,602
18,246
15,594
(E)Expected Costof Theft toInsurers PerInsured Veh-Yr
$69.61
49.21
33.79
16.32
89.41
77.97Ancestors
54 TR-23
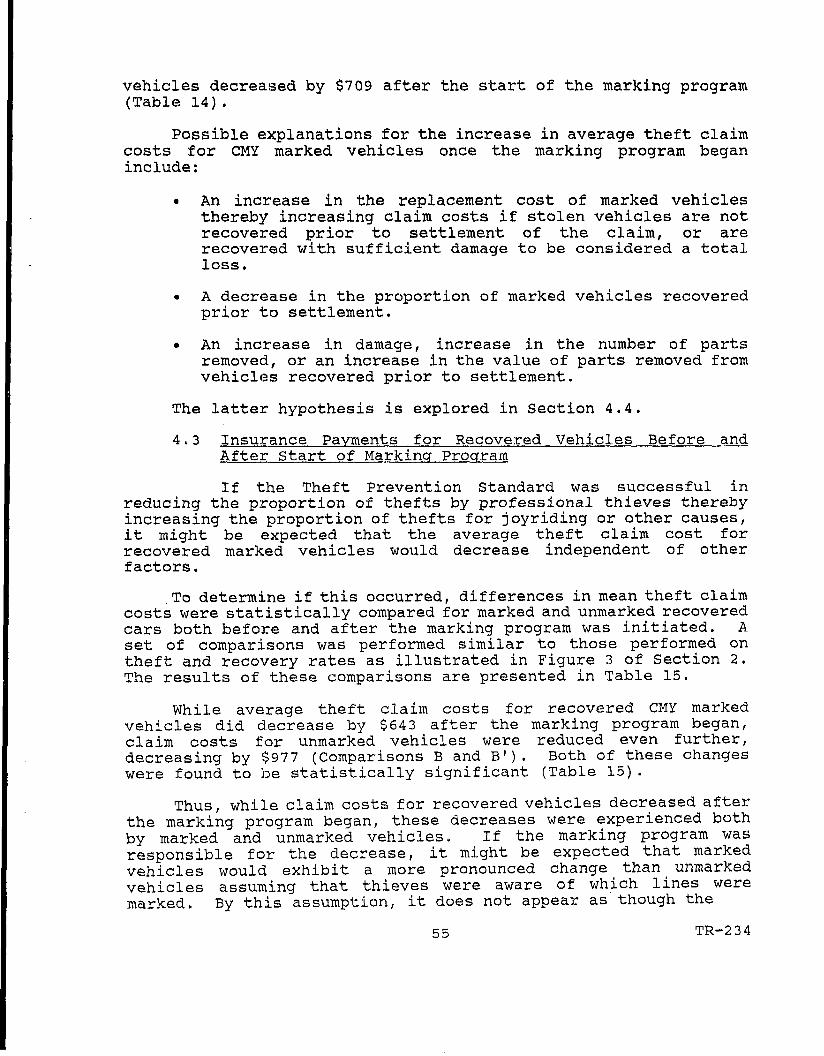
vehicles decreased by $709 after the start of the marking program(Table 14).
Possible explanations for the increase in average theft claimcosts for CMY marked vehicles once the marking program beganinclude:
• An increase in the replacement cost of marked vehiclesthereby increasing claim costs if stolen vehicles are notrecovered prior to settlement of the claim, or arerecovered with sufficient damage to be considered a totalloss,
• A decrease in the proportion of marked vehicles recoveredprior to settlement.
• An increase in damage, increase in the number of partsremoved, or an increase in the value of parts removed fromvehicles recovered prior to settlement.
The latter hypothesis is explored in Section 4.4.
4.3 Insurance Payments for Recovered Vehicles Before andAfter Start of Marking Program
If the Theft Prevention Standard was successful inreducing the proportion of thefts by professional thieves therebyincreasing the proportion of thefts for joyriding or other causes,it might be expected that the average theft claim cost forrecovered marked vehicles would decrease independent of otherfactors.
To determine if this occurred, differences in mean theft claimcosts were statistically compared for marked and unmarked recoveredcars both before and after the marking program was initiated. Aset of comparisons was performed similar to those performed ontheft and recovery rates as illustrated in Figure 3 of Section 2.The results of these comparisons are presented in Table 15.
While average theft claim costs for recovered CMY markedvehicles did decrease by $64 3 after the marking program began,claim costs for unmarked vehicles were reduced even further,decreasing by $977 (Comparisons B and B'). Both of these changeswere found to be statistically significant (Table 15).
Thus, while claim costs for recovered vehicles decreased afterthe marking program began, these decreases were experienced bothby marked and unmarked vehicles. If the marking program wasresponsible for the decrease, it might be expected that markedvehicles would exhibit a more pronounced change than _ unmarkedvehicles assuming that thieves were aware of which lines weremarked. By this assumption, it does not appear as though the
55 TR-234
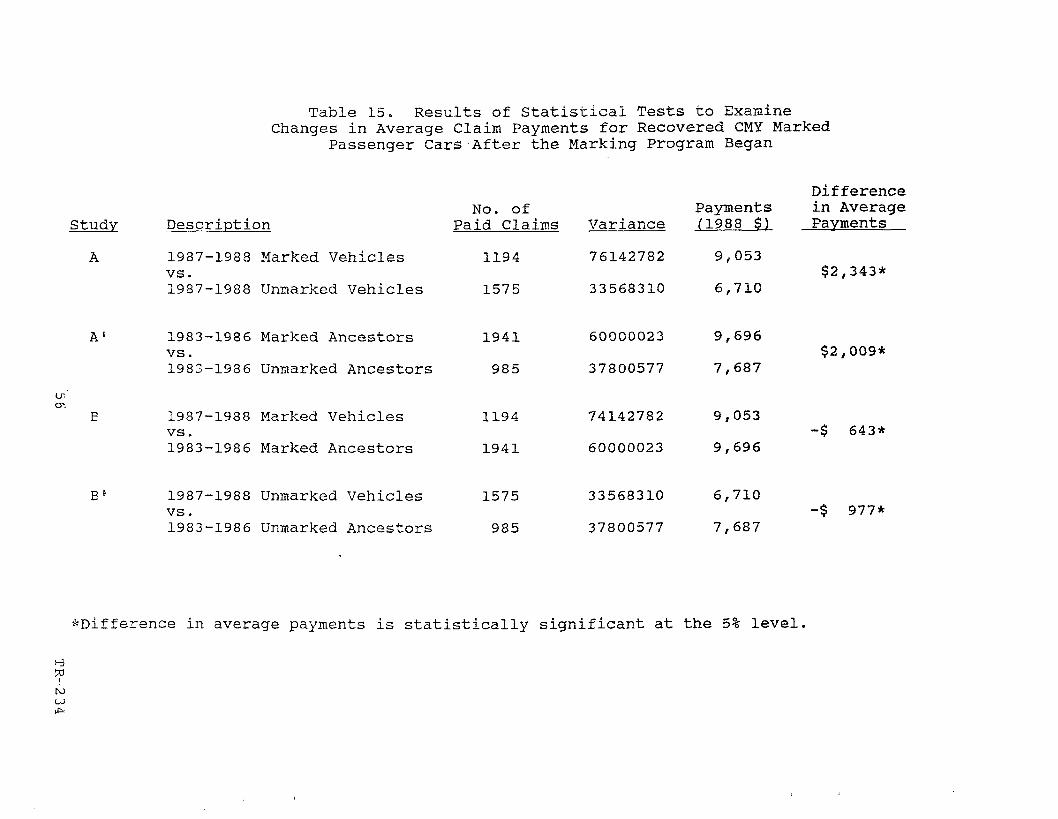
Table 15. Results of Statistical Tests to ExamineChanges in Average Claim Payments for Recovered CMY Marked
Passenger Cars After the Marking Program Began
Study
A
encr,
A1
Description
1987-1988 Marked Vehiclesvs.1987-1988 Unmarked Vehicles
1983-1986 Marked Ancestorsvs.1983-1986 Unmarked Ancestors
1987-1988 Marked Vehiclesvs.1983-1986 Marked Ancestors
1987-1988 Unmarked Vehiclesvs.1983-1986 Unmarked Ancestors
No. ofPaid Claims
1194
1575
1941
985
1194
1941
1575
985
Variance
76142782
33568310
60000023
37800577
74142782
60000023
33568310
37800577
PaymentsQ988 S)
9,053
6,710
9,696
7,687
9,053
9,696
6,710
7,687
Differencein AveragePayments
$2,343*
$2,009*
-$ 643*
-$ 977*
^Difference in average payments is statistically significant at the 5% level,
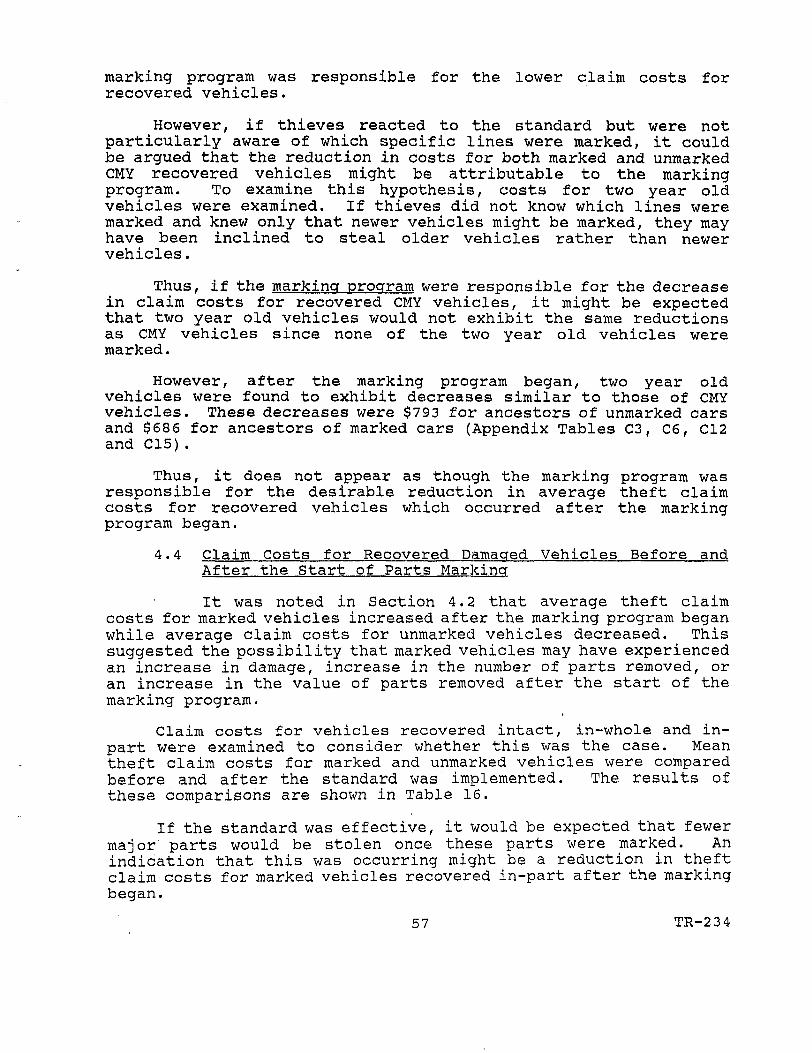
marking program was responsible for the lower claim costs forrecovered vehicles.
However, if thieves reacted to the standard but were notparticularly aware of which specific lines were marked, it couldbe argued that the reduction in costs for both marked and unmarkedCMY recovered vehicles might be attributable to the markingprogram. To examine this hypothesis, costs for two year oldvehicles were examined. If thieves did not know which lines weremarked and knew only that newer vehicles might be marked, they mayhave been inclined to steal older vehicles rather than newervehicles.
Thus, if the marking program were responsible for the decreasein claim costs for recovered CMY vehicles, it might be expectedthat two year old vehicles would not exhibit the same reductionsas CMY vehicles since none of the two year old vehicles weremarked.
However, after the marking program began, two year oldvehicles were found to exhibit decreases similar to those of CMYvehicles. These decreases were $793 for ancestors of unmarked carsand $686 for ancestors of marked cars (Appendix Tables C3, C6, C12and C15).
Thus, it does not appear as though the marking program wasresponsible for the desirable reduction in average theft claimcosts for recovered vehicles which occurred after the markingprogram began.
4.4 Claim Costs for Recovered Damaged Vehicles Before andAfter the Start of Parts Marking
It was noted in Section 4.2 that average theft claimcosts for marked vehicles increased after the marking program beganwhile average claim costs for unmarked vehicles decreased. Thissuggested the possibility that marked vehicles may have experiencedan increase in damage, increase in the number of parts removed, oran increase in the value of parts removed after the start of themarking program.
Claim costs for vehicles recovered intact, in-whole and in-part were examined to consider whether this was the case. Meantheft claim costs for marked and unmarked vehicles were comparedbefore and after the standard was implemented. The results ofthese comparisons are shown in Table 16.
If the standard was effective, it would be expected that fewermajor parts would be stolen once these parts were marked. Anindication that this was occurring might be a reduction in theftclaim costs for marked vehicles recovered in-part after the markingbegan.
57 TR-234
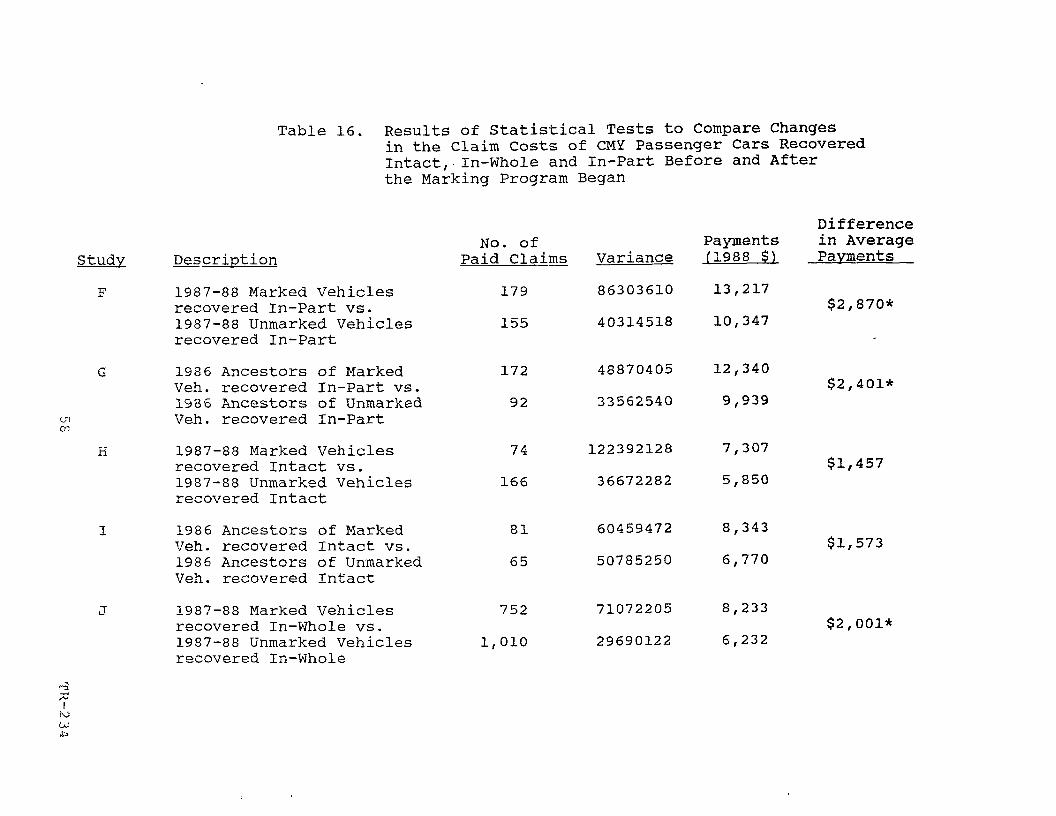
Table 16. Results of Statistical Tests to Compare Changesin the Claim Costs of CMY Passenger Cars RecoveredIntact, In-Whole and In-Part Before and Afterthe Marking Program Began
Study
F
en
(-3
I
G
H
Description
1987-88 Marked Vehiclesrecovered In-Part vs.1987-88 Unmarked Vehiclesrecovered In-Part
198 6 Ancestors of MarkedVeh. recovered In-Part vs.198 6 Ancestors of UnmarkedVeh. recovered In-Part
1987-88 Marked Vehiclesrecovered Intact vs.1987-88 Unmarked Vehiclesrecovered Intact
198 6 Ancestors of MarkedVeh. recovered Intact vs.198 6 Ancestors of UnmarkedVeh. recovered Intact
1987-88 Marked Vehiclesrecovered In-Whole vs.1987-88 Unmarked Vehiclesrecovered In-Whole
No. ofPaid Claims
179
155
172
92
74
166
81
65
752
1,010
Variance
86303610
40314518
48870405
33562540
122392128
36672282
60459472
50785250
71072205
29690122
Paymentsri988 $)
13,217
10,347
12,340
9,939
7,307
5,850
8,343
6,770
8,233
6,232
Differencein AveragePayments
$2,870*
$2,401*
$1,457
$1,573
$2,001*
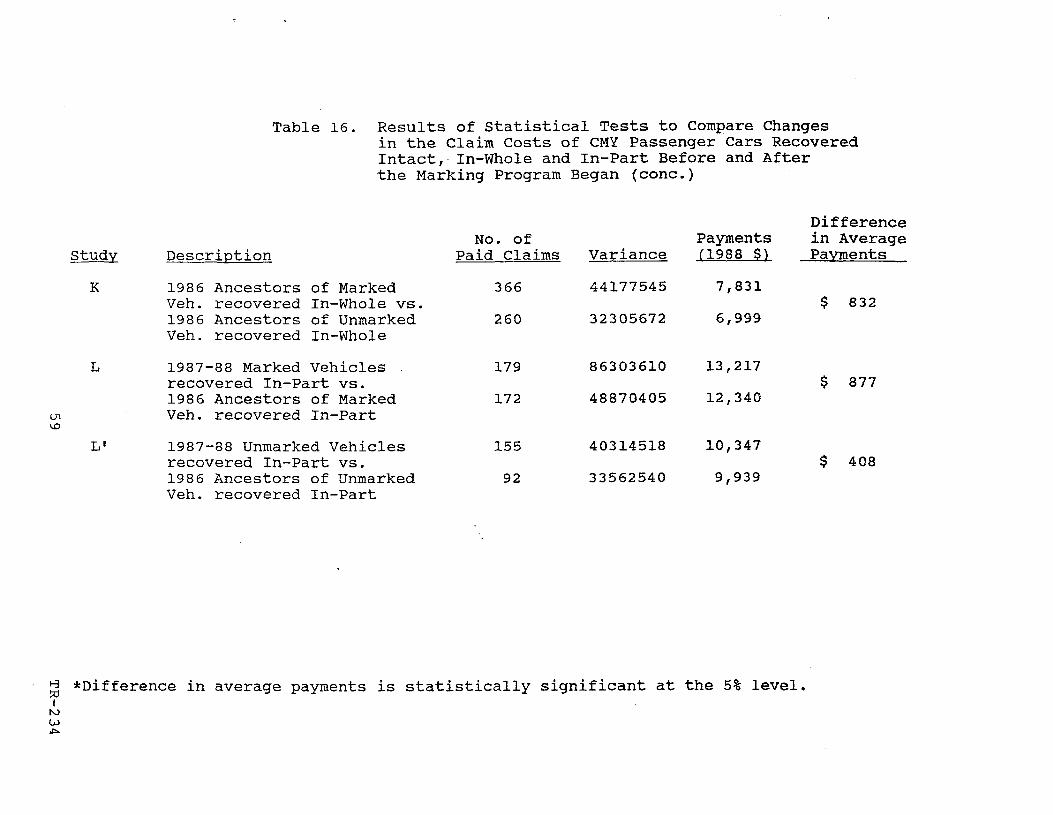
Table 16. Results of Statistical Tests to Compare Changesin the Claim Costs of CMY Passenger Cars RecoveredIntact, In-Whole and In-Part Before and Afterthe Marking Program Began (cone.)
Study
K
Ul
L1
Description
1986 Ancestors of MarkedVeh. recovered In-Whole vs.1986 Ancestors of UnmarkedVeh. recovered In-Whole
1987-88 Marked Vehiclesrecovered In-Part vs.1986 Ancestors of MarkedVeh. recovered In-Part
1987-88 Unmarked Vehiclesrecovered In-Part vs.198 6 Ancestors of UnmarkedVeh. recovered In-Part
No. ofPaid Claims
366
260
179
172
155
92
Variance
44177545
32305672
86303610
48870405
40314518
33562540
Payments(1988 $)
7,831
6,999
13,217
12,340
10,347
9,939
Differencein AveragePavments
$ 832
$ 877
$ 408
*Difference in average payments is statistically significant at the 5% level,
U)
This was not found to be the case. No statisticallysignificant changes in claim payments were observed for markedvehicles recovered in-part once the marking began (Comparison L).Similar results were observed for unmarked cars (Comparison L 1 ) .
However, claim costs for vehicles recovered in-whole becamesignificantly higher for marked vehicles relative to unmarkedvehicles after the marking program began (Comparisons J and K) .This result suggests that relative to unmarked vehicles, the markedvehicles experienced an increase in damage and/or thefts of non-marked parts. This result is consistent with the observation thataverage theft claim costs increased for marked vehicles between1983-1986 and 1987-1988 while average theft claim costs forunmarked vehicles decreased.
It should also be noted that average payments for recoveredvehicles in the HLDI sample appear somewhat higher than mightnormally be expected. This is especially evident for vehiclesrecovered intact (Comparisons H and I) . Explanations for thesehigher than expected costs include:
• Claims valued below the policy deductible are excluded fromthe claim sample. Thus, the sample underrepresentsinstances in which a stolen vehicle is recovered intactwithin a few days of the theft.
• The average payments expressed for recovered vehiclesincludes both vehicles recovered before and after the datethe claim was settled. Recoveries prior to the settlementdate will reflect the damage sustained by the vehicle asa result of the theft. A claim in which the recoveryoccurred after the date of settlement, was paid as a totalloss raising the overall average payment for recoveredvehicles.
These issues are addressed in Section 6 to estimate the extentthe HLDI sample underrepresents vehicles recovered intact anddetermine the proportion of recoveries which occur prior tosettlement of the claim.
4.5 Implications of Theft Claim Payment Trends onEffectiveness of the Marking Program
Based on analyses of trends in insurer payments forvehicle theft claims, several observations may be stated regardingthe effectiveness of the Theft Prevention Standard. These include:
• Insurer losses for marked vehicles continued to increaseafter the marking program began. In fact, expected theftclaim costs (E) per insured vehicle year increased fasterfor marked vehicles than for unmarked vehicles. Thisoccurred even though the rate of theft did not increase as
60 TR-234
fast for marked vehicles as it did for unmarked vehicles.Between 1983-1986 and 1987-1988, theft costs per insuredvehicle year increased $20.40 for marked cars, $17.47 forunmarked cars and only $11.44 for vehicles with anti-theftdevices. This appeared to result from the fact thataverage claim costs for stolen marked vehicles increasedby $128 while average theft claim costs for unmarkedvehicles decreased by $709 after the start of the markingprogram. (Table 14) .
Potential causes for the relative differences in theft losspayments between marked and unmarked vehicles after themarking program began include:
1) A larger increase in the replacement cost of markedvehicles than unmarked vehicles during 1987-1988.
2) A decrease in the proportion of marked vehiclesrecovered prior to settlement relative to theproportion for unmarked vehicles.
3) A relative increase in damage, increase in the numberof parts removed, or an increase in the value of partsremoved from vehicles recovered prior to settlementfor marked vehicles compared to unmarked vehicles.
Results suggest that the latter scenario was occurring tosome extent. Claim costs for vehicles recovered in-wholebecame significantly higher for marked vehicles relativeto unmarked vehicles after the marking program began (Table16). This result suggests that relative to unmarkedvehicles, the marked vehicles experienced an increase indamage and/or thefts of non-marked parts. This result isconsistent with the observation that average theft claimcosts increased for marked vehicles between 1983-1986 and1987-1988 while average theft claim costs for unmarkedvehicles decreased.
One measure that the standard was effective would be areduction in the number of marked parts stolen once themarking program began. An indication that this wasoccurring might be a reduction in theft claim costs formarked vehicles recovered in-part. This was not found tobe the case. No statistically significant changes in claimpayments were observed for marked vehicles recovered in-part once the marking began (Table 16) . Similar resultswere observed for unmarked cars.
Average claim costs for recovered vehicles decreasedsignificantly after the marking program began. This resultmight be expected if the standard reduced the extent ofprofessional thefts thereby increasing the proportion of
61 TR-234
thefts for joyriding and other purposes. However, theevidence does not appear to suggest that the markingprogram itself was responsible for this result. Whileaverage theft claim costs for recovered CMY marked vehiclesdid decrease by $643 after the marking program began, claimcosts for unmarked vehicles were reduced even further,decreasing by $977. Both of these changes were found tobe statistically significant (Table 15) . Also, the samedecreases were observed for older vehicles as for CMYvehicles. None of the older vehicles had marked parts.
62 TR-234
5. AUTOMOBILE COMPREHENSIVEPREMIUMS CHARGED DURING 1983-1988
Since one of the purposes of the Theft Act was to encouragelower consumer costs for automobile comprehensive coverage, it isimportant to consider how insurers determine their premiums forthis coverage and how vehicle theft influences these rates.
Based on the analysis of insurer losses performed in Section4, there is no evidence that insurer costs for vehicle theft havediminished for marked vehicles. Thus, it does not as yet appearthat the marking program could have led to lower consumer costs forcomprehensive coverage. How this might occur in the future isexplored in the sections which follow.
The following sections consider:
» The role of theft in determining automobile comprehensivepremiums and how insurers can be expected to reflect theimpacts of the Theft Act in their ratemaking.
• Whether and how insurers actually considered the Theft Actin the determination of 1983-1988 comprehensive rates.
• How premiums varied before and after the introduction ofthe marking program.
5.1 The Role of Theft in Determining Automobile ComprehensivePremiums
In general, policies insuring only against vehicle theftare not written in the non-commercial private passenger car market.Instead, coverage for the theft of an automobile is most frequentlyprovided under a comprehensive policy. This type of policy alsoincludes coverage for a number of other perils such as floods (e.g.as in the case of a hurricane), malicious mischief, vandalism, fireand glass damage. With the possible exception of glass damage,these are largely non-accident related events.
Most insurers establish rates for comprehensive coverage ona statewide basis by considering the total loss experience forcomprehensive claims. Generally, the specific 'components of theloss experience such as theft losses, etc. are not considered. Astratification of losses by cause is often not warranted forratemaking purposes because:
1) Infrequent perils, such as a serious hurricane, may occuronly once in several years. Thus, losses for this typeof peril in any single year are not representative ofexpected losses over time.
63 TR-234
2) Even when losses occur more frequently, subdividing dataextensively by cause of loss produces cells of experiencethat may be subject to severe statistical fluctuation.
Therefore, an individual insurer's own theft loss experienceis often an insufficient basis to determine adjustments in thecompany's comprehensive rates. In fact, an insurer's total lossexperience is often insufficient as a basis for rates forcomprehensive coverage. These insurers might rely on the aggregateloss experience of many companies as compiled by a ratingorganization such as the Insurance Services Office (ISO).
Since losses entering the ratemaking formulas are notdifferentiated by cause of loss, there is no ready empirical basison which to allocate costs by peril. Also, the differentials inrates between individual vehicles are normally based on countrywideexperience, where the mix of losses may differ substantially fromthe state level. Thus, it is often difficult, if not impossible,to segregate the actual portion of the prospective premium due tovehicle theft.
For most companies, the best estimation of the proportion ofcomprehensive premium cost to provide theft coverage, is theproportion of total comprehensive losses which are due to vehicletheft. Based on information supplied by insurers under the InsurerReporting Requirements of the Theft Act, it has been estimated thatthe proportion of comprehensive dollar losses due to the theft ofmotor vehicles was 38 percent in 1985 (2.) and 40 percent in 1986(11) •
There are many caveats to using these loss estimates toestimate the theft component of comprehensive premiums. Thesecaveats become apparent as the ratemaking process is furtherdescribed below.
5.1.1 Ratemaking Process for Automobile ComprehensivePremiums
Ratemaking techniques vary across the country asthe rate regulatory process differs substantially between states.Therefore, it is not surprising that rates have -been found to varysignificantly between states (£).
Some states use open competition, wherein rate justificationsneed not be filed, or are filed for informational purposes only.The rates and rating factors generally must be submitted, butcompanies need not await formal approvals. In these states,complete freedom of pricing techniques is allowed.
Other jurisdictions restrict the prerogatives of insurers toset rates and use a prior approval system for ratesetting. Ratesmust be filed with full supporting documentation and the rates can
64 TR-234

only be used when formal approval is given. Insurance Departmentsin certain states may have "preferred" methods of ratemaking andapproval of new premiums may be given only if such methods arefollowed. This can severely limit the ratemaking options of thecompany.
In the most restrictive states, such as Massachusetts, theInsurance Commisioner sets the rates. Insurers' rates are neitherapproved or disapproved but rather are determined by the state.This ratemaking process is highly formalized and few insureroptions for deviations are permitted.
Besides the differences in regulations between states, thereare also differences in the way insurers calculate their rateneeds. Even when insurers use the same rating organization, suchas ISO, to determine rates and rating factors, premiums may varybetween companies because of differences in anticipated lossexperience or expense needs.
Regardless of the specific methodology employed, the firststage of the ratemaking process is to determine the overall stateaverage premium change that is required. This stage determines howmuch the rates will change on a statewide basis.
To establish these rates, a needed premium revenue based onthe prior year's experience is compared with actual earned premiumsbrought up to the present rate level. Both losses and expenseswhich make up the needed premium revenue are adjusted to reflectthe level of costs projected to be in effect when the new rates areto be enforced.
Within this process, there is normally no differentiation ofthe experience by cause of loss (e.g. theft, flood, vandalism,etc.). The only exception would be so-called catastrophe losses,where a great number of vehicles were damaged in a single incident,such as a hurricane. In such instances, losses in excess of acertain amount may be excluded.
Statewide rates are generally established for individual makesand models on the basis of their rating symbol (JL1) . A ratingsymbol is an actuarial designation which principally reflects theoriginal cost of the vehicle and may also reflect its damageabilityand repairability. The symbol assigned to a specific make andmodel is frequently adjusted up or down on a statewide basis basedupon the vehicle's combined collision and loss experience. Sincethe majority of physical damages arise from collisions, the ratingsymbol may often correlate more closely to collision experiencethan theft experience (.11) •
Adjustments to these statewide rates are made on the basis ofterritory of operation. Rate relativities between territoriesgenerally reflect the relative total loss experience of each
65 TR-234
territory. When it is determined that a change in premium incomeis required in a given state, the change is distributed to allterritories and balanced so that the desired statewide change isachieved.
As in other stages of the ratemaking process, the determina-tion of territorial adjustments is based upon aggregate experiencenormally without any differentiation of the experience by cause ofloss. Theft experience is recognized only to the extent that itis implicit in the underlying data.
Theft experience can, of course, result in significant ratedifferentials by rating territory (geographic area). One wouldnormally expect theft rates to be greater in urban environmentsthan in rural areas. There is, however, no attempt to measure thiseffect directly, or to recognize different buying patterns by area.Only the results implicit in the overall experience are recognizedwithin the ratemaking process.
Thus, throughout various stages of the ratemaking process; atthe state level, territory level or vehicle (symbol) level, thereis seldom an analysis of the cause of the specific loss elementsof the experience. If such a study is done, it is normally forinternal company use, as opposed to rate filing purposes.
5.1.2 Rating Characteristics to Establish AutomobileComprehensive Premiums
As described above, the premium charged forautomobile comprehensive coverage is based upon the state andterritory of operation, as well as the rating symbol assigned tothe vehicle. Other factors which influence specific premiumsinclude both driver and vehicle use characteristics (.11) .
Typical driver rating characteristics include:
« Age
o Sex
» Driver Training, Completion of Accident'Prevention Course
« Driver Record
« Student. Achievement (if applicable)
• Marital Status
Typical vehicle use rating characteristics include:
•i Primary use of vehicle (i.e. commuting, business, etc.)
66 TR-234
• Annual mileage travelled
Additional rating characteristics include:
• Number of other vehicles insured
• Model year (age) of the vehicle
• Policy deductible amount
• Whether vehicle is equipped with a Passive OccupantRestraint System
• Whether vehicle is equipped with a qualifying anti-theftdevice
Rating characteristics often used for light trucks include;commercial use of the vehicle, its age, cost and territory.
Rating characteristics often used for motorcycles include itsage, engine size and territory of operation.
Very few of the companies furnishing Insurer Reports to NHTSAunder Section 612 of the Theft Act assess any surcharge or premiumpenalty to insure vehicles which are stolen more frequently thanothers. Even when such surcharges are applied, they are generallynot based specifically and solely upon theft loss experience.Several surrogate measures for vehicle theft are used rather thanactual theft experience itself in determining theft related premiumpenalties. These include:
• The potential for higher than usual losses of all kindsunder comprehensive coverage
• Performance characteristics of the vehicle such asacceleration capabilities
• Design characteristics such as luxury and sportiness
• Level of automotive production, availability of replacementparts and associated repair costs
The method most commonly cited by insurers to assess premiumpenalties for lines with poorer loss experience is the ISO VehicleSeries Rating (VSR) procedure. This procedure is used to raise orlower a vehicle's rating symbol based upon observed lossexperience. However, this procedure is based upon a number offactors influencing loss potential and is not tied solely to thelikelihood of theft. Thus, the procedure can not be used todevelop discounts or penalties which specifically recognize avehicle's theft loss potential.
67 TR-2 3 4
5.1.3 Ratemaking Procedures to Reflect the Theft Act
It is expected that insurers' responses to anybenefits of the Theft Act will be reflected through their normalratemaking process. The procedures followed by most insurers arenot currently aimed at changing comprehensive rates for a givenmotor vehicle line based on a determination that the theft rate forthe'line has changed (11). Lower rates for all passenger cars ina rating territory can be expected when total comprehensive lossesor combined comprehensive and collision losses for the territoryare reduced.
Thus, unless special consideration is taken by the insurers,it is expected that any benefits of parts labelling in reducinginsurer theft losses for affected lines, would be dispersed toprovide lower insurance premiums for other lines as well. Thesereductions in premiums could only be expected to occur to theextent that reductions in theft losses are not offset by changesin other losses insured under comprehensive coverage.
At this point it appears that the marking program has notreduced insurer losses. If this changes, the most appropriateinsurer reaction would be to either adjust the symbol groupapplicable to affected vehicles or employ a special discount formarked vehicles similar to that employed by some of the insurersfor lines equipped with certain anti-theft devices.
A few companies already provide a discount for a windowmarking system. Under such a system, the VIN number is etched onat least two windows of the vehicle, not including vent windows.These discounts are generally equivalent to the largest discountsoffered for anti-theft devices. These discounts do not appear toapply to vehicles with any other marked parts.
Regardless of the propriety of a rate adjustment to reflectany changes caused by the Theft Act, it is unlikely that thesechanges would be reflected in 1987 and 1988 rates. Since thestandards have only been in effect for 1987 and 1988 model yearvehicles, their effects are not yet significantly represented inthe insurers' data bases. For example, 1989 rates would generallybe based on experience for 1988 and prior years.- By the nature ofthe rating process, a degree of trend is built into the rates.
Given the currently available volume of claim data for anyparticular make and model, it is reasonable to expect that abroader span of experience is necessary before any effects of themarking program can be reflected in insurance rates. It isprobably not reasonable to expect effects of the Theft Act tonoticeably influence premiums before 1989 or 1990.
68 TR-234
5-2 Insurer Considerations of Theft Act in Determining 1983-1988 Comprehensive Premiums
To examine whether and how insurers actually consideredthe Theft Act in determining premiums, rate filings were obtainedand reviewed for 1983-1988 rates filed in several states by fourcompanies. These companies included: State Farm, GEICO, USAA andArnica.
Three of these companies - GEICO, USAA and Arnica essentiallyfollow ISO rules and symbol relativities so that their overallactions are relatively similar. State Farm bases rates on its ownloss experience and its ratemaking is independent of othercompanies to the extent that competition permits.
None of the rate filings examined included any reference orevidence that the Theft Act has as yet been taken into account inthe rating of automobile comprehensive coverage.
The logical place to make such a recognition would be in thesymbol group assignment of the affected vehicles. If insurersbegan to consider the Theft Act in their ratesetting, it wouldwarrant specific mention in the affected rate filings, given thedeparture from past practice and the importance of such a change.Since no such mention was found, it is reasonably presumed that noreflection of the Theft Act was made by these companies.
The only symbol group modifications reflected within the ratefilings involve changing the base model year. For example, in late1986, a new rate category for 1987 model year vehicles would benecessary. There is a rule which permits the rating of such carswithout a rate filing and allows CMY 1987 rates to be 5 percenthigher than rates for CMY 1986 vehicles. This rate adjustment,however, would follow the model type and would not reflect anypotential savings as a result of changes in anticipated costs dueto the introduction of the Federal standards.
Thus, if insurers have begun to measure the effect of theTheft Act, these measurement efforts and effects are not yetreflected in the rate filings examined. This is not surprisinggiven the usual time lag anticipated for any changes in losses tobe reflected in rates.
5.3 Trends in Automobile Comprehensive Premiums During 1983-1988
As a result of the preceding discussion, it was foundthat there was no evidence that insurers were specificallyconsidering the impacts of the Theft Act in determiningcomprehensive premiums during 1983-1988. Even if they had, theftlosses have not yet appeared to diminish as a result of the markingprogram. Thus, it is improbable that the marking program has
69 TR-234
influenced any reduction in 1987-1988 comprehensive rates.
To measure any future shift in comprehensive premiums that mayresult as more vehicles are marked, an analysis was performed toestimate the general trend in rates over the 1983-1988 period.
The analysis also served to demonstrate the variability ofrates over time between companies, states, rural and urban areas,and high and low cost vehicles.
The analysis sought to examine the following questions:
1) How have automobile comprehensive premiums changed overthe 1983-1988 period?
2) Are these changes consistent between states and companies?
3) Are premium trends for low cost vehicles different fromthose of expensive vehicles?
4) Are premium trends in dense metropolitan areas withgenerally high theft rates similar to trends in lowdensity rural areas with lower theft rates?
5.3.1 Procedures to Analyze Premium Trends andVariability
To examine these issues, base levels of automobilecomprehensive premiums charged during 1983-1988 were analyzed.These base premiums reflect the characteristics of the passengercar and its garaging location and exclude characteristics of thedriver. Thus, the base premiums more directly represent theinfluence of vehicle theft than the final premiums which alsoreflect driver characteristics and include taxes, profits, etc.
Trend lines were fit to 1983-1988 base premiums to identifywhether premiums were generally increasing or decreasing over theperiod. The slope of each line also identified the annual rate ofchange of premiums for the trend.
Trend lines were computed separately by state, company,territory and rating symbol. Five states were consideredincluding: California, Florida, Michigan, Ohio and Washington. Thefirst four states had generally high theft rates (.12.) while thestate of Washington had the lowest theft rates in the group.
Within in each state, trends were considered separately in oneterritory with high population density and one territory with lowpopulation density. It is expected that theft rates in the areaswith high population density are much higher than those in areaswith low population density.
70 TR-234
Rate trends in each territory were computed separately for twodifferent insurance companies. One company used ISO rating factorsand procedures while the other uned its own loss experience andprocedures to establish rates.
Rate trends for low cost and high cost CMY vehicles wereconsidered separately. Low cost vehicles were defined as vehiclesvalued between $10,001 and $12,500 while high cost vehicles werevalued between $20,001 and $3 3,000.
5.3.2 Results of Analysis of Premium Trends andVariability
Trend lines for 1983-1988 automobile comprehensivepremiums are depicted in Appendix D. The annual change in premiumsfor each trend and the standard error of the linear fit are shownin Table 17. The standard error of the fit indicates, theunderlying variability of the rates. A small standard errorimplies that there is little difference between the actual premiumsand the general trend line.
As seen from Table 17, the variability of the actual ratesfrom the estimated linear trend line was reasonable in the largemajority of instances. Of the 40 trend lines predicted for the1983-1988 period;
« 2 6 cases had a standard error within $50
• 9 cases had a standard error between $50™$100 and
• Only 5 cases had a standard error over $10 0.
However, in, three of the five cases with standard errors over$100 the 1983 premiums are responsible for generating the largestandard error. Removal of these points would produce a much,better linear fit.
Over the 1983-1980 period, rates were more often found toincrease than decrease each year. Annual increases in premiums(i.e. trend lines with positive slope) occurred in 25 cases whileannual decreases were found in 15 cases.
A majority of the trend lines exhibited small annual changesin premiums over the period. In 2 2 out of 4 0 cases, the estimatedchange in rates each year was within $10 (either increasing ordecreasing). In another eight cases, annual rate changes variedbetween $11 and $3 0. Of these cases, four exhibited annualincreases and four exhibited annual decreases.
71 TR-2 3 4
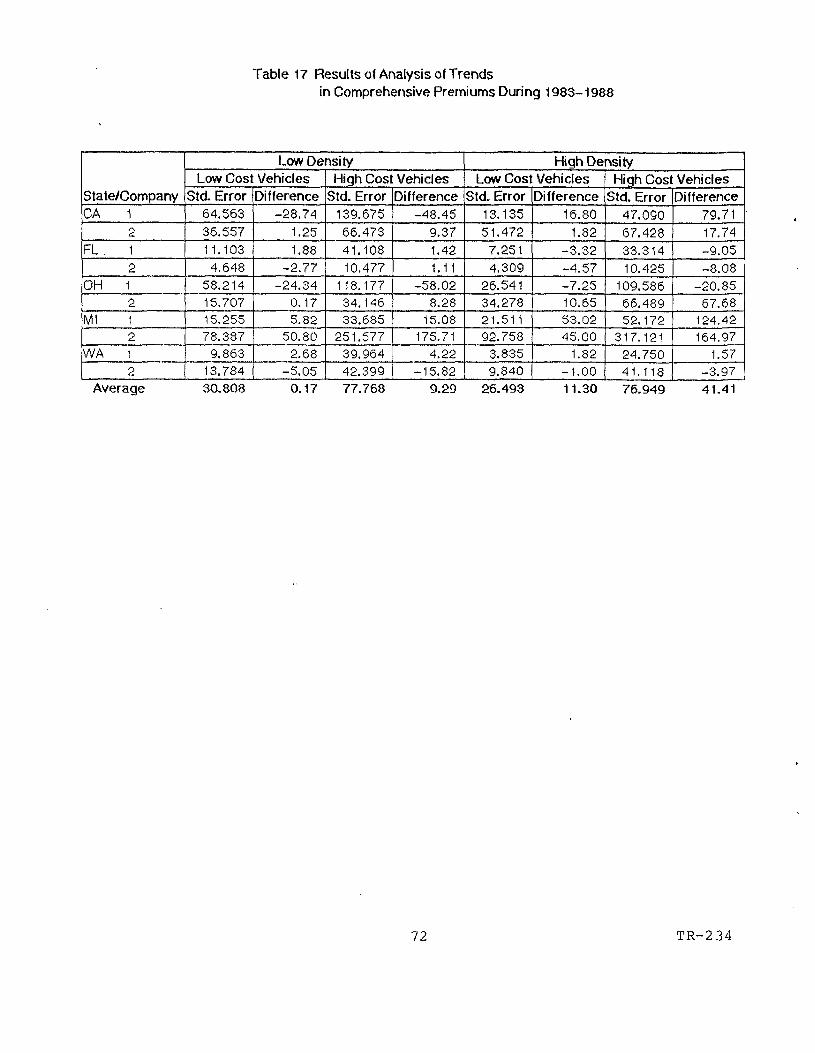
Table 17 Results of Analysis of Trendsin Comprehensive Premiums During 1983-1988
State/CompanyCA 1
2
FL. 12
OH 12
Ml 12
WA 12
Low DensityLow Cost Vehicles
Std. Error64.56336.55711.1034.648
58.21415.70715.25578.387
9.86313.784
Difference-28.74
1.251.88
-2.77-24.34
0.175.82
50.802.68
-5.05
High Cost VehiclesStd. Error
139.67566.47341.10810.477
118.17734.14633.685
251.57739.96442.399
Difference-48.45
9.371.421.11
-58.028.28
15.08175.71
4.22-15.82
High DensityLow Cost Vehicles
Std. Error13.13551.472
7.2514.309
26.54134.27821.51192.758
3.8359.840
Difference16.80
1.82-3.32-4.57-7.2510.6553.0245.00
1.82-1.00
High Cost VehiclesStd. Error
47.09067.42833.31410.425
109.58666.48952.172
317.12124.75041.118
Difference79.7117.74-9.05-8.08
-20.8567.68
124.42164.97
1.57-3.97
Average 30.808 0.17 77.768 9.29 26.493 11.30 76.949 41.41
72 TR-234
Larger annual increases between $31 and $80 were found in fivecases while annual decreases between $31 and $58 were found in twocases. Trend lines in three cases estimated exceptionally largeannual increases in premiums between $125 and $175. Increases ofthis size were limited to expensive vehicles ($28,001-$33,000)insured in the state of Michigan.
Premium trends within a given state might vary significantlybetween companies especially for high cost vehicles. For example,premiums in a high density area of Ohio, were found to increase by$68 a year for one company while decreasing $21 a year for anothercompany. Similarly, premiums for expensive vehicles in a highdensity area of California, increased by $80 a year for one companyand only $18 a year for another company.
Relating premium trends to the expected likelihood of theftyields interesting results. For example, low cost vehicles in lowpopulation density areas would be expected to exhibit a relativelylower incidence of vehicle theft compared to high cost vehicles indense metropolitan areas.
As the likelihood of vehicle theft increases, the rate ofchange of premiums over the 1983-1988 period also appears toincrease as follows:
• The average annual increase in premiums for low costvehicles in low density areas was estimated as only $0.17
• High cost vehicles in rural low density areas experiencedaverage increases of $9.29 per year
• Lower cost vehicles in dense metropolitan areas experiencedaverage annual increases of $11.3 0
• High cost vehicles in dense metropolitan areas exhibitedthe highest average annual increase in premiums of allcategories considered. These increases averaged $41.41per year.
This analysis suggests that there is a correlation between thelikelihood of theft and the size of premium increases across the1983-1988 period.
Similar results are obtained even when trend lines with highvariability are excluded from consideration. By removing the fivecases with standard errors above $100, results are unaffected forlow cost vehicles while average annual premium increases for highcost vehicles are reduced from $9.29 to $3.38 in low density areasand reduced from $41.41 to $33.75 in high density areas.Nonetheless, the same general pattern emerges.
73 TR-234
5.4 Implications of Analysis of Comprehensive Premiums on theEffectiveness of the Marking Program
Based on a review of the ratemaking process and anexamination of rate filings and base automobile comprehensivepremiums in effect during 1983-1988, the following observations arenoted relative to the NHTSA evaluation of the effectiveness of themarking program:
• The procedures followed by most insurers are not currentlyaimed at changing comprehensive rates for a given vehicleline based upon a determination that the theft rate for theline has changed (jLl) .
• Unless special consideration is taken by insurers, it isexpected that any benefits of parts labelling in reducinginsurer losses would not normally be targeted to reducerates only for marked cars but would reduce rates for othercars as well.
• Based on prevalent ratemaking procedures, reductions inpremiums could only be expected to occur to the extent thatreductions in theft losses are not offset by changes inother losses insured under comprehensive coverage.
• An appropriate method to reflect any benefits of themarking program in insurance premiums would be to adjustthe symbol group applicable to marked vehicles or employa special discount for these vehicles similar to discountsoffered by some insurers for lines with anti-theft devices.
• A review of insurer rate filings did not produce anyevidence that the marking program has as yet been takeninto account in the rating of automobile comprehensivecoverage. Even if it had been considered, theft losseshave not as yet appeared to diminish as a result of markingprogram. Thus, it is improbable that the program has hadany significant influence on autombile premiums.
• An examination of premium trends during the 1983-1988period suggests a correlation between 'the likelihood oftheft and the rate of premium increase. On average, lowercost vehicles in rural areas exhibited virtually no changein premiums over the 1983-1988 period, while high costvehicles in dense metropolitan areas exhibited annualincreases averaging $41 a year. Thus, if the TheftPrevention Standard is effective, as more vehicles aremarked, the rate of change of premium increases forexpensive vehicles in high density areas should be foundto diminish independent of other factors.
74 TR-234
6. CHARACTERISTICS OF THEFT CLAIMS FILED DURING 1987-1988
A detailed record of all theft claims filed with one insurerwas obtained for thefts occurring during calendar years 1987 and1988. This sample provided the following detail that could not beobtained from the other insurers or from the NATB and HLDI claimsamples:
1) The sample included all stolen passenger cars insured bythis company regardless of the age of the vehicle.Samples requested from the NATB and the HLDI werespecifically limited to thefts of current model year, oneand two year old vehicles. The detailed sample could beused to identify the proportion of all vehicles stolenwhich were CMY, one or two years old. This would beindicative of the proportion of annual thefts representedin the NATB analysis sample.
2) The sample included all claims and their settlementamounts including claims without payment, whereas the HLDIsamples included only paid claims (i.e. claims with valuesin excess of the policy deductible) . Thus the detailedsample could be used to identify the proportion of claimswithout payment.
3) The sample identified the date of settlement of each claimmaking it possible to determine whether a stolen passengercar was recovered before or after an insurance settlementwas reached. This also made it possible to identify coststo repair recovered stolen vehicles to their pre-theftstate.
The sections which follow further describe the character-istics of this unique sample, as well as, the insights it revealson the characteristics of theft claims.
6•1 Characteristics of Insurance Claim Records
Detailed theft claim records were maintained by theinsurer in written form only.' In support of NHTSA's evaluationeffort, the insurer agreed to permit KLD Associates to review itshand-written claim records and construct a computerized sample ofthese records.
An analysis of this sample for thefts occurring during 1983and 1984 was performed previously and is documented in a separatereport submitted to the NHTSA (10.) . A similar analysis of 1985 and1986 theft claims has also been performed (9.) .
For each selected motor vehicle theft claim, the followinginformation was entered into the computerized data base:
75 TR-234
Claim numberDate case was openedDate case was closedDate of LossVehicle makeModel yearVehicle Identification Number (VIN).Date of recoveryDate of settlementNet amount paidRepair costDisposition
Thus, this sample contained detailed information that couldnot be obtained from the other samples.
The sample included claims for 7,219 vehicles stolen during1987 and 5,887 vehicles stolen during 1988.
6.2 Distribution of Theft Claims by Vehicle Age
Figure 7 illustrates the distribution of thefts during1987 based on vehicle age. Of all the vehicles insured during1987, only selected 1987 and 1988 models were subject to the partsmarking program. Together, marked and unmarked vehicles of thesemodel years represented approximately 10 percent of all vehicletheft claims filed with this insurer during 1987. Most of thesevehicles were built and insured during the course of 1987 and onaverage experienced less calendar time of exposure to theft during1987 than older vehicles.
Thus, older 198 6 vehicles represented 15.7 percent of annualthefts compared to 10 percent for CMY vehicles. The pattern wasapproximately the same for two year old 1985 vehicles, three yearold 1984 vehicles and four year old 1983 vehicles. Vehicles ofeach of these ages represent approximately 10-14 percent of thetotal number of stolen vehicles in 1987. Approximately 5 percent,of the stolen insured vehicles were more than 10 years old.
The distribution of thefts during 1988 by vehicle age is shownin Figure 8. This pattern is similar to that found for 1987. Ofthe vehicles insured during 1988, only selected 1987-1989 modelshad marked parts. Marked and unmarked vehicles of these modelyears represented no more than 25 percent of all the vehicle theftsreported to this insurer during 1988.
Based on these observations it is estimated that no more than10 percent of all annual theft claims during 1987 and 25 percentof all annual theft claims during 1988 are suitable for acomparison of the relative performance of marked and unmarkedvehicles.
76 TR-234
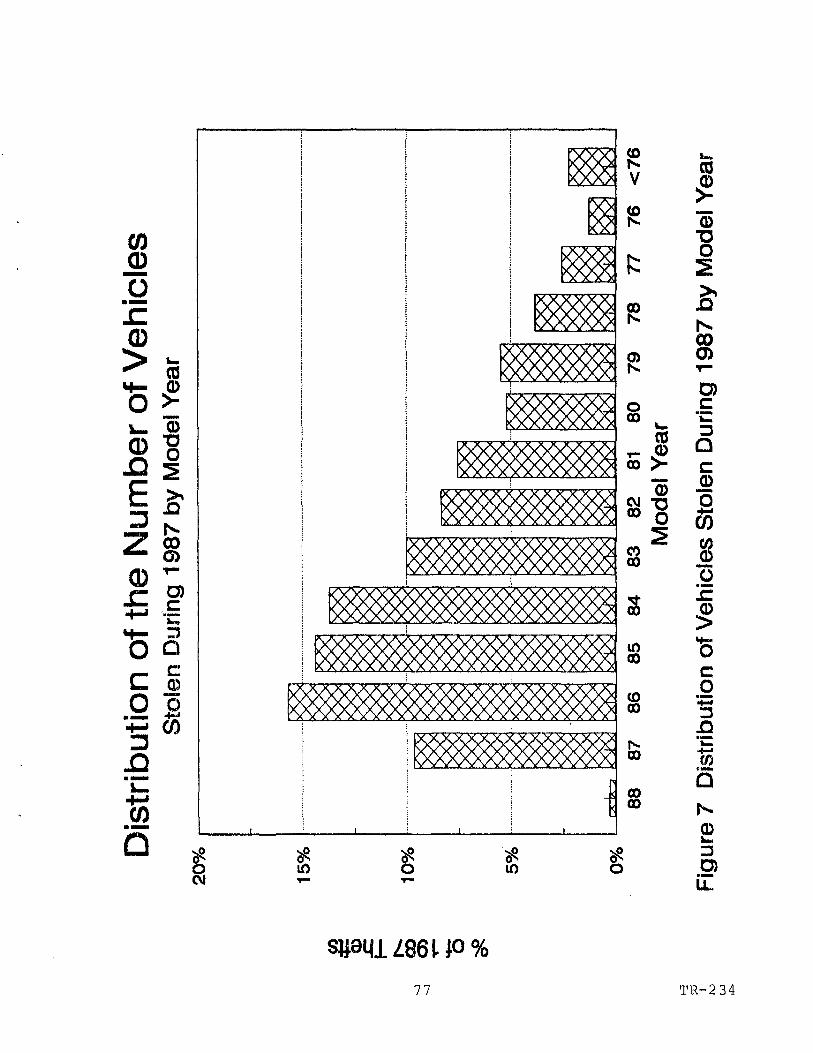
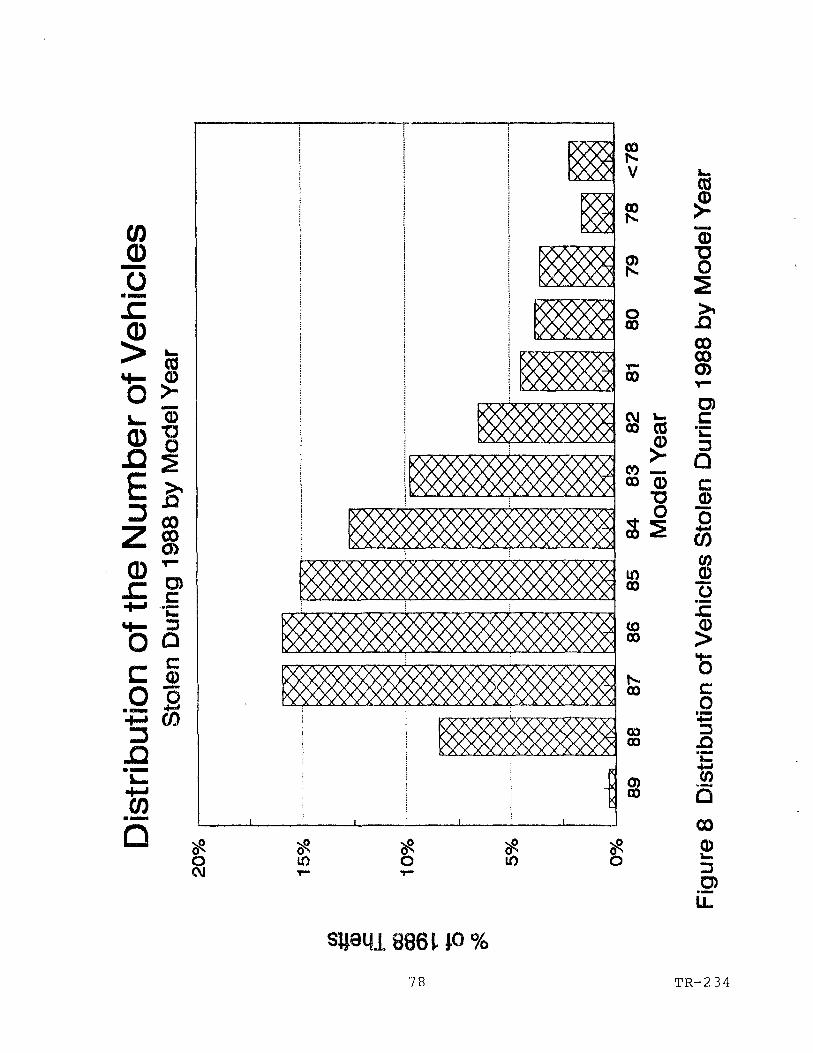
It should be noted that the proportion of annual thefts ofinsured vehicles by age is strongly related to the distribution oftheft policies written by vehicle age (exposure). For example, asa vehicle ages, it is less likely that policyholders retainautomobile comprehensive coverage (including theft coverage).Also, the distribution of policies by vehicle age will varysomewhat between companies.
6.3 Proportion of Automotive Theft Claims Without Payment
The detailed sample included claims for vehicle theftswhich were resolved without payments issued to the insured. Theseclaims might include instances in which the stolen vehicle wasrecovered and the damage sustained as a result of the theft wasless than the deductible value of the policy.
Thus, the distribution of theft claim values for this samplerepresents the entire spectrum of theft claim values. Thedistributions of claim values for thefts of current model year 1987and 1988 vehicles are shown in Figure 9. These distributionsreflect the value of the theft loss including deductible.
Figure 10 illustrates the distributions of theft claim valuesfor the 1987 and 1988 HLDI samples. These values also reflect thedollar value of the theft loss including deductible but excludeclaims in which the loss value was less than the deductible and nopayment was issued.
As might be expected, the distributions in Figure 9 are skewedtowards lower claim values relative to Figure 10. Figure 9indicates more claims were valued between $0-$500, than were valuedin any other cost range. Claims in this range comprised 21.6percent of the claims for stolen current model year 1987 passengercars and 2 0.4 percent of the claims for stolen current model year1988 passenger cars.
Claims in the $0-$500 range comprised only about 5 percent ofthe claims in the HLDI samples for 1987 and 1988. More claims inthese HLDI samples were valued in the $12,000-$16,000 cost rangethan in any other cost range.
A comparison of Figures 9 and 10 suggests the that for every100 paid claims in the HLDI sample, roughly another 2 0 claims werefiled with the participating insurers with actual claim valuesunder $500.
6.4 Recoveries Prior to Settlement
The individual insurer claim sample identified _thesettlement date of each claim. This information made it possibleto identify claim payments for vehicles recovered prior tosettlement.
79 TR-234
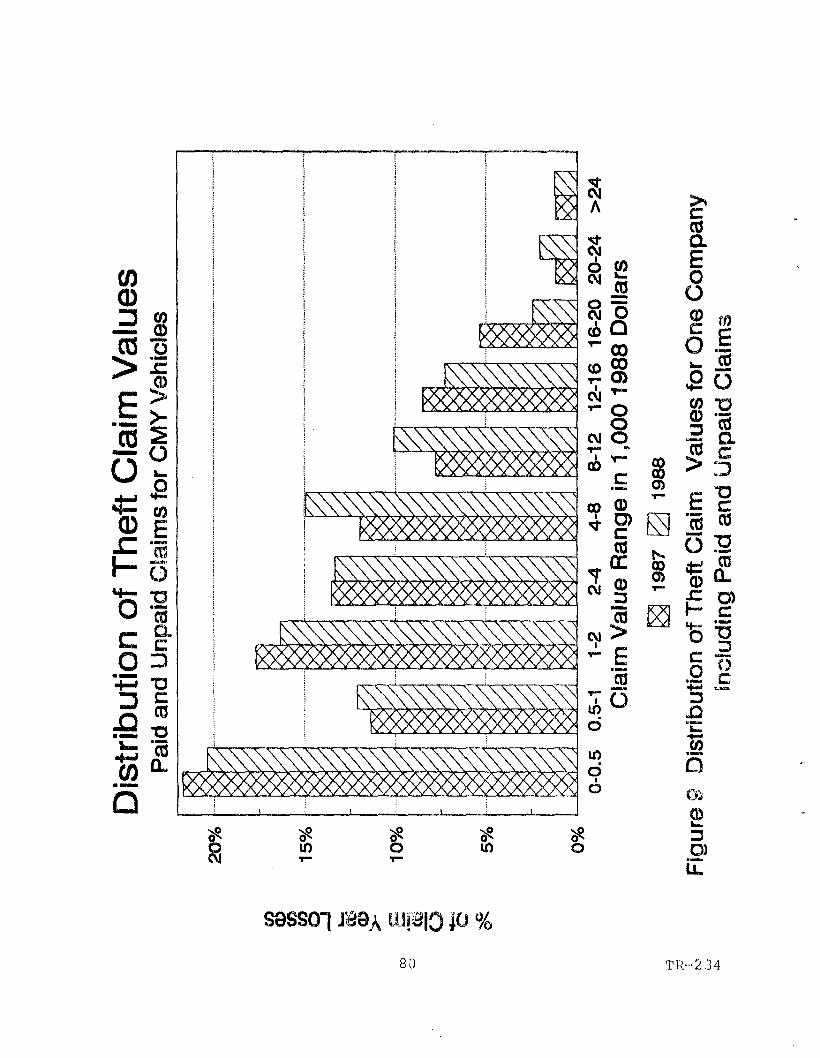
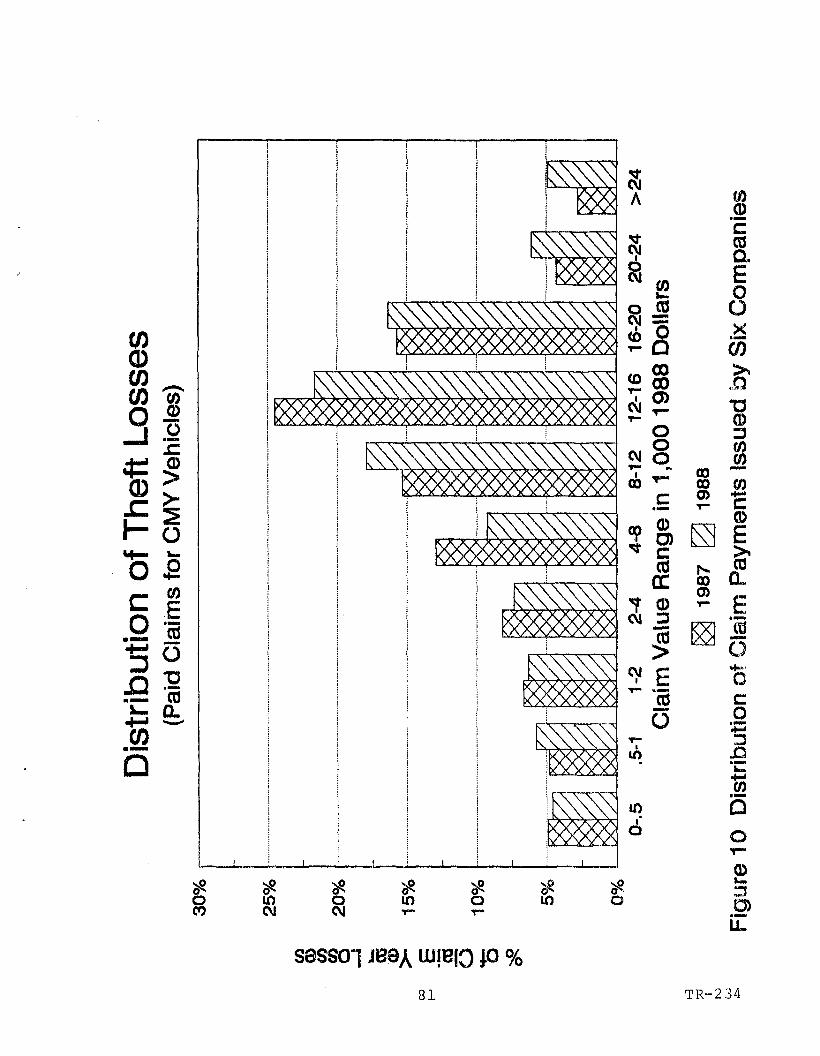
Figure 11 presents the distribution of recoveries over timefor current model year 1987 and 1988 vehicles recovered prior tosettlement. Figure 11 indicates that approximately 95 percent ofall recoveries prior to settlement occurred within 3 0 days of thetheft. This was consistent with the practice of the insurer tosettle theft claims within 3 0 days. A similar proportion was alsoobserved for 1985 and 1986 (9_) .
The claim data also indicates that 50 percent of therecoveries in 1987 and 3 6 percent of the recoveries in 1988 ofcurrent model year vehicles occurred prior to settlement of theclaim. If the Theft Prevention Standard met its goal ofencouraging a reduction in the number of vehicles stolen for exportor parts, it might be expected that the proportion of theftsattributable to joyriding would be increasing. Since joyriderstend to abandon vehicles after a relatively short period, it wouldbe expected that an increase in the proportion of thefts forjoyriding would be accompanied by an increase in the proportion ofrecovered vehicles found prior to claim settlement (assuming lawenforcement efforts and other factors remained the same). Sincethe opposite of this trend appears to be occurring (i.e. theproportion of recoveries occurring prior to settlement appears tobe decreasing), there is no evidence to suggest that the standardis effective by this criteria.
Figure 12 indicates the distribution of average payments overtime for 1987 and 1988 current model year cars recovered prior tosettlement. This figure indicates that settlements made after 3 0days were substantially more expensive than settlements prior to3 0 days for vehicles recovered prior to the settlement date.
Payments for these claims averaged:
• $2,964 in 1987 and $3,539 in 1988 for CMY vehiclesrecovered between 10 and 29 days after the theft
• $7,212 in 1987 and $5,538 in 1988 for CMY vehiclesrecovered between 3 0 and 89 days after the theft.
These costs are expressed in 1988 dollars.
An analysis of the claim sample indicated that the cost torepair a CMY vehicle recovered prior to settlement to its pre-theftstate or consider the damage as a total loss averaged $4,400 in1987 and $3,435 in 1988. These values are expressed in 1988dollars. These figures suggest that stolen vehicles recovered,prior to settlement sustained less damage as a result of theft in1988 than in 1987. This trend is consistent with the goals of theTheft Prevention Standard.
82 TR-2 3 4

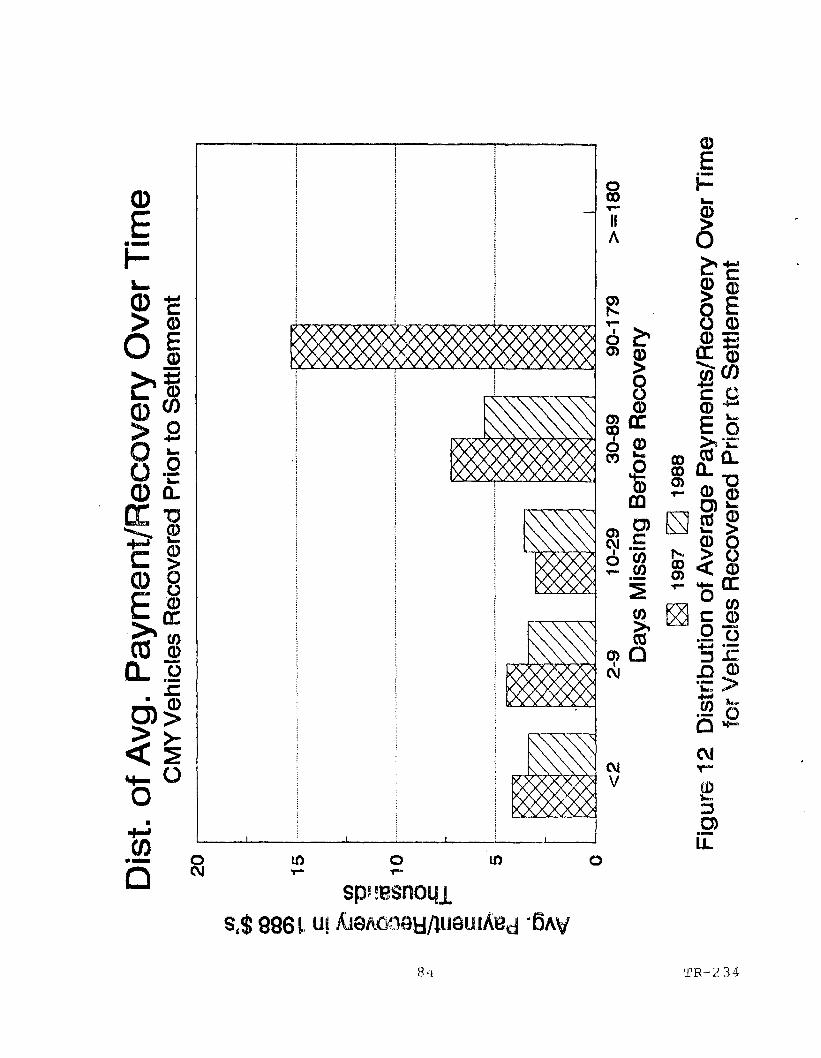
6.5 Implications of Theft Claim Characteristics on NHTSA• Evaluation of Theft Act
The investigation of the insurer claim sample identifiedseveral results that are of specific interest to the NHTSAevaluation effort. These include:
1) The NHTSA analysis must focus heavily on current modelyear vehicles since it is primarily vehicles in this agegroup which may be equipped with VIN labelling in the 1987analysis sample. It is estimated that current model yearvehicles accounted for approximately 9 percent of theinsured vehicles stolen during 1987 (Figure 7) and 8percent of the vehicles stolen during 1988 (Figure 8) .For 1988, the analysis may consider one year 1987 vehiclesas well since some of these cars are marked. One year old1987 vehicles comprised 16 percent of the insured vehiclesstolen during 1988.
2) Unlike the HLDI sample, the insurer's claim recordsincluded claims which were settled without payments beingissued to the policyholder. These claims includedinstances in which a stolen vehicle was recovered priorto settlement with damage valued below the policydeductible. Based on this information, it is estimatedthat for every 100 paid claims in the HLDI sample, thereexist an additional 20 claims valued under $500 for whichno payments were issued (Figures 9 and 10). The absenceof these claims from the HLDI sample implies that thesample understates policyholder costs of automotive theft.Including the effects of these missing claims wouldsubstantially lower the average HLDI costs for cars whichwere recovered intact.
3) A smaller proportion of recovered vehicles were foundprior to settlement in 1988 than in 1987. This helps toexplain the increase in average theft claim paymentsbetween 1987 and 1988 observed in Section 4.2.1. Thedecrease in the proportion of vehicles recovered prior tosettlement is not consistent with the expectation that theTheft Prevention Standard would reduce,the proportion ofthefts by professional thieves thereby increasing theproportion of thefts for joyriding independent of otherfactors. However, those vehicles which were recoveredprior to settlement appeared to be sustaining less damagein 1988 than in 1987. Thus, the proportion of thefts forjoyriding may be increasing for instances where thevehicle is recovered prior to settlement but does notappear to be increasing overall. As in all cases, theseresults must be qualified by the limited claim experienceavailable since introduction of the marking program.
85 . TR-2 3 4
7. CONCLUSIONS
Motor vehicle theft is a worsening problem for the insuranceindustry and its policyholders. Between 1983 and 1988, theft ratesfor insured current model year (CMY) motor vehicles, grew from 2.88to 4.38 thefts per 1000 insured vehicle years. This has increasedinsurance company losses due to motor vehicle theft. Between 1983and 1988, insurers1 expected cost of CMY vehicle theft grew 41percent from $35.46 to $50.08 per insured vehicle year.
An analysis of theft rates suggests that the labelling ofparts on selected high theft passenger cars may be beginning todiscourage thefts of these vehicles. During the first year of themarking program, theft rates for marked and unmarked insuredvehicles continued to increase almost equally. However, during thesecond year of the program, the theft rate for marked cars actuallydecreased from 6.06 to 5.21 thefts per 1000 insured vehicle years.At the same time, the theft rate for unmarked cars increasedslightly from 3.7 to 3.84 thefts per 1000 insured vehicle years.
As a result, over the two years since the introduction of themarking program, theft rate increases were significantly lower formarked vehicles than for unmarked vehicles. This was primarily dueto the decrease in theft rates observed for marked vehicles between1987 and 1988.
Although the reduction in theft rates for marked vehicles islimited to a single year, it suggests that the marking program maybe beginning to influence the rate of theft of marked vehicles.Additional experience with the marking program will be necessaryto confirm this.
Additional investigations of insurance data did not produceany other evidence that the marking program specifically benefittedmarked insured vehicles. For example:
• There was no indication that the marking program influencedany change in the rate of recovery of marked vehicles.Although lines which were marked exhibited an 11 percentincrease in recoveries relative to their unmarkedancestors, exactly the same increase was observed over thesame time frame for lines excluded from the markingprogram. In addition, the recovery rate for unmarkedmulti-purpose vehicles and light trucks appears to begrowing faster than the recovery rate for either marked orunmarked passenger cars.
• Insurer losses for marked vehicles continued to increaseafter the marking program began. In fact, expected theftclaim costs per insured vehicle year increased faster formarked vehicles than for unmarked vehicles. This occurredeven though the rate of theft did not increase as fast for
86 TR-234
marked vehicles as it did for unmarked vehicles. Between1983-1986 and 1987-1988, theft costs per insured vehicleyear increased $20.40 for marked cars, $17.47 for unmarkedcars and only $11.44 for vehicles with anti-theft devices.This appeared to result from the fact that average claimcosts for stolen marked vehicles increased by $128 whileaverage claim costs for unmarked vehicles decreased by $709after the start of the marking program.
• There was no statistically significant change in the valueof payments for claims with stolen major parts after theseparts were marked. Such a change might be expected tooccur if thieves began to steal fewer marked parts afterthe marking program began.
• A review of insurer rate filings in several states did notproduce any evidence that the marking program has as yetbeen taken into account in the rating of automobilecomprehensive coverage.
Although some results were observed which were consistent withthe goals of the Theft Prevention Standard, it did not appear asthough the marking program itself was responsible for theseresults. For example:
• The maximum proportion of car thefts that might befraudulent or lead to export or dismantling for partsappeared to diminish significantly (8-10 percent) over thetwo-year period since the introduction of the markingprogram. However, unmarked CMY cars appeared to haveexperienced a larger decrease in this measure than markedCMY cars. Also, the same decreases were observed for oldervehicles as for CMY vehicles. None of the older vehicleshad marked parts.
• Average claim costs for recovered vehicles decreasedsignificantly after the marking program began. This resultmight be expected if the program reduced the extent ofprofessional thefts thereby increasing the proportion ofthefts for joyriding or other purposes. However, whileaverage theft claim costs for recovered CMY marked vehiclesdecreased by $643 after the marking program began, claimcosts for unmarked vehicles were reduced even further,decreasing by $977. Both of these changes were found tobe statistically significant. Also, the same decreasesobserved for CMY marked vehicles were also observed for twoyear old unmarked vehicles.
Comparing results for marked and unmarked cars and carsequipped with anti-theft devices qualifying for exemptions from themarking program, it was found that:
87 TR-2 3 4

• Vehicles equipped with passive anti-theft devices exhibiteda more favorable trend in theft rates over the 1987-1988period than either marked or unmarked cars. Cars withanti-theft devices, exhibited uniform theft rates betweenthe pre-standard 1983-1986 period and post standard 1987-1988 period while theft rates increased significantly forboth marked and unmarked cars.
• While cars with anti-theft devices were less likely to bestolen than marked cars, if stolen, they were also lesslikely to be recovered and more expensive to replace. Thisis consistent with the expectation that determinedprofessional thieves steal these vehicles since othervehicles may be stolen with less effort.
To date, experience with the marking program is limited,Since the early evidence suggests that the program may be beginningto discourage thefts of marked vehicles, further investigation ofthe program over time is warranted.
88 l'R-23 4

REFERENCES
1. "Motor Vehicle Theft Law Enforcement Act of 1984", House ofRepresentatives Report 98-1087, Part I, 98th Congress, 2ndSession, Washington, D.C., September 1984.
2. "Vehicle Theft in 1988 Soars to 11.2 Percent", NationalUnderwriter, November 6, 1989, pg. 32.
3. "Report on Motor Vehicle Theft - Section 614 - Motor VehicleTheft Law Enforcement Act of 1984", U.S. Department ofTransportation, National Highway Traffic SafetyAdministration, Report P.L. 98-547, Washington, D.C., October1987.
4. "Vehicle Theft Prevention Standard and Selection of CoveredMajor Parts - Motor Vehicle Theft Law Enforcement Act of1984", Federal Register Vol. 50, No. 206, Washington, D.C.,October 24, 1985, pp. 43166-43192.
5. "Procedures for Selecting Lines to be Covered by the TheftPrevention Standard", Federal Register (50 FR 34831),Washington, D.C., August 28, 1985.
6. "Motor Vehicle Theft Prevention; Insurer ReportingRequirements", Federal Register Vol. 52, No. 1, Washington,D.C., January 2, 1987, pp. 59-79.
7. A.M. Best Company, Inc. Market shares compiled for 1984.
8. "Evaluation Plan for Federal Motor Vehicle Safety Standard2 08 - Occupant Crash Protection" - NHTSA Pub. No. DOT-HS805066, October 1979, pg. 92-94.
9. "Analysis of Insurance Premiums and Payouts for 1983-1986Designated High Theft Rate Passenger Cars", Final ReportPrepared by KLD Associates, Inc. under NHTSA Contract DTNH22-87-C-06000, April 1989.
10. "Analysis of Insurance Premiums and Payouts for 1983-1984Designated High Theft Rate Passenger Cars", Final ReportPrepared by KLD Associates, Inc. under NHTSA Contract DTNH2 2-86-C-06030, August 1988.
11. "Analysis of Insurer Reports Received Pursuant to Section 612of the Motor Vehicle Theft Law Enforcement Act of 1984", FinalReport Prepared by KLD Associates, Inc. under NHTSA ContractDTNH22-88-C-02024, October 1989.
12. "State and Metropolitan Area Data Book 1986", Bureau of theCensus.
89 TR-234