Embed Size (px)
Citation preview
Analysis of Gate-waiting Delays at Major US Airports
Jianfeng Wang∗, John F. Shortle†, Juan Wang‡, Lance Sherry§
Center for Air Transportation Systems Research, George Mason University, Fairfax, VA, 22030, USA
Airport gates are one of the congestion points of the air transportation system. Whenan arriving flight lands on a runway, it is possible that it cannot pull into its gate. Wedefine this phenomenon as gate-waiting delay. This paper analyzes the degree to whichgate waiting is a problem and the functional causes of gate waiting. Analysis of flightperformance data for the OEP 35 airportsa for the summer of 2007 identified that: (i)Significant gate-waiting delays, in which more than 30% of arriving aircraft are delayed,occurred at 10 of the OEP 35 airports, (ii) major gate-waiting delays are rare events (e.g.,once a month at ATL), (iii) Gate-waiting delays are usually different among major carriersdue to different scheduling strategies. For example, Delta schedules more aggressivelyon their gate capacity (overscheduling) than JetBlue at JFK. (iv) Functional origins ofgate-waiting delay included compressed arrivals, extended gate occupancy times, reducednumber of gates, and inflexible queueing disciplines (across carriers and within one carrier).Many of these origins are related to schedule disruptions which are the main common factoridentified in the worst days. The methodology for analysis, the results, and the implicationsof these results are discussed.
I. Introduction
The objective of this paper is to evaluate the degree to which airport gates are a limiting resource in theflow of airplanes arriving to and departing from an airport. As an airplane arrives to and departs from anairport, it passes through several potential choke points. These include runways, taxiways, ramps, gates, andso forth. Depending on the demand and number of resources, different points in this process may becomeconstrained and act as choke points.
The runways (and associated constraints) are usually the limiting resource in the flow through the airport.This is because various separation requirements limit the maximum number of operations that can be safelyhandled in a given time interval. Once an airplane has landed and has taxied to its gate, it can often pulldirectly into the gate. But if the gate is unavailable, the arriving aircraft may have to wait. If the expectedwaiting time is long, the aircraft may be sent to a “penalty box” until a suitable gate becomes available(Figure 1).
While gates are not usually thought of as a choke point, this paper aims to evaluate the extent to whichthis can be the case. Conditions under which gates act as a limiting resource may increase over time ifcapacity is added to other parts of the system (say, through increased capabilities proposed in NextGen)without an appropriate analysis of the matching gate capacity.
At a high level, we can view this problem from the perspective of queueing theory.2 Delays are funda-mentally related to one of several issues: (a) higher scheduled demand than capacity or over-scheduling (b) alarger arrival rate than scheduled, (c) a lower service rate than scheduled, or (d) a smaller number of serversthan scheduled. In the context of this paper, the gates are the servers and the service rate is the rate thataircraft can be turned at the gate. For example, if an aircraft has a longer turnaround time than scheduled,this is effectively a reduction in the service rate of the gate. For a queueing system operating near capacity,
∗PhD student, Systems Engineering and Operations Research Department; Research Assistant, Center for Air TransportationSystems Research (CATSR), member
†Associate Professor, Systems Engineering and Operations Research Department Department, non-member‡Master student, Statistics Department; Research Assistant, CATSR, non-member§Executive Director, CATSR; Associate Professor, Research, Systems Engineering and Operations Research Department,
memberacommercial U.S. airports with significant activity1
1 of 20
American Institute of Aeronautics and Astronautics
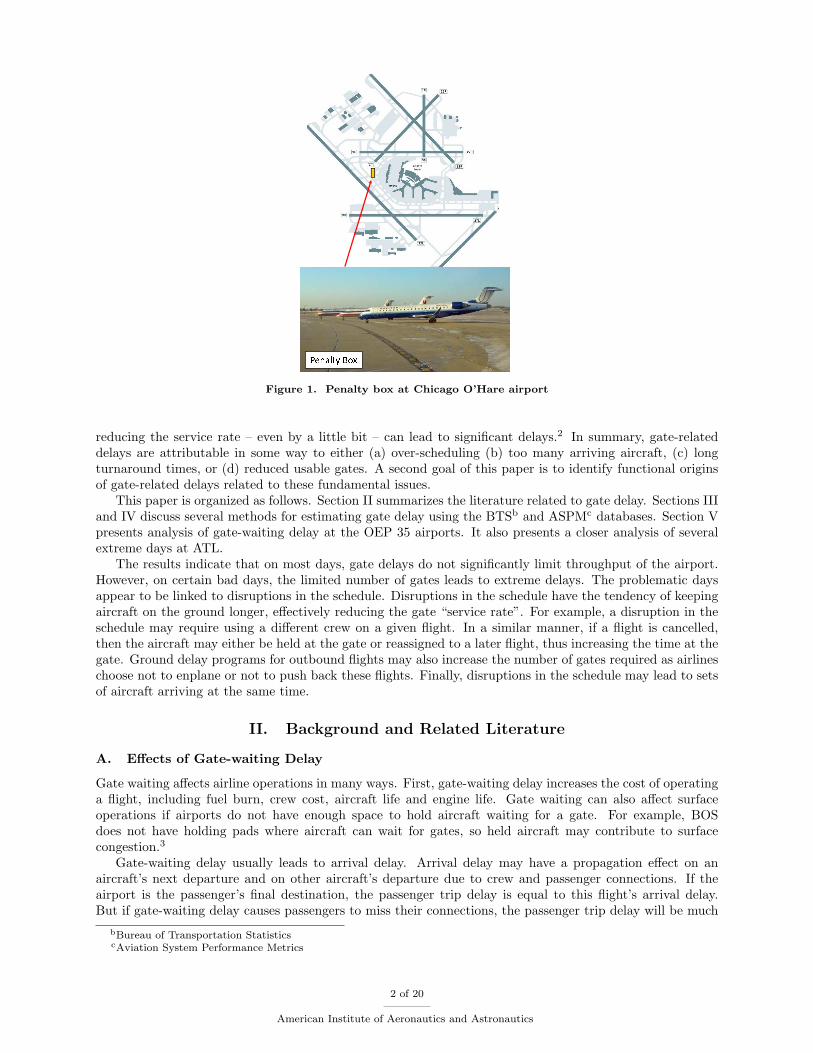
������� ��Figure 1. Penalty box at Chicago O’Hare airport
reducing the service rate – even by a little bit – can lead to significant delays.2 In summary, gate-relateddelays are attributable in some way to either (a) over-scheduling (b) too many arriving aircraft, (c) longturnaround times, or (d) reduced usable gates. A second goal of this paper is to identify functional originsof gate-related delays related to these fundamental issues.
This paper is organized as follows. Section II summarizes the literature related to gate delay. Sections IIIand IV discuss several methods for estimating gate delay using the BTSb and ASPMc databases. Section Vpresents analysis of gate-waiting delay at the OEP 35 airports. It also presents a closer analysis of severalextreme days at ATL.
The results indicate that on most days, gate delays do not significantly limit throughput of the airport.However, on certain bad days, the limited number of gates leads to extreme delays. The problematic daysappear to be linked to disruptions in the schedule. Disruptions in the schedule have the tendency of keepingaircraft on the ground longer, effectively reducing the gate “service rate”. For example, a disruption in theschedule may require using a different crew on a given flight. In a similar manner, if a flight is cancelled,then the aircraft may either be held at the gate or reassigned to a later flight, thus increasing the time at thegate. Ground delay programs for outbound flights may also increase the number of gates required as airlineschoose not to enplane or not to push back these flights. Finally, disruptions in the schedule may lead to setsof aircraft arriving at the same time.
II. Background and Related Literature
A. Effects of Gate-waiting Delay
Gate waiting affects airline operations in many ways. First, gate-waiting delay increases the cost of operatinga flight, including fuel burn, crew cost, aircraft life and engine life. Gate waiting can also affect surfaceoperations if airports do not have enough space to hold aircraft waiting for a gate. For example, BOSdoes not have holding pads where aircraft can wait for gates, so held aircraft may contribute to surfacecongestion.3
Gate-waiting delay usually leads to arrival delay. Arrival delay may have a propagation effect on anaircraft’s next departure and on other aircraft’s departure due to crew and passenger connections. If theairport is the passenger’s final destination, the passenger trip delay is equal to this flight’s arrival delay.But if gate-waiting delay causes passengers to miss their connections, the passenger trip delay will be much
bBureau of Transportation StatisticscAviation System Performance Metrics
2 of 20
American Institute of Aeronautics and Astronautics
higher than the gate-waiting delay.4
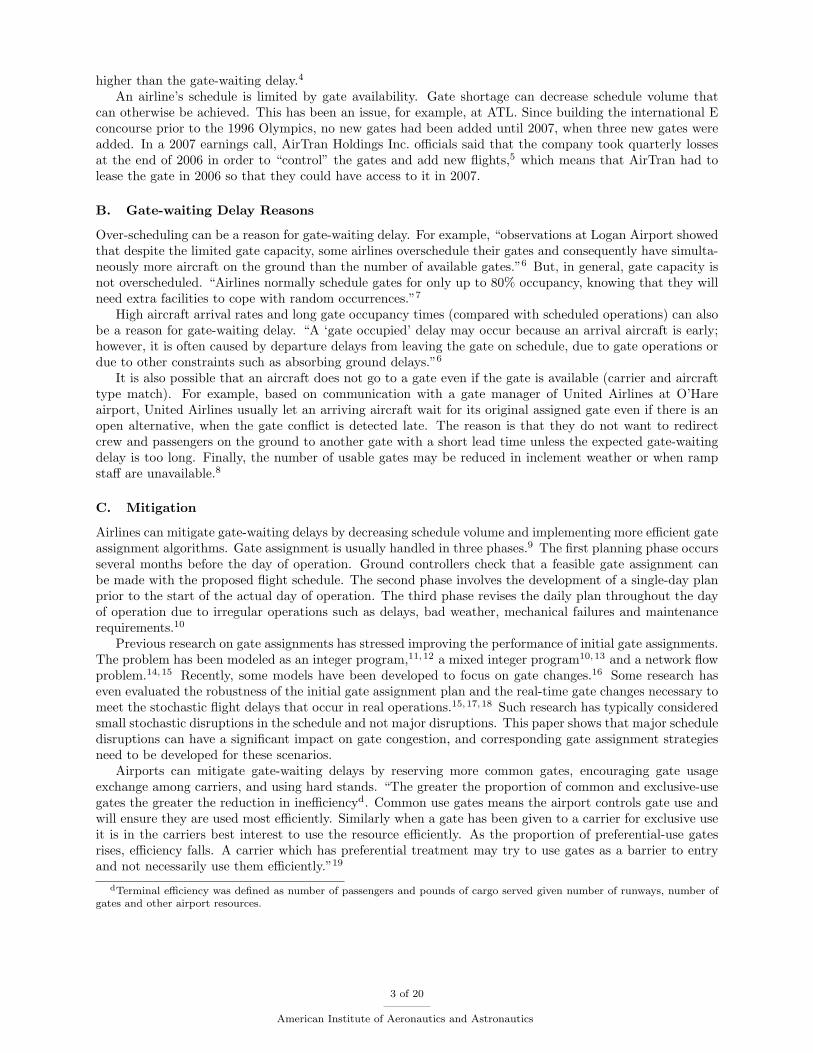
An airline’s schedule is limited by gate availability. Gate shortage can decrease schedule volume thatcan otherwise be achieved. This has been an issue, for example, at ATL. Since building the international Econcourse prior to the 1996 Olympics, no new gates had been added until 2007, when three new gates wereadded. In a 2007 earnings call, AirTran Holdings Inc. officials said that the company took quarterly lossesat the end of 2006 in order to “control” the gates and add new flights,5 which means that AirTran had tolease the gate in 2006 so that they could have access to it in 2007.
B. Gate-waiting Delay Reasons
Over-scheduling can be a reason for gate-waiting delay. For example, “observations at Logan Airport showedthat despite the limited gate capacity, some airlines overschedule their gates and consequently have simulta-neously more aircraft on the ground than the number of available gates.”6 But, in general, gate capacity isnot overscheduled. “Airlines normally schedule gates for only up to 80% occupancy, knowing that they willneed extra facilities to cope with random occurrences.”7
High aircraft arrival rates and long gate occupancy times (compared with scheduled operations) can alsobe a reason for gate-waiting delay. “A ‘gate occupied’ delay may occur because an arrival aircraft is early;however, it is often caused by departure delays from leaving the gate on schedule, due to gate operations ordue to other constraints such as absorbing ground delays.”6
It is also possible that an aircraft does not go to a gate even if the gate is available (carrier and aircrafttype match). For example, based on communication with a gate manager of United Airlines at O’Hareairport, United Airlines usually let an arriving aircraft wait for its original assigned gate even if there is anopen alternative, when the gate conflict is detected late. The reason is that they do not want to redirectcrew and passengers on the ground to another gate with a short lead time unless the expected gate-waitingdelay is too long. Finally, the number of usable gates may be reduced in inclement weather or when rampstaff are unavailable.8
C. Mitigation
Airlines can mitigate gate-waiting delays by decreasing schedule volume and implementing more efficient gateassignment algorithms. Gate assignment is usually handled in three phases.9 The first planning phase occursseveral months before the day of operation. Ground controllers check that a feasible gate assignment canbe made with the proposed flight schedule. The second phase involves the development of a single-day planprior to the start of the actual day of operation. The third phase revises the daily plan throughout the dayof operation due to irregular operations such as delays, bad weather, mechanical failures and maintenancerequirements.10
Previous research on gate assignments has stressed improving the performance of initial gate assignments.The problem has been modeled as an integer program,11,12 a mixed integer program10,13 and a network flowproblem.14,15 Recently, some models have been developed to focus on gate changes.16 Some research haseven evaluated the robustness of the initial gate assignment plan and the real-time gate changes necessary tomeet the stochastic flight delays that occur in real operations.15,17,18 Such research has typically consideredsmall stochastic disruptions in the schedule and not major disruptions. This paper shows that major scheduledisruptions can have a significant impact on gate congestion, and corresponding gate assignment strategiesneed to be developed for these scenarios.
Airports can mitigate gate-waiting delays by reserving more common gates, encouraging gate usageexchange among carriers, and using hard stands. “The greater the proportion of common and exclusive-usegates the greater the reduction in inefficiencyd. Common use gates means the airport controls gate use andwill ensure they are used most efficiently. Similarly when a gate has been given to a carrier for exclusive useit is in the carriers best interest to use the resource efficiently. As the proportion of preferential-use gatesrises, efficiency falls. A carrier which has preferential treatment may try to use gates as a barrier to entryand not necessarily use them efficiently.”19
dTerminal efficiency was defined as number of passengers and pounds of cargo served given number of runways, number ofgates and other airport resources.
3 of 20
American Institute of Aeronautics and Astronautics
D. Modeling of the Taxi-in and Turnaround Processes
Queueing models and integer programming models have been used to model the taxi-in process.3,20,21 Theminimum service time under ideal turnaround operations has also been modeled.22 But the impact ofschedule disruptions on turnaround operations has not been studied thoroughly. Modeling turnaround timesin irregular operations could lead to a better understanding of gate utilization.
More accurate departure demand prediction is another potential benefic of improved ground-operationsmodeling. Departure demand is based on the push-back time, which is determined by gate arrival time,the turnaround time, and the schedule. Departure demand prediction is important to air traffic controllersfor runway and taxiway scheduling. But it has been found that the prediction of departure demand isnot accurate because the turnaround time can not be predicted well.6 Also, a gate shortage can result inpushing aircraft back from the gate, even though the downstream departure runway is a constraint.6 Thishas implications on matching the runway and gate capacity under disruption scenarios. If departure runwaycapacity drops while arrival runway capacity remains the same, gate demand is higher because holding atthe gate is preferred.
III. Data Sources
Gate-waiting delay is not recorded in actual operations and thus is not directly available in any database.In particular, although several databases record the taxi-in time of individual flights, they do not break thistime into its component parts, such as the delay specifically due to waiting for a gate. Thus, gate-waitingdelay must be inferred or approximated using other information available. This section discusses severaldata sources – in particular, the BTS and ASPM databases – and associated fields that can be used to inferor approximate gate-waiting delay. The precise algorithms used to estimate gate-waiting delay are discussedin Section IV.
A. BTS Airline On-Time Performance Database
This database is maintained by BTS, part of DOTe. This database has only one table, On-Time Performance.This table contains on-time arrival data for non-stop domestic flights by major air carriers and provides suchadditional items as departure and arrival delays, origin and destination airports, flight numbers, scheduledand actual departure and arrival times, cancelled or diverted flights, taxi-out and taxi-in times, air times,and non-stop distances.23 Key fields in this table are flight date, destination airport, carrier, scheduledarrival time, “wheels-on” time (the time that an aircraft lands on the runway, see24 for a precise definition),“gate-in” time (the time that an aircraft pulls into a gate), “gate-out” time (the time that an aircraft pushesback from a gate), and “taxi-in” time (the difference between “wheels-on” time and “gate-in” time).
B. ASPM Database
The ASPM database is maintained by the FAAf. Two tables used in this paper are the “taxi time” tableand the “individual flight” table. Key fields are the “wheels-on” time (the time that an aircraft lands on therunway), the “gate-in” time (the time that an aircraft pulls into a gate), the actual taxi-in time, the taxi-indelay, and the unimpeded taxi-in time. Other key fields are airport, carrier code, and season. The actualtaxi-in time is the gate-in time minus the wheels-on time. The taxi-in delay is actual taxi-in time minusthe unimpeded taxi-in time. The unimpeded taxi-in time is an estimated value using a regression model.25
It represents the time it would take for an aircraft to taxi in the absence of delay-causing factors such ascongestion or weather.26 The unimpeded taxi-in time is broken down by calendar year, by season, by carrier,and by airport (for all carriers and airports reporting in the ASQP and Aeronautical Radio, Incorporated[ARINC] data). In 2001, there were 14 reporting carriers and about 300 reporting airports.
C. Comparison of BTS and ASPM Database
Key differences between the ASPM and BTS databases are the following23,26 (see also Table 1):
eUnited States Department of TransportationfFederal Aviation Administration
4 of 20
American Institute of Aeronautics and Astronautics
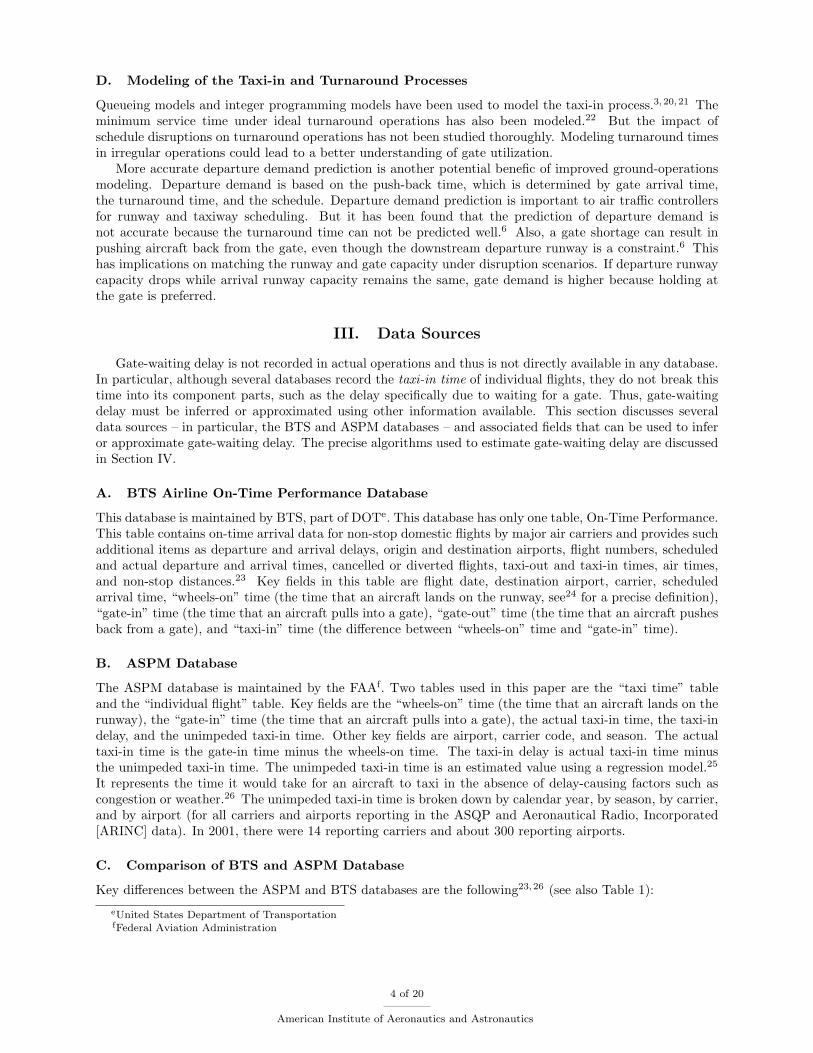
• BTS includes data for air carriers that have at least one percent of total domestic scheduled-servicepassenger revenues (20 carriers); ASPM includes data for all carriers.
• BTS includes data for operations to and from airports that account for at least one percent of thenation’s total domestic scheduled-service passenger enplanements (32 airports); ASPM includes datafor 77 airports.
• BTS includes cancelled flights; ASPM does not.
• BTS does not include international flights; ASPM does. (BTS covers nonstop scheduled-service flightsbetween points within the United States, including territories.)
• BTS does not include information regarding aircraft type; ASPM does.
• BTS contains the tail number of flights; ASPM only contains the tail number of flights that are alsoin BTS.
Table 1. Coverage of BTS and ASPM databases
BTS ASPMCarrier 20 US major AllAirport 32 US major 77Cancelled flights Yes NoInternational flights No YesAircraft type No YesTail number Yes BTS Flights Only
Table 2 shows the number of flights recorded in the data sources for two example days at two airports. Inboth days, ASPM records more flights than BTS, due to the inclusion of international flights. Also, the gapbetween ASPM and BTS is larger for JFK than for ATL, since JFK has a higher percentage of internationalflights. As a reference, the third line gives the average number of daily flights for each airport (averagedover one year, 2007) obtained from Airport Council International. The last line shows the number of flightsobserved from the public website www.flightstats.com.
Table 2. Flights recorded in various data sources
ATL JFKSource 6/5/07 7/3/07BTS 2239 675ASPM 2690 1175Average Daily Flights (ACI) 2724 1223Flightstats.com 2794 1324
D. Other Data Sources
To get the number of gates and their users, this paper uses information from each airport’s website, aswell as the public website www.flightstats.com. This site provides flight information by airport and day,including the flight’s final gate assignment, flight number, arrival time, departure time, carrier, and aircrafttype. For example, we found that 179 different gates were used at ATL on June 11, 2007. We use this valueas an estimate of the number of gates at ATL in the summer of 2007. This paper also uses a Sensis AerobahnTaxiView surface movement video of JFK as a validation check of the algorithms.
In this paper, we ignore issues associated with aircraft type, where a gate is compatible with only acertain type of aircraft, and an aircraft occupying a gate may block its adjacent gates from being used.
5 of 20
American Institute of Aeronautics and Astronautics
IV. Methods
A. Modeling of Taxi-in Process and Gate-occupancy Process
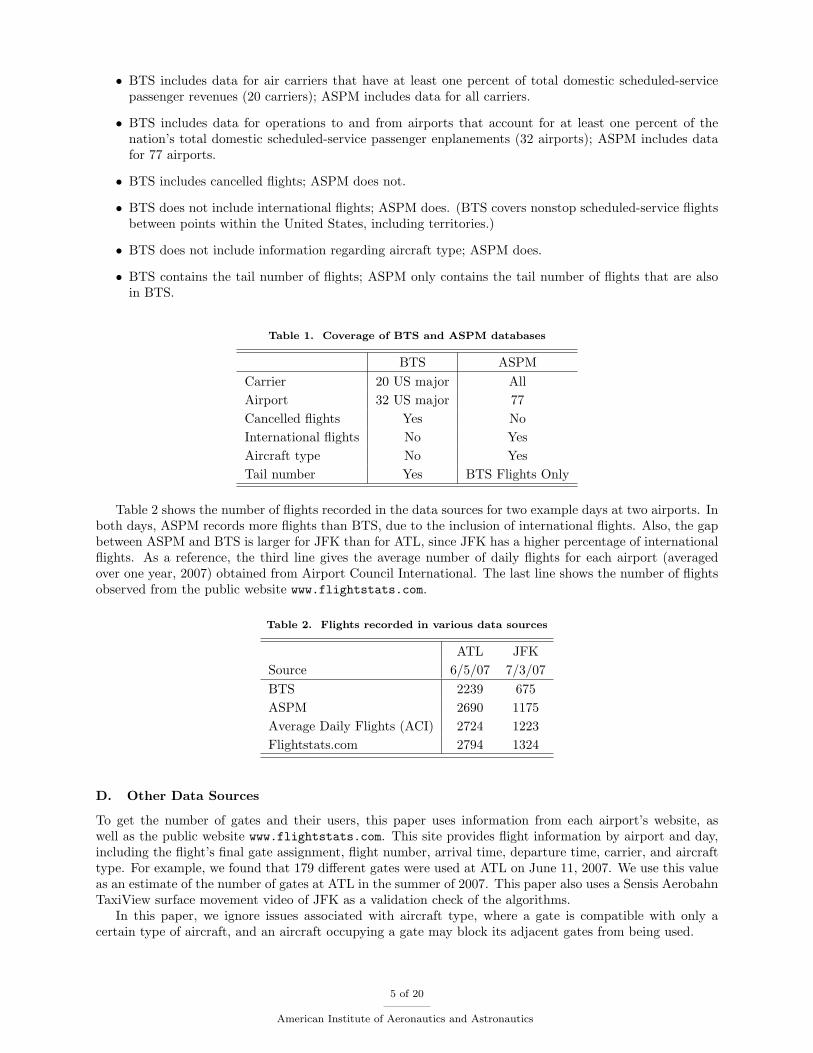
Figure 2 shows a realization of the actual taxi-in process and gate-occupancy process.
Wheels-on time Gate-out timeGate-in time
Unimpeded taxi in on taxiway and
ramp
Positioning in time
Scheduled gate occupancy time
Positioning out time
Possible non-gate
delay
Possible gate-
waiting delay
Possible gate occupancy
delayTaxi-in delayUnimpeded taxi-in time
Taxi-in time Gate-occupancy time
Figure 2. Taxi-in and gate-occupancy process
The taxi-in time includes the unimpeded taxi-in time and the taxi-in delays. These delays may be gaterelated or non-gate related (e.g., due to taxiway congestion). Note that the unimpeded taxi-in time (whichis from wheels “on” to gate “in”) includes the positioning-in time, the time to position an aircraft into thegate. The actual gate-occupancy time includes scheduled gate-occupancy time and possible gate-occupancydelay. We allow for the gate-occupancy delay to be negative in the case that a late arriving flight leaves ontime and thus absorbs delay.27 A summary of the parameters and their sources in figure 2 are shown intable 3.
Table 3. Required parameters and data sources
Parameter SourceTaxi-in time Database field in BTS and ASPMUnimpeded taxi-in time Database field in ASPM estimated via a regression model25
Gate-occupancy time Pairing algorithm using BTS databasePositioning time Deterministic value (estimate)Gate-waiting delay Calculated via equation (2) (explained later)
B. Method 1: Estimation and Validation of Gate-waiting Delay
This section describes several methods to infer gate-waiting delays based on information in the ASPM andBTS databases. We also describe a method to estimate gate-occupancy time by tracking the tail number ofaircraft.
Gate-waiting delay is the difference between taxi-in delay and non-gate delay.
Gate-waiting delay = taxi-in delay− non-gate delay (1)
However, no existing database contains the non-gate taxi-in delay, so it must be estimated. Based oninterviews with United Airlines’ airport managers, airport surface traffic is the main cause of non-gate delay,and this delay is usually smaller than 5 minutes. As a default, this paper assumes that up to 5 minutes oftaxi-in delay is unrelated to gate delay; the remaining taxi-in delay is the estimation of gate-waiting delay.That is,
Gate-waiting delay ≈ max(Taxi-in delay− 5 min, 0). (2)
The maximum function ensures that the estimated delay is non-negative. For example, suppose that theunimpeded taxi-in time is 6 minutes. Then a 7 minute taxi-in time is estimated to contain 0 minutes of
6 of 20
American Institute of Aeronautics and Astronautics
gate-waiting delay, while a 12 minute taxi-in time is estimated to contain 1 minute of gate-waiting delay.The method is partially justified by research indicating that gate delays are the dominant contributor totaxi-in delays.3,28 We have also checked the accuracy of equation 2 for a few sample flights from the surfaceoperation video of JFK from Sensis Aerobahn TaxiView. From direct observation of the video, we identifiedthe amount of time that an aircraft is moving (unimpeded taxi in), standing temporarily in front of a runwayto cross or in front of another aircraft to move (taxi in delay due to traffic), and standing without any nearbyrunway or aircraft around it (gate-waiting delay). We observed the movements of two long taxi-in delayedflights and the estimation error was no more than 3 minutes. (One flight on 9/28/2008 was observed tohave 32 minutes of gate-waiting delay compared with the original estimate of 34.4 minutes; Another flighton 10/10/2008 was observed to have 15 minutes gate-waiting delay compared with the original estimate of16.4 minutes.)
Of course, this is an approximation, since the method assumes that non-gate-related delays comprise atmost 5 minutes of the total taxi-in delay. We perform some sensitivity analysis on this 5-minute threshold.The overall implication of the approximation is that the gate-delay statistic does not provide an exactmagnitude, but can be useful as a relative metric to identify qualitative trends. For example, the identificationof high-delay days appears to be insensitive to the exact value of the threshold (see figure 8 discussed later).
We now describe two specific methods for calculating gate-waiting delay from the ASPM and BTSdatabases and one method for calculating gate-occupancy time.
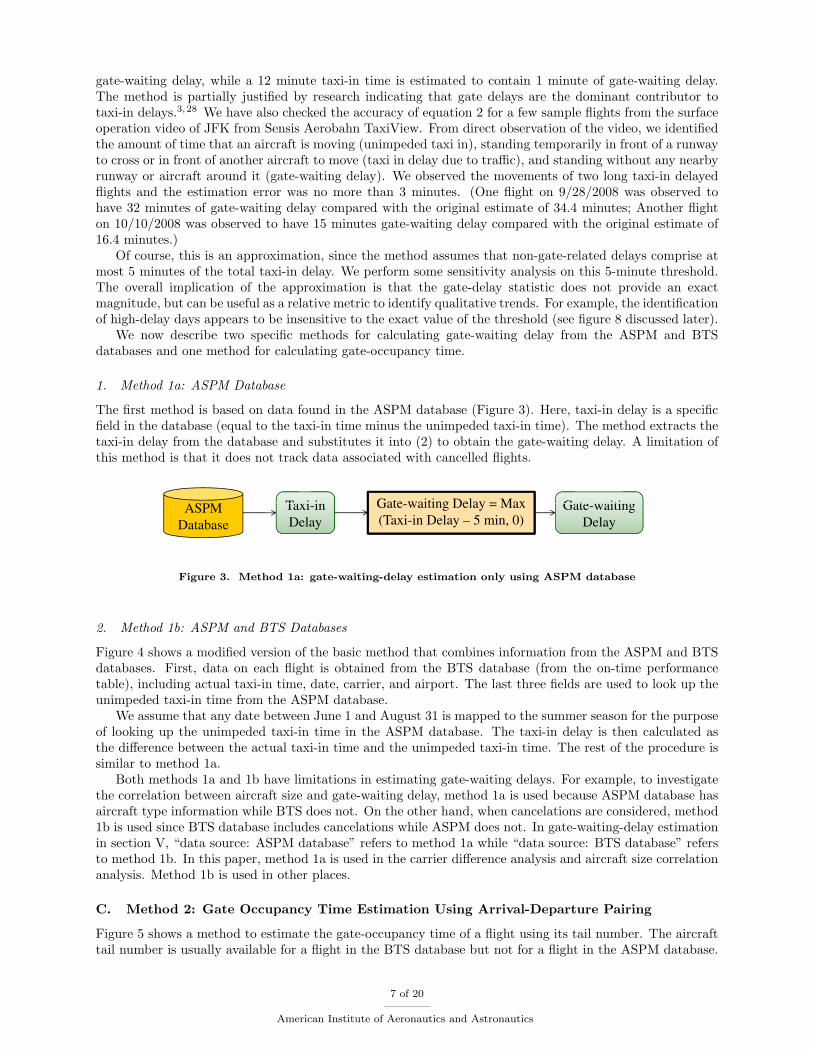
1. Method 1a: ASPM Database
The first method is based on data found in the ASPM database (Figure 3). Here, taxi-in delay is a specificfield in the database (equal to the taxi-in time minus the unimpeded taxi-in time). The method extracts thetaxi-in delay from the database and substitutes it into (2) to obtain the gate-waiting delay. A limitation ofthis method is that it does not track data associated with cancelled flights.
ASPM Taxi in Gate waiting Delay = Max Gate waitingASPM
Database
Taxi-in
Delay
Gate-waiting Delay = Max
(Taxi-in Delay – 5 min, 0)Gate-waiting
Delay
Figure 3. Method 1a: gate-waiting-delay estimation only using ASPM database
2. Method 1b: ASPM and BTS Databases
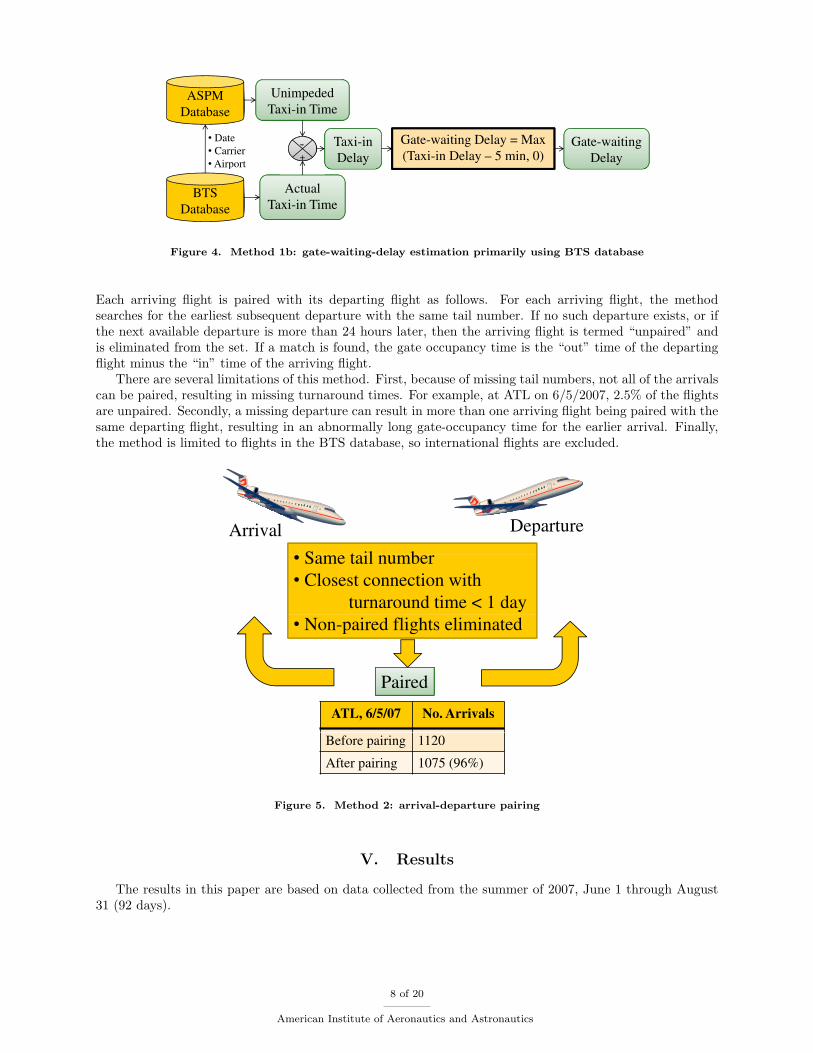
Figure 4 shows a modified version of the basic method that combines information from the ASPM and BTSdatabases. First, data on each flight is obtained from the BTS database (from the on-time performancetable), including actual taxi-in time, date, carrier, and airport. The last three fields are used to look up theunimpeded taxi-in time from the ASPM database.
We assume that any date between June 1 and August 31 is mapped to the summer season for the purposeof looking up the unimpeded taxi-in time in the ASPM database. The taxi-in delay is then calculated asthe difference between the actual taxi-in time and the unimpeded taxi-in time. The rest of the procedure issimilar to method 1a.
Both methods 1a and 1b have limitations in estimating gate-waiting delays. For example, to investigatethe correlation between aircraft size and gate-waiting delay, method 1a is used because ASPM database hasaircraft type information while BTS does not. On the other hand, when cancelations are considered, method1b is used since BTS database includes cancelations while ASPM does not. In gate-waiting-delay estimationin section V, “data source: ASPM database” refers to method 1a while “data source: BTS database” refersto method 1b. In this paper, method 1a is used in the carrier difference analysis and aircraft size correlationanalysis. Method 1b is used in other places.
C. Method 2: Gate Occupancy Time Estimation Using Arrival-Departure Pairing
Figure 5 shows a method to estimate the gate-occupancy time of a flight using its tail number. The aircrafttail number is usually available for a flight in the BTS database but not for a flight in the ASPM database.
7 of 20
American Institute of Aeronautics and Astronautics
Unimpeded
Taxi-in TimeASPM
Database
• Date
• Carrier
• Airport
Taxi-in
Delay
Database
-+
-+
Gate-waiting Delay = Max
(Taxi-in Delay – 5 min, 0)Gate-waiting
DelayAirport
Actual
Taxi-in TimeBTS
Database
Figure 4. Method 1b: gate-waiting-delay estimation primarily using BTS database
Each arriving flight is paired with its departing flight as follows. For each arriving flight, the methodsearches for the earliest subsequent departure with the same tail number. If no such departure exists, or ifthe next available departure is more than 24 hours later, then the arriving flight is termed “unpaired” andis eliminated from the set. If a match is found, the gate occupancy time is the “out” time of the departingflight minus the “in” time of the arriving flight.
There are several limitations of this method. First, because of missing tail numbers, not all of the arrivalscan be paired, resulting in missing turnaround times. For example, at ATL on 6/5/2007, 2.5% of the flightsare unpaired. Secondly, a missing departure can result in more than one arriving flight being paired with thesame departing flight, resulting in an abnormally long gate-occupancy time for the earlier arrival. Finally,the method is limited to flights in the BTS database, so international flights are excluded.
Arrival Departure
S t il b• Same tail number
• Closest connection with
turnaround time < 1 day
• Non-paired flights eliminated
Paired
ATL, 6/5/07 No. Arrivals
Before pairing 1120
After pairing 1075 (96%)
Figure 5. Method 2: arrival-departure pairing
V. Results
The results in this paper are based on data collected from the summer of 2007, June 1 through August31 (92 days).
8 of 20
American Institute of Aeronautics and Astronautics
A. Overview of OEP 35 Airports
We first give an overview of gate-waiting severity at the major US OEP 35 airports. More than 70 percentof passengers move through these airports. Delays at the OEP 35 airports have a ripple effect to otherlocations. Key FAA performance measures are based on data from these airports.29
1. Airport Dimension
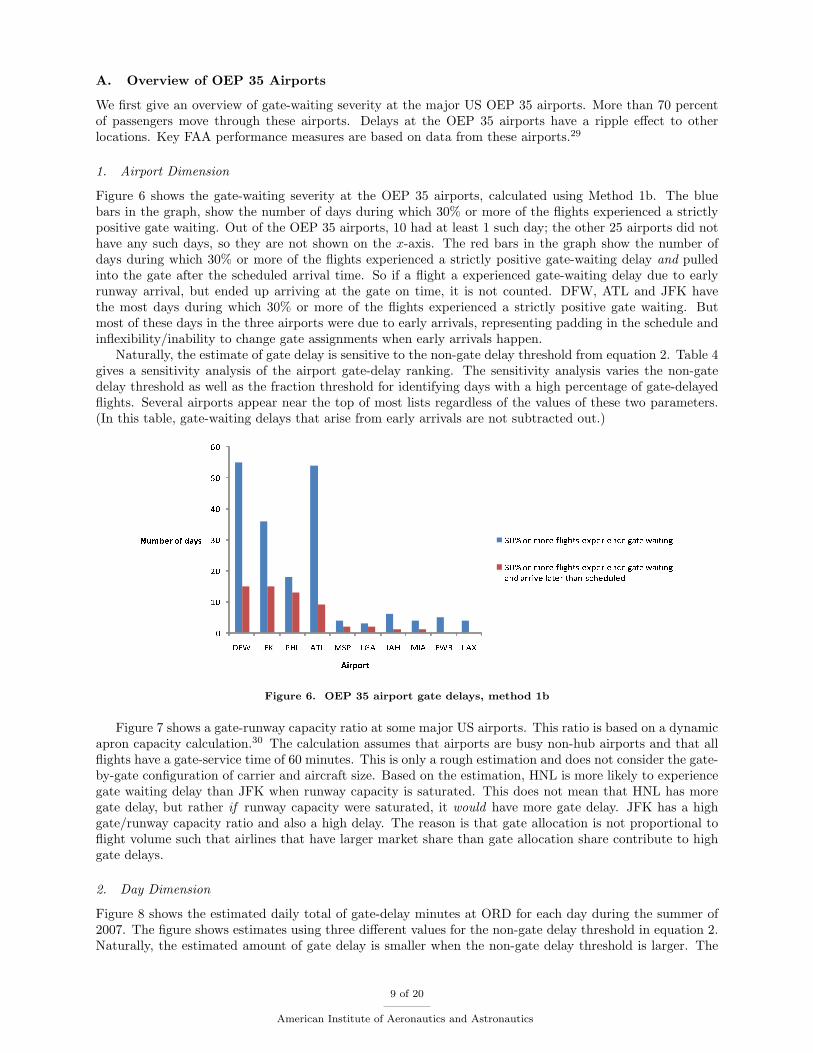
Figure 6 shows the gate-waiting severity at the OEP 35 airports, calculated using Method 1b. The bluebars in the graph, show the number of days during which 30% or more of the flights experienced a strictlypositive gate waiting. Out of the OEP 35 airports, 10 had at least 1 such day; the other 25 airports did nothave any such days, so they are not shown on the x-axis. The red bars in the graph show the number ofdays during which 30% or more of the flights experienced a strictly positive gate-waiting delay and pulledinto the gate after the scheduled arrival time. So if a flight a experienced gate-waiting delay due to earlyrunway arrival, but ended up arriving at the gate on time, it is not counted. DFW, ATL and JFK havethe most days during which 30% or more of the flights experienced a strictly positive gate waiting. Butmost of these days in the three airports were due to early arrivals, representing padding in the schedule andinflexibility/inability to change gate assignments when early arrivals happen.
Naturally, the estimate of gate delay is sensitive to the non-gate delay threshold from equation 2. Table 4gives a sensitivity analysis of the airport gate-delay ranking. The sensitivity analysis varies the non-gatedelay threshold as well as the fraction threshold for identifying days with a high percentage of gate-delayedflights. Several airports appear near the top of most lists regardless of the values of these two parameters.(In this table, gate-waiting delays that arise from early arrivals are not subtracted out.)
0102030405060
DFW JFK PHL ATL MSP LGA IAH MIA EWR LAXNumber of days
Airport30% or more flights experience gate waiting30% or more flights experience gate waiting and arrive later than scheduled
Figure 6. OEP 35 airport gate delays, method 1b
Figure 7 shows a gate-runway capacity ratio at some major US airports. This ratio is based on a dynamicapron capacity calculation.30 The calculation assumes that airports are busy non-hub airports and that allflights have a gate-service time of 60 minutes. This is only a rough estimation and does not consider the gate-by-gate configuration of carrier and aircraft size. Based on the estimation, HNL is more likely to experiencegate waiting delay than JFK when runway capacity is saturated. This does not mean that HNL has moregate delay, but rather if runway capacity were saturated, it would have more gate delay. JFK has a highgate/runway capacity ratio and also a high delay. The reason is that gate allocation is not proportional toflight volume such that airlines that have larger market share than gate allocation share contribute to highgate delays.
2. Day Dimension
Figure 8 shows the estimated daily total of gate-delay minutes at ORD for each day during the summer of2007. The figure shows estimates using three different values for the non-gate delay threshold in equation 2.Naturally, the estimated amount of gate delay is smaller when the non-gate delay threshold is larger. The
9 of 20
American Institute of Aeronautics and Astronautics
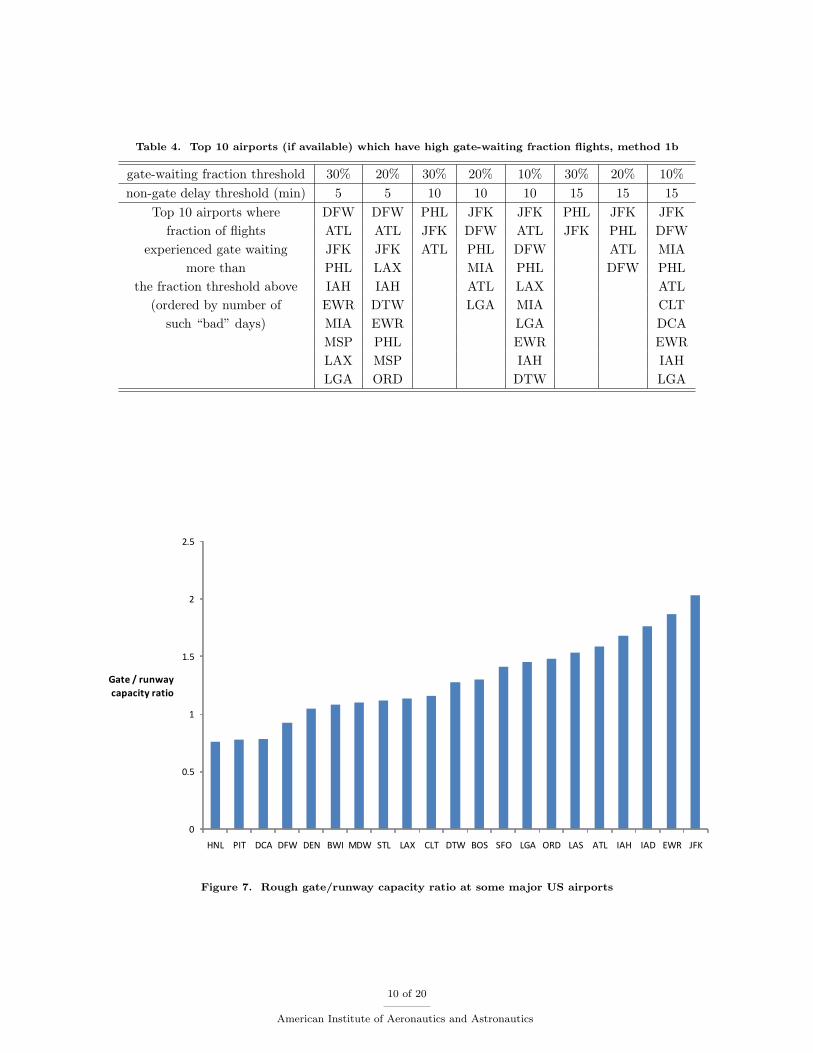
Table 4. Top 10 airports (if available) which have high gate-waiting fraction flights, method 1b
gate-waiting fraction threshold 30% 20% 30% 20% 10% 30% 20% 10%non-gate delay threshold (min) 5 5 10 10 10 15 15 15
Top 10 airports where DFW DFW PHL JFK JFK PHL JFK JFKfraction of flights ATL ATL JFK DFW ATL JFK PHL DFW
experienced gate waiting JFK JFK ATL PHL DFW ATL MIAmore than PHL LAX MIA PHL DFW PHL
the fraction threshold above IAH IAH ATL LAX ATL(ordered by number of EWR DTW LGA MIA CLT
such “bad” days) MIA EWR LGA DCAMSP PHL EWR EWRLAX MSP IAH IAHLGA ORD DTW LGA
0
0.5
1
1.5
2
2.5
HNL PIT DCA DFW DEN BWI MDW STL LAX CLT DTW BOS SFO LGA ORD LAS ATL IAH IAD EWR JFK
Gate / runwaycapacity ratio
Figure 7. Rough gate/runway capacity ratio at some major US airports
10 of 20
American Institute of Aeronautics and Astronautics
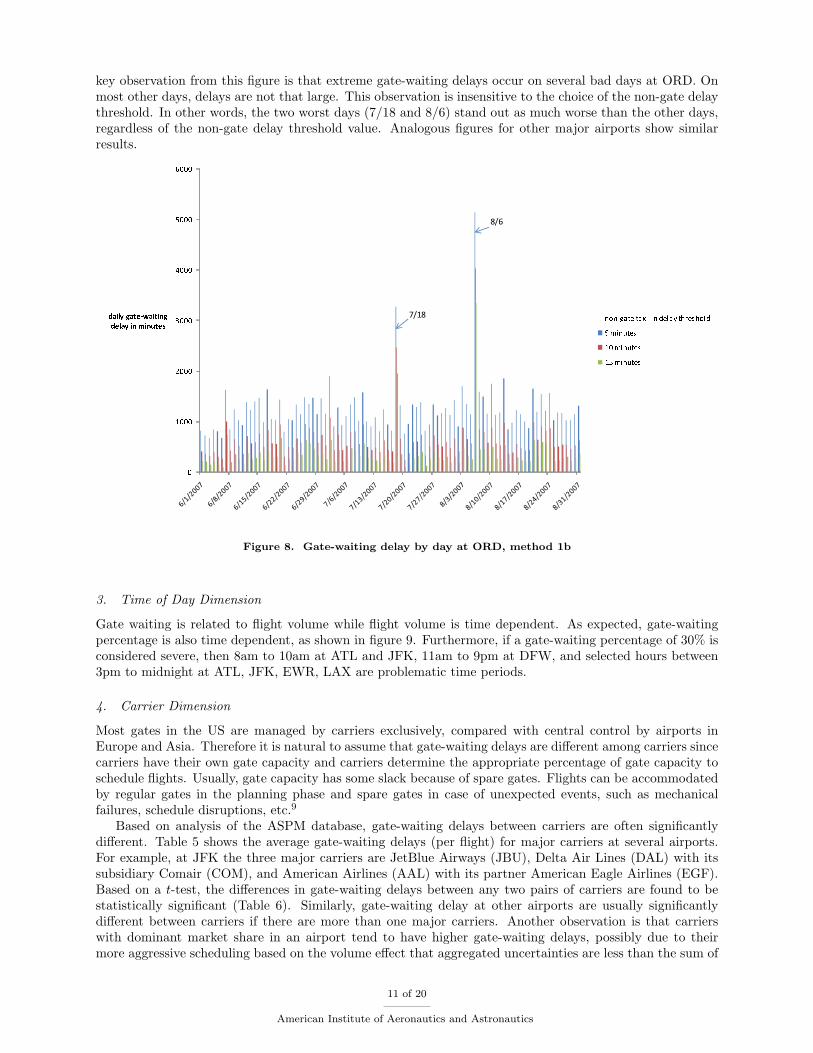
key observation from this figure is that extreme gate-waiting delays occur on several bad days at ORD. Onmost other days, delays are not that large. This observation is insensitive to the choice of the non-gate delaythreshold. In other words, the two worst days (7/18 and 8/6) stand out as much worse than the other days,regardless of the non-gate delay threshold value. Analogous figures for other major airports show similarresults.
0100020003000400050006000
daily gate-waitingdelay in minutes non-gate taxi-in delay threshold5 minutes10 minutes15 minutes7/18
8/6
Figure 8. Gate-waiting delay by day at ORD, method 1b
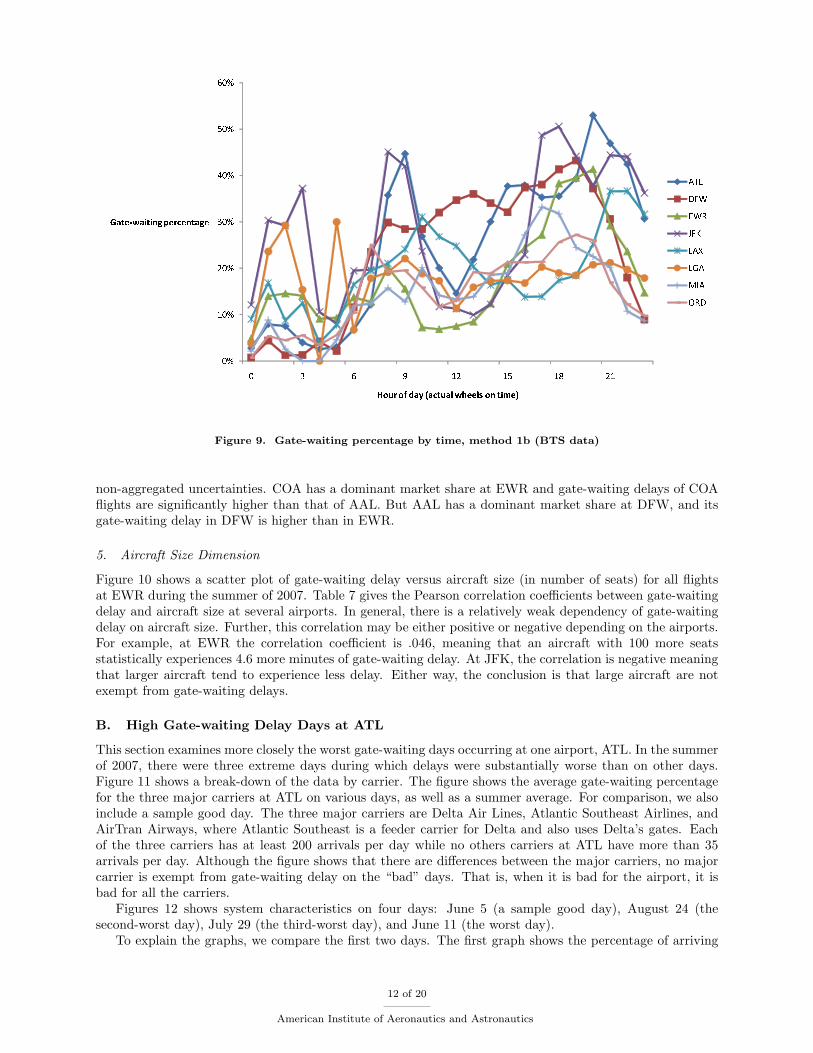
3. Time of Day Dimension
Gate waiting is related to flight volume while flight volume is time dependent. As expected, gate-waitingpercentage is also time dependent, as shown in figure 9. Furthermore, if a gate-waiting percentage of 30% isconsidered severe, then 8am to 10am at ATL and JFK, 11am to 9pm at DFW, and selected hours between3pm to midnight at ATL, JFK, EWR, LAX are problematic time periods.
4. Carrier Dimension
Most gates in the US are managed by carriers exclusively, compared with central control by airports inEurope and Asia. Therefore it is natural to assume that gate-waiting delays are different among carriers sincecarriers have their own gate capacity and carriers determine the appropriate percentage of gate capacity toschedule flights. Usually, gate capacity has some slack because of spare gates. Flights can be accommodatedby regular gates in the planning phase and spare gates in case of unexpected events, such as mechanicalfailures, schedule disruptions, etc.9
Based on analysis of the ASPM database, gate-waiting delays between carriers are often significantlydifferent. Table 5 shows the average gate-waiting delays (per flight) for major carriers at several airports.For example, at JFK the three major carriers are JetBlue Airways (JBU), Delta Air Lines (DAL) with itssubsidiary Comair (COM), and American Airlines (AAL) with its partner American Eagle Airlines (EGF).Based on a t-test, the differences in gate-waiting delays between any two pairs of carriers are found to bestatistically significant (Table 6). Similarly, gate-waiting delay at other airports are usually significantlydifferent between carriers if there are more than one major carriers. Another observation is that carrierswith dominant market share in an airport tend to have higher gate-waiting delays, possibly due to theirmore aggressive scheduling based on the volume effect that aggregated uncertainties are less than the sum of
11 of 20
American Institute of Aeronautics and Astronautics
0%10%20%30%40%50%60%
0 3 6 9 12 15 18 21
Gate-waiting percentage
Hour of day (actual wheels on time)
ATLDFWEWRJFKLAXLGAMIAORDFigure 9. Gate-waiting percentage by time, method 1b (BTS data)
non-aggregated uncertainties. COA has a dominant market share at EWR and gate-waiting delays of COAflights are significantly higher than that of AAL. But AAL has a dominant market share at DFW, and itsgate-waiting delay in DFW is higher than in EWR.
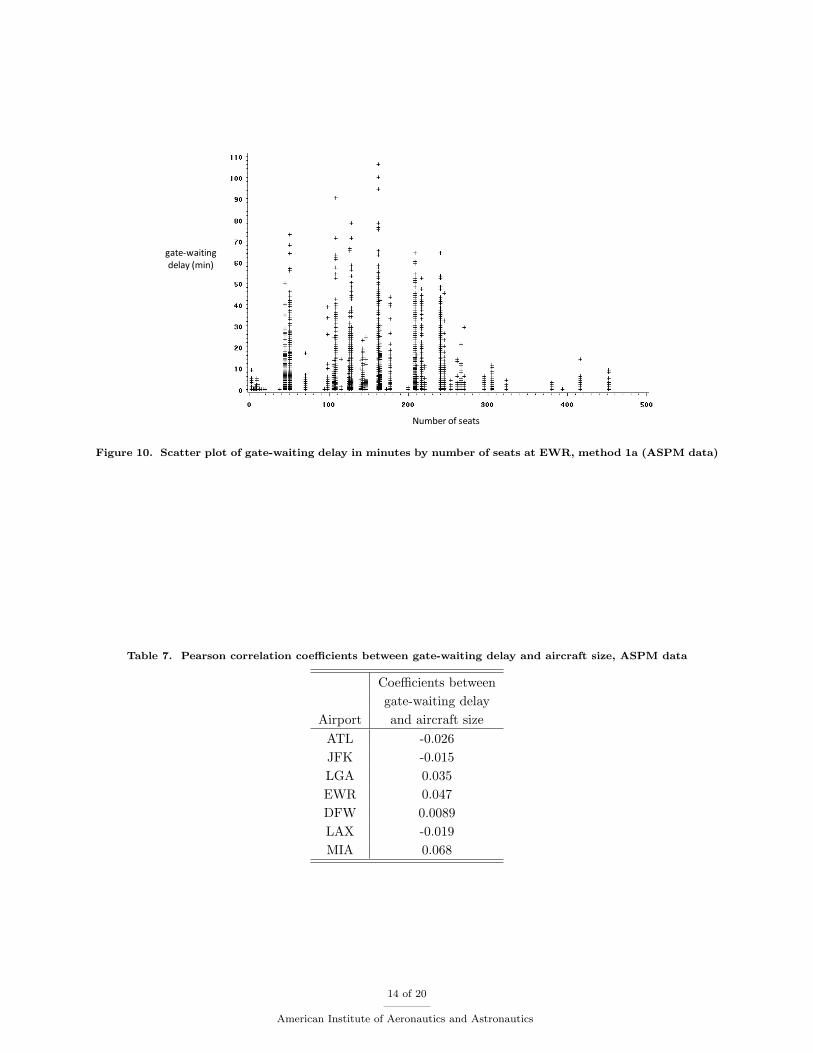
5. Aircraft Size Dimension
Figure 10 shows a scatter plot of gate-waiting delay versus aircraft size (in number of seats) for all flightsat EWR during the summer of 2007. Table 7 gives the Pearson correlation coefficients between gate-waitingdelay and aircraft size at several airports. In general, there is a relatively weak dependency of gate-waitingdelay on aircraft size. Further, this correlation may be either positive or negative depending on the airports.For example, at EWR the correlation coefficient is .046, meaning that an aircraft with 100 more seatsstatistically experiences 4.6 more minutes of gate-waiting delay. At JFK, the correlation is negative meaningthat larger aircraft tend to experience less delay. Either way, the conclusion is that large aircraft are notexempt from gate-waiting delays.
B. High Gate-waiting Delay Days at ATL
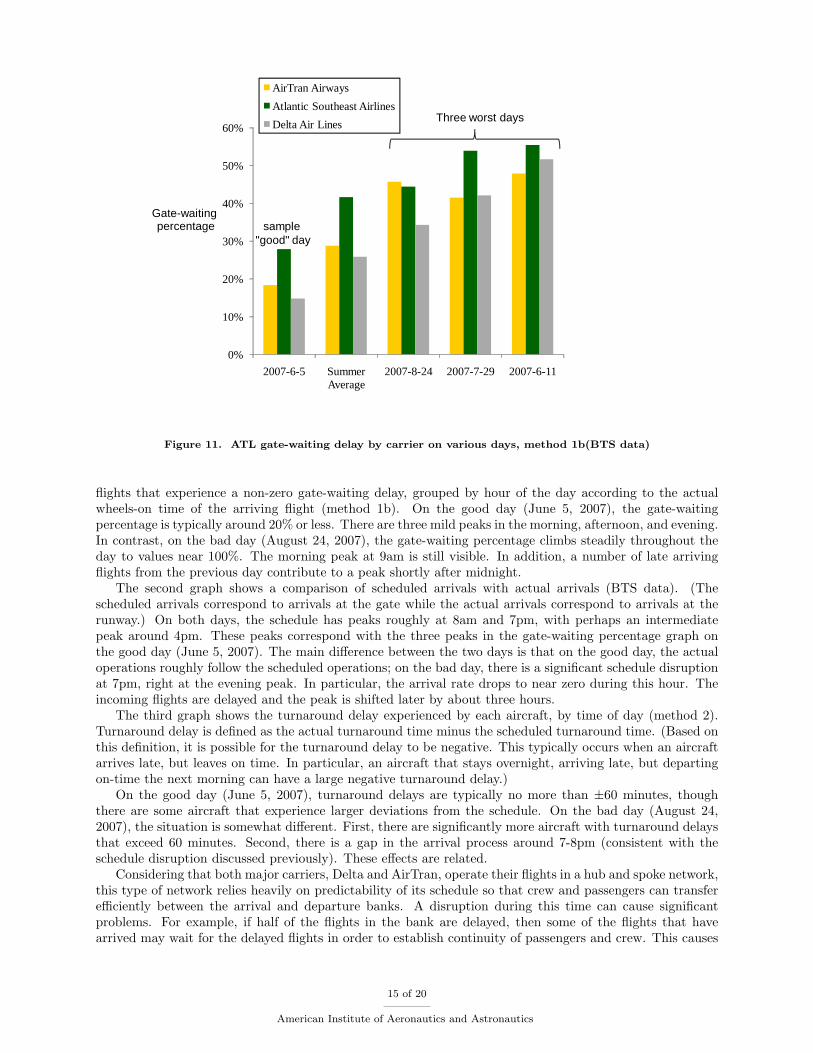
This section examines more closely the worst gate-waiting days occurring at one airport, ATL. In the summerof 2007, there were three extreme days during which delays were substantially worse than on other days.Figure 11 shows a break-down of the data by carrier. The figure shows the average gate-waiting percentagefor the three major carriers at ATL on various days, as well as a summer average. For comparison, we alsoinclude a sample good day. The three major carriers are Delta Air Lines, Atlantic Southeast Airlines, andAirTran Airways, where Atlantic Southeast is a feeder carrier for Delta and also uses Delta’s gates. Eachof the three carriers has at least 200 arrivals per day while no others carriers at ATL have more than 35arrivals per day. Although the figure shows that there are differences between the major carriers, no majorcarrier is exempt from gate-waiting delay on the “bad” days. That is, when it is bad for the airport, it isbad for all the carriers.
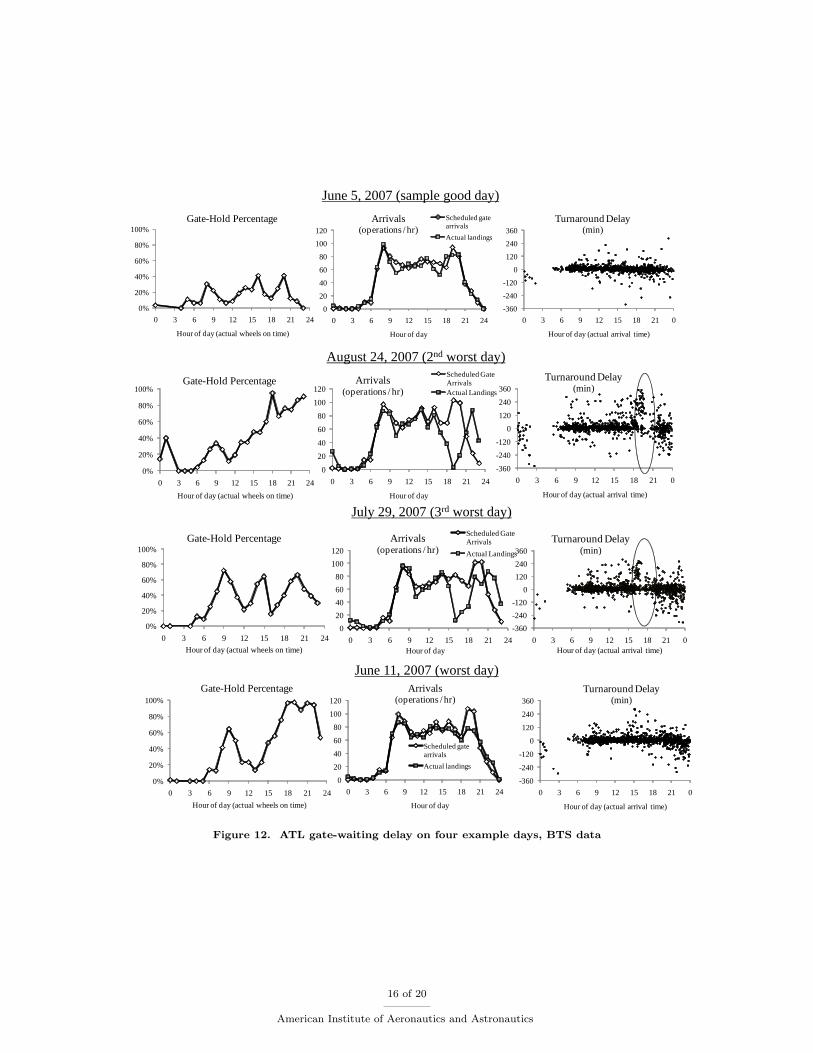
Figures 12 shows system characteristics on four days: June 5 (a sample good day), August 24 (thesecond-worst day), July 29 (the third-worst day), and June 11 (the worst day).
To explain the graphs, we compare the first two days. The first graph shows the percentage of arriving
12 of 20
American Institute of Aeronautics and Astronautics
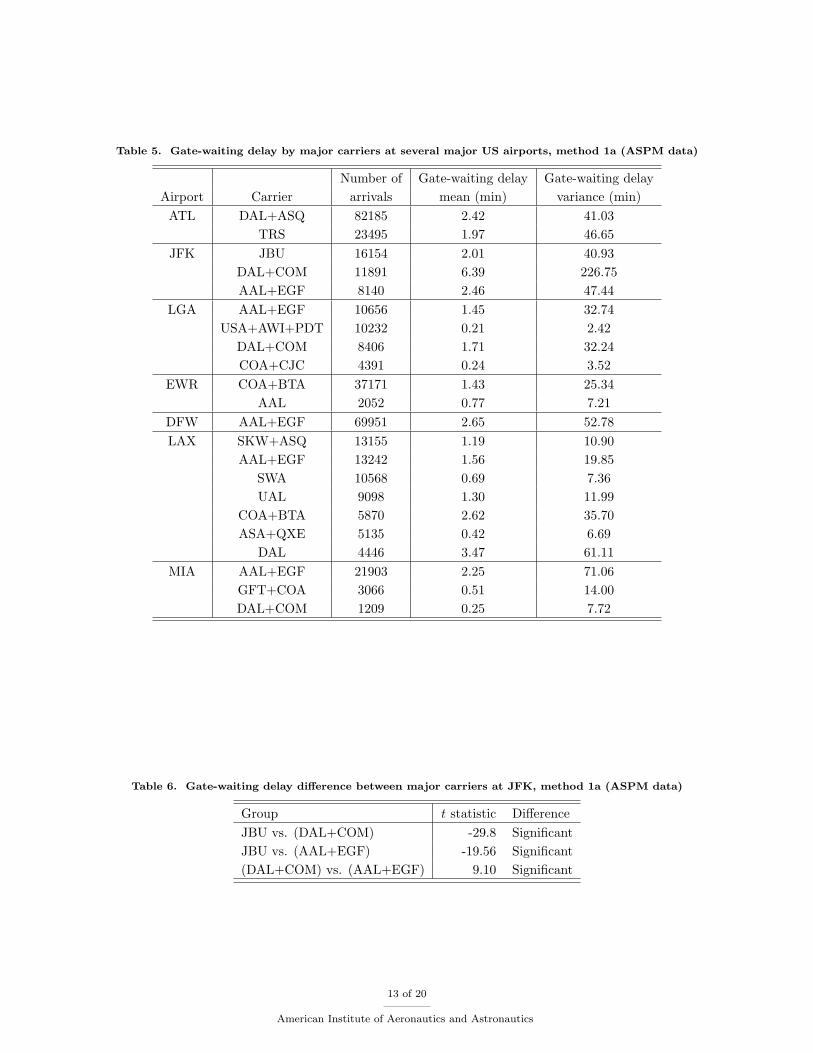
Table 5. Gate-waiting delay by major carriers at several major US airports, method 1a (ASPM data)
Number of Gate-waiting delay Gate-waiting delayAirport Carrier arrivals mean (min) variance (min)ATL DAL+ASQ 82185 2.42 41.03
TRS 23495 1.97 46.65JFK JBU 16154 2.01 40.93
DAL+COM 11891 6.39 226.75AAL+EGF 8140 2.46 47.44
LGA AAL+EGF 10656 1.45 32.74USA+AWI+PDT 10232 0.21 2.42
DAL+COM 8406 1.71 32.24COA+CJC 4391 0.24 3.52
EWR COA+BTA 37171 1.43 25.34AAL 2052 0.77 7.21
DFW AAL+EGF 69951 2.65 52.78LAX SKW+ASQ 13155 1.19 10.90
AAL+EGF 13242 1.56 19.85SWA 10568 0.69 7.36UAL 9098 1.30 11.99
COA+BTA 5870 2.62 35.70ASA+QXE 5135 0.42 6.69
DAL 4446 3.47 61.11MIA AAL+EGF 21903 2.25 71.06
GFT+COA 3066 0.51 14.00DAL+COM 1209 0.25 7.72
Table 6. Gate-waiting delay difference between major carriers at JFK, method 1a (ASPM data)
Group t statistic DifferenceJBU vs. (DAL+COM) -29.8 SignificantJBU vs. (AAL+EGF) -19.56 Significant(DAL+COM) vs. (AAL+EGF) 9.10 Significant
13 of 20
American Institute of Aeronautics and Astronautics
Number of seats
gate-waitingdelay (min)
Figure 10. Scatter plot of gate-waiting delay in minutes by number of seats at EWR, method 1a (ASPM data)
Table 7. Pearson correlation coefficients between gate-waiting delay and aircraft size, ASPM data
Coefficients betweengate-waiting delay
Airport and aircraft sizeATL -0.026JFK -0.015LGA 0.035EWR 0.047DFW 0.0089LAX -0.019MIA 0.068
14 of 20
American Institute of Aeronautics and Astronautics
0%
10%
20%
30%
40%
50%
60%
2007-6-5 Summer Average
2007-8-24 2007-7-29 2007-6-11
Gate-waitingpercentage
AirTran Airways
Atlantic Southeast Airlines
Delta Air LinesThree worst days
sample "good" day
Figure 11. ATL gate-waiting delay by carrier on various days, method 1b(BTS data)
flights that experience a non-zero gate-waiting delay, grouped by hour of the day according to the actualwheels-on time of the arriving flight (method 1b). On the good day (June 5, 2007), the gate-waitingpercentage is typically around 20% or less. There are three mild peaks in the morning, afternoon, and evening.In contrast, on the bad day (August 24, 2007), the gate-waiting percentage climbs steadily throughout theday to values near 100%. The morning peak at 9am is still visible. In addition, a number of late arrivingflights from the previous day contribute to a peak shortly after midnight.
The second graph shows a comparison of scheduled arrivals with actual arrivals (BTS data). (Thescheduled arrivals correspond to arrivals at the gate while the actual arrivals correspond to arrivals at therunway.) On both days, the schedule has peaks roughly at 8am and 7pm, with perhaps an intermediatepeak around 4pm. These peaks correspond with the three peaks in the gate-waiting percentage graph onthe good day (June 5, 2007). The main difference between the two days is that on the good day, the actualoperations roughly follow the scheduled operations; on the bad day, there is a significant schedule disruptionat 7pm, right at the evening peak. In particular, the arrival rate drops to near zero during this hour. Theincoming flights are delayed and the peak is shifted later by about three hours.
The third graph shows the turnaround delay experienced by each aircraft, by time of day (method 2).Turnaround delay is defined as the actual turnaround time minus the scheduled turnaround time. (Based onthis definition, it is possible for the turnaround delay to be negative. This typically occurs when an aircraftarrives late, but leaves on time. In particular, an aircraft that stays overnight, arriving late, but departingon-time the next morning can have a large negative turnaround delay.)
On the good day (June 5, 2007), turnaround delays are typically no more than ±60 minutes, thoughthere are some aircraft that experience larger deviations from the schedule. On the bad day (August 24,2007), the situation is somewhat different. First, there are significantly more aircraft with turnaround delaysthat exceed 60 minutes. Second, there is a gap in the arrival process around 7-8pm (consistent with theschedule disruption discussed previously). These effects are related.
Considering that both major carriers, Delta and AirTran, operate their flights in a hub and spoke network,this type of network relies heavily on predictability of its schedule so that crew and passengers can transferefficiently between the arrival and departure banks. A disruption during this time can cause significantproblems. For example, if half of the flights in the bank are delayed, then some of the flights that havearrived may wait for the delayed flights in order to establish continuity of passengers and crew. This causes
15 of 20
American Institute of Aeronautics and Astronautics
0%
20%
40%
60%
80%
100%
0 3 6 9 12 15 18 21 24
Hour of day (actual wheels on time)
Gate-Hold Percentage
0
20
40
60
80
100
120
0 3 6 9 12 15 18 21 24
Hour of day
Arrivals(operations / hr)
Scheduled gate arrivals
Actual landings
-360
-240
-120
0
120
240
360
0 3 6 9 12 15 18 21 0
Hour of day (actual arrival time)
Turnaround Delay(min)
June 5, 2007 (sample good day)
July 29, 2007 (3rd worst day)
0%
20%
40%
60%
80%
100%
0 3 6 9 12 15 18 21 24
Hour of day (actual wheels on time)
Gate-Hold Percentage
0
20
40
60
80
100
120
0 3 6 9 12 15 18 21 24Hour of day
Arrivals(operations / hr)
Scheduled Gate Arrivals
Actual Landings
-360
-240
-120
0
120
240
360
0 3 6 9 12 15 18 21 0Hour of day (actual arrival time)
Turnaround Delay(min)
0%
20%
40%
60%
80%
100%
0 3 6 9 12 15 18 21 24
Hour of day (actual wheels on time)
Gate-Hold Percentage
0
20
40
60
80
100
120
0 3 6 9 12 15 18 21 24
Hour of day
Arrivals(operations / hr)
Scheduled Gate ArrivalsActual Landings
-360
-240
-120
0
120
240
360
0 3 6 9 12 15 18 21 0
Hour of day (actual arrival time)
Turnaround Delay(min)
August 24, 2007 (2nd worst day)
June 11, 2007 (worst day)
0%
20%
40%
60%
80%
100%
0 3 6 9 12 15 18 21 24
Hour of day (actual wheels on time)
Gate-Hold Percentage
0
20
40
60
80
100
120
0 3 6 9 12 15 18 21 24
Hour of day
Arrivals(operations / hr)
Scheduled gate arrivals
Actual landings
-360
-240
-120
0
120
240
360
0 3 6 9 12 15 18 21 0
Hour of day (actual arrival time)
Turnaround Delay(min)
Figure 12. ATL gate-waiting delay on four example days, BTS data
16 of 20
American Institute of Aeronautics and Astronautics
the aircraft to remain at their gates longer, thereby reducing the number of available gates and contributingto gate-waiting delay. Disruptions can also require crew changes which can delay aircraft at their gates.
In summary, the good day (June 5) is characterized by a close adherence to the schedule without muchdisruption. The bad day (August 24) is characterized by a significant schedule disruption, leading to longturnaround times. The long turnaround times limit gate availability and contribute to gate-waiting delays.
Now we consider the other two bad days at ATL: July 29 (the third-worst day) and June 11 (the worstday). From a qualitative perspective, July 29 is very similar to August 24. Specifically, there is a significantdrop in arrival capacity in the late afternoon (this time around 4-6pm). This leads to significant deviationsfrom the schedule where the disrupted arrival bank comes in several hours after its planned arrival time.This disruption leads to large increases in turnaround times, which in turn leads to large gate delays.
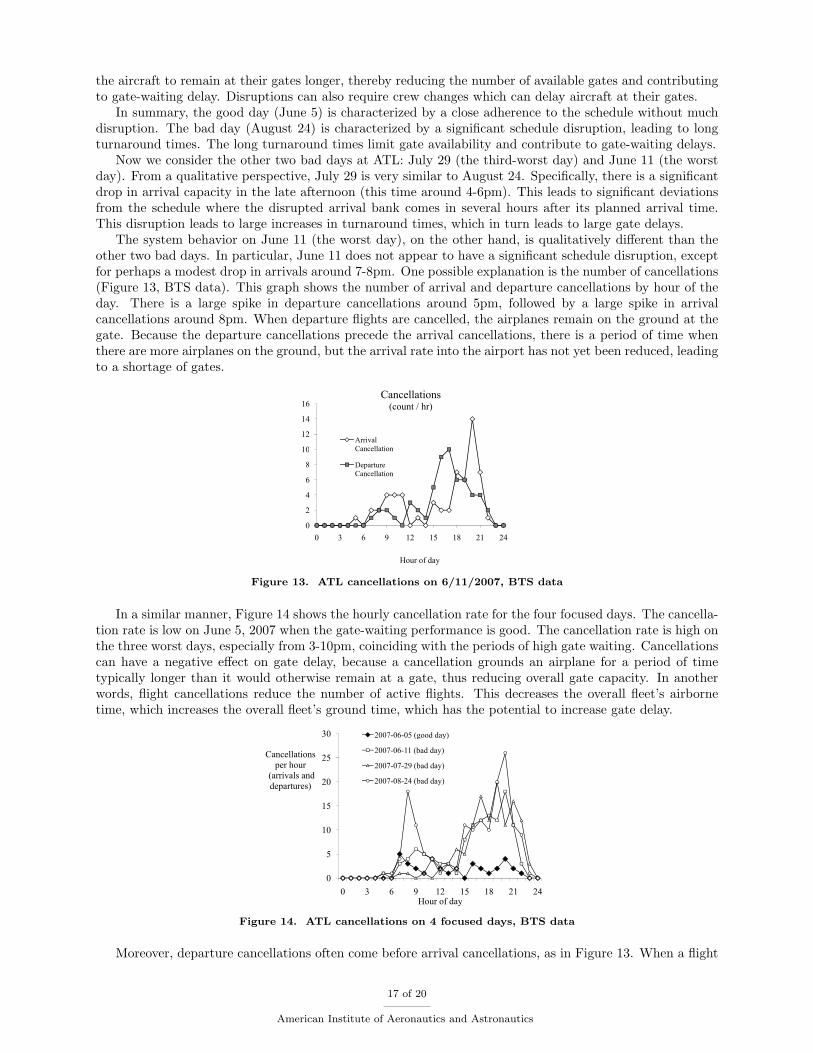
The system behavior on June 11 (the worst day), on the other hand, is qualitatively different than theother two bad days. In particular, June 11 does not appear to have a significant schedule disruption, exceptfor perhaps a modest drop in arrivals around 7-8pm. One possible explanation is the number of cancellations(Figure 13, BTS data). This graph shows the number of arrival and departure cancellations by hour of theday. There is a large spike in departure cancellations around 5pm, followed by a large spike in arrivalcancellations around 8pm. When departure flights are cancelled, the airplanes remain on the ground at thegate. Because the departure cancellations precede the arrival cancellations, there is a period of time whenthere are more airplanes on the ground, but the arrival rate into the airport has not yet been reduced, leadingto a shortage of gates.
Cancellations
10
12
14
16Cancellations
(count / hr)
Arrival
Cancellation
4
6
8
10 Cancellation
Departure
Cancellation
0
2
0 3 6 9 12 15 18 21 24
Hour of day
Figure 13. ATL cancellations on 6/11/2007, BTS data
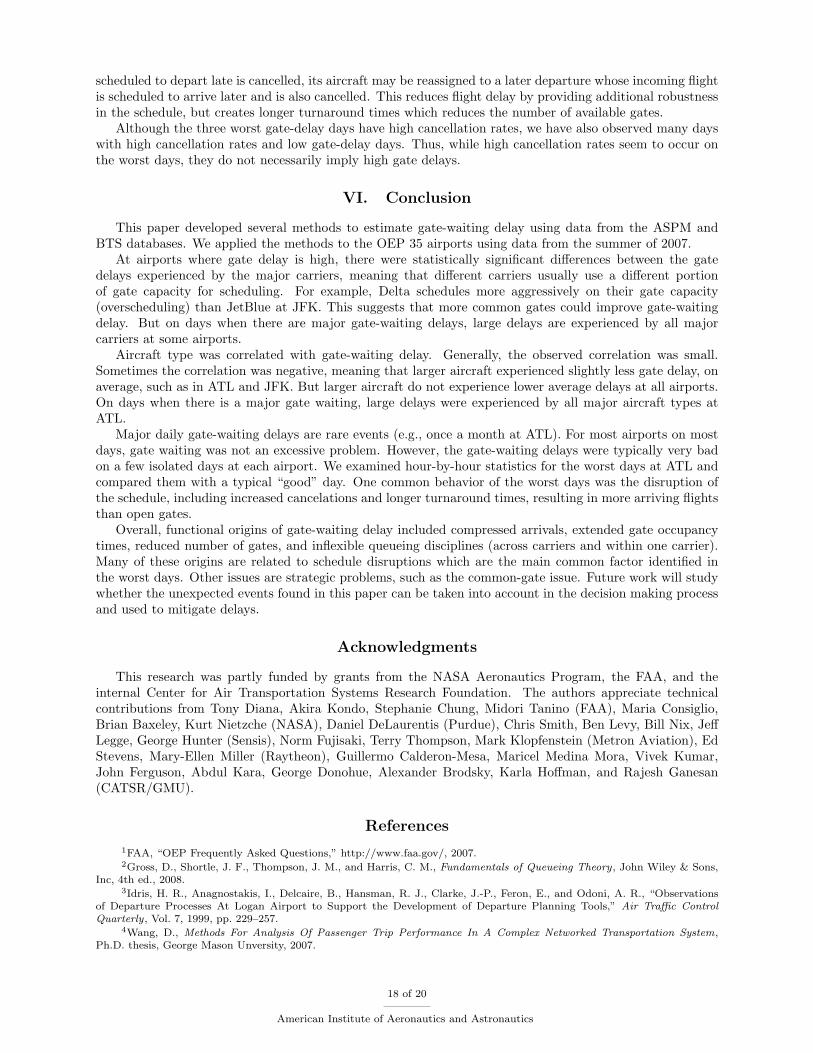
In a similar manner, Figure 14 shows the hourly cancellation rate for the four focused days. The cancella-tion rate is low on June 5, 2007 when the gate-waiting performance is good. The cancellation rate is high onthe three worst days, especially from 3-10pm, coinciding with the periods of high gate waiting. Cancellationscan have a negative effect on gate delay, because a cancellation grounds an airplane for a period of timetypically longer than it would otherwise remain at a gate, thus reducing overall gate capacity. In anotherwords, flight cancellations reduce the number of active flights. This decreases the overall fleet’s airbornetime, which increases the overall fleet’s ground time, which has the potential to increase gate delay.
30 2007-06-05 (good day)
25Cancellations
per hour
2007 06 05 (good day)
2007-06-11 (bad day)
2007-07-29 (bad day)
15
20(arrivals and
departures)2007-08-24 (bad day)
10
15
5
0
0 3 6 9 12 15 18 21 24Hour of day
Figure 14. ATL cancellations on 4 focused days, BTS data
Moreover, departure cancellations often come before arrival cancellations, as in Figure 13. When a flight
17 of 20
American Institute of Aeronautics and Astronautics
scheduled to depart late is cancelled, its aircraft may be reassigned to a later departure whose incoming flightis scheduled to arrive later and is also cancelled. This reduces flight delay by providing additional robustnessin the schedule, but creates longer turnaround times which reduces the number of available gates.
Although the three worst gate-delay days have high cancellation rates, we have also observed many dayswith high cancellation rates and low gate-delay days. Thus, while high cancellation rates seem to occur onthe worst days, they do not necessarily imply high gate delays.
VI. Conclusion
This paper developed several methods to estimate gate-waiting delay using data from the ASPM andBTS databases. We applied the methods to the OEP 35 airports using data from the summer of 2007.
At airports where gate delay is high, there were statistically significant differences between the gatedelays experienced by the major carriers, meaning that different carriers usually use a different portionof gate capacity for scheduling. For example, Delta schedules more aggressively on their gate capacity(overscheduling) than JetBlue at JFK. This suggests that more common gates could improve gate-waitingdelay. But on days when there are major gate-waiting delays, large delays are experienced by all majorcarriers at some airports.
Aircraft type was correlated with gate-waiting delay. Generally, the observed correlation was small.Sometimes the correlation was negative, meaning that larger aircraft experienced slightly less gate delay, onaverage, such as in ATL and JFK. But larger aircraft do not experience lower average delays at all airports.On days when there is a major gate waiting, large delays were experienced by all major aircraft types atATL.
Major daily gate-waiting delays are rare events (e.g., once a month at ATL). For most airports on mostdays, gate waiting was not an excessive problem. However, the gate-waiting delays were typically very badon a few isolated days at each airport. We examined hour-by-hour statistics for the worst days at ATL andcompared them with a typical “good” day. One common behavior of the worst days was the disruption ofthe schedule, including increased cancelations and longer turnaround times, resulting in more arriving flightsthan open gates.
Overall, functional origins of gate-waiting delay included compressed arrivals, extended gate occupancytimes, reduced number of gates, and inflexible queueing disciplines (across carriers and within one carrier).Many of these origins are related to schedule disruptions which are the main common factor identified inthe worst days. Other issues are strategic problems, such as the common-gate issue. Future work will studywhether the unexpected events found in this paper can be taken into account in the decision making processand used to mitigate delays.
Acknowledgments
This research was partly funded by grants from the NASA Aeronautics Program, the FAA, and theinternal Center for Air Transportation Systems Research Foundation. The authors appreciate technicalcontributions from Tony Diana, Akira Kondo, Stephanie Chung, Midori Tanino (FAA), Maria Consiglio,Brian Baxeley, Kurt Nietzche (NASA), Daniel DeLaurentis (Purdue), Chris Smith, Ben Levy, Bill Nix, JeffLegge, George Hunter (Sensis), Norm Fujisaki, Terry Thompson, Mark Klopfenstein (Metron Aviation), EdStevens, Mary-Ellen Miller (Raytheon), Guillermo Calderon-Mesa, Maricel Medina Mora, Vivek Kumar,John Ferguson, Abdul Kara, George Donohue, Alexander Brodsky, Karla Hoffman, and Rajesh Ganesan(CATSR/GMU).
References
1FAA, “OEP Frequently Asked Questions,” http://www.faa.gov/, 2007.2Gross, D., Shortle, J. F., Thompson, J. M., and Harris, C. M., Fundamentals of Queueing Theory, John Wiley & Sons,
Inc, 4th ed., 2008.3Idris, H. R., Anagnostakis, I., Delcaire, B., Hansman, R. J., Clarke, J.-P., Feron, E., and Odoni, A. R., “Observations
of Departure Processes At Logan Airport to Support the Development of Departure Planning Tools,” Air Traffic ControlQuarterly, Vol. 7, 1999, pp. 229–257.
4Wang, D., Methods For Analysis Of Passenger Trip Performance In A Complex Networked Transportation System,Ph.D. thesis, George Mason Unversity, 2007.
18 of 20
American Institute of Aeronautics and Astronautics
5Ramos, R. T., “AirTran doesn’t control new gates, airport says,” Atlanta Business Chronicle, February 2007.6Idris, H. R., Observation and analysis of departure operations at Boston Logan International Airport, Ph.D. thesis,
Massachusetts Institute of Technology, 2001.7Horonjeff, R. and McKelvey, F., Planning and Design of Airports, McGraw-Hill Professional, 1993.8Richards, J., “Self-Docking Saves Millions, Reduces Gate Delays at DFW,” http://www.airportimprovement.com,
September-October 2008.9Bazargan, M., Airline Operations And Scheduling, Ashgate Pub Ltd, 2004.
10Bolat, A., “Procedures for providing robust gate assignments for arriving aircrafts,” European Journal of OperationalResearch, Vol. 120, 2000, pp. 63–80.
11Haghani, A. and Chen, M.-C., “Optimizing gate assignments at airport terminals,” Transportation Research Part A:Policy and Practice, Vol. 32, 1998, pp. 437–454.
12Yan, S. and Huo, C.-M., “Optimization of multiple objective gate assignments,” Transportation Research Part A: Policyand Practice, Vol. 35, 2001, pp. 413–432.
13Bolat, A., “Assigning Arriving Flights at an Airport to the Available Gates,” The Journal of the Operational ResearchSociety, Vol. 50, 1999, pp. 23–34.
14Yan, S. and Chang, C.-M., “A network model for gate assignment,” Journal of Advanced Transportation, Vol. 32, 1998,pp. 176–189.
15Yan, S. and Tang, C.-H., “A heuristic approach for airport gate assignments for stochastic flight delays,” EuropeanJournal of Operational Research, Vol. 180, 2007, pp. 547567.
16Gu, Y. and Chung, C. A., “Genetic Algorithm Approach to Aircraft Gate Reassignment Problem,” Journal of Trans-portation Engineering, Vol. 125, 1999, pp. 384–389.
17Yan, S., Shieh, C.-Y., and Chen, M., “A simulation framework for evaluating airport gate assignments,” TransportationResearch Part A: Policy and Practice, Vol. 36, 2002, pp. 885–898.
18Dorndorf, U., Jaehn, F., Lin, C., Ma, H., and Pesch, E., “Disruption management in flight gate scheduling,” StatisticaNeerlandica, Vol. 61, No. 1, 2007, pp. 92–114.
19Gillen, D. and Lall, A., “Developing measures of airport productivity and performance: an application of data envelopmentanalysis,” Transportation research. Part E, Logistics and transportation review , Vol. 33, 1997, pp. 261–274.
20Andersson, K., Carr, F., Feron, E., and Hall, W. D., “Analysis and Modeling of Ground Operations at Hub Airports,”3rd USA/Europe Air Traffic Management R&D Seminar, Napoli, 13-16 June 2000 , 2000.
21Roling, P. C. and Visser, H. G., “Optimal Airport Surface Traffic Planning Using Mixed-Integer Linear Programming,”International Journal of Aerospace Engineering, Vol. 2008, 2007.
22Fricke, H. and Schultz, M., “Improving Aircraft Turn Around Reliability,” Third International Conference on Researchin Air Transportation, 2008.
23BTS, “Airline On-Time Performance and Causes of Flight Delays,” 2003.24USpatent, “System and method of providing OOOI times of an aircraft,” United States Patent 6154636, 11 2000.25Kondo, A., The Derivation of the Unimpeded Taxi-out and Taxi-in Times in the Estimation of the Taxi Time Delays,
Office of Aviation Policy, Federal Aviation Administration, technical note 2009 no. 1 ed., 2009.26ASPM, F., “data reference guide,” 2008.27Xu, N., Method for Deriving Multi-Factor Models for Predicting Airport Delays, Ph.D. thesis, George Mason University,
2007.28Gosling, G. D., “Development of a framework for assessing the benefits of airportsurface traffic automation,” Control
Systems Technology, IEEE Transactions on, Vol. 1, 1993, pp. 155–167.29FAA, “OEP Frequently Asked Questions - OEP 35 Airports,” July 2007.30de Neufville, R. and Odoni, A., Airport Systems: Planning, Design, and Management, McGraw-Hill Professional, 1st
ed., October 2003.
Author Biographies
Jianfeng Wang is a doctoral candidate and research assistant in the Center for Air Transportation SystemsResearch at George Mason University.
John F. Shortle is an Associate Professor of Systems Engineering and Operations Research at GeorgeMason University (GMU). His research interests include simulation and queueing applications in air trans-portation and telecommunications. He is a member of the Center for Air Transportation Systems Researchand the Center for Network-Based Systems. Previously, he worked in the telecommunications industry atUS WEST Advanced Technologies. He received a Ph.D. and M.S. in industrial engineering and operationsresearch at UC Berkeley in 1996.
Juan Wang is a graduate student and research assistant in the Center for Air Transportation SystemsResearch at George Mason University.
Lance Sherry is the Executive Director of the Center for Air Transportation Systems Research at George
19 of 20
American Institute of Aeronautics and Astronautics

Mason University and an Associate Professor of Systems Engineering and Operations Research. He receivedhis Ph.D. in industrial and management systems engineering in 1999 from Arizona State University.
20 of 20
American Institute of Aeronautics and Astronautics