Embed Size (px)
Citation preview
1 Journal of International Business and Management (JIBM)
https://rpajournals.com/jibm
JIBM Journal of International Business and Management
Journal Homepage: https://rpajournals.com/jibm
Expected Actual Waiting Time and Service Delivery Evidence Using Queuing Theory in Selected Banking
Institutions in Bangladesh
Suhel Ahmed1 Md. Saidur Rahaman*2
Mohammad Abdul Hamid3
Iqbal Hossain Moral4
Metropolitan University, Bangladesh1,2 Qadirabad Cantonment Sapper College, Bangladesh3
University of Rajshahi, Bangladesh4
Abstract Waiting in queues and service effectiveness are essential components in the business world. Queues emerge when customers or clients come forward to utilise services from a person or organisation. Similarly, queues of waiting customers in front of banks are a common occurrence in Bangladesh. Consequently, the queuing theory is a successful scientific tool in the performance analysis of waiting lines. The key parameters used to measure the system’s performance are the length of the waiting line, server utilisation, and the delays for customers. The point of this paper is to find out not only the normal amount of time a customer needs to spend in a queue at the bank’s ATM, but also the actual time needed by the bank administration staff for providing the services. All the relevant information was gathered from a Private Commercial Bank in Bangladesh. Data was collected utilising individual perceptions and transactional records stored from Sunday through to Thursday, the most crucial time frame. The Toxic Substance Distribution (TSD) approach was utilised for the information test and the result of this study revealed that each and every client needed to spend 14.55 minutes in a queue for each transaction. Finally, the queuing theory is relevant in ascertaining ideal banking and waiting times, and that these may even be protracted due to outside forces. Finally, administration staff at the bank can estimate how many customers will wait in the queue and the number of customers that will walk away each day. Keywords: Queue/Line, Waiting, Actual Time, Service Delivery and Customer.
RPA Journals
Journal of International Business and Management 1(2): 1-14 (2018) Print ISSN: 2616-5163 Online ISSN: 2616-4655
*Corresponding author: Md. Saidur Rahaman2, Email: [email protected] Submission Date: 24th March 2018 Revision Date: 25th April 2018 Acceptance Date: 18th May 2018
2 Journal of International Business and Management (JIBM)
https://rpajournals.com/jibm
Introduction Waiting in lines or queues is by all accounts a common phenomenon in the everyday lives of Bangladeshi citizens and with it happening almost every time,results in a high level of dissatisfaction amongst the customers. This problem occurs in regular day to day outlets including the bank, the supermarket checkout, barbershops, stoplights, healing facilities, and even the hospital (Shastrakar, et.al., 2017). Banks, as with other administration-based enterprises, work in inexorably focused conditions and the speed of the administration service has appeared to give organisations an upper hand in the commercial environment (Xiao & Zhang, 2009). The normal set-up in Bangladesh is that most banks do not have the office space and capabilities to benefit the number of customers and attend to their needs efficiently. (Anish, et.al., 2014). The customers of the bank are sometimes envious to receive the services after waiting a long time with same effort and mind (Aldajani, 2009). On the other hand, if the bank wants to retain the customer, they need to be very productive with zero-time wastage (Agbadudu, 1995). One reoccurring issue to note in Bangladeshi banks is the congestion saving money lobbies; this has prompted the development of customers moving from one bank to the next, where they can obtain administration services for managing accounts.
The modern-day computerisation of banks, (for example, Online Real-Time, Automated Teller Machine and so forth), is an endeavour to limit waiting times in queues but this has not as yet yielded the much-wanted outcome because of the successive breakdown of such computerised administration systems. As a result, long queues are endured in every Bangladeshi Bank. Additional time and money spent on one thing, implies less time and money for other things. The time accessible to any monetary specialist has elective uses, whether for recreation or for work (Ashley, 2006). The number of hours given to work decides a person’s wage. Aside from the circumstances of work or relaxation, financial operators, at some point, submit extensive measures of their opportunities, which may be of benefit to customers. The ordinary Bangladeshi customer sits tight for a considerable length of time to obtain the benefit, without the feeling of organised specialisms and that there is an ‘open door cost’ for the delays. It is possible that this absence of financial development in the nation is traceable to this monetary waste, and the economy will start to develop if this waste can be limited.
Queuing Systems in the Banking Sector The queuing theory is a tool of mathematical study for measuring a queue or line where the option for people waiting is available (Prieger, 2001). This theory supposes a mathematical analysis of arrival, waiting in the queue and the time to be served (Okeke, 2003; Dhari, et.al., 2013). According to (Anichebe, 2013), that queue permits the deviation and calculation of a few performance measures, including the average waiting time in the queue, service system, and server (Mala, 2016). It has an application in assorted fields, including media communications, activity building, registering and outline of plants, shops, workplaces, banks, and clinics (Sameer, 2014). A queuing model of a framework is a conceptual description whose reason for existing is to isolate those components that identify with the framework’s capacity to meet administration requests whose events and lengths are arbitrary (Janos, 2010).
The study of queues manages to evaluate the wonder of waiting in these lines utilising agent measures of execution, for example, normal queue length, normal waiting time in a queue and normal office usage (Eze & Odunukwe, 2012). A little of the examination that can be surmised using lining speculation fuses the ordinary holding time in the line, the
3 Journal of International Business and Management (JIBM)
https://rpajournals.com/jibm
typical holding time in the structure, the typical line length, the typical number of clients served at one time (Campbell & Frei, 2010), the probability of shying away, and furthermore, the probability of the system to be in certain states, for instance, void or full (Olasore, 2013). Queuing models are used to address the diverse sorts of covering structures that develop, for all intents and purposes, the models enable finding a fitting concordance between the cost of organisation and the measure of holding up (Wagner, 2007). Queuing models furnish the expert with a capable apparatus for outlining and assessing the execution of lining frameworks (Banks, et al., 2001). Any framework in which entries put requests upon limited assets are possibly named as lining frameworks, if the landing times of these requests are eccentric, or if the measure of these requests is capricious (Sedlakova, 2012). At that point, for the utilisation of the asset to emerge, the lines of waiting customers will shape, and the length of the queue relies upon two parts of the stream design: firstly, they rely upon the normal rate (Olasore, 2013); and secondly, they rely on the factual changes of this rate (Klenrock, 1975; Lazov, 2017 & Chiti, 2018).
Statement of the Problem
The undeniable cost ramifications of customer waiting times when queues develop brings about man-hour misfortune to loss of altruism, which may happen when the customer is disappointed with the framework. However, a number of customers attend the bank hoping to finish the exchange inside a specific timeframe, but in the end invest an unbelievable amount of time waiting to be served. Accordingly, this investigation endeavours to ascertain the amount of time a specific client spends in the queue in front of the bank. This will help the client to have advanced information as to what extent of time he/she is probably going to have to wait to be served in Bangladesh.
Significance of the Study Optimising the service but reducing the time of the service is an integral part for banks. The queuing theory helps in understanding the waiting lengths and times to correlate it with performance and customer satisfaction. This research can assist banks and ATMs to provide excellent services after waiting a little time and ways to retain loyal clients with the aid of looking forward to. Apart from this, the study has the following significance: 1. The consequences of delays, as set out in this paper, is helpful to separate the present
structure and upgrade the accompanying system with the bank being able to have the capacity to assess the amount of people in a queue and the amount of people that walk away each day.
2. By evaluating the number of customers going back and forth in a day, the bank can set an objective as to the number of ATMs required to serve individuals in any particular branch of the bank.
Methodology To accomplish the objectives of this study, the researchers collected all the data from selected banking institutions in Bangladesh. The strategies utilised during the information gathering process was immediate perception and individual meetings and surveys regulated by the researchers over a period of seven days. The hypotheses were made for the queuing theory and services at the Dutch Bangla Bank Limited, at the Sylhet Corporate Branch, situated in Sylhet City, Bangladesh.

4 Journal of International Business and Management (JIBM)
https://rpajournals.com/jibm
1. Passages take after Poisson probability spread at an ordinary rate of λ client per unit of time.
2. The queue works on the basis of the First-Come-First-Served (FCFS) premise, where the servers need no characterisation for any landing.
3. Organisation times are appropriated exponentially, with a typical of µ client per unit of time and no restriction on the number in the queue (unbounded).
4. Organisation rate is self-ruling of line length; authority communities do not go speedier in light of the way that the line is longer.
Theoretical Framework
To find out the research framework we explore the three sections: (1) the passage or commitments to the structure (at times suggested as the calling masses), (2) the queuing or waiting time in the queue itself, and (3) the organisation. These three fragments have certain characteristics that must be investigated before logical coating models can be made. The data source that produces sections or clients for the organisation structure has three imperative qualities. It is crucial to consider the degree of the calling people, the case of arrivals in the covering system, and the director of the passages. Population sizes are believed to be either unlimited (principal tremendous) or compelled (restricted). Characteristics of a Queuing System We investigate the three sections of queuing framework: 1. The arrival or contributions to the framework (now and then alluded to as the calling
populace) (Olasore, 1992) 2. The queue or the waiting time in the queue itself (Janos, 2010), and 3. The administration office (Iorkegh, 2012).
These three parts have certain attributes, which must be inspected before numerical lining models can be created.
Fig: 1 Components of the queuing system
The input source that generates arrivals or customers for the service system has three major characteristics. It considers the size of the population, the pattern of arrivals at the queuing system, and the behaviour of the arrivals.
Size of the Calling Population
5 Journal of International Business and Management (JIBM)
https://rpajournals.com/jibm
Populace sizes are thought to be either boundless (basic endless) or restricted (limited) (Anichebe, 2013). At the point when a service takes a little more time on the other part the number of clients increases. For thisreason, in our illustrations the restricted customer landing at the bank is for storing money. Most lining models accept such an endless calling populace (Shyfur, 2013). At the point when this isn't the situation, demonstrating turns out to be substantially more unpredictable (Bakari & Baba, 2014). The Pattern of Arrivals at the System The customer either touches base at an administration office as per some known calendar customer or else they arrive arbitrarily where landings are viewed as arbitrary when they are free of each other and their event can't be anticipated precisely (Campbell & Frei, 2010). For any given arrival rate, such as two passengers per hour, or four airplanes per minute, a discrete, Poisson distribution can be established by using the formula: 𝜌(𝑛; 𝑡) = !" !
!!𝑒!!" for n=0,1,2,…..
Where, 𝜌 𝑛; 𝑡 = probability of n arrivals 𝜆 = average arrival rate e = 2.18 n = number of arrivals per unit of time The Behavior of Arrival
Most queuing models expect that an arriving traveller is a patient explorer (Kembe, et. al., 2012). The understanding client is an individual or machine that holds up in the queue until the point they are served and do not switch between lines (Baba, et. al., 2014). Tragically, life and quantitative investigations are entangled by the way that individuals have been known to shy away or renege (Anichebe, 2013). Shying away alludes to a customer who declines to join the waiting lines since it does not suit their necessities or interests, while on the other hand, a reneging customer is the individual who enters the queue then ends up plainly anxious and leaves the requirement for the lining hypothesis and waiting in the queue investigation (Anichebe, 2013). How often have you seen a client with a wicker container overflowing with essential supplies, including perishables, for instance, depleted, hardened sustenance, or meats, fundamentally spurn the shopping crate before taking a look at it in light of the fact that the line was too long? This exorbitant occasion for the store makes heads strongly aware of the hugeness of organisation-level decisions (Aksin-Karaesmen, et. al., 2011). Waiting Line Characteristics Queue The waiting queue itself is the second part of a lining framework. The length of a queue can be either constrained or boundless (Cooper, 1972). A queue is constrained when it can't, by the law of physical limitations, increment to an interminable length;on the other hand explanatory queuing models are dealt with in this article under a supposition of boundless queue lengths(Sharma, 2013). A queue is boundless when its size is unhindered, on account of the toll-booth serving arriving vehicles (Ashley, 2000).
6 Journal of International Business and Management (JIBM)
https://rpajournals.com/jibm
Queue Discipline This alludes that if banks maintain the discipline, clients feel satisfied and benefitted. Most frameworks utilise a line train known as first in, first out (FIFO) (Hillier & Lieberman, 2007). This is clearly not appropriate in all administration frameworks, particularly those managing crises. In most expansive organisations, transaction occurred with the help of electronic device looks at are expected on a particular date, can maintain the queue discipline (Olaniyi, et. al., 2004). Service Facility The third part of any covering structure is the organisation’s office. It is crucial to take a look at two fundamental properties: (1) the setup of the organisation system and (2) the case of organisation times. Basic Queuing System Configurations Administration frameworks are normally characterised by their number of channels, number of servers, number of stages, or a number of administration stops that must be made (Ndukwe, et. al., 2011). Again, (Zhao, 2007) mentioned, the term FIFO (first in, first served) is regularly utilised as a part of the place of FIFO. Another train, LIFS (toward the end in, first served), is basic when the material is stacked or heaped and the things on top are utilised first (Chowdhury, et. al., 2013). A solitary channel framework, with one server, is encapsulated by the drive-inbank that has just a single open teller. On the other hand, the bank which has a couple of tellers on commitment and each customer sat tight in one normal line for the most promptly available teller, would have a multi-channel system at work (Zeng, 2007). Many banks today are multi-channel benefit frameworks, as are the more expansive barbershops and numerous carrier ticket counters (Ndukwe, et.al., 2011). Service Time Distribution Service designs resemble landing designs in that they can be either consistent or arbitrary (Winston Wayane, 1991). Again, it is also mentioned in this book, if organisation time is reliable, it puts aside a comparable measure of a chance to manage each customer. More frequently, advantage times are aimlessly appropriated when in doubt it can be normal that sporadic organisation times are delineated by the negative exponential probability transport (Musara&Fatoki, 2010; Guan, 2011). This is a numerically accommodating assumption if lending rates are Poisson dispersed (Goluby, 2011). The exponential scattering is key to the path toward building numerical covering models in light of the fact that an impressive part of the model speculative supporting relies upon the supposition of Poisson sections and exponential organisations (Farayibi, 2016). In any event, before they are associated, the quantitative master can and should watch, assemble, and pilot advantage time data to choose whether they fit the exponential fitting (Ogbadu & Usman, 2012). Mathematical Modelling The Single-Channel Queuing Model with Poisson Arrivals and Exponential service times (M/M/1) (Kostas, 1983; Aggrawal, Kumar, & Kumar, 2018). We present an analytical approach to determine important measures of performance in a typical service system. After these numerical measures have been computed, it will be possible to add in cost data and begin to make decisions that balance desirable service levels with waiting for line service costs.
7 Journal of International Business and Management (JIBM)
https://rpajournals.com/jibm
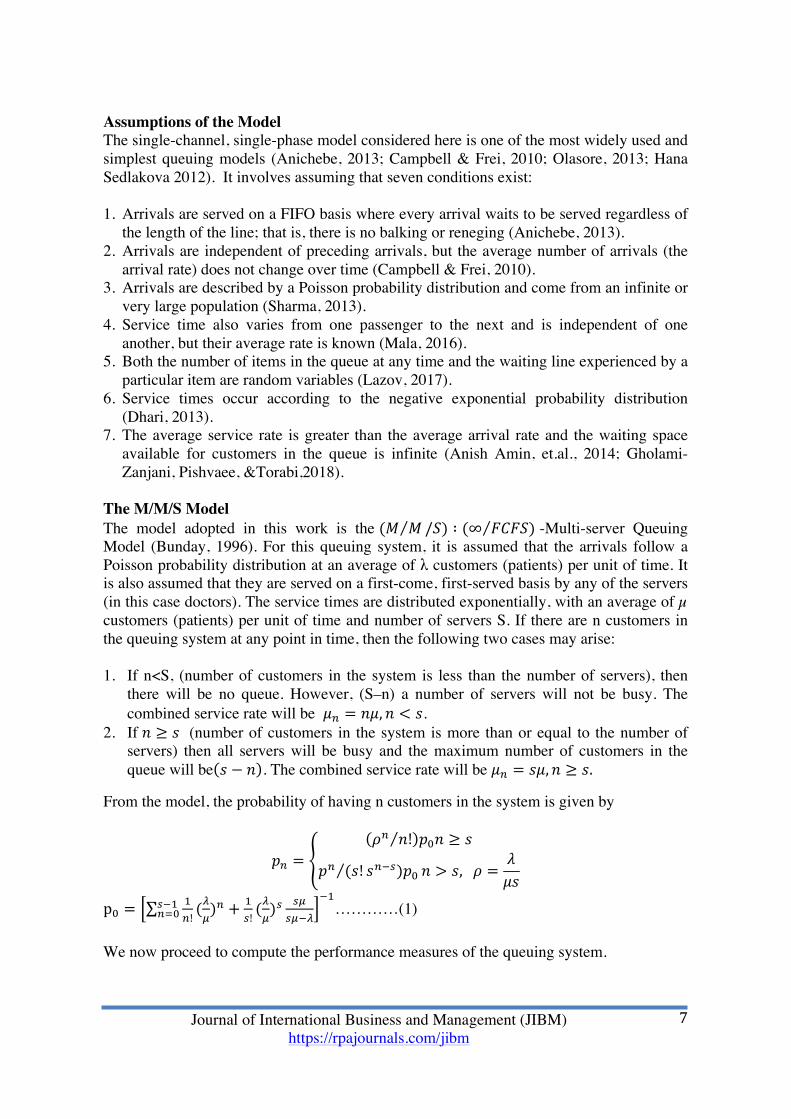
Assumptions of the Model The single-channel, single-phase model considered here is one of the most widely used and simplest queuing models (Anichebe, 2013; Campbell & Frei, 2010; Olasore, 2013; Hana Sedlakova 2012). It involves assuming that seven conditions exist: 1. Arrivals are served on a FIFO basis where every arrival waits to be served regardless of
the length of the line; that is, there is no balking or reneging (Anichebe, 2013). 2. Arrivals are independent of preceding arrivals, but the average number of arrivals (the
arrival rate) does not change over time (Campbell & Frei, 2010). 3. Arrivals are described by a Poisson probability distribution and come from an infinite or
very large population (Sharma, 2013). 4. Service time also varies from one passenger to the next and is independent of one
another, but their average rate is known (Mala, 2016). 5. Both the number of items in the queue at any time and the waiting line experienced by a
particular item are random variables (Lazov, 2017). 6. Service times occur according to the negative exponential probability distribution
(Dhari, 2013). 7. The average service rate is greater than the average arrival rate and the waiting space
available for customers in the queue is infinite (Anish Amin, et.al., 2014; Gholami-Zanjani, Pishvaee, &Torabi,2018).
The M/M/S Model The model adopted in this work is the (𝑀 𝑀 /𝑆) ∶ (∞ 𝐹𝐶𝐹𝑆) -Multi-server Queuing Model (Bunday, 1996). For this queuing system, it is assumed that the arrivals follow a Poisson probability distribution at an average of λ customers (patients) per unit of time. It is also assumed that they are served on a first-come, first-served basis by any of the servers (in this case doctors). The service times are distributed exponentially, with an average of µ customers (patients) per unit of time and number of servers S. If there are n customers in the queuing system at any point in time, then the following two cases may arise: 1. If n<S, (number of customers in the system is less than the number of servers), then
there will be no queue. However, (S–n) a number of servers will not be busy. The combined service rate will be 𝜇! = 𝑛𝜇,𝑛 < 𝑠.
2. If 𝑛 ≥ 𝑠 (number of customers in the system is more than or equal to the number of servers) then all servers will be busy and the maximum number of customers in the queue will be 𝑠 − 𝑛 . The combined service rate will be 𝜇! = 𝑠𝜇,𝑛 ≥ 𝑠.
From the model, the probability of having n customers in the system is given by
𝑝! =𝜌! 𝑛! 𝑝!𝑛 ≥ 𝑠
𝑝! (𝑠! 𝑠!!!)𝑝! 𝑛 > 𝑠, 𝜌 =𝜆𝜇𝑠
p! =!!!
!!!!!! (!
!)! + !
!!(!!)! !"
!"!!
!!…………(1)
We now proceed to compute the performance measures of the queuing system.
8 Journal of International Business and Management (JIBM)
https://rpajournals.com/jibm
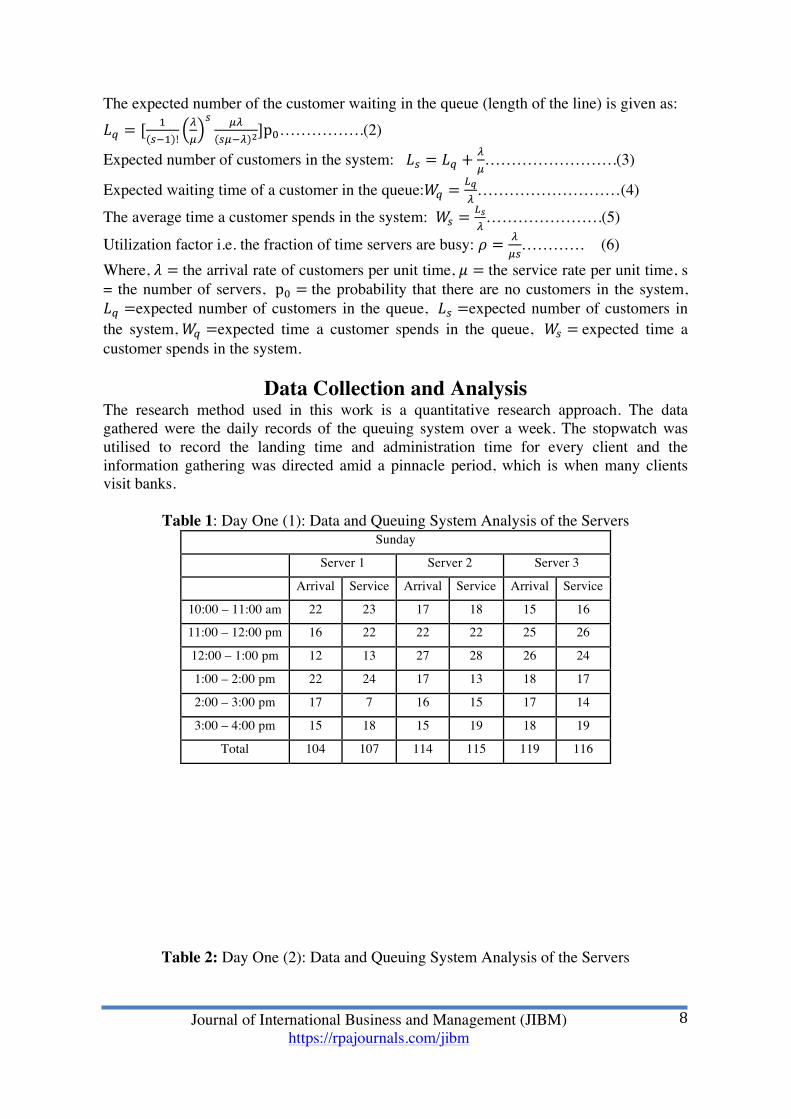
The expected number of the customer waiting in the queue (length of the line) is given as: 𝐿! = [ !
!!! !!!
! !"!"!! !]p!…………….(2)
Expected number of customers in the system: 𝐿! = 𝐿! +!!…………………….(3)
Expected waiting time of a customer in the queue:𝑊! =!!!
………………………(4)
The average time a customer spends in the system: 𝑊! =!!!
………………….(5)
Utilization factor i.e. the fraction of time servers are busy: 𝜌 = !!"
………… (6) Where, 𝜆 = the arrival rate of customers per unit time, 𝜇 = the service rate per unit time, s = the number of servers, p! = the probability that there are no customers in the system, 𝐿! =expected number of customers in the queue, 𝐿! =expected number of customers in the system, 𝑊! =expected time a customer spends in the queue, 𝑊! = expected time a customer spends in the system.
Data Collection and Analysis The research method used in this work is a quantitative research approach. The data gathered were the daily records of the queuing system over a week. The stopwatch was utilised to record the landing time and administration time for every client and the information gathering was directed amid a pinnacle period, which is when many clients visit banks.
Table 1: Day One (1): Data and Queuing System Analysis of the Servers
Sunday
Server 1 Server 2 Server 3
Arrival Service Arrival Service Arrival Service
10:00 – 11:00 am 22 23 17 18 15 16
11:00 – 12:00 pm 16 22 22 22 25 26
12:00 – 1:00 pm 12 13 27 28 26 24
1:00 – 2:00 pm 22 24 17 13 18 17
2:00 – 3:00 pm 17 7 16 15 17 14
3:00 – 4:00 pm 15 18 15 19 18 19
Total 104 107 114 115 119 116
Table 2: Day One (2): Data and Queuing System Analysis of the Servers

9 Journal of International Business and Management (JIBM)
https://rpajournals.com/jibm
Monday
Server 1 Server 2 Server 3
Arrival Service Arrival Service Arrival Service
10:00 – 11:00 am 18 13 31 33 23 25
11:00 – 12:00 pm 21 23 23 25 27 25
12:00 – 1:00 pm 22 20 26 25 12 13
1:00 – 2:00 pm 27 30 21 19 29 30
2:00 – 3:00 pm 21 23 15 15 25 26
3:00 – 4:00 pm 17 21 17 19 12 13
Total 126 130 133 136 128 132
Table 3: Day One (3): Data and Queuing System Analysis of the Servers
Tuesday
Server 1 Server 2 Server 3
Arrival Service Arrival Service Arrival Service
10:00 – 11:00 am 23 25 12 17 25 26
11:00 – 12:00 pm 37 39 27 30 21 23
12:00 – 1:00 pm 21 23 25 21 27 27
1:00 – 2:00 pm 16 18 8 8 16 14
2:00 – 3:00 pm 17 21 32 28 22 21
3:00 – 4:00 pm 8 8 26 27 17 19
Total 122 134 130 131 128 130
Table 4: Day One (4): Data and Queuing System Analysis of the Servers
Wednesday
Server 1 Server 2 Server 3
Arrival Service Arrival Service Arrival Service
10:00 – 11:00 am 22 23 24 25 14 19
11:00 – 12:00 pm 18 19 27 28 31 33
12:00 – 1:00 pm 8 10 23 23 26 26
1:00 – 2:00 pm 21 23 15 14 21 22
2:00 – 3:00 pm 35 35 25 26 18 19
3:00 – 4:00 pm 16 17 12 16 15 17
Total 120 127 126 132 125 136
Table 5: Day One (5): Data and Queuing System Analysis of the Servers
Thursday
Server 1 Server 2 Server 3
Arrival Service Arrival Service Arrival Service
10 Journal of International Business and Management (JIBM)
https://rpajournals.com/jibm
10:00 – 11:00 am 20 27 28 30 14 16
11:00 – 12:00 pm 11 10 28 31 35 35
12:00 – 1:00 pm 23 23 21 19 22 21
1:00 – 2:00 pm 35 39 16 20 17 19
2:00 – 3:00 pm 16 20 14 17 18 23
3:00 – 4:00 pm 18 11 25 27 15 14
Total 123 130 132 144 121 128
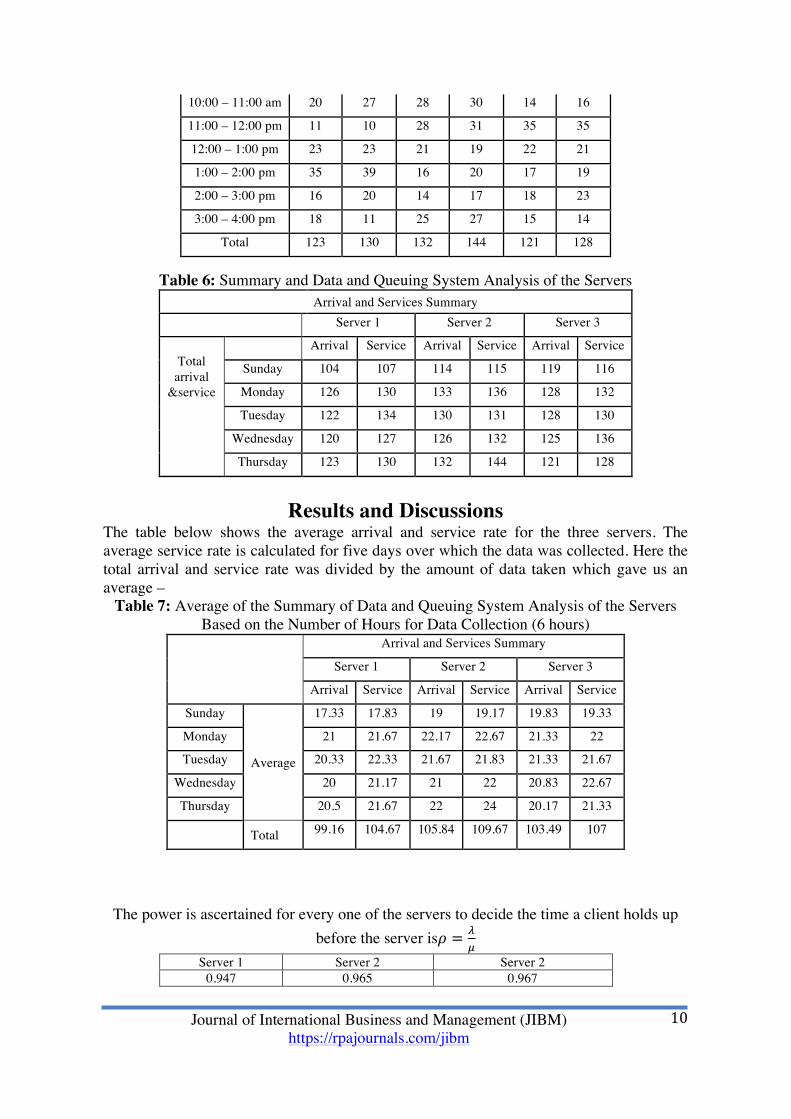
Table 6: Summary and Data and Queuing System Analysis of the Servers Arrival and Services Summary Server 1 Server 2 Server 3
Total arrival
&service
Arrival Service Arrival Service Arrival Service
Sunday 104 107 114 115 119 116
Monday 126 130 133 136 128 132
Tuesday 122 134 130 131 128 130
Wednesday 120 127 126 132 125 136
Thursday 123 130 132 144 121 128
Results and Discussions
The table below shows the average arrival and service rate for the three servers. The average service rate is calculated for five days over which the data was collected. Here the total arrival and service rate was divided by the amount of data taken which gave us an average –
Table 7: Average of the Summary of Data and Queuing System Analysis of the Servers Based on the Number of Hours for Data Collection (6 hours)
Arrival and Services Summary
Server 1 Server 2 Server 3
Arrival Service Arrival Service Arrival Service
Sunday
Average
17.33 17.83 19 19.17 19.83 19.33
Monday 21 21.67 22.17 22.67 21.33 22
Tuesday 20.33 22.33 21.67 21.83 21.33 21.67
Wednesday 20 21.17 21 22 20.83 22.67
Thursday 20.5 21.67 22 24 20.17 21.33
Total 99.16 104.67 105.84 109.67 103.49 107
The power is ascertained for every one of the servers to decide the time a client holds up
before the server is𝜌 = !!
Server 1 Server 2 Server 2 0.947 0.965 0.967
11 Journal of International Business and Management (JIBM)
https://rpajournals.com/jibm
Average time spent in the system: 𝑊! =
!!!= !
!!!
Server 1 Server 2 Server 2
0.181hours 0.261 hours 0.285 hours 10.89 minutes 15.67 minutes 17.09 minutes
The average total unit spent in the system by the 3 servers is !".!"!!".!"!!".!"
!= 14.55.
Therefore, the total expected time a customer is likely to spend in the system (queue time + service time) in Bangladesh is 14.55 minutes. In view of our examinations, we consider that citizens of Bangladesh should be aware that they are likely to spend up to 14.55 minutes whenever they attend to carry out a transaction at a bank. Our findings also report that improving customer management could significantly improve economic and social benefits, a theory which is also supported from the research of (Fomundam & Herrmann, 2007; Patel, 2012; Heizer, 2016 and Porter & Kramer 2018). To understand how to improve service efficiency and minimise the timeframe of services, it is necessary to use the queuing theory to develop a queuing model to optimise the services in banks, which is also supported from the research of (Nan, et. al., 2011; Gholami-Zanjani, et. al., 2018 and Aggrawal, et. al., 2018).
Research Limitations and Directions for Future Research
Those values that we contemplated, for example, waiting time and service efficiency, and those rates and numbers of clients using the queues, is all an assumption. As such, in future, obtaining real time qualities would be preferable to estimates. Then again, there are numerous research opportunities and updates that can be produced within the waiting line framework proposed in this paper. To decide on the accomplishment of the associations or the people in accomplishing their goals and techniques, performance management can be utilised in future research works (Dimovski, et, al, 2005).
Conclusion Waiting times in queues is something that should be overseen properly, particularly in keeping money division. We have highlighted how banks, with particular investigations, can identify the significance of customer anxiety with regard to waiting times. Having reviewed the service quality, customer satisfaction, and ways of handling waiting lines of customers, it appears obvious to focus more emphasis on creating theoretical frameworks and practical guidelines for service quality and customer satisfaction in banks. The theory of waiting times in queues, as a quantitative approach, has to be given a try by the profession. Some possible ways of approaching the problems of waiting line times, based on theory and psychology, are: (i) the provision for reservations; (ii) ensure waiting is a comfortable and less painful activity; and (iii) reduce the perception of actual waiting times and increase the expectation of waiting. Management of any organisation should know that when an object or a person is idle in a queue there is always some cost involved. They should also be aware that in trying to increase the service facilities, the greater the service facility will be and the quicker the queue will disappear. In general, the queuing theory is worth studying to enable the business executives to determine and install the optimum service facilities so that the overall service cost and time is minimised.
12 Journal of International Business and Management (JIBM)
https://rpajournals.com/jibm
References
Agbadudu, A.B. (1996). Elementary Operation Research. Benin City, A.B. Mudiaga Limited.
Akşin, Z., Ata, B., Emadi, S. M., & Su, C. L. (2011). Structural Estimation of Callers Delay Sensitivity in Call Centers. International Journal Service & Industrial. Management, 6 (1), 42 -53.
Akşin, Z., Ata, B., Emadi, S. M., & Su, C. L. (2013). Structural estimation of callers' delay sensitivity in call centers. Management Science, 59(12), 2727-2746.
Aldajani, M. A., & Alfares, H. K. (2009). Location of banking automatic teller machines based on convolution. Computers & Industrial Engineering, 57(4), 1194-1201.
Amin, A., Mehta, P., Sahay, A., Kumar, P., & Kumar, A. (2014). Optimal solution of real time problems using Queueing Theory. International Journal of Engineering and Innovative Technology (IJEIT), 3(10), 268-270.
Anichebe, A. (2013). Queuing Model as a Technique of Queue Solution in Nigeria Banking Industry. Developing Country Studies, 3(8), 34-42.
Ashley, D. W. (2000). Introduction to waiting line models. Encyclopaedia of library and information science, 60.
Ashley, R. L., Militoni, J., Lee, F., Nahmias, A., & Corey, L. (1988). Comparison of Western blot (immunoblot) and glycoprotein G-specific immunodot enzyme assay for detecting antibodies to herpes simplex virus types 1 and 2 in human era. Journal of clinical microbiology, 26(4), 662-667.
Augustine, A. (2013). Queuing model as a technique of queue solution in Nigeria banking industry. Developing Countries Study, 3(8), 2225-0565.
Bakari, H. R., Chamalwa, H. A., & Baba, A. M. (2014). Queuing process and its application to customer service delivery (A case study of Fidelity Bank Plc, Maiduguri). International Journal of Mathematics and Statistics Invention, 2(1), 14-21.
Banks, J., Carson, JS, Nelson, BL, & Nicol, DM (2001). DiscreteEvent System Simulati on,(3rd Edition). London: Prentice Hall International Series
Bunday, B. D. (1996). An Introduction to Queuing Theory, New York: Halsted Press, Davis MM.
Campbell, D. and Frei, F. (2010). Market Heterogeneity and Local Capacity Decisions in Services. Manufacturing & Service Operations Management Research, 5 (1),31-41.
Chiti, F., Fantacci, R., & Rizzo, A. (2018). An integrated software platform for airport queues prediction with application to resources management. Journal of Air Transport Management, 67, 11-18.
Chowdhury M. S. R., Rahman M. T. and Kabir M. R. (2013). Solving Of Waiting Lines Models in the Bank Using Queuing Theory Model the Practice Case: Islamic Bank Bangladesh Limited, Chawkbazar Branch, Chittagong”, IOSR Journal of Business and Management (IOSR-JBM), 10(1), 22-29.
Cooper, R.B. (1972). Introduction to Queuing Theory, New York, Macmillan. Dhar, S. K., & Rahman, T. (2013). Case study for bank ATM queuing model. IOSR
journal of Mathematics, 7(1), 01-05. Dimovski, V., Škerlavaj, M. (2005), Performance Effects of Organizational Learning in a
Transitional Economy, Problems and Perspectives in Management, 4.
13 Journal of International Business and Management (JIBM)
https://rpajournals.com/jibm
Eze, E. O., & Odunukwe, A. D. (2013). Application of Queuing Model to Customers Management in the Banking System. International Journal of Engineering (Unpublished).
Farayibi, A. O. (2016). Investigating the Application of Queue Theory in the Nigerian Banking System. Flaherty, K. T., Infante, J. R., Daud, A., Gonzalez, R., Kefford, R. F., Sosman, J., &
Kudchadkar, R. (2012). Combined BRAF and MEK inhibition in melanoma with BRAF V600 mutations. New England Journal of Medicine, 367(18), 1694-1703.
Fomundam, S., & Herrmann, J. W. (2007). A survey of queuing theory applications in healthcare.
Gholami-Zanjani, S. M., Pishvaee, M. S., & Torabi, S. A. (2018). OR Models for Emergency Medical Service (EMS) Management. In Operations Research Applications in Health Care Management (pp. 395-421). Springer, Cham.
Golub, B., & McAfee, R. P. (2011). Firms, queues, and coffee breaks: a flow model of corporate activity with delays. Review of Economic Design, 15(1), 59-89.
Hana Sedlakova (2012). Priority Queuing Systems M/G/I”, Thesis, University of West Bohemia.
Hillier, F. S., & Lieberman, G.J. (2007). Introduction to Operations Research, Tata Mc- Graw Hill, 8th Edition.
Janos, S. (2010). Queuing Theory and its Application: A Personal view. 8th International Conference on Applied Informatics, Eger: Hungary, 1, 9-30,
Jay, H., & Barry, R. (2016). Operations Management. Pearson India. Kembe, M. M., Onah, E. S., & Iorkegh, S. (2012). A study of waiting and service costs
of a multi-server queuing model in a specialist hospital. International Journal of Scientific & Technology Research, 1(8), 19-23.
Kleinrock, L., & Tobagi, F. (1975). Packet switching in radio channels: Part I—Carrier sense multiple-access modes and their throughput-delay characteristics. IEEE Transactions on Communications, 23(12), 1400-1416.
Kostas, U. N. (1983). Introduction to theory of Statistics, Mc-Gram Hill, Tokyo. Lazov, I. (2017). Information analysis of queueing systems. International Journal of
General Systems, 46(6), 616-639. Mala & Varma S.P. (2016). Minimization of Traffic Congestion by Using Queuing
Theory. IOSR Journal of Mathematics, 12(1), 116-122. Musara, M., & Fatoki, O. (2010). Has technological innovations resulted in increased
efficiency and cost savings for banks’ customers?” African Journal of Business Management, 4(9), 1813-1821.
Nan, R., WEN, X. M., & WU, A. H. (2007). Study on the changing trends in national nosocomial infection transection investigation results [J]. Chinese Journal of Infection Control, 1, 004.
Ndukwe, H.C., Omale, S., & Opanuga O.O (2011). Reducing Queues in Nigerian Bank Pharmacy. African Journal of pharmacy and pharmacology, 5(8), 1020-1026.
Ogbadu & Usman, (2012). Imperatives of Customer Relationship Management in Nigeria Banking Industry. Kuwait Chapter of Arabian Journal of Business and Management Review, 2(1), 123-132.
Okeke, A.O. (2003). Quantitative Methods for Business Decisions Enugu, Macro Academic Publishers.

14 Journal of International Business and Management (JIBM)
https://rpajournals.com/jibm
Olaniyi, T.A. (2004). An Appraisal of Cost of Queuing in Nigerian Banking Sector: A Case Study of First Bank of Nigeria Plc, Ilorin. Journal of Business & Social Sciences. 9 (1&2), 139-145.
Olasore, O. (1992). Nigeria Baking and Economic Management. Journal of the Nigeria Institute of Bankers, 3, 8-13.
Owen-Ashley, N. T., Turner, M., Hahn, T. P., & Wingfield, J. C. (2006). Hormonal, behavioral, and thermoregulatory responses to bacterial lipopolysaccharide in captive and free-living white-crowned sparrows (Zonotrichia leucophrys gambelii). Hormones and behavior, 49(1), 15-29.
Patel, B., & Bhathawala, P. (2012). Case study for bank ATM queuing model. International Journal of Engineering Research and Applications (IJERA), 2(5).
Porter & Kramer. (2006). The challenging transition to bio-economies: Towards a new framework integrating corporate sustainability and value co-creation. Journal of Cleaner Production, 172, 4001-4009.
Prieger, J. E. (2005). Estimation of a simple queuing system with units-in-service and complete data (No. 05, 35). Working papers//University of California, Department of Economics.
Sharma, J. K (2013). Operations Research – Theory and Application. Macmillan Publishers, 559-61.
Shastrakar D. F., & Pokley S.S. (2017). Analysis of Different Parameters of Queuing Theory for the Waiting Time of Patients in Hospital. International Conference On Emanations in Modern Engineering Science and Management,5(3), 98-100.
Shastrakar D. F., Pokley S.S., & Patil K.D. (2016). Literature Review of Waiting Lines Theory and its Applications in Queuing Model. International Journal of Engineering Research and Technology, 13-15.
Shujauddin, S. S. (2014). Simulation: Analysis of Single Server Queuing Model. International Journal on Information Theory (IJIT), 3(3), 47-54.
Shyfur, M. (2013). Solving Of Waiting Lines Models in the Bank Using Queuing Theory Model the Practice Case: Islami Bank Bangladesh Limited, Chawk Bazar Branch, Chittagong. Journal of Business and Management, 10(1), 22- 29.
Singh, R. D., Nigam, S., Sagar Aggrawal, M., Neelgar, R., Kaura, S., & Sharma, K. (2018). Design and implementation of automatic car washing system using PLC.
Wagner, H. M. (1975). The principle of Operations Research with Applications to Managerial Decision. India: Asoke K. Glosh Inc.
Wayane, L. W. (1991). Operations research: applications and algorithms. Boston, Pws- Kent.
Xiao, H. & Zhang, G. (2009). The queuing theory application in bank service optimization. Institute of Information & System Engineering, Henan University of Finance & Economics, Zhengzhou.
Zeng, H. (2007). Queue based on the cost of distribution systems”, Journal of Wuhan University of Science and Technology, 30(3), 330-332.
Zhao, X. X. (2007). Queuing theory with the bank management innovation. Modern Finance, 3, 9-10.


![The Solar System’s Motion in the Galactic Tidal Field 597[3].pdfThe Solar System’s Motion in the Galactic Tidal Field ... parameters for the solar system’s motion were taken](https://img.pdfslide.us/doc/110x75/5ab63e5c7f8b9a1a048d9cc1/the-solar-systems-motion-in-the-galactic-tidal-field-5973pdfthe-solar-systems.jpg)