Embed Size (px)
Citation preview

University of Castilla-La Mancha
PhD in Economics and Business
Doctoral Thesis
Analysis of consumer behaviour in food consumption decision processes: Evidence found in fast food
restaurants in Mexico.
Presented by Héctor Hugo Pérez Villarreal
Supervisors: Dr. María Pilar Martínez Ruiz
Dr. Alicia Izquierdo Yusta
October 2019


To all the people who ever believed in me.


Acknowledgement
I would first like to thank my thesis advisors Pilar and Alicia, for their
motivation, knowledge and support this Doctoral Thesis. Additionally,
thank you so much for teaching me to see life differently.
I would also like to thank the experts who were involved in the process for
this research project: Daría and Igor, with their passionate participation
and input for the first study of this Thesis.
Likewise, I would like to thank Carlos and Lisa for helping me with some
ideas to continue this research. Thanks for their hospitality in my stay of
research at Kedge Business School.
I would like to express my gratitude to UPAEP University and Fondo
Concursable with the financial aid in these five years of this program.
Also, to Becas Santander to believe in my project and help me in the same
way.
Finally, I must express my very profound gratitude to my parents, brother
and sisters for providing me with unfailing support and continuous
encouragement throughout my years of study. This accomplishment would
not have been possible without them.
Thank you.


“If you want to go fast, go alone. If you want to go far, go together.”
African Proverb


Index
Chapter 1. Introduction ................................................................................................ 1
1.1 Introduction ................................................................................................... 3
1.2 Justification ................................................................................................... 5
1.3 Objectives ..................................................................................................... 9
1.4 Doctoral Thesis Organization ..................................................................... 11
1.5 References ................................................................................................... 13
Chapter 2. Identifying research topics in marketing science along the past decade: a content analysis .......................................................................................................... 23
2.1 Introduction ................................................................................................. 27
2.2 Literature Review ....................................................................................... 31
2.3 Methodology ............................................................................................... 33
2.3.1 Data collection ........................................................................... 34
2.3.2 Properties of the dataset ............................................................. 40
2.3.3 Multivariate methods (CA and MFACT) .................................. 42
2.3.3.1 Types of results .................................................................. 43
2.3.4 Characteristic words and abstracts ............................................ 44
2.3.5 Statistical software ..................................................................... 46
2.4 Results ......................................................................................................... 46
2.4.1 Glossary of most frequent terms ................................................ 46
2.4.2 Most relevant topics and its related abstracts ............................ 50
2.4.3 Chronological evolution ............................................................ 57
2.4.4 How has the vocabulary evolved over time? ............................. 58

2.5 Discussion and Limitations ......................................................................... 63
2.6 References ................................................................................................... 66
Chapter 3. Food values, benefits and their influence on attitudes and intention to buy hamburgers: Evidence obtained in Mexico ................................................................ 71
3.1 Introduction ................................................................................................. 75
3.2 Conceptual Framework ............................................................................... 78
3.2.1 Food values and benefits ............................................................ 78
3.2.2. Attitudes and intention .............................................................. 81
3.2.3. Hypotheses ................................................................................ 83
3.3 Methodology ............................................................................................... 86
3.4 Analysis ....................................................................................................... 87
3.5 Conclusions ................................................................................................. 94
3.6 References ................................................................................................... 97
Chapter 4. Testing Model of Purchase Intention for Fast Food in Mexico: How do Consumers React to Food Values, Positive Anticipated Emotions, Attitude toward the Brand, and Attitude toward Eating Hamburgers? ..................................................... 113
4.1 Introduction ............................................................................................... 117
4.1.1 Attitudes in consumer behavior ............................................... 119
4.1.2 Purchase intention .................................................................... 121
4.1.3 Food values .............................................................................. 122
4.1.4 Anticipated emotions ............................................................... 124
4.2 Materials and Methods .............................................................................. 127
4.2.1 Data collection ......................................................................... 128
4.2.2 Statistics analysis ..................................................................... 129

4.2.3 Questionnaire development ..................................................... 129
4.3 Results ....................................................................................................... 133
4.4 Discussion ................................................................................................. 140
4.4.1 Limitations and future orientations .......................................... 142
4.5 Conclusions ............................................................................................... 142
4.6 References ................................................................................................. 144
Chapter 5. Discussions ............................................................................................. 159
5.1 Discussions ............................................................................................... 161
5.2 Business implications ............................................................................... 166
5.3 Future lines of study ................................................................................. 167
Appendices ............................................................................................................... 169
Appendice 1. Survey A ............................................................................................ 171
Appendice 2. Survey B ............................................................................................. 177
Appendice 3. Publications ........................................................................................ 183
Appendice 4. Impact factor ...................................................................................... 221


Table index
Table 2.1 Impact Factor JCR Marketing Category .................................................... 29
Table 2.2 JMR Articles by Issue and Year ................................................................. 36
Table 2.3 JM Articles by Issue and Year ................................................................... 38
Table 2.4 Descriptive Statistics of the Dataset under Analysis .................................. 40
Table 2.5 List of the 25 Most Frequent Terms ........................................................... 48
Table 2.6 Main Topic ................................................................................................. 53
Table 2.7 Distribution of Abstracts/Words ................................................................ 56
Table 2.8 Eigenvalues for First Five Components ..................................................... 58
Table 2.9 Characteristic Words by Period ................................................................. 61
Table 3.1 Technical details of the research ................................................................ 87
Table 3.2 Sample characteristics ................................................................................ 88
Table 3.3 Construct reliability and validity ................................................................ 89
Table 3.4 Discriminant validity .................................................................................. 90
Table 3.5 Path coefficients ......................................................................................... 90
Table 3.6 Variables and measure ............................................................................. 110
Table 4.1 Technical details ....................................................................................... 128
Table 4.2 Questionnaire sections ............................................................................. 130
Table 4.3 Validity testing ......................................................................................... 134
Table 4.4 Association testing ................................................................................... 135
Table 4.5 Hypothesis testing and path coefficients .................................................. 137


Figure Index
Figure 1.1 Doctoral Thesis Organization ................................................................... 12
Figure 2.1 Five-step methodology applied to this research ....................................... 33
Figure 2.2 Published articles in JMR and JM by country, from 2005 to 2014 .......... 34
Figure 2.3 Published articles in JMR and JM by year, from 2005 to 2014 ................ 35
Figure 2.4 Most contributory abstracts / words (CA) ................................................ 51
Figure 2.5 Visual representation of years and words (MFACT) ................................ 60
Figure 2.6 Periods of evolution for the vocabulary in the first MFACT plane .......... 62
Figure 3.1 Model development .................................................................................. 86
Figure 3.2 Structural model ........................................................................................ 91
Figure 4.1 Model development ................................................................................ 127
Figure 4.2 PLS analysis results ................................................................................ 139


Chapter 1. Introduction


Chapter 1. Introduction
1.1 Introduction
The food sector is one of the most important economic areas in the world (Gerbens-
Leenes, Nonhebel, & Krol, 2010; Xue et al., 2017). Its relevance will continue to
increase in the coming years, which is leading those responsible for the management
processes of this sector to continually seek sustainable growth strategies that allow
competitiveness and long-term survival (Marques, Fuinhas, & Pais, 2018). For
example, it is worth mentioning that around 2050, it is estimated that it will be
necessary to produce and market around 60% more food for some 9 billion people
(FAO, 2019). Food chains have had their growth and international expansion in recent
decades due to the saturation of the national market and the desire to seek more
attractive markets (Aruoma, 2019).
Considering the fast food sector, two aspects must be highlighted: on the one hand, the
strong expansion that the sector has had, being at this moment a very atomized sector
with a strong predominance of some brands over others (Chang & Meyerhoefer, 2019);
and on the other hand, a considerable increase in the consumption of this category of
foods since they have been able to adapt to the needs of the consumer, for example,
introducing healthier products (Lazzarini, Zimmermann, Visschers, & Siegrist, 2016).
In relation to the first aspect, this growth is due: (1) because the brands with the highest
market share have developed strategies taking into account new trends in consumer
habits (Horvat, Granato, Fogliano, & Luning, 2019); and (2) although this dominant
position is a strong barrier to entry, it allows small companies to gain access to a niche
market, thus becoming a highly atomized sector (Kotabe & Kothari, 2016).
Globally, fast food generates revenue of over $570 billion usd - that is bigger than the
economic value of most countries. According to a report from Zion Market Research
3

Doctoral Thesis
Héctor Hugo Pérez Villarreal
the global fast food market is expected to be worth more than $690 billion usd in 2022
with a compound annual growth rate of 4.2% from 2017 to 2022 (Zion Market
Research, 2019). The market was capitalized at over $539 billion usd in 2016 (Zion
Market Research, 2019). In addition to growth in sales from drive-thrus, the adoption
of Western fast food in emerging economies is expected to help grow this market
further (Zion Market Research, 2019). Also more hectic lifestyles among dual-income
households and an increased preference for cheap food with no waiting time, in
addition, is expected to positively impact fast food growth, but a shift in preference for
natural and healthy food due to the rising occurrence of obesity in developed countries
could negatively impact the growth of fast food, according to the report (Zion Market
Research, 2019).
However, the sector has been able to adapt to these changes. This evolution reflects an
industry that has responded to changing consumer tastes. Numerous fast food
restaurants are paying attention to the study, evaluation and implementation of
marketing strategies to obtain maximum market share from customers and improve
customer retention to increase the financial performance of the organization (Meghisan
& Meghisan, 2012). This fact has been accentuated by (1) new trends of healthy
consumption, respectful with the environment (Lazzarini et al., 2016); and (2) studies
that show that fast food is not healthy food, causing obesity, heart attacks, etc. (Hobbs
et al., 2019).
Finally, the consumption of food, especially fast food, is characterized by stimulating
values, emotions and attitudes that lead to the construction of the intention to buy a
product (De Wijk et al., 2019; Giraldo, Buodo, & Sarlo, 2019; Gutjar et al., 2015;
Tamuliene, 2015). But at the same time it is one of the sectors that consider the
consumer as a challenge, since it is difficult to know its decision process; for the reason
4

Chapter 1. Introduction
of belonging to a sector of massive consumption and low participation (Hsieh &
Chang, 2004; Rivaroli, Baldi, & Spadoni, 2020), without taking into account the
variables that give origin to the purchase intention (Yadav & Pathak, 2016). Therefore,
before consuming a particular fast food brand, the consumer already has the desire to
get it (e.g. McDonald's, Burgen King, KFC, Subway) (Pleshko, 2009; Terblanche &
Boshoff, 2010).
1.2 Justification
Over time, consumer behaviour has undergone significant changes, approaches and
research interests in the field of marketing, since the consumer belongs to one of the
indispensable elements for the existence of marketing (Kumar, 2015). Considering that
the marketing science is constantly evolving, it is of strategic importance to explore
feasible changes and trends that may occur in the future. Technology-enabled market
research involves relevant quantitative methods that enable the retrieval of consistent
sequential information from massive datasets quickly and accurately (Carolan, 2018;
Wang, Bradlow, & George, 2014). In this sense, it is also relevant to investigate the
triggers that create advances in the evolution of this discipline (Kumar, 2015). Within
marketing research, the key idea is to investigate the differences between topics, a
topic that has been of interest to the most prestigious marketing journals of the last
decade (Polonsky, Kay, & Ringer, 2013).
On the other hand, the growing interest in exploring consumer behaviour in relation to
food decision-making processes is also a relevant phenomenon (Rana & Paul, 2017).
Today, it cannot be denied that food industry companies recognize that understanding
the food values that influence consumer decision-making processes is key to success
in competitive food markets (Enneking, Neumann, & Henneberg, 2007; Estiri, 5

Doctoral Thesis
Héctor Hugo Pérez Villarreal
Hasangholi, Yazdani, Nejad, & Rayej, 2010). Indeed, as suggested by Grunert &
Grunert (2006), among the competencies that can increase the level of market
orientation by food channel members is their search for competitive advantages and
the development of consumer understanding. Especially because this understanding is
the key to properly managing relationships with consumers throughout the food
decision-making processes. Therefore, it is not surprising that the companies in this
industry propose to establish strategies to better understand the purchasing behaviour
of consumers (Diaz-Osborn & Osborn, 2016).
In the field of food consumption, one of the trends that draw attention is the
proliferation of consumption of a type of food that has not ceased to gain importance
globally, and that can be considered as the fastest-growing fast food category among
sectors (Goyal & Singh, 2007). This allows us to affirm that the growing consumption
of fast food is an international trend (Belasco, 2014). This growing consumption is
explained by different factors: on the one hand, because competition in this area is
increasing and companies want to have a larger market share and a better positioning
before consumers; but also, on the other hand, by changes in consumer lifestyles
(Belasco, 2014); and demographic growth, in terms of number of people, per capita
income of the city, education and GDP (Beatriz Madeira & Giampaoli, 2017). Then,
since the early 1980s, a large number of publications have been published on the fast
food industry in general (cf. Mcneal, Stem, & Nelson, 1980); more recently a growing
focus on consumption analysis in fast food restaurants (Ghoochani, Torabi, Hojjati,
Ghanian, & Kitterlin, 2018).
Research on consumer behaviour has been very important in order to meet the main
objective of marketing, which is to satisfying consumers needs profitably. This
purpose is affected above all by the importance of decision processes before making
6

Chapter 1. Introduction
the purchase or consumption, which is where the need arises. In this case the
interaction of cognitive, affective and conative processes are crucial to establish new
models of decision-making processes based on the changes and evolutions of thinking,
feeling and acting of consumers with respect to food consumption (Gillespie,
Muehling, & Kareklas, 2018; Hwang, Yoon, & Park, 2011).
When consumers make a decision it has always been investigated whether these
decisions were made on the rational side or on the emotional side. Therefore, from this
premise, research towards the knowledge of purchasing decision models has been
fundamental as starting points. Thus, fast food consumers have had to incorporate
rational and emotional variables in the decision-making processes. The interaction of
the right and left brain converges towards the final evaluation of the decision making
of the food consumption (Pentikäinen, Arvola, Karhunen, & Pennanen, 2018).
Therefore, the importance of creating new models of pre-purchase behaviour in fast
food consumption is highlighted.
An essential aspect to highlight is that the attributes of food have become food values.
To initiate this discussion the values of food will be treated according to Lusk (2011).
These are: 1) naturalness, 2) taste, 3) price, 4) safety, 5) convenience, 6) nutrition, 7)
tradition, 8) origin, 9) fair trade, 10) appearance and 11) environmental impact.
The importance of addressing previous studies as primary results of empirical research
will generate a new contribution to the construction of innovative scales based on
hedonic and utilitarian benefits and the effects on the attitudes and purchasing
intentions of fast food consumers (Crowley, Spangenberg, & Hughes, 1992).
On the other hand, the emotions that interact in the purchasing decision process have
been fundamental for the detection of the need (Bagozzi, Dholakia, & Basuroy, 2003).
7

Doctoral Thesis
Héctor Hugo Pérez Villarreal
In this step, the emotions emitted before, during and after consumption have been
studied by some theorists (De Wijk et al., 2019). The incorporation of emotions into
consumer pre-purchase models is highly questioned, from the point of view of the
evolution of emotions and the different factors that can modify them. However, the
identification of emotions by consumers has come to prevail as one of the forms of
assessment within needs (Small & Verrochi, 2009). To mention some positive ones,
such as content, surprise, exciting, proud, satisfied, safe, happy, relieved; or negative
ones such as: angry, frustrated, guilty, ashamed, depressed, bored, uncomfortable,
anxious, agitated, nervous, among others.
The theoretical aspect of this research is crucial because it is necessary to investigate
and analyze the different theories, models and theoretical antecedents of consumer
behavior related to food consumption. The research framework will help to raise new
questions and new insights into the fast food industry. Thus, these requirements will
allow companies to understand in greater detail the needs of consumers in order to
provide greater satisfaction. What better research than to start from the origin of the
need to the evaluation processes before obtaining the purchase and consumption of
food.
As a final point, this research is based on different theories about consumer behavior
and emotional marketing. Each stage of the research process will be an essential part
of the integration of the model according to the results of the research. Therefore, this
research has to determine the values of food, benefits, emotions and attitudes according
to the purchase of fast food.
8

Chapter 1. Introduction
1.3 Objetives
In consideration of this growing interest, this research will focus on analyzing the
decision process of consuming a specific type of fast food such as hamburgers.
Specifically, this research aims to examine the effect of food values and related
benefits (both hedonic and utilitarian) on attitudes towards hamburger consumption in
fast food restaurants; and to assess the influence of attitudes and benefits (both hedonic
and utilitarian) related to food values on food purchasing intentions. Food choice
decisions are complicated when everyday consumers make many decisions about a
better choice of fast food (Manan, 2016). In recent years, some studies have aimed
primarily to explain how interaction events affect purchase intent through the theory
of planned behaviour (TPB) (Chen & Lu, 2011; Liu, Lin, & Feng, 2018; Yuzhanin &
Fisher, 2016). However, none focused on food values, especially when research
focused on food choice and anticipated positive emotions as a central variable in the
model. Taking into account all these changes, the objective of this Doctoral Thesis is
to analyze the current consumer's behavior with respect to food consumption. In order
to make a broader approach to the object of study, this analysis has been conducted
considering variables of very diverse nature (e.g. variables of values, emotions,
attitudes, purchasing intentions, etc.) in the fast food format. Therefore, this research
is based on the purpose of explaining purchase intent through different additions of
variables in different models. As a result, the objectives are presented:
General objective
- Analyze consumer behavior in the decision process of fast food consumption in
Mexico.
Specific Objectives
9

Doctoral Thesis
Héctor Hugo Pérez Villarreal
- Identify research topics according to the marketing discipline, and determine the
positioning of food-related topics. Specifically, it aims to answer, among others, the
following questions: How is vocabulary commonly used in marketing science? What
are the most relevant issues of these journals? Which articles are the most influential?
Which words do the authors prefer? Is the consumer one of the main topics in
marketing research?
- Analyze consumer behavior in relation to food consumption in fast food restaurants,
paying special attention to pre-decision variables such as: food values, utilitarian
benefits, hedonic benefits, attitude toward eating. In particular, a model is
implemented to explain purchase intention based on the following questions: What is
the effect of food values and benefits (both utilitarian and hedonic) on attitudes toward
eating hamburgers in fast food restaurants? What is the influence of attitudes and
benefits (both utilitarian and hedonic) on intentions to consume this type of food?
- Analyze consumer behavior related to fast food consumption, with emphasis on a
deeper approach from previous research models, such as: food values, anticipated
consumer emotions, attitude toward eating and attitude toward the brand. Adding a
model with greater prediction in the intention to buy from the following prerogatives:
Which variables influence the intention to buy of consumers, taking into consideration
the effect of food values, positive anticipated emotions, attitude toward the brand, and
attitude toward eating hamburgers, on the intention to buy fast food?
On the other hand, the results obtained will help to validate the proposed theoretical
model. The practice of the results will be reflected in the recommendations for the food
sector, as well as for the specific sectors of restaurants and food retailing. It will also
cover different approaches to research and product development, as well as the
10

Chapter 1. Introduction
processes of consumer behaviour in fast food restaurants. The management proposal
to create advantages before producing the product will be addressed in this research.
And finally, key actions or activities will be determined to plan goals in the analysis
of consumer behaviour. The discussions will be motivated to provide brands with fast
food decision making to help them achieve their organizational goals.
1.4 Doctoral Thesis Organization
This research is presented in five chapters. Chapter 1 will contextualize the research
by detailing the introduction, justification, objectives, and work plan. Chapter 2
provides an analysis of the evolution of knowledge and trends in marketing research.
Chapter 3 proposes the first approach to one objective of the study with the exploration
of food values towards the adaptation of utilitarian and hedonic benefits to the
purchase intention. Chapter 4 offers another approach with the inclusion of two
different consumer attitudes through the determination of emotions and food values in
the pre-purchase of fast food. Chapter 5 presents the discussions (See Figure 1.1).
11

Doctoral Thesis
Héctor Hugo Pérez Villarreal
Figure 1.1 Doctoral Thesis Organization
Chapter 1. Introduction
Chapter 2. Identifying reseach topics in marketing science along
the past decade: a content analysis.
Chapter 3. Food values, benefits and their influence on attitudes and intention to buy hamburgers: evidences obtained in Mexico.
Chapter 4. Testing Model of Purchase Intention for Fast Food in Mexico: How do Consumers React
to Food Values, Positive Anticipated Emotions, Attitude toward the Brand, and Attitude toward Eating Hamburgers?
Chapter 5. Discussions
12

Chapter 1. Introduction
1.5 References
Aruoma, O. I. (2019). Chapter 35—World Trade Organization and food regulation:
Impact on the food supply chain. In D. Bagchi (Ed.), Nutraceutical and
Functional Food Regulations in the United States and around the World
(Third Edition) (Third Edition, pp. 575–586). https://doi.org/10.1016/B978-0-
12-816467-9.00035-6
Bagozzi, R. P., Dholakia, U. M., & Basuroy, S. (2003). How effortful decisions get
enacted: The motivating role of decision processes, desires, and anticipated
emotions. Journal of Behavioral Decision Making, 16(4), 273–295.
https://doi.org/10.1002/bdm.446
Beatriz Madeira, A., & Giampaoli, V. (2017). Agglomeration of fast food companies
in Brazil. Management Research: Journal of the Iberoamerican Academy of
Management, 15(3), 292–312. https://doi.org/10.1108/MRJIAM-06-2017-
0752
Belasco, W. (2014). Food Nations: Selling Taste in Consumer Societies (1st ed.).
https://doi.org/10.4324/9781315023380
Carolan, M. (2018). Big data and food retail: Nudging out citizens by creating
dependent consumers. Geoforum, 90, 142–150.
https://doi.org/10.1016/j.geoforum.2018.02.006
13

Doctoral Thesis
Héctor Hugo Pérez Villarreal
Chang, H.-H., & Meyerhoefer, C. D. (2019). Inter-brand competition in the
convenience store industry, store density and healthcare utilization. Journal
of Health Economics, 65, 117–132.
https://doi.org/10.1016/j.jhealeco.2019.03.001
Chen, M., & Lu, T. (2011). Modeling e-coupon proneness as a mediator in the
extended TPB model to predict consumers’ usage intentions. Internet
Research, 21(5), 508–526. https://doi.org/10.1108/10662241111176344
Crowley, A. E., Spangenberg, E. R., & Hughes, K. R. (1992). Measuring the hedonic
and utilitarian dimensions of attitudes toward product categories. Marketing
Letters, 3(3), 239–249. https://doi.org/10.1007/BF00994132
De Wijk, R. A., Kaneko, D., Dijksterhuis, G. B., van Zoggel, M., Schiona, I., Visalli,
M., & Zandstra, E. H. (2019). Food perception and emotion measured over
time in-lab and in-home. Food Quality and Preference, 75, 170–178.
https://doi.org/10.1016/j.foodqual.2019.02.019
Diaz-Osborn, N., & Osborn, S. (2016). Organizational structure and business and
technology strategy of food companies to optimize development of foods for
consumers with specific dietary needs. In Developing Food Products for
Consumers with Specific Dietary Needs (pp. 43–62).
https://doi.org/10.1016/B978-0-08-100329-9.00003-7
14

Chapter 1. Introduction
Enneking, U., Neumann, C., & Henneberg, S. (2007). How important intrinsic and
extrinsic product attributes affect purchase decision. Food Quality and
Preference, 18(1), 133–138. https://doi.org/10.1016/j.foodqual.2005.09.008
Estiri, M., Hasangholi, T., Yazdani, H., Nejad, H. J., & Rayej, H. (2010). Food
Products Consumer Behaviors: The Role of Packaging Elements. Journal of
Applied Sciences, 10(7), 535–543. https://doi.org/10.3923/jas.2010.535.543
FAO. (2019). 2050: Un tercio más de bocas que alimentar. [Organización de las
Naciones Unidas para la Alimentación y la Agricultura]. Retrieved
September 23, 2019, from
http://www.fao.org/news/story/es/item/35675/icode/
Gerbens-Leenes, P. W., Nonhebel, S., & Krol, M. S. (2010). Food consumption
patterns and economic growth. Increasing affluence and the use of natural
resources. Appetite, 55(3), 597–608.
https://doi.org/10.1016/j.appet.2010.09.013
Ghoochani, O. M., Torabi, R., Hojjati, M., Ghanian, M., & Kitterlin, M. (2018).
Factors influencing Iranian consumers’ attitudes toward fast-food
consumption. British Food Journal, 120(2), 409–423.
https://doi.org/10.1108/BFJ-12-2016-0612
Gillespie, B., Muehling, D. D., & Kareklas, I. (2018). Fitting product placements:
Affective fit and cognitive fit as determinants of consumer evaluations of 15

Doctoral Thesis
Héctor Hugo Pérez Villarreal
placed brands. Journal of Business Research, 82, 90–102.
https://doi.org/10.1016/j.jbusres.2017.09.002
Giraldo, M., Buodo, G., & Sarlo, M. (2019). Food processing and emotion regulation
in vegetarians and omnivores: An event-related potential investigation.
Appetite, 141, 104334. https://doi.org/10.1016/j.appet.2019.104334
Goyal, A., & Singh, N. P. (2007). Consumer perception about fast food in India: An
exploratory study. British Food Journal, 109(2), 182–195.
https://doi.org/10.1108/00070700710725536
Grunert, K. G., & Grunert, K. G. (2006). How changes in consumer behaviour and
retailing affect competence requirements for food producers and processors.
https://doi.org/10.22004/ag.econ.8007
Gutjar, S., de Graaf, C., Kooijman, V., de Wijk, R. A., Nys, A., ter Horst, G. J., &
Jager, G. (2015). The role of emotions in food choice and liking. Food
Research International, 76, 216–223.
https://doi.org/10.1016/j.foodres.2014.12.022
Hobbs, M., Griffiths, C., Green, M. A., Jordan, H., Saunders, J., Christensen, A., &
McKenna, J. (2019). Fast-food outlet availability and obesity: Considering
variation by age and methodological diversity in 22,889 Yorkshire Health
16

Chapter 1. Introduction
Study participants. Spatial and Spatio-Temporal Epidemiology, 28, 43–53.
https://doi.org/10.1016/j.sste.2018.11.001
Horvat, A., Granato, G., Fogliano, V., & Luning, P. A. (2019). Understanding
consumer data use in new product development and the product life cycle in
European food firms – An empirical study. Food Quality and Preference, 76,
20–32. https://doi.org/10.1016/j.foodqual.2019.03.008
Hsieh, A. T., & Chang, E. T. (2004). The Effect of Consumer Participation on Price
Sensitivity. Journal of Consumer Affairs, 38(2), 282–296.
https://doi.org/10.1111/j.1745-6606.2004.tb00869.x
Hwang, J., Yoon, Y.-S., & Park, N.-H. (2011). Structural effects of cognitive and
affective reponses to web advertisements, website and brand attitudes, and
purchase intentions: The case of casual-dining restaurants. International
Journal of Hospitality Management, 30(4), 897–907.
https://doi.org/10.1016/j.ijhm.2011.01.011
Kotabe, M., & Kothari, T. (2016). Emerging market multinational companies’
evolutionary paths to building a competitive advantage from emerging
markets to developed countries. Journal of World Business, 51(5), 729–743.
https://doi.org/10.1016/j.jwb.2016.07.010
17

Doctoral Thesis
Héctor Hugo Pérez Villarreal
Kumar, V. (2015). Evolution of Marketing as a Discipline: What Has Happened and
What to Look Out For. Journal of Marketing, 79(1), 1–9.
https://doi.org/10.1509/jm.79.1.1
Lazzarini, G. A., Zimmermann, J., Visschers, V. H. M., & Siegrist, M. (2016). Does
environmental friendliness equal healthiness? Swiss consumers’ perception of
protein products. Appetite, 105, 663–673.
https://doi.org/10.1016/j.appet.2016.06.038
Liu, J., Lin, S., & Feng, Y. (2018). Understanding why Chinese contractors are not
willing to purchase construction insurance. Engineering, Construction and
Architectural Management, 25(2), 257–272. https://doi.org/10.1108/ECAM-
08-2016-0186
Lusk, J. L. (2011). External validity of the food values scale. Food Quality and
Preference, 22(5), 452–462. https://doi.org/10.1016/j.foodqual.2011.02.009
Manan, H. A. (2016). The Hierarchical Influence of Personal Values on Attitudes
Toward Food and Food Choices. Procedia Economics and Finance, 37, 439–
446. https://doi.org/10.1016/S2212-5671(16)30149-6
Marques, A. C., Fuinhas, J. A., & Pais, D. F. (2018). Economic growth, sustainable
development and food consumption: Evidence across different income groups
18

Chapter 1. Introduction
of countries. Journal of Cleaner Production, 196, 245–258.
https://doi.org/10.1016/j.jclepro.2018.06.011
Mcneal, J. U., Stem, D. E., & Nelson, C. S. (1980). Consumers’ Nutritional Ratings
of Fast-Food Meals. Journal of Consumer Affairs, 14(1), 165–179.
https://doi.org/10.1111/j.1745-6606.1980.tb00660.x
Meghisan, G.-M., & Meghisan, F. (2012). Marketing Study Regarding Romanian
Consumers Behavior Towards Fast-Food Products. Procedia Economics and
Finance, 3, 397–402. https://doi.org/10.1016/S2212-5671(12)00170-0
Pentikäinen, S., Arvola, A., Karhunen, L., & Pennanen, K. (2018). Easy-going,
rational, susceptible and struggling eaters: A segmentation study based on
eating behaviour tendencies. Appetite, 120, 212–221.
https://doi.org/10.1016/j.appet.2017.09.001
Pleshko, L. P. (2009). A Preliminary Study of The Relationships Among Consumer
Satisfaction, Loyalty, And Market Share In Fast Food Consumers.
Proceedings of the Academy of Marketing Studies, 14, 38–44. Retrieved from
http://citeseerx.ist.psu.edu/viewdoc/download?doi=10.1.1.464.2029&rep=rep
1&type=pdf#page=43
Polonsky, M. J., Kay, P., & Ringer, A. (2013). A review of the first twenty years of
the Australasian Marketing Journal. Australasian Marketing Journal (AMJ),
21(3), 176–186. https://doi.org/10.1016/j.ausmj.2013.06.001 19

Doctoral Thesis
Héctor Hugo Pérez Villarreal
Rana, J., & Paul, J. (2017). Consumer behavior and purchase intention for organic
food: A review and research agenda. Journal of Retailing and Consumer
Services, 38, 157–165. https://doi.org/10.1016/j.jretconser.2017.06.004
Rivaroli, S., Baldi, B., & Spadoni, R. (2020). Consumers’ perception of food product
craftsmanship: A review of evidence. Food Quality and Preference, 79,
103796. https://doi.org/10.1016/j.foodqual.2019.103796
Small, D. A., & Verrochi, N. M. (2009). The Face of Need: Facial Emotion
Expression on Charity Advertisements. Journal of Marketing Research,
46(6), 777–787. https://doi.org/10.1509/jmkr.46.6.777_JMR6F
Tamuliene, V. (2015). Consumer attitude to fast food: The case study of Lithuania. 2,
255–261.
Terblanche, N. S., & Boshoff, C. (2010). Quality, value, satisfaction and loyalty
amongst race groups: A study of customers in the South African fast food
industry. South African Journal of Business Management, 41(1), 1–9.
https://doi.org/10.4102/sajbm.v41i1.509
Wang, P., Bradlow, E. T., & George, E. I. (2014). Meta-analyses using information
reweighting: An application to online advertising. Quantitative Marketing
and Economics, 12(2), 209–233. https://doi.org/10.1007/s11129-014-9145-7
20

Chapter 1. Introduction
Xue, H., Cheng, X., Zhang, Q., Wang, H., Zhang, B., Qu, W., & Wang, Y. (2017).
Temporal growth and spatial distribution of the fast food industry and its
relationship with economic development in China—2005–2012. Preventive
Medicine, 102, 79–85. https://doi.org/10.1016/j.ypmed.2017.07.002
Yadav, R., & Pathak, G. S. (2016). Intention to purchase organic food among young
consumers: Evidences from a developing nation. Appetite, 96, 122–128.
https://doi.org/10.1016/j.appet.2015.09.017
Yuzhanin, S., & Fisher, D. (2016). The efficacy of the theory of planned behavior for
predicting intentions to choose a travel destination: A review. Tourism
Review, 71(2), 135–147. https://doi.org/10.1108/TR-11-2015-0055
Zion Market Research. (2019, July 12). Global Industry Trends in Fast Food Market
Size & Share Will Surpass USD 690.80 Billion by 2022. Retrieved from
http://www.globenewswire.com/news-
release/2019/07/12/1882007/0/en/Global-Industry-Trends-in-Fast-Food-
Market-Size-Share-Will-Surpass-USD-690-80-Billion-by-
2022.html?culture=en-us
21


Chapter 2. Identifying research topics in marketing science along the past decade: a content analysis


Chapter 2. Identifying research topics in marketing science along the past decade: a content analysis
Abstract
In recent years, how marketing science is conceptualized has changed, as have the
methods through which data are investigated. This reconceptualization is making a
significant impact on the most important topics of this discipline. Here, a novel
approach is used to analyse a collection of 1,169 abstracts from articles published in
the Journal of Marketing Research and the Journal of Marketing from 2005 to 2014.
It is apply statistical methods to answer the following questions: How is vocabulary
commonly used in marketing science? What are the most relevant topics of these
journals? Which articles are the most influential? What words do authors prefer? Is the
consumer among the primary topics in marketing research? A set of easy-to-read visual
representations are provided to answer these questions. It is highlight two main
findings: (i) consumers and customers are the main topics of these marketing research
journals, which emphasizes the growing interest in consumers and consumer
behaviour as the core of both brick-and-mortar and online businesses; and (ii) in
contrast to previous periods, product has become an essential concept, perhaps due to
the emergence of new product considerations and new and enhanced interrelations.
Keywords: marketing, content analysis, keywords analysis, multivariate statistics.
25


Chapter 2. Identifying research topics in marketing science along the past decade: a content analysis
2.1 Introduction
Considering that marketing science is constantly evolving, exploring feasible changes
and trends that might occur in the future is of strategic importance. Technology-
enabled marketing research comprises pertinent quantitative methods that allow for
the retrieval of coherent sequential information from massive datasets in a rapid and
accurate manner (Wang, Bradlow, & George, 2014). In this sense, it is also relevant to
investigate the triggers that create breakthroughs in the evolution of this discipline
(Kumar, 2015). Within marketing research, a key idea is investigating differences
among topics, an idea that has been of interest to the most prestigious marketing
journals in the last decade. These kinds of studies typically use content analysis and
text mining. In a study by Huber, Kamakura, & Mela, (2014) that was published in a
special 50th anniversary issue of the Journal of Marketing Research (JMR), the authors
clustered main topics according to each editor”s tenure. Later, the topics preferred by
each editor were identified by calculating a correspondence analysis (CA). Similarly,
Kolbe & Burnett (1991) reviewed 128 studies that used different kinds of content
analysis as their primary method. Their findings suggested coefficients of reliability
for content-analysis methods. In Morris (1994), the author performed a comparison
between computerized and human outputs, and his results showed that computerized
content-analysis tends to be more reliable and stable.
If these methodologies are applied to conducting a literature review, a common factor
arises: All of these methods are capable of disclosing topics and key concepts on which
researchers are focusing. Additionally, the relevance of these types of studies is
enhanced if they are drawn from the most prestigious marketing science journals,
namely the Journal of Marketing (JM) and the Journal of Marketing Research (JMR).
It is also considering three important academic indexes: Scopus, Thomson-Reuters or
27
Doctoral Thesis
Héctor Hugo Pérez Villarreal
Web of Science (WoS), and ISI. Scopus has more indexed publications than ISI
(Leydesdorff, de Moya-Anegón, & Guerrero-Bote, 2009). However, ISI is considered
more prestigious in the social sciences. According to SCImago (2017), the JM is the
top journal in the marketing industry; the JMR is third. As pioneering publications,
these journals represent the trajectory of the discipline. Currently, they are the official
media of the American Marketing Association (AMA).
In addition to being official media for the AMA, these journals are focused on
demonstrating new techniques for tackling marketing challenges, and thus can be
considered a strong link between theory and practice. According to Thomson-Reuters
indexes, in 2016 the JM had an impact factor of 5.318 and the JMR had a 3.654 impact
factor (Thomson Reuters, 2016). A complementary criterion for evaluating these
journals is their impact factor performance during the last decade (2005-2014). Both
publications should be included on the Journal Citations Reports (JCR) for the
aforementioned period, as shown in the following table.
28

Chapter 2. Identifying research topics in marketing science along the past decade: a content analysis
Table 2.1 Impact Factor JCR Marketing Category.
Journal 2005 2006 2007 2008 2009 2010 2011 2012 2013 2014
Journal of Marketing
4.132 4.831 3.75 3.598 3.779 3.77 5.472 3.368 3.819 3.938
Journal of Supply Chain Management
0 0 0 0 0 5.853 2.65 3.32 3.717 3.857
Journal of Marketing Research
2.611 2.389 1.739 2.574 3.099 2.8 2.517 2.254 2.66 2.256
Marketing Science
3.788 3.977 3.964 3.309 2.194 1.724 2.36 2.201 2.208 1.86
Journal of Consumer Research
2.161 2.043 1.738 1.592 3.021 2.59 3.101 3.542 2.783 3.125
Journal of the Academy of Marketing Science
1.485 1.463 1.18 1.289 1.578 3.269 2.671 2.57 3.41 3.818
Journal of Public Administration Research and Theory
1.451 1.655 1.982 1.509 1.776 2.086 2.176 1.951 2.875 2.833
Academy of Management Perspectives
0 0 0.594 1.118 1.405 2.47 3.75 3.174 2.826 3.354
International Journal of Research in Marketing
1.222 1.28 1.071 1.611 1.873 1.365 1.662 1.781 1.71 1.575
Journal of Retailing
0.894 1.196 2.054 4.095 4.567 2.257 2.75 1.152 1.193 1.754
Source: Own elaboration with 2016 Journal Citation Reports® (Thomson Reuters,
2016)
29

Doctoral Thesis
Héctor Hugo Pérez Villarreal
Considering the information presented Table 2.1, it is clear that in the marketing area
the JM has been consistently strong over time. On the other hand, although the JMR
did not achieve the highest impact factors for 2013-2014, it earned higher scores from
2007 to 2014. Their respective impact factor scores were considered as a criterion for
selecting these two journals for the present study.
Furthermore, the JM, which has a long tradition in marketing (it is highlight that the
first issue of this journal was published in 1936) and has some of the greatest scientific
relevance, recently published a similar study. In this work, Kumar (2015) discussed
the evolution of marketing science by investigating its “triggers.” The author also
proposes future lines of research and predominant metaphors in the field. Using Kerin
(1996) categorization as a starting point, a new perspective on marketing science is
drawn. By investigating how the topics published in the JMR have evolved as well as
by identifying their corresponding triggers and the scope of the covered topics, the
contributing factors are discussed. A trigger is the influence of academics who
introduce new knowledge in response to practitioners” concerns. These factors
influence the way marketing science will be shaped in the future.
Given this framework for marketing science and bibliometric studies over the last two
decades, the general objective of this paper is to investigate the two most important
journals in the marketing area: the JM and the JMR. This paper is structured in five
sections. First, a literature review, which discusses applications of the techniques
proposed herein, is provided. Then, the methodology is introduced in section three.
Section four contains the obtained results. Discussion and limitations of this research
are presented on the last section.
30

Chapter 2. Identifying research topics in marketing science along the past decade: a content analysis
2.2 Literature Review
The historic evolution of marketing science between 1936 and 1945 was accurately
drawn by (Kerin, 1996), who proposed the prominent topic “illuminating marketing
principles and concepts” as a starting point, as well as the metaphor “marketing as
applied economics,” and its triggers “understanding of marketing principles through
case studies,” “need to comprehend government legislation and trade regulations,” and
“marketing research topics and implications for marketing practice.” For the most
recent period, 2013 and onward, the most prominent topic is “marketing at the core
and influence of new media.” Similarly, the related metaphor for this period is
“marketing as an integral part of the organization,” and the triggers are “changes in
media usage patterns,” “focus on marketing efficiency and effectiveness,” and “value
generated by engaging stakeholders of the firm.” Moreover, Huber et al. (2014) study
“A topical history of the JMR” also warrants attention. The way topics and contents
evolved during a 50-year period (1964-2012) is discussed. Huber et al. (2014) also
identify how this journal gradually increased its emphasis on marketing research
methods and advertising, and also expanded its coverage to other substantive topics,
such as consumer behaviour and social networks. Based on this analysis, it can be
inferred that the editorial style of the journal moved from “evolutionary” to
“revolutionary.” The study concluded that during the investigated period, the most
common topic based on the number of published articles was “consumer behaviour.”
Since 1990, the emergence of more powerful computers prompted the proliferation of
two of the most important methods for retrieval data: text mining (TM) and content
analysis (CAN). According to Stavrianou, Andritsos, & Nicoloyannis (2007), TM
focuses on analysing textual data “so that, new previously unknown knowledge is
discovered.” By comparison, CAN attempts to compress large volumes of words and
31

Doctoral Thesis
Héctor Hugo Pérez Villarreal
texts into fewer categories by a given set of coding rules. TM and CAN both aim to
extract common themes and threads by counting words. Although both can use
computer algorithms, TM has the capacity to process natural languages. Meanwhile,
CAN is a systemic and replicable technique, which makes it possible to synthesize a
large number of words into smaller sets of categories (S. Stemler, 2001). For instance,
Stemler, Bebell, & Sonnabend (2011) conducted a content analysis of school mission
statements to identify their primary stated reasons for existence, detect shifts in public
opinion with respect to the passing of time and recognize those schools that introduce
key concepts. Weismayer & Pezenka (2017) investigated keywords in articles
published by International Marketing Review (IMR) from 1988 to 2016 and ENTER
conference proceedings from 2005 to 2016. Their goal was to identify relevant topics
in different research areas and predict trends on published articles. Weismayer &
Pezenka (2017) suggested that CAN is the most valid way to determine editor/reviewer
predilections. Fang, Zhang, & Qiu (2017) conducted a bibliometric study with a five-
step methodology using 105 published articles related to electronic commerce (e-
commerce). The study provided evidence of the suitability of methods such as TM and
CAN for performing literature reviews and bibliometric studies. Nel et al. (2011)
conducted a content analysis of 407 papers published by the Journal of Services
Marketing during 1998-2008 and showed trends in research topics. Similarly, Gläser,
Glänzel, & Scharnhorst (2017) and Muñoz-Leiva, Viedma-del-Jesús, Sánchez-
Fernández, & López-Herrera (2012) found that the number of bibliometric studies,
which apply either TM or CAN, increased.
32

Chapter 2. Identifying research topics in marketing science along the past decade: a content analysis
2.3 Methodology
A five-step methodology was implemented to address these research objectives. First,
how data were collected is described, followed by an explanation of the properties of
the dataset. The third step introduces the statistical methods, and details of how the
characteristic words are identified is provided in step four. The software is presented
in the final step (see Figure 2.1).
Figure 2.1 Five-step methodology applied to this research.
33

Doctoral Thesis
Héctor Hugo Pérez Villarreal
2.3.1 Data collection
Over the years, marketing science has changed in terms of its focus, emphasis, and
priorities. In this regard, the JMR and the JM have been forerunners introducing these
changes, thus garnering the attention of academics, businesspeople, and practitioners.
A collection of 1,169 abstracts, which cover the period from 2005 to 2014, were
obtained from the websites of JMR and JM. As additional measures of standardization,
all abstracts included the title, name of the first author, country, university, and year
of publication. Figure 2.2 is a classification of the documents based on country.
Similarly, Figure 2.3 classifies the same group of abstracts according to the year of
publication.
Figure 2.2 Published articles in JMR and JM by country, from 2005 to 2014.
821
76 52 50 22 19 19 16 14 13 11 10 8 7 5 4 3 3 2 2 2 2 2 1 1 1 1 1 1
34

Chapter 2. Identifying research topics in marketing science along the past decade: a content analysis
As shown in Figure 2.2, about 70% of the articles published between 2005 and 2014
were submitted by U.S. authors. In second place, the Netherlands accounted for 6.5%
of the publications; Canada was in third place with 4.4% of the articles published.
Researchers from these three countries represent 81% of the all papers published by
both journals. The remaining 19% is distributed among 26 different countries.
Figure 2.3 Published articles in JMR and JM by year, from 2005 to 2014
With respect to the year of publication, the highest number of articles (n = 156) was
published in 2011. In contrast, 2013 was the year with the lowest number, with 99
published articles. In short, between 2005 and 2014, both journals published an
average of 116 articles per year, with a standard deviation of 28.1. In Tables 2.2 and
2.3 information related with published articles by JM and JMR is provided in a more
detailed way.
105 102 108 110134 140
156
12099
143
2005 2006 2007 2008 2009 2010 2011 2012 2013 2014
35

Doctoral Thesis
Héctor Hugo Pérez Villarreal
Table 2.2 JMR Articles by Issue and Year.
Year Issues Editor (tenure)
2005 42 (1): 13 articles, 42 (2): 14 articles,
42( 3): 15 articles, 42 (4): 16 articles
Dick R. Wittink (2003-2005)
Russell S. Winer (2005-2006)
2006 43 (1): 13 articles, 43 (2): 15 articles,
43 (3): 17 articles, 43 (4): 15 articles
Russell S. Winer (2005-2006)
Joel Huber (2006-2009)
2007 44 (1): 17 articles, 44 (2): 14 articles,
44 (3): 14 articles, 44 (4): 13 articles
Joel Huber
(2006-2009)
2008 45 (1): 9 articles, 45 (2): 9 articles,
45 (3): 10 articles, 45 (4): 9 articles,
45 (5): 9 articles, 45 (6): 10 articles
Joel Huber
(2006-2009)
2009 46 (1): 11 articles, 46 (2): 11 articles,
46 (3): 10 articles, 46 (4): 11 articles,
46 (5): 11 articles, 46 (6): 11 articles
Joel Huber (2006-2009)
Tülim Erden (2009-2012)
2010 47 (1): 16 articles, 47 (2): 15 articles,
47 (3): 15 articles, 47 (4): 15 articles,
47 (5): 15 articles, 47 (6): 15 articles
Tülim Erden (2009-2012)
2011 48 (1): 15 articles, 48 (2): 15 articles, Tülim Erden (2009-2012)
36

Chapter 2. Identifying research topics in marketing science along the past decade: a content analysis
48 (3): 15 articles, 48 (4): 11 articles,
48 (5): 10 articles, 48 (Supplement 1): 15
articles
48 (6): 11 articles
2012 49 (1): 10 articles, 49 (2): 11 articles,
49 (3): 11 articles, 49 (4): 11 articles,
49 (5): 11 articles, 49 (6): 18 articles
Tülim Erden (2009-2012)
Robert Meyer (2012-2016)
2013 50 (1): 10 articles, 50 (2): 9 articles,
50 (3): 9 articles, 50 (4): 9 articles,
50 (5): 7 articles, 50 (6): 7 articles
Robert Meyer (2012-2016)
2014 51 (1): 21 articles, 51 (2): 8 articles,
51 (3): 8 articles, 51 (4): 11 articles,
51 (5): 7 articles
Robert Meyer (2012-2016)
Source: Own elaboration.
37

Doctoral Thesis
Héctor Hugo Pérez Villarreal
Table 2.3 JM Articles by Issue and Year.
Year Issues Editor (tenure)
2005 69 (1): 9 articles, 69 (2): 9 articles,
69 (3): 10 articles, 69 (Special Section): 11
articles,
69 (4): 8 articles
Ruth N. Bolton (2002-2005)
Roland T. Rust (2005-2008)
2006 70 (1): 10 articles, 70 (2): 10 articles,
70 (3): 10 articles, 70 (4): 12 articles
Roland T. Rust (2005-2008)
2007 71 (1): 13 articles, 71 (2): 13 articles,
71 (3): 12 articles, 71 (4): 12 articles
Roland T. Rust (2005-2008)
2008 72 (1): 9 articles, 72 (2): 9 articles,
72 (3): 9 articles, 72 (4): 9 articles,
72 (5): 9 articles, 72 (6): 9 articles
Roland T. Rust (2005-2008)
Ajay K. Kohli (2008-2011)
2009 73 (Special Section): 9 articles,
73 (1): 9 articles 73 (2): 9 articles,
73 (3): 8 articles 73 (4): 8 articles,
73 (5): 8 articles 73 (6): 18 articles
Ajay K. Kohli (2008-2011)
2010 74 (1): 8 articles, 74 (2): 9 articles,
74 (3): 8 articles, 74 (4): 8 articles,
Ajay K. Kohli (2008-2011)
38

Chapter 2. Identifying research topics in marketing science along the past decade: a content analysis
74 (5): 8 articles, 74 (6): 8 articles
2011 75 (1): 8 articles, 75 (2): 8 articles,
75 (3): 8 articles, 75 (4): 15 articles,
75 (5): 8 articles, 75 (Supplement 1): 9 articles,
75 (6): 8 articles
Ajay K. Kohli (2008-2011)
2012 76 (1): 8 articles, 76 (2): 8 articles,
76 (3): 8 articles, 76 (4): 8 articles,
76 (5): 8 articles, 76 (6): 8 articles
Gary L. Frazier (2011-2014)
2013 77 (1): 8 articles, 77 (2): 8 articles,
77 (3): 8 articles, 77 (4): 8 articles,
77 (5): 8 articles, 77 (6): 8 articles
Gary L. Frazier (2011-2014)
2014 78 (1): 8 articles, 78 (2): 8 articles ,
78 (3): 8 articles, 78 (4): 8 articles,
78 (5): 8 articles
Gary L. Frazier (2011-2014)
Source: Own elaboration.
39

Doctoral Thesis
Héctor Hugo Pérez Villarreal
2.3.2 Properties of the dataset
The body under analysis includes 1,169 documents and 120,340 terms. On average,
each abstract contains 103 terms. Regarding the total number of words, the total text
analysed has 185,437 words, which is equal to 158 words for each abstract. This last
measure is relevant because it documents the usual length of abstracts, which is used
by researchers who publish in these journals.
Table 2.4 Descriptive Statistics of the Dataset under Analysis.
Descriptive Statistics Abstract mean Total
Number of terms 103.0 120,340.0
Number of unique terms 71.0 8,874.0
Percent of unique terms 70.4% 7.4%
Number of words 158.6 185,437.0
Average word length 5.9 5.9
Table 2.4 shows the percentage of unique terms. This number refers to words that
appear at least one time in the text regardless of their frequency (a catalogue of words).
The total number of words is obtained by counting all in the document. While the
whole dataset contains 7.4% unique terms, the mean per abstract is 70.4%. The low
percentage of unique terms is a measure of the vocabulary consistency. The percentage
is inversely related to the uniformity of the vocabulary of a given document. With this
40

Chapter 2. Identifying research topics in marketing science along the past decade: a content analysis
regard, Bécue-Bertaut (2014) suggested that percentages closer to 1.0 indicate a high
diversity of vocabulary. In this case, it can be inferred that the whole dataset is uniform
in terms of vocabulary use. This makes sense, given that all the abstracts were
published in journals of the same field, and therefore have similar features.
The two most common techniques used for information retrieval are lemmatization
and stemming. Bartol & Stopar (2015) described the first as the methods for removing
inflectional endings on words; Feinerer, Hornik, & Meyer (2008) explained stemming
as the algorithms used for removing word suffixes while preserving their radical. One
advantage of lemmatization is that it first uses glossaries to ensure words are properly
grouped. A limitation observed in this work is that stemming was carried out manually,
and thus is extremely time consuming. Therefore, it is suggesting the use of glossaries
(based on the lemmatization approach) for future research to reduce time spent on
repetitive manual tasks.
Prior to calculating the basic descriptive statistics, the dataset was prepared.
Prepositions, conjunctions, personal pronouns, articles, and demonstratives were
removed. Although the stop-words proposed in the R package “tm” Feinerer (2018)
were used as a reference, the stemming procedures were implemented manually. The
central idea is to reduce text”s complexity without severe loss or distortion of
information. The algorithm proposed by Porter (1980), which has been proven to
provide accurate results for stemming texts in English in a variety of disciplines, was
taken as guideline. Using this approach, corresponding equivalences were obtained;
that is, words with the same meaning and words that appeared in singular and plural
were grouped as one word. For example, the words “accountability,” “accountable,”
and “accounted” should be treated as “account”; the words “branding” and “brands”
should be treated as “brand.” With the purpose of creating graphical representations,
41

Doctoral Thesis
Héctor Hugo Pérez Villarreal
minimum thresholds were imposed. Only words with frequencies equal to 20 and
higher were retained. Similarly, abstracts using a given word 15 times or more, were
also kept. As a result, 994 of the 8,874 different words and 80,123 of the 185,437
occurrences were kept. The yielded document text matrix (dtm) is of order 994 ×1,164.
The rows are related to the abstracts and the columns are related to the words. In
addition, there are three categorical variables in the dataset that relate to year of
publication, author name, and institution. These categorical variables were
incorporated for the last part of the analysis.
2.3.3 Multivariate methods (CA and MFACT)
According to Barahona (2018); Bécue-Bertaut (2014); Benzécri (1980); Murtagh
(2005) CA is widely used in the field of text mining. The most remarkable feature of
CA in the context of a literature review is its capacity for plotting abstracts and words
in such a way that hidden relationships are uncovered. For example, similarities and
differences among abstracts, in terms of the vocabulary used, are identified. Below is
a list of outputs obtained through the CA.
Identifying similarities between abstracts, given their verbal contents.
Detecting similar words, based on their distribution.
Making associations about similar words, given the context in which the words
were used.
Providing visual representations of abstracts and words.
42

Chapter 2. Identifying research topics in marketing science along the past decade: a content analysis
Bansard, Kerbaol, & Coatrieux (2006) stated that words frequently used in the same
abstract are all together building a topic and they are considered to belong to the same
metakey. It is important to note that one word can belong to one or more metakeys
(indeed, this is very frequent). This scenario indicates that the same word can be used
in several contexts, each of which might have a different meaning. For instance, the
word “environment” may be related to the quality levels of air or water, but in another
context, “environment” could mean conditions and settings in the workplace. Finally,
CA is capable of quantitatively associating a given metadoc with a metakey that
together characterize the same axis. In this case, it is inferred that abstracts belonging
to a same metadoc are using words, which in turn are associated on the same metakey.
If this lexical table is complemented with the categorical year of publication, then the
analysis changes into a Multiple Factor Analysis of Contingency Tables (MFACT). A
detailed explanation of metakey and metadoc concepts, as well as the results obtained
through both methodologies (CA and MFACT) and their graphical representations, are
provided in section 2.4.2.
2.3.3.1 Types of results
The application of the correspondence analysis and its variants makes the inclusion of
categorical variables possible. This allows to obtain two types of results, as follows:
The first approach comprises results that are commonly obtained through CA:
namely eigenvalues, representations of row-abstracts and column-words, and
distances between abstracts based on both Euclidean and Chi-squared
distances. While the former is given by the squared sum of differences, the last
includes a constant adjustment that is calculated in terms of each column-row
43

Doctoral Thesis
Héctor Hugo Pérez Villarreal
profile. The distributional equivalence, which is a property of a traditional CA,
allows for merging two or more column-profiles that have the same relative
values without affecting distance between row-profiles.
Second, an edited version of the original table is yielded by linking each row-
abstract with the year of publication. The result is a table of quantitative and
categorical variables. The MFACT is a suitable tool for dealing with mixed
data tables (Kostov, Bécue-Bertaut, & François, 2015). MFACT balances the
groups” effect (given by year of publication) on the first dimension by dividing
the columns-words profiles of each group by the first eigenvalue. Then, the
highest inertia of each group is standardized to 1. Interpretation for the MFACT
remains identical to the classical CA. Graphical representations based on the
MFACT allow to compare typologies of each group in a reduced dimensional
space with the purpose of evaluating extent to which positions of row-abstracts
are similar from one group to another.
2.3.4 Characteristic words and abstracts
With the purpose of providing quantitative indicators of the most frequent terms in the
dataset, modelling a hypergeometric distribution (HD) is proposed. HD is a discrete
probability distribution, which defines the probability of achieving k successes in n
attempts, without replacement. Assuming N is a finite population that contains K
successes, the following notation is proposed:
44

Chapter 2. Identifying research topics in marketing science along the past decade: a content analysis
– 𝑛.., The total number of words-occurrences in the whole dataset;
– 𝑛, ,, The number of words-occurrences in part j;
– 𝑛 .., The total count of the word i in the whole corpus;
– 𝑛 The count of the word i in part j.
The total frequency 𝑛 of word i in part j is contrasted with other sums. These sums
are obtained with all possible samples composed of 𝑛 occurrences randomly extracted
from the whole dataset without replacement. If word i is relatively more frequent in
part j than in the whole sample, that is: 𝑛 /𝑛 𝑛 /𝑛.. , then the p-value is calculated
as stated in formulas (1) and (2).
1)
j
ij
n
nx
j
j
ii
ji
n
n
xn
nn
x
n
p.
.
..
.....
,
2)
ijn
x
j
j
ii
ji
n
n
xn
nn
x
n
p1
....
,
.
..
.
Based on formulas (1) and (2), a hypothesis test (one-tail) is conducted to assess the
significance of the first eigenvalue, and, consequently, to establish a quantitative link
between chronological evolution and the use of vocabulary. The null hypothesis states:
A chronological dimension of the vocabulary does not exist, and, hence, tested words
are exchangeable across the variable year of publication. Randomly, the variable year
45

Doctoral Thesis
Héctor Hugo Pérez Villarreal
column is permuted in the lexical table without replacement, and a p-value is
calculated on every permutation. An empirical distribution for the first eigenvalue
(under Ho) is obtained by repeating this procedure many times as a number nears 𝑛..,.
The algorithms proposed by Bécue-Bertaut (2014) and Lebart, Salem, & Berry (1998)
are taken as a guideline for these purposes. It is important to conduct a large number
of permutations to compute the p-value as accurately as possible.
2.3.5 Statistical software
The main reasons for using the software R version 3.3.3 (2017-03-06) “Another
Canoe” in this study are detailed below. First, it is open source software, which
allowed to use it at different locations without licence restrictions. Moreover,
considering that R is a collaborative project, Libraries and functions written under the
R environment are constantly up to date, which ensured that state-of-the-art
computational algorithms were used in the analysis. Specifically, the function
BiblioMineR (Hernández Ramírez, 2012) and the packages CA Greenacre, Nenadic,
& Friendly (2017) RcmdrPlugin.temis (Bouchet-Valat & Bastin, 2013), and
FactoMineR (Lê, Josse, & Husson, 2008), among others, were utilized.
2.4 Results
2.4.1 Glossary of most frequent terms
The first analysis of the glossary of most frequent terms allowed to conclude that this
is a repetitive corpus. Note that only 25 words represent 24% of the occurrences in the
46

Chapter 2. Identifying research topics in marketing science along the past decade: a content analysis
whole dataset, which is equal to 28,881. “Consumers” was the most frequent word
with 1,527 occurrences, which means that it appears in 47% of the abstracts. “Product”
was second (1,450 occurrences), followed by “customer” (1,269 occurrences),
appearing in 36% and 24% of the abstracts, respectively. These three terms with
“effect” (1,239 occurrences), “brand” (1,160 occurrences), “marketing” (1,077
occurrences), and “firm” (1,019) shape the main content of both journals. The results
show that nearly 28% of the abstracts include all of these words together. This overall
perspective allows taking a first approach in identifying what seems to be of interest
to JMR and JM authors. Their efforts are directed toward discussing effects on
products, consumers, and brands through “study” (880), “model” (748), “market”
(691), “research” (659), and “price” (617).
These findings yield supporting evidence that consumer behaviour was one of the most
relevant topics during the investigated decade. The terms “consumers” and “customer”
are among the top ten recurrences for the whole dataset. Moreover, these results are
similar to those obtained by Huber et al. (2014) which highlighted how the JMR gave
increasing importance to the topic of consumer behaviour during the investigated
period. Moreover, conclusions obtained by Huber et al. (2014) in relation to the term
“product” also drew some attention. Consistent with these results, they ranked
“product” at position nine of prevalence in abstracts for 1964-2012. It appears in
second place of the rankings in the current study (see Table 2.5). Considering this, it
is inferred that the concept of “product” gained more attention in the last decade in
contrast to previous periods (1964-2001).
47

Doctoral Thesis
Héctor Hugo Pérez Villarreal
Table 2.5 List of the 25 Most Frequent Terms.
Word Glossary
Frequency
No.
Documents
consumer 1527 554
product 1450 417
customer 1269 284
effect 1239 574
brand 1160 228
marketing 1077 442
firm 1019 336
study 880 518
use 786 537
model 748 360
market 691 282
research 659 462
price 617 173
data 577 394
48

Chapter 2. Identifying research topics in marketing science along the past decade: a content analysis
relationship 522 222
value 509 203
sale 495 169
decision 456 236
performance 455 193
choice 440 183
level 426 253
show 398 334
behaviour 386 222
find 383 302
Source: Own elaboration.
49

Doctoral Thesis
Héctor Hugo Pérez Villarreal
2.4.2 Most relevant topics and its related abstracts
Correspondence analysis is a multivariate statistical technique that is applied to
categorial data and provides means for summarizing large datasets on a reduced
dimensional space. In this context, CA is applied to identify those “metakeys” and
“metadocs,” which better describe similarities among abstracts based on the words
they use. It is important to clarify that a metakey is related to a given word used in one
or more abstracts, whereas a metadoc is related to an abstract. In this way, two or more
metadocs might be related in function to the same metakeys. Researchers might
identify the set of words (metakey+/metakey-) that most contribute to the inertia and
lie on the positive/negative part of the axis. Simultaneously, the set of documents that
most contribute to the inertia (metadoc+/metadoc-) and lie on its positive/negative part
might also be identified.
For the purpose of creating intuitive visualizations, only those metakeys and metadocs
with strong presence on the principal axes were considered. Abstracts using a given
word 15 times or more were kept. Words with frequencies equal to 20 and higher were
also retained. According Lebart et al. (1998), this improves the comprehension of
associations among words and abstracts. The first five components, obtained through
the correspondence analysis, were retained. From this group, the pair with the highest
eigenvalues was taken as axes of the charts provided below. While the eigenvalue for
the first axis is equal to 0.25, its value for the second axis is 0.21. These two axes are
able to accurately describe the emergence of the most relevant words of the
investigated dataset, taking into account that they also have the biggest eigenvalues.
Note that previously mentioned rules apply only to visual representations (Figure 2.4).
Additional criterion, which consisted of retaining only those words and abstracts with
50

Chapter 2. Identifying research topics in marketing science along the past decade: a content analysis
a contribution three times higher than the mean (average), was applied for elements
listed in Table 2.6.
Figure 2.4 Most contributory abstracts / words (CA).
With regard to Figure 2.4, note the positive part of the first axis, which is also called
(DIM1+), which notes a set of words (metakey+) that is closely related with a
51

Doctoral Thesis
Héctor Hugo Pérez Villarreal
metadoc+. The words “consumer,” “choice,” “price,” “consumption,” “preference,”
and “self” are highlighted in this area. It is also identifying the negative section of the
first axis (D1M1-), where the metakey- is located (consumer relationship). It is
composed of the words “customer,” “firm,” “marketing,” “relationship,”
“performance,” “business,” and “market.” At the same time, the mentioned words are
closely related to the metadoc-, which is composed of the articles “363,” “715,” “731,”
and others.
52

Chapter 2. Identifying research topics in marketing science along the past decade: a content analysis
Table 2.6 Main Topics.
DIM TOPICS METAKEYS
DIM
1+ Consumer Choice
“consumer” “choice” “price” “consumption” “preference” “self”
“people” “option” “attribute” “food” “product” “hedonic” “brand”
“evaluation” “goal” “extension” “experiment” “search” “health”
“purchase” “less” “versus”
DIM
1-
Customer Relationship
Management
“customer” “firm” “marketing” “relationship” “performance”
“business” “market” “satisfaction” “supplier” “value” “orientation”
“employee” “return” “service” “stock” “capability” “financial”
“shareholder” “management” “innovation” “ties” “organizational”
“portfolio” “relational” “risk” “equity” “trust” “metric” “governance”
“frontline” “salesperson” “development” “knowledge” “manager”
“loyalty” “network” “strategic” “retention”
DIM
2+
Developing strategies
and programs for
pricing
“price” “retailer” “store” “model” “search” “pricing” “manufacturer”
“demand” “data” “household” “advertising” “endogeneity”
“category” “elasticity” “distribution” “retail” “method” “promotion”
“elasticities” “channel” “private” “parameter” “heterogeneity”
“estimates” “grocery” “market” “channels” “share” “unobserved”
“sale” “estimation” “shopping” “estimate” “label” “competitive”
“quantity” “optimal” “competition” “profit”
DIM
2- Emotional Marketing
“self” “emotion” “employee” “emotional” “evaluation” “goal”
“message” “regulatory” “brand” “extension” “hedonic” “people”
“fit” “experience” “corporate” “influence” “personality”
“knowledge” “frontline” “utilitarian” “identity” “process” “positive”
“participation” “attitude” “study” “consumption” “engagement”
“role” “processing” “versus” “focus” “service” “negative”
53
Doctoral Thesis
Héctor Hugo Pérez Villarreal
DIM
3+
Design and
management of
integrated marketing
channels
“supplier” “price” “goal” “customer” “service” “relationship”
“consumption” “pricing” “saving” “food” “trade” “decision”
“employee” “people” “business” “buyer” “aversion” “option”
“salesperson” “choice” “ties” “seller” “outcome” “reference”
“retailer” “performance” “orientation” “hedonic” “manufacturer”
DIM
3- Brand Equity
“brand” “extension” “personality” “association” “advertising”
“branding” “equity” “fit” “branded” “category” “success” “stock”
“value” “metric” “return” “similarity” “risk” “measure” “image”
“shareholder” “measures” “attitude”
DIM
4+
Design and
management of
integrated marketing
communications
“marketing” “advertising” “method” “media” “choice” “design”
“model” “stock” “search” “review” “conjoint” “attribute”
“recommendations” “approach” “traditional” “complexity”
“network” “investor” “rating” “web” “advertisement” “site”
“emotion” “option” “heterogeneity” “metric” “firm” “respondents”
“content” “response” “activity” “preference” “decision” “researcher”
“social”
DIM
4- Marketing Channels
“price” “brand” “extension” “retailer” “store” “manufacturer”
“private” “supplier” “label” “image” “category” “retail” “pricing”
“employee” “loyalty” “labels” “shopping” “promotion” “reference”
“grocery” “share” “personality” “national” “success” “frontline”
“service” “identification” “discounts” “business” “evaluation”
“buying”
DIM
5+ Value Networks
“supplier” “extension” “governance” “method” “trust” “model”
“relationship” “conjoint” “knowledge” “attribute” “partner” “design”
“ties” “choice” “network” “measurement” “parameter” “approach”
“brand” “performance” “selection” “proposed” “relational”
54

Chapter 2. Identifying research topics in marketing science along the past decade: a content analysis
“decision” “innovation” “organizational” “predictive” “unobserved”
“incentive” “preference” “approaches” “validity” “distribution”
DIM
5- Marketing Metrics
“stock” “advertising” “return” “emotion” “risk” “investor” “price”
“spending” “shareholder” “satisfaction” “negative” “finance”
“financial” “message” “impact” “review” “systematic” “food” “loss”
“firm” “long” “promotion” “equity” “store” “term” “health” “value”
“consumption” “cash” “positive” “abnormal” “metric” “short”
“search” “emotional” “online” “expenditures” “net” “customer”
Source: Own elaboration.
Similarly, metakey2+ is distinguished by the topic “Developing strategies and
programs for pricing.” Note that it is located in the positive part of the second axis
(D1M2+), and it is composed of the words “price,” “retailer,” “store,” “model,”
“search,” and “pricing.” Note that articles “92,” “77,” and “277” compose metadoc2+.
With respect to the negative part of (D1M2-), “emotional marketing” is identified as
the most remarkable topic. The articles that feature this topic are “118,” “309,” “1045,”
and “726.”
55

Doctoral Thesis
Héctor Hugo Pérez Villarreal
Table 2.7 Distribution of Abstracts/Words.
Aggregation of abstracts and words according to the categorical variable year
Years Abstracts
Occurrences
before
Occurrences
after
Mean
length
Words
before
Words
after
2005 105 12251 6122 116.68 2507 881
2006 102 13285 6675 130.25 2653 912
2007 108 15577 7903 144.23 2849 929
2008 110 16497 8402 149.97 2912 939
2009 134 19516 9827 145.64 3207 957
2010 140 19286 9415 138.75 3321 965
2011 156 21729 10558 139.29 3466 958
2012 120 17381 8855 144.84 3069 947
2013 51 6734 3304 132.04 1818 752
2014 143 19377 9596 135.50 3269 935
Overall 1169 161633 80657 138.27 8800 994
Source: Own elaboration.
56

Chapter 2. Identifying research topics in marketing science along the past decade: a content analysis
While the most contributing metakeys (words) are related to a given topic and also
introduced in Table 2.6, the way abstracts and words were aggregated in respect to the
year of publication is presented in Table 2.7. The criterion for selecting words and
abstracts was their contribution to the total inertia. In Table 2.6, those contributions
higher than three times the mean (average) of the total inertia were kept. In Table 2.7,
elements equal or higher than the mean of the total inertia are presented. In both cases,
axes with the biggest eigenvalues are used as references.
2.4.3 Chronological evolution
To investigate the chronological evolution of the vocabulary, the abstract-words
matrix was transformed into a mixed table by adding the variable year of publication
as a categorical variable. Consequently, the CA turned out to be a MFACT. This makes
it possible to identify similarities and differences in vocabulary over time. Periods
characterized by specific terms and important variations in the use of the vocabulary
were also identified. By conducting this analysis, it can answer questions such as:
Which groups of documents, given a year of publication, are similar or different?
Which periods are characterized by the introduction of new vocabulary? How has
vocabulary evolved over time?
The input for the MFACT consisted of a mixed table on which the categorical variable
year of publication is distributed on rows. Columns are reserved for words. In this
form, the matrix contains 10 rows (years) and 994 columns (words). The eigenvalues
for the first five components (obtained from the MFACT) are presented in Table 2.8.
Note that the eigenvalues are, in general, smaller than those obtained through the
traditional correspondence analysis. Typical structures on mixed tables are among the
57

Doctoral Thesis
Héctor Hugo Pérez Villarreal
main causes of the small eigenvalues. These properties were exhaustively studied by
(Greenacre et al. (2017); Kostov et al. (2015); Lebart et al. (1998) among others. While
the eigenvalue for the first component is 0.032, the value for the second is 0.026. The
same rules previously applied to the CA are repeated for the MFACT: retain five axes
in the initial calculation and select the two with the biggest eigenvalues. Finally, the
projection of words with a contribution of three times higher than the mean (average)
was carried out. Therefore, it ensured that the most representative words were
visualized, either due to the biggest eigenvalues on the axes or the high contribution
of the chosen words.
Table 2.8 Eigenvalues for First Five Components
Measures Dim.1 Dim.2 Dim.3 Dim.4 Dim.5
Eigenvalues 0.032 0.026 0.023 0.020 0.020
% Variance 18.23 14.34 12.70 11.46 11.00
Cumulative 18.23 32.57 45.27 56.72 67.72
2.4.4 How has the vocabulary evolved over time?
A type of big picture of how the vocabulary had evolved over the years is shown in
Figure 2.5. There are three important periods where the vocabulary shifted: 2005-2006
in blue, 2007-2009 in grey, and 2010-2014 in green. For the horizontal axis, while
words related to “customer satisfaction” and “market model” are displayed on the
negative part of the axis, words referring to “social networks” and “mobile
58

Chapter 2. Identifying research topics in marketing science along the past decade: a content analysis
technologies” are projected in the positive area. With respect to the vertical axis, the
positive area is characterized by the words “regulatory,” “fit,” and “retailer.” On the
negative part, the words “brand,” “networks,” “demonstrate,” and “stock” are found.
In the first period, from 2005-2006, authors published in the journals were mainly
writing about regulatory issues, emotional shopping, and fitting models. During the
second period (2007-2009), authors focused their attention on the customer”s
satisfaction, loyalty, and trust. Topics such as market models, branding, firm returns,
and stocks are characteristic of this period. Finally, in the third period, which
comprises 2010-2014, topics such as social networks and contents, mobile
technologies, online shoppers, reviews, and demonstrations emerged.
59

Doctoral Thesis
Héctor Hugo Pérez Villarreal
Figure 2.5 Visual representation of years and words (MFACT).
This draws the attention to the radical change in words that emerged during period
three, in contrast to the previous periods. It is clear that authors focused their attention
on contemporary issues, including the proliferation of online marketing and social
networks. Table 2.9 presents the characteristic words according to each analysed
period. In the first period (2005-2007), the results identified words such as “fit,”
“manufacturer,” “regulatory,” and “model” among others. The second period is
characterized by the words “firm,” “stock,” “loyalty,” “efficiency,” “competitive,”
-0.6 -0.4 -0.2 0.0 0.2 0.4 0.6
-0.2
0.0
0.2
Dim 1 (18.23%)
Dim
2 (
14
.34
%)
2005
2006
2007
2008
2009
2010
2011
20122013
2014
emotionalfit
manufacturers
models regulatory
retailershopping
competitive
customer
firm
market
model
satisfaction
trust
brand
loyalty returnsrisk stock
content
food
group
media
reveal
reviews
self
social
spendingdemonstrate
website
mobileratings
online
shoppers
networks
60

Chapter 2. Identifying research topics in marketing science along the past decade: a content analysis
“risk,” and others. Finally, the third period gathered words such as “media,” “social,”
“network,” “customer,” and “mobile.” These results are consistent with the work
proposed by Karvanen, Rantanen, & Luoma (2014), who observed the growing
relevance of social media in contemporary marketing research.
Table 2.9 Characteristic Words by Period
Period Characteristic words
2005-
2006
fit, manufacturer, regulatory, model, aversion, net, web, retailer, relationship,
satisfaction, article, price, intention, author, emotional, structural, enhanced,
shopping, involvement, relational, bias, parameter, reference, retailing
2007-
2009
firm, stock, loyalty, efficiency, competitive, risk, finance, customer, promotion,
investments, market, chain, corporate, trust, manager, duration, valuation,
revenue, shares, benefits, improvement, industry, impact, equity, scholars,
interface, competitors, costs, marketing
2010-
2014
media, social, consumer, group, spending, rating, reveal, demonstrate, user, line,
review, product, sale, food, content, online, advertising, network, employee, goal,
position, campaign
Finally, in Figure 2.6, the periods are shown again. Rather than highlight just those
words that characterize each period, each main topic is included in this visualization.
For instance, topics including regulatory issues, emotional aspects, and fit models
shape the first period. The second period features topics of consumer satisfaction and
trust, firm risk, and stock returns. The most recent period is made up of topics such as
social media, food reviews, food studies, online consumers, and mobile technologies.
61

Doctoral Thesis
Héctor Hugo Pérez Villarreal
In this form, the investigated period was accurately clustered into smaller ones by
considering content similarities of each abstract included in the analysis.
Figure 2.6 Periods of evolution for the vocabulary in the first MFACT plane.
62

Chapter 2. Identifying research topics in marketing science along the past decade: a content analysis
2.5 Discussion and Limitations
In this research, a collection of 1,169 abstracts from over the course of a decade was
investigated by proposing novel forms of applying classical statistical methods. All
abstracts correspond to articles that the most prestigious journals in the field have
published (JM and JMR). First, basic descriptive statistics of average words per
abstract, the percentage of unique terms, and average word length were provided.
Thereafter, the most frequent words were identified and allowed to disclose the
authors” preferred vocabulary. By conducting a correspondence analysis, the most
influential abstracts were identified. Finally, a multifactor analysis of contingency
tables was calculated to disclose how the use of vocabulary has evolved. Three
important periods that characterize how vocabulary has evolved over time were
disclosed.
This analysis gives evidence to the importance that authors have put on customer
issues. That is, the consumer was the center of marketing research during the
investigated decade. Similarly, the term “product” comes next in importance. This is
obvious, considering that marketing practices are almost meaningless without at least
one product. The word “client” does not appear in the top rank, but its presence
increases in the third and last period, which is unsurprising, as client and consumer are
the same in most cases. The word “effect” also warrants attention because marketing
science is having an effect on organizations and people. Finally, the word “brand”
draws the attention because it is one of the foundations of contemporary marketing.
This case study provides value for academics, researchers, and practitioners within the
marketing science area by tracking and identifying the most relevant publications with
respect to periods of time and topics. By providing easy-to-read visualizations, readers
63

Doctoral Thesis
Héctor Hugo Pérez Villarreal
can promptly identify those articles that made significant contributions in the field or
locate specific publication niches. This work also illustrates how literature reviews in
marketing can be effectively conducted while also reducing time spent. The main
topic, “customer choice,” plays a strategic role in establishing a link between the
consumer and purchasing decisions. Two additional primary topics of interest are
“developing strategies” and “programs of pricing.” This lends supporting evidence to
the idea that pricing policies are relevant to contemporary marketing, considering that
pricing policies encompasses concepts as “action indicators,” “performance
measures,” and “profitability metrics.” These results provide partial support for the
popularity that Customer Relationship Management (CRM) has gained in recent years.
In this respect, topics most related with CRM are “added value,” “orientation,” and
“service.” Here, the importance of having long-term relations with customers, which
is a core concept in marketing science, is also highlighted. “Emotional marketing” is
another main topic that recognizes the generation of knowledge in this discipline by
investigating individuals emotions.
This work also contributes to the discussion of how literature reviews can be
performed, within marketing science or in other disciplines. The primary goal was to
propose useful methods for classifying publications according to content similarities.
The methods presented here might be used as general guidelines for authors and
researchers who are interested in performing literature reviews in a systematic way.
By identifying the specialized vocabulary that is used in this discipline and later
incorporating it into their documents, authors may be assured that they are at the
forefront of modern vocabulary usage.
Text mining is an emerging discipline. As such, there are still some significant
limitations. Taking into account that only 1,169 abstracts were incorporated in this
64

Chapter 2. Identifying research topics in marketing science along the past decade: a content analysis
study, the results are more illustrative than truly generalizable. Therefore, the results
are not providing compelling evidence about one accurate “radiography” of marketing
science; this work is much more modest. Rather, the main objective was to
demonstrate the suitability of text mining techniques for conducting precise and
standardized literature reviews. A broader investigation should include the full text of
each article to improve the accuracy of these results. Moreover, categorical variables
such as research center, country, and keywords should be incorporated to better
describe the ideal profile of the authors. A second paper, which effectively
incorporates these ideas, is currently in progress.
65

Doctoral Thesis
Héctor Hugo Pérez Villarreal
2.6 References
Bansard, J., Kerbaol, M., & Coatrieux, J. L. (2006). A look at...An analysis of IEEE
publications in biomedical engineering. IEEE Engineering in Medicine and
Biology Magazine, 25(5), 6–12.
https://doi.org/10.1109/MEMB.2006.1705735
Barahona, I. (2018). Poverty in Mexico: Its relationship to social and cultural
indicators. Social Indicators Research, 135(2), 599–627.
https://doi.org/10.1007/s11205-016-1510-3
Bartol, T., & Stopar, K. (2015). Nano language and distribution of article title terms
according to power laws. Scientometrics, 103(2), 435–451.
https://doi.org/10.1007/s11192-015-1546-1
Bécue-Bertaut, M. (2014). Tracking verbal-based methods beyond conventional
descriptive analysis in food science bibliography. A statistical approach.
Food Quality and Preference, 32, 2–15.
https://doi.org/10.1016/j.foodqual.2013.08.010
Benzécri, J.-P. (Ed.). (1980). Pratique de l”analyse des données. Paris: Dunod.
Bouchet-Valat, M., & Bastin, G. (2013). RcmdrPlugin. Temis, a Graphical
Integrated Text Mining Solution in R. 5(1), 188–196.
Fang, C., Zhang, J., & Qiu, W. (2017). Online classified advertising: A review and
bibliometric analysis. Scientometrics, 113(3), 1481–1511.
https://doi.org/10.1007/s11192-017-2524-6
Feinerer, I. (2018, December 21). Introduction to the tm Package Text Mining in R.
Retrieved from https://cran.r-project.org/web/packages/tm/vignettes/tm.pdf
Feinerer, Ingo, Hornik, K., & Meyer, D. (2008). Text Mining Infrastructure in R.
Journal of Statistical Software, 25(5). https://doi.org/10.18637/jss.v025.i05
66

Chapter 2. Identifying research topics in marketing science along the past decade: a content analysis
Gläser, J., Glänzel, W., & Scharnhorst, A. (2017). Same data—different results?
Towards a comparative approach to the identification of thematic structures
in science. Scientometrics, 111(2), 981–998. https://doi.org/10.1007/s11192-
017-2296-z
Greenacre, M., Nenadic, O., & Friendly, M. (2017). Simple, Multiple and Joint
Correspondence Analysis. Retrieved from https://cran.r-
project.org/web/packages/ca/ca.pdf
Hernández Ramírez, D. M. (2012). BiblioMineR: una herramienta estadística para
la revisión bibliográfica. (Master on Statistics and Operations Research),
Technical University of Catalonia. BarcelonaTech, Barcelona, Spain.
Retrieved from
http://upcommons.upc.edu/pfc/bitstream/2099.1/16500/1/memoria.pdf
Huber, J., Kamakura, W., & Mela, C. F. (2014). A Topical History of JMR. Journal
of Marketing Research, 51(1), 84–91. https://doi.org/10.1509/jmr.51.1.02
Karvanen, J., Rantanen, A., & Luoma, L. (2014). Survey data and Bayesian analysis:
A cost-efficient way to estimate customer equity. Quantitative Marketing and
Economics, 12(3), 305–329. https://doi.org/10.1007/s11129-014-9148-4
Kerin, R. A. (1996). In Pursuit of an Ideal: The Editorial and Literary History of the
Journal of Marketing. Journal of Marketing, 60(1), 1–13.
https://doi.org/10.1177/002224299606000101
Kolbe, R. H., & Burnett, M. S. (1991). Content-Analysis Research: An Examination
of Applications with Directives for Improving Research Reliability and
Objectivity. Journal of Consumer Research, 18(2), 243.
https://doi.org/10.1086/209256
67

Doctoral Thesis
Héctor Hugo Pérez Villarreal
Kostov, B., Bécue-Bertaut, M., & François, H. (2015). Correspondence Analysis on
Generalised Aggregated Lexical Tables (CA-GALT) in the FactoMineR
Package. 7(1), 109–117.
Kumar, V. (2015). Evolution of Marketing as a Discipline: What Has Happened and
What to Look Out For. Journal of Marketing, 79(1), 1–9.
https://doi.org/10.1509/jm.79.1.1
Lê, S., Josse, J., & Husson, F. (2008). FactoMineR: An R Package for Multivariate
Analysis. Journal of Statistical Software, 25(1).
https://doi.org/10.18637/jss.v025.i01
Lebart, L., Salem, A., & Berry, L. (1998). Exploring Textual Data.
https://doi.org/10.1007/978-94-017-1525-6
Leydesdorff, L., de Moya-AnegÃ3n, F., & Guerrero-Bote, V. P. (2009). Journal maps
on the basis of Scopus data: A comparison with the journal citation reports of
the ISI. Journal of the American Society for Information Science and
Technology, n/a-n/a. https://doi.org/10.1002/asi.21250
Morris, R. (1994). Computerized content analysis in management research: A
demonstration of advantages & limitations. Journal of Management, 20(4),
903–931. https://doi.org/10.1016/0149-2063(94)90035-3
Muñoz-Leiva, F., Viedma-del-Jesús, M. I., Sánchez-Fernández, J., & López-Herrera,
A. G. (2012). An application of co-word analysis and bibliometric maps for
detecting the most highlighting themes in the consumer behaviour research
from a longitudinal perspective. Quality & Quantity, 46(4), 1077–1095.
https://doi.org/10.1007/s11135-011-9565-3
Murtagh, F. (2005). Correspondence analysis and data coding with Java and R.
Boca Raton, FL: Chapman & Hall/CRC.
68

Chapter 2. Identifying research topics in marketing science along the past decade: a content analysis
Nel, D., van Heerden, G., Chan, A., Ghazisaeedi, M., Halvorson, W., & Steyn, P.
(2011). Eleven years of scholarly research in the Journal of Services
Marketing. Journal of Services Marketing, 25(1), 4–13.
https://doi.org/10.1108/08876041111107014
Porter, M. F. (1980). An algorithm for suffix stripping. Program, 14(3), 130–137.
https://doi.org/10.1108/eb046814
SCImago. (2017). Journal and Country Rank, 2017. Retrieved September 25, 2019,
from http://www.scimagojr.com/journalrank.php?category=1406
Stavrianou, A., Andritsos, P., & Nicoloyannis, N. (2007). Overview and semantic
issues of text mining. ACM SIGMOD Record, 36(3), 23.
https://doi.org/10.1145/1324185.1324190
Stemler, S. (2001). An Overview of Content Analysis. 7(17), 137–146.
Stemler, S. E., Bebell, D., & Sonnabend, L. A. (2011). Using School Mission
Statements for Reflection and Research. Educational Administration
Quarterly, 47(2), 383–420. https://doi.org/10.1177/0013161X10387590
Thomson Reuters. (2016). 2016 Journal Citation Reports® Impact Factor Journal of
Marketing. Retrieved from
https://jcr.incites.thomsonreuters.com/JCRJournalProfileAction.action?pg=JR
NLPROF&journalImpactFactor=2.256&year=2014&journalTitle=JOURNA
L%20OF%20MARKETING%20RESEARCH&edition=SSCI&journal=J%20
MARKETING%20RES
Wang, P., Bradlow, E. T., & George, E. I. (2014). Meta-analyses using information
reweighting: An application to online advertising. Quantitative Marketing
and Economics, 12(2), 209–233. https://doi.org/10.1007/s11129-014-9145-7
69

Doctoral Thesis
Héctor Hugo Pérez Villarreal
Weismayer, C., & Pezenka, I. (2017). Identifying emerging research fields: A
longitudinal latent semantic keyword analysis. Scientometrics, 113(3), 1757–
1785. https://doi.org/10.1007/s11192-017-2555-z
70

Chapter 3. Food values, benefits and their influence on attitudes and intention to buy hamburgers: Evidence
obtained in Mexico


Chapter 3. Food values, benefits and their influence on attitudes and intention to buy hamburgers: Evidence obtained in Mexico
Abstract
Food values have been proposed as determinants of purchase intention in fast-food
restaurants. The objective of this research is twofold: (1) to analyze the effect of food
values and their related benefits (both hedonic and utilitarian) on attitudes toward
eating hamburgers in fast-food restaurants; and (2) to evaluate the influence of
attitudes, food values, and their related benefits (both hedonic and utilitarian) on the
intention to consume this kind of food. To do this, this research adapted the food values
scale proposed by Lusk & Briggeman (2009) to the context of fast-food restaurants.
The data were collected from a survey of 512 Mexican fast-food consumers and
analyzed using SEM. The results show that people’s attitudes toward eating
hamburgers and the food’s hedonic benefits, exert a strong influence on the intention
to buy; in contrast, food values and utilitarian benefits have a relatively lower influence
on people’s attitudes toward eating hamburgers.
Keywords: Food values, utilitarian benefits, hedonic benefits, attitudes toward eating
hamburgers, purchase intention.
73


Chapter 3. Food values, benefits and their influence on attitudes and intention to buy hamburgers: Evidence obtained in Mexico
3.1 Introduction
In recent years, both academics and managers have taken a special interest in exploring
consumer behavior in terms of the food decision-making process. This interest
encompasses a few different phenomena: From an academic perspective, some studies
(e.g., Barahona, Hernández, Pérez-Villarreal, & Martínez-Ruíz, 2018) have found how
the term food have been acquiring a growing relevance in the marketing discipline,
especially in relation to particular fields such as consumer choice and design and
management of marketing channels. The literature is also devoting greater attention to
relatively new concepts such as food values by analyzing their role in food purchasing
and consumption processes (Lusk, 2011; Lusk & Briggeman, 2009; Martínez-Ruiz &
Gómez-Cantó, 2016). These efforts speak to a broader attempt at understanding and
forging bonds with consumers, as reflected in marketing approaches such as Marketing
3.0 and Marketing 4.0 (Martínez-Ruiz & Gómez-Cantó, 2016).
Meanwhile, from a managerial perspective, companies in the food industry recognize
that success in today’s competitive food markets begins with understanding how
product attributes influence consumers’ food decision-making processes (Enneking,
Neumann, & Henneberg, 2007; Estiri, Hasangholi, Yazdani, Nejad, & Rayej, 2010).
As (Grunert & Grunert, 2006) suggests, developing an understanding of consumers—
and particularly how to manage relationships with them—can be a key competitive
advantage for food companies. Unsurprisingly, then, many companies are trying to
devise strategies to better understand consumers’ purchasing behaviors.
In this regard, it is important to consider that consumers’ food choices are more
complex than ever before, which has made it all the more difficult to understand and
predict such behavior (Grunert & Grunert, 2006). Many studies have tried to identify
75

Doctoral Thesis
Héctor Hugo Pérez Villarreal
consumer preferences for specific product attributes, without taking into account the
wide range of products at consumers’ disposal that are characterized by an even wider
variety of attributes (Lister, Tonsor, Brix, Schroeder, & Yang, 2017). For this reason,
Lusk & Briggeman (2009) studied the general classifications of food values, which
express more abstract attributes that can explain consumer purchases over time. These
food values often encompass numerous physical attributes simultaneously and may be
responsible for consumers preferring one product over another (Lusk, 2011; Lusk &
Briggeman, 2009).
However, a product’s associated food values can differ from the benefits it confers to
consumers. These benefits can substantially influence subsequent marketing outcomes
such as satisfaction, repeat purchases, recommendations, etc. (Bloch, 1986; C. Otnes,
A. Ruth, & Marie Crosby, 2014). In order to satisfy their needs, consumers emphasize
values that provide certain benefits related to pleasure, utility, or in some cases, both
(Ghosh Chowdhury, Murshed, & Khare, 2018). The relevant literature has
traditionally considered benefits in terms of a product’s attributes: For example,
Chitturi, Raghunathan, & Mahajan (2008) categorized said benefits as hedonic and
utilitarian, while Crowley, Spangenberg, & Hughes (1992) noted that these benefits
can be high or low depending on the product. Consistent with work done by Chitturi
et al. (2008), this research distinguishes between the hedonic and utilitarian benefits
associated with food values.
Another variable to consider in the food decision-making process is consumers’
attitude. In general, people’s attitude toward consuming a product stems from their
perceptions of the object’s attributes or characteristics (Mowen & Minor, 1998;
Verbeke & Viaene, 1999). Because attitudes influence behavior, they can help to
explain consumers’ food choices. Furthermore, attitude influences consumers’
76

Chapter 3. Food values, benefits and their influence on attitudes and intention to buy hamburgers: Evidence obtained in Mexico
intention, which is an intermediate step between attitude and behavior. Intentions
reflect a person's decision to perform a certain behavior, which will only be taken when
the person has total control over the behavior (Fishbein & Ajzen, 1975).
In the field of food consumption, scholars have devoted substantial attention to fast
food, which remains the fastest-emerging food category all over the world (Goyal &
Singh, 2007). Consequently, fast food consumption has become an international trend
(Lang, 2003) that can be explained by different factors: On one hand, there is
increasing competition among companies for a larger market share and better customer
positioning; on the other hand, there has been momentous demographic growth (in
terms of the number of people, income per capita, education and GDP; Beatriz Madeira
& Giampaoli, 2017) alongside changes in consumer lifestyles (Lang, 2003).
Unsurprisingly, there has been a huge number of publications on the fast-food industry
since the 1980s (Mcneal, Stem, & Nelson, 1980), with recent researchers devoting
their attention to analyzing consumption at fast-food restaurants (Ghoochani, Torabi,
Hojjati, Ghanian, & Kitterlin, 2018).
Building on this growing interest, the present work analyzes the decision process
behind consuming a particular type of fast food: hamburgers. Specifically, this study
aims to examine the effect of food values and their related benefits (both hedonic and
utilitarian) on people’s attitudes toward eating hamburgers in fast-food restaurants, as
well as to evaluate the influence of attitudes, food values, and their benefits (both
hedonic and utilitarian) on the intention to acquire such food. The remainder of this
paper covers the following: In the next section, it is present the conceptual framework
and the hypothesized relationships between variables. Afterward, it is describe the
empirical work and the subsequent results. Finally, the paper concludes by discussing
the main findings and managerial implications.
77

Doctoral Thesis
Héctor Hugo Pérez Villarreal
3.2 Conceptual Framework
In the field of food, one of researchers’ major tasks has been to explain food
consumption behavior (Tuu, Olsen, Thao, & Anh, 2008). Among the diverse theories
advanced for such purposes Shepherd (1989), Ajzen, (1991) theory of planned
behavior (herafter, TPB) has attracted broad application and empirical support in
several domains, such as the intention to eat pizza, snacks, genetically modified food,
meat, beer, a low-fat diet or healthy foods (e.g., Louis, Davies, Smith, & Terry (2007);
Tuu et al., (2008). This theory originates within the expectancy–value tradition of
attitude–behavior research, and offers a simple model with a big virtue of parsimony
(Eagly & Chaiken, 1993). In recent years, scholars have suggested several extensions
and modifications to this theory to improve its predictive and exploratory power
(Armitage & Conner, 2001; Conner & Armitage, 1998; Tuu et al., 2008). Against this
background, it can see this adopt this theoretical framework to assess the intention to
consume a certain kind of food (i.e., hamburgers). Importantly, it will utilize attitude
toward consuming this food, as well as food values and their related benefits, as
predictors of people’s intentions.
3.2.1 Food values and benefits
Traditionally, the scientific community has shown great interest in the relationship
between individuals and their food purchase decisions. Today’s consumers face a
complex environment for food choices; thus, understanding and predicting the choice
process has become a difficult task. Some have even claimed that consumers act
irrationally or even randomly when choosing food products (Grunert & Grunert,
2006). However, it may be more accurate to say that consumers have developed more
78
Chapter 3. Food values, benefits and their influence on attitudes and intention to buy hamburgers: Evidence obtained in Mexico
dynamic, complex and differentiated demands, and thus their food choices are
influenced by multiple aspects (Grunert & Grunert, 2006).
However, consumers assign different importance to the attributes of a given food
product. Many studies have tried to identify consumer preferences for specific product
attributes, but this task is confounded by the fact that consumers have a wide range of
products at their disposal, which feature an even wider variety of attributes or
characteristics (Lister et al., 2017). For this reason, Lusk & Briggeman (2009) studied
the general classifications of food in the form of food values, which express more
abstract attributes that can explain consumer purchases over time. In this sense,
consumers base their product choices on a set of inferred food values, which often
encompass numerous physical attributes simultaneously (Lusk & Briggeman, 2009).
Specifically, Lusk & Briggeman (2009) identified the food values of naturalness, taste,
price, safety, convenience, nutrition, origin, fairness, tradition, appearance, and
environmental impact. Lusk (2011) adopted these same values, but later researchers
added others such as animal welfare or novelty (see for instance, Bazzani, Gustavsen,
Nayga, & Rickertsen, 2018). Likewise, some research (e.g., (Izquierdo-Yusta, Gómez-
Cantó, Pelegrin-Borondo, & Martínez-Ruiz, 2019) has focused on segmenting
consumers according to food values. In this vein, these authors identified three groups
of consumers: 1) mainly utilitarian, focusing on food values such as price; 2) mainly
hedonic, focusing on food values such as taste; and 3) mainly ethical, focusing on
values such as environmental impact. Put differently, consumers pursue food products
on the basis of some objective(s), which are reflected in the benefits that consumers
perceive in the product.
Along this line, Batra & Ahtola (1991) suggested that consumers buy goods and
services and perform consumption behaviors for two basic reasons: (1) consummatory
79

Doctoral Thesis
Héctor Hugo Pérez Villarreal
affective (hedonic) gratification (from sensory attributes), and (2) instrumental,
utilitarian reasons related to achieving some result. Hedonic benefits are oriented
around increasing the likelihood of a pleasant experience and, by extension, positive
emotions, while utilitarian benefits are oriented around balancing functional objectives
with the related sacrifices (e.g., of time, money) (Batra & Ahtola, 1991; Dhar &
Wertenbroch, 2000; Voss, Spangenberg, & Grohmann, 2003). Therefore, hedonic
benefits are more subjective and personal; utilitarian benefits are more geared toward
achieving a task (Babin, Darden, & Griffin, 1994). Because people generally prioritize
the avoidance of harm or pain and treat pleasure as a luxury, utilitarian benefits are
often emphasized over hedonic ones.
Building on this argument, Chitturi et al. (2008) proposed that hedonic and utilitarian
consumption fundamentally differ in the emotional experience they offer: delight or
satisfaction, respectively. Therefore, the authors predicted that the type of positive
emotional response evoked by consuming a product depends on whether the offer
exceeds the expectations for utilitarian or hedonic benefits. They argued that exceeding
utilitarian expectations will only result in satisfaction, but exceeding hedonic
expectations will produce a feeling of delight. On the contrary, failing to fulfill
utilitarian or hedonic expectations would cause anger or dissatisfaction, respectively.
It is important to note that, in recent years, health-related food attributes have become
just as important to consumption as non-health related attributes such as taste, sensory
appeal, familiarity, or convenience. In particular, Maehle, Iversen, Hem, & Otnes
(2015) pointed out how taste was higher for hedonic products than for utilitarian
products; and price was lower for hedonic products than for utilitarian products due to
the differences in price sensitivity for utilitarian and hedonic products (Wakefield &
Inman, 2003). Moreover, environmental friendliness was found to be lower for a
80

Chapter 3. Food values, benefits and their influence on attitudes and intention to buy hamburgers: Evidence obtained in Mexico
hedonic product than for a utilitarian product, which contradicts the investigation of
Lascu (1991). The importance of the healthiness was lower for utilitarian food
products than for the hedonic ones. In addition, Raghunathan, Naylor, & Hoyer (2006)
argued that unhealthy products are preferred when a hedonic goal is more salient. For
Cramer & Antonides (2011), Loebnitz & Grunert (2018), and (Khongrangjem et al.,
2018), taste was considered a hedonic factor.
From these ideas, and consistent with Batra & Ahtola, (1991); Chitturi et al. (2008);
Dhar & Wertenbroch (2000); Strahilevitz & Myers (1998), it will use utilitarian
benefits to refer to the functional, instrumental and practical benefits of food values,
and hedonic benefits to refer to the aesthetic, experiential, and enjoyment-related
benefits of food values.
3.2.2. Attitudes and intention
In the field of cognitive psychology, attitude is the main factor that guides and
determines human behavior (Bredahl, 2001). Appropriately, attitude is an important
predictor of the intention to consume food (Bonne, Vermeir, & Verbeke, 2008; Saba
& Di Natale, 1998; Tuu et al., 2008).
In this regard, the Theory of Reasoned Action (hereafter, TRA) usefully encapsulates
the attitude-behavior relationships that link attitudes with subjective norms, behavioral
intentions and behavior in a fixed causal sequence. This theory presumes that behavior
is a direct function of intention, which is itself a function of attitude and subjective
norm. Moreover, a person’s attitude towards performing the behavior is deemed to be
a summed product of individuals' beliefs and their evaluation of said beliefs (Ajzen &
81

Doctoral Thesis
Héctor Hugo Pérez Villarreal
Fishbein, 1980). This theory underlies Ajzen (1991) Theory of Planned Behavior
(TPB), in which the attitude toward the behavior reflects the degree to which a person
has a favorable or unfavorable appraisal of the behavior in question. In this setup,
people’s beliefs about the outcome of the behavior, as well as their evaluations of these
outcomes, produce an ‘attitude towards the behaviour’ (Ajzen, 1991). TPB posits that
people will be more likely to engage in a given behavior when they hold a positive
attitude toward participating in said behavior.
In general, people’s attitudes toward an object (in this case, a food product) result from
a perceived combination of the object’s attributes or characteristics (Mowen & Minor,
1998; Verbeke & Viaene, 1999). When consumers hold a positive attitude towards a
certain food product, they will be more likely to purchase said product and probably
show a positive attitude toward the providing establishment. In this vein, Haws &
Winterich (2013) described four key aspects of people’s attitude toward eating
hamburgers: pleasure, enjoyment, satisfaction, and good taste.
Any discussion of attitude should account for intention, which serves as a bridge
concept between attitude and behavior. Previous studies have identified a positive
predictive relationship between people’s attitude toward and intention to buy and
consume a food product (Haws & Winterich, 2013; Zhang et al., 2018). For example,
Thøgersen (2009) and Chen (2009) suggested that a positive attitude galvanizes
consumers’ intention to purchase organic food. Likewise, Chen (2009) found that
people’s attitudes toward eating hamburgers influences their purchase intention. In
general, in the context of fast food, it has been commonly found how the attitude
toward eating hamburgers is a relevant variable in behavioral intention toward eating
with an emphasis in healthy consumption, with a dependence on fast food representing
82

Chapter 3. Food values, benefits and their influence on attitudes and intention to buy hamburgers: Evidence obtained in Mexico
a strong barrier to healthier food (Chan & Tsang, 2011; Close, Lytle, Chen, & Viera,
2018; Luomala et al., 2015).
3.2.3. Hypotheses
Following the framework of TPB (Ajzen, 1991), this research aimed to assess people’s
intention to consume a certain kind of food (hamburgers) while incorporating several
variables as predictors (i.e., food values, their related benefits, and people’s attitudes).
Building on the idea that consumption decisions can be complex, this study accounts
for the formation of attitudes and preferences that underlie behaviors (Jun, Kang, &
Arendt, 2014). Consequently, this study incorporated aspects related to certain food
values—such as nutritional value, taste value, price value, or the benefits associated
with these types of values—that are likely to influence attitudes. For example, some
research (Ghoochani et al., 2018; Law, Hui, & Zhao, 2004) has highlighted that the
importance consumers place on health can influence their attitudes toward food.
Moreover, Mattsson & Helmersson (2007) concluded that Swedish high school
students are generally aware of fast food’s negative side effects and accordingly pay
more attention to nutritional and health concerns than to price, speed, and convenience.
On the other hand, Jekanowski et al. (2001) found that fast-food demand depends on
its availability. Given the above, this study developed the following hypotheses:
H1. Food values are positively and significantly associated with attitudes
toward eating hamburgers.
H2. Utilitarian benefits related to food values are positively and significantly
related with attitudes towards eating hamburgers.
83

Doctoral Thesis
Héctor Hugo Pérez Villarreal
H3. Hedonic benefits related to food values are positively and significantly
related with attitudes toward eating hamburgers.
Scholars have found that people’s intention to acquire fast food largely depends on
their attitudes and the benefits associated with the products. For example, preserving
health and well-being is a cornerstone concern for many consumers; thus, they want
to understand the nutritional value of what they eat and strive to follow a balanced diet
that decreases the risk of obesity and chronic diseases. Given this concern, many
studies have tried to verify the importance of such variables on people’s intention to
eat fast food. For instance, Dunn, Mohr, Wilson, & Wittert (2008) found that
consumers are largely aware of the high fat content of fast foods, and yet generally
appreciate their taste and convenience. Thus, they may experience an ambivalence
toward fast food that reflects a trade-off in decision-making: between short-term
rewards (as captured by affective responses toward taste and convenience) and long-
term costs (as reflected in understanding the cumulative health risk). How people
resolve this ambivalence likely depends on the consideration they give to future
consequences when making decisions (Dunn, Mohr, Wilson, & Wittert, 2011).
Strathman, Gleicher, Boninger, & Edwards (1994) argued that people who consider
the future consequences of their behaviors are more likely to forgo immediate reward,
whereas their counterparts tend to have trouble delaying gratification and display little
concern for the longer-term effects of their behaviors (Dunn et al., 2011). This is a
particularly important issue for health-promoting behaviors, such as diet and exercise,
which tend to produce negative outcomes in the short-term. Scholars have argued that
an ability to foresee and value the future consequences of health-related behaviors
likely plays a part in the formation of the related intention (Sirois, 2004). For many,
eating fast food has a positive short-term consequence in terms of immediate satiation
84

Chapter 3. Food values, benefits and their influence on attitudes and intention to buy hamburgers: Evidence obtained in Mexico
and hedonic pleasure (Dunn et al., 2008), even though the long-term consequences of
regularly eating energy-dense food are generally assumed to be negative. Based on the
above, and applying the TPB framework, it could be advance the following
hypotheses:
H4. Utilitarian benefits related to food values are positively and significantly
related with purchase intention.
H5. Hedonic benefits related to food values are positively and significantly
related with purchase intention.
H6. Attitude toward eating hamburgers is positively and significantly related
to purchase intention.
In sum, this research tested six hypotheses inspired by the literature (illustrated in
Figure 3.1).
85

Doctoral Thesis
Héctor Hugo Pérez Villarreal
Figure 3.1 Model development.
3.3 Methodology
To test the model proposed in Figure 3.1, this study designed a questionnaire intended
to obtain information related to participants’ socio-demographic profile and the study
variables (food values, utilitarian benefits related to food values, hedonic benefits
related to food values, attitudes toward eating hamburgers, and purchase intention).
For the food-value variables, we adapted the scales from Lusk & Briggeman (2009)
and Lusk (2011). These questions focused on the importance that respondents assigned
to these corresponding values on a scale from 1 (least important) to 5 (most important).
In contrast, to assess the hedonic and utilitarian benefits, the food values scale was
adapted to the hedonic and utilitarian benefits, using a 5-point Likert scale (where 1
was the least important and 5 the most). Finally, the attitudes and purchase intentions
variables were obtained from the literature review and adapted to this research, using
a 5-point Likert scale (where 1 was the least important and 5 the most). This research
86

Chapter 3. Food values, benefits and their influence on attitudes and intention to buy hamburgers: Evidence obtained in Mexico
distributed the survey among consumers in Puebla City, Mexico. Participation was
voluntary, and in the end, 512 participants completed the questionnaire.
Table 3.1 Technical details of the research
Universe Residents in Metropolitan Area of Puebla-
Tlaxcala, Mexico
Sample unit People over 17 years old and buyers of fast food
Data collection method Personal survey
Sample error P=q=0.5; 5% K= 2; e = ±4.335
Level of reliability 95%
Sample procedure Probabilistic
Number surveyed 512 valid surveys
Period of information collection January 26 - May 23 (2018)
Fast food restaurant McDonald’s
3.4 Analysis
The participants were 58% female and 42% male. Almost 80% were between 17-34
years old, and about 70% were single. Moreover, 62.9% had bachelor’s degrees, while
32.8% had a monthly income below 300 USD (See Table 3.2).
87

Doctoral Thesis
Héctor Hugo Pérez Villarreal
Table 3.2 Sample characteristics.
Variable Items (%) Variable Items (%)
Gender Male 42 Marital
status
Single 69.9
Female 58 Married without children 6.4
Age 17-24 34 Married with children under 15 12.1
25-34 44.5 Married with children over 16 6.8
35-44 10.9 Divorced 0.8
45-54 5.7 Divorced with children under 15 1.4
55-64 3.9 Divorced with children over 16 1.6
65-74 0.6 Widowed 1
75-84 0.4 Income Less than 300 USD 32.8
Study
levels
Less than high school 5.1 301-450 USD 16.2
High school 16.6 451-600 USD 19.4
Bachelor 62.9 601-750 USD 12.1
Graduate / Master 15.4 more than 751 USD 19.5
The PLS SEM was used (in conjunction with the SmartPLS 3.2.8 software) to validate
the model proposed in Figure 3.1. To establish the significance of the parameters, this
method performed bootstrapping with 10,000 resamples. To ensure construct
reliability and validity, it was examined the indicator loadings for the reflective
constructs. Those items with a loading of less than 0.7 were omitted (J. Hair,
Hollingsworth, Randolph, & Chong, 2017). The ‘food values’ variable was considered
a formative construct. Unlike reflective indicators, formative indicators are not
interchangeable; therefore, omitting a single indicator can reduce the validity of the
measurement model’s content (Diamantopoulos & Papadopoulos, 2010).
88

Chapter 3. Food values, benefits and their influence on attitudes and intention to buy hamburgers: Evidence obtained in Mexico
In the next step, it was calculated the construct reliability and validity. The most
commonly used criterion is that proposed by Jöreskog (1971), which establishes that
values over the 0.7 to 0.9 range are considered good or very good (see Figure 3.2).
Also it was calculated Cronbach’s alpha, composite reliability, and average variance
extracted (AVE). The Cronbach’s alpha coefficient was acceptable, as all constructs
achieved a coefficient greater than .7 (J. F. Hair, 2010). Similarly, the AVE of each
individual construct exceeded the acceptability value .5 (Fornell & Larcker, 1981;
Huang, Wang, Wu, & Wang, 2013). In fact, the composite reliability (CR) values
below .6 indicate a lack of internal consistency reliability (J. Hair et al., 2017). In the
same way, the Rho A is considered homogenous if this index is larger than .7 (Werts,
Linn, & Jöreskog, 1974) (see Table 3.3).
Table 3.3 Construct reliability and validity
Cronbach’s alpha rho A (CR) AVE
Attitudes toward eating hamburgers .847 .858 .898 .687
Food values N.A. (1) 1.0 N.A. N.A.
Hedonic benefits related to food values .831 .850 .887 .662
Purchase intention .862 .901 .916 .784
Utilitarian benefits related to food values .852 .857 .887 .529
N.A. (1) = Not Applicable
Afterward this study was examined discriminant validity, which is apparent if the correlation coefficient of two dimensions is less than the square root of the AVE (Fornell & Larcker, 1981).
89

Doctoral Thesis
Héctor Hugo Pérez Villarreal
Table 3.4 Discriminant validity
Attitude toward eating
hamburger
Food
values
Hedonic
benefits
Purchase
intention
Utilitarian
benefits
Attitude toward eating
hamburger .829
Food values .437
Hedonic benefits related
food values .07 .652 .814
Purchase intention .519 .390 .448 .885
Utilitarian benefits
related food values .459 .540 .726 .463 .727
After evaluating all the measurement instruments’ psychometric properties, the model proposed was estimated in Figure 3.1. The estimated final model is shown in Figure 3.2 and Table 3.5.
Table 3.5 Path coefficients
Hypothesis Relationship Beta t-value p-value
H1 Food values -> Attitudes .166 3.235 .001***
H2 Utilitarian benefits -> Attitudes .170 3.156 .002***
H3 Hedonic benefits -> Attitudes .275 4.652 .000***
H4 Utilitarian benefits -> Purchase intention .200 3.400 .001***
H5 Hedonic benefits -> Purchase intention 0.131 2.095 0.036**
H6 Attitudes -> Purchase intention .380 8.162 .000***
R2 Attitude = .290; R2 Intention = .359
Note: *** p < 0.001, ** p < 0.05
90

Chapter 3. Food values, benefits and their influence on attitudes and intention to buy hamburgers: Evidence obtained in Mexico
Figure 3.2 Structural model
Regarding the validity of all constructs, Figure 3.2 illustrates the factor loadings of
indicators on the assigned construct; therefore, they have to be higher than all loading
of other constructs with condition that the cut-off value of factor loading is higher than
.7 (Fornell & Larcker, 1981). Note that the PLS algorithm produces loadings (weights)
between reflective (formative) constructs and their indicators.
For the formative construct (food values), the best-rated items were taste, tradition,
appearance and convenience (.524; .325; .275; .234). However, the same construct
91

Doctoral Thesis
Héctor Hugo Pérez Villarreal
showed negative weights for environmental impact, nutrition and origin (-.238, -.232,
-.037). For the utilitarian benefits related to food values, the best loadings were safety
and convenience (.776; .774), while price did not form a strong part of the construct.
For the hedonic benefits related to food values, the best loadings were taste and
convenience (.853; .827). Both constructs share some items with levels of utilitarian
and hedonic composition.
Finally, it was calculated the mediating effect of attitudes in relation to utilitarian /
hedonic benefits and intentions. Following several steps in order to test the indirect
effects in PLS (adapted from Chin, 2010). Specifically, these are the steps developed
in the works of Zhao, Lynch, & Chen (2010) and Nitzl, Roldan, & Cepeda (2016). The
first step involves evaluating the significance of the indirect effects (AxB). To test this
significance, bootstrapping with 10,000 subsamples has been performed and the values
of the direct effects obtained have been multiplied. For the second step, it was
determined the type and magnitude of the indirect effect. To this end, it was calculated
the Variance Accounted For (VAF), which assesses the size of the indirect effect on
the total effect (direct effect + indirect effect) (Hair, 2014). In other words, this test
determines the extent to which the mediation process explains the variance of the
dependent variable (Carrión, Nitzl, & Roldán, 2017).
In the case of the present investigation, it has been observed that the mediating effect
of the attitude and the relationship between Utilitarian Benefits and Purchase
Intentions does not occur, as can be seen in the following formula:
(0,170*0,380) / ((0,200+(0,170*0,380)) = 24.4% Partial Mediation
92

Chapter 3. Food values, benefits and their influence on attitudes and intention to buy hamburgers: Evidence obtained in Mexico
Regarding the mediating effect of the attitude and the relationship between hedonic
benefits and purchase intentions, it does not occur, as can be seen in the following
formula:
(0,275 * 0,380) / ((0,131 + (0,275 * 0,380)) = 44.37 % Partial Mediation
With all the information it was confirmed support for all the hypotheses through the
path coefficient, standard error, t-value, and p-value. The most important effects (from
greater to least effect) were: attitude on purchase intention (H6), hedonic benefits on
attitudes (H3); utilitarian benefits on purchase intentions (H4); utilitarian benefits on
attitudes (H2); food values on attitudes (H1) and hedonic benefits on purchase
intention (H5).
As can be seen in Table 3.5, Hypothesis H6, Attitudes > Purchase Intentions, is the
relationship that obtained the greatest β, .380 (ρ = .000 ***). This finding aligns with
previous research about the importance of attitudes on intentions. The relationship with
the second-greatest weight was the one postulated by H3 (β = .275; ρ = .000 ***),
underscoring the importance of the hedonic benefits provided by food values on the
formation of attitudes. The third-most important relationship was the one posited by
H4 (β = .200; ρ = .001 ***), which highlights the importance of utilitarian benefits on
intentions. This finding suggests that consumers apply rationality to the choice
process, as they assign more weight to utilitarian benefits than hedonic benefits on the
intention to buy. The fourth-most important relationship, captured by H2 (β = .170; ρ
= .002 ***), underlines the importance of utilitarian benefits on attitude. Meanwhile,
the support for H1 (β = .166; ρ = .001 ***) suggests that food values influence
attitudes; even though β did not reach a very high value in the model, this relationship
is still meaningful. Since these are the values that form consumer attitudes towards this
93

Doctoral Thesis
Héctor Hugo Pérez Villarreal
type of food, it should be noted that given the type of food, the fact that consumers
show favorable attitudes is important. Finally, the relationship posited by H5 (β = .131;
ρ = .036 **), regarding the influence of the hedonic benefits on purchase intentions,
the contrast of the hypotheses corroborates the rationality of the consumer. It should
be noted here that although the hedonic benefits have a very strong weight on the
attitudes, these - hedonic benefits - are not as important as in the moment prior to the
purchase decision, where it was verified how the utilitarian benefits are more relevant.
In sum, the results substantiate the following points: (1) that attitudes influence the
intentions toward future behavior, in line with the TPB; (2) that when forming attitudes
toward consuming hamburgers in fast-food establishments, consumers consider food
values that align with Lusk and Briggeman’s scale (2009); (3) that consumers base
their initial attitudes towards consuming fast food more on the hedonic component (the
affective dimension of attitude), but when considering whether to buy the product
again, they apply more value to the utilitarian component (the behavioral dimension
of attitude).
3.5 Conclusions
Given the massive growth and success of the fast food industry, scholars have been
eager to analyze the strategies of the most important brands and translate those
strategies to other sectors. This aligns with a desire among many companies to not
only seek a larger market share and better consumer positioning, but also to adapt to
changing consumer lifestyles and demographic patterns. On this basis, the present
work analyzed consumers’ decision-making process with regard to a specific type of
fast food (namely, hamburgers). To this end, it was showed the effect of food values
and their related benefits (both hedonic and utilitarian) on people’s attitudes toward
94

Chapter 3. Food values, benefits and their influence on attitudes and intention to buy hamburgers: Evidence obtained in Mexico
eating hamburgers in fast-food restaurants, as well as the influence of attitudes and
food value-related benefits (both hedonic and utilitarian) on the intention to acquire
such food.
It is found support for all proposed hypotheses. First, with regard to the influence of
food values on attitude, this research revealed the importance that consumers attach to
each value on the proposed scale. Specifically, respondents assigned the most
importance to taste, tradition, appearance and convenience. Previous studies have also
emphasized these values and as in this research, the price is not one of the values that
have much weight. The latter is in line with the product category, since its cost is
reduced. It is noteworthy that the weights for the values “environmental impact”,
"nutrition" and "origin" (although to a very minor extent) are negative. The low weight
for “environmental impact” could suggest that consumers think that eating hamburgers
has little impact on the environment. Similarly, the results for “nutrition” and “origin”
could indicate, respectively, that consumers are aware that hamburgers are “unhealthy”
and do not particularly care about the origin of this type of food.
Second, these results align with prior research in stressing the importance of hedonic
and utilitarian benefits. However, it should be noted that "convenience" has been
valued as a hedonic benefit. Sometimes, the “delight” of a meal, or dinner, can be
frustrated by the waiting times to be attended, to the delay in providing the service
(once requested). In other words, it appears that a benefit with a utilitarian character
(in this case, convenience) can assume a hedonic shape.
As for the utilitarian benefits, all of them have been very well valued by the consumers.
Highlighting here as a benefit, which can be considered hedonic-appearance-has been
valued as a utilitarian benefit. This result seems reasonable: When assessing a product,
95

Doctoral Thesis
Héctor Hugo Pérez Villarreal
consumers consider its costs in the context of its presentation, which can then come to
seem like a utilitarian benefit.
In addition, both hedonic and utilitarian benefits positively support the formation of
positive attitudes towards hamburger consumption, at least for those sold by
McDonald’s. It is noteworthy of this last aspect, since it is not the same to eat a product
such as hamburgers when the whole process is controlled by the consumer, or when
attending a restaurant (not fast-food), which has some quality indicator (Michelin stars,
number of forks, etc.), when consumed at McDonald's, where no quality process is
controlled and is considered a fast-food restaurant.
In addition, this study highlights the mediating effect of attitude on the relation
between utilitarian / hedonic benefits and intentions. This finding confirms that both
benefit types exert weight on intentions, but this weight is nonetheless higher for
hedonic benefits. This is a novel finding, as prior research has not tested these
mediating effects.
Finally, it was observed an association between attitudes toward eating hamburgers
and purchase intention, which is consistent with previous research.
In terms of managerial implications, fast-food companies should keep in mind that
consumers have settled on the idea that their hamburgers are “unhealthy” (negative
weight of food values), but still like this food type for values such as taste, tradition,
appearance and convenience. In the long term, these companies should adjust their
advertising messages to emphasize healthier values. New consumer segments are more
informed, look at nutritional information, value eating “healthy” products that do not
harm the environment, and may be willing to pay a premium price to satisfy their
preferences. In this regard, it is important to remember that people’s consumption
attitudes can change in tandem with the shifting importance assigned to hedonic and
utilitarian benefits.
96

Chapter 3. Food values, benefits and their influence on attitudes and intention to buy hamburgers: Evidence obtained in Mexico
3.6 References
Ajzen, I. (1991). The theory of planned behavior. Organizational Behavior and
Human Decision Processes, 50(2), 179–211. https://doi.org/10.1016/0749-
5978(91)90020-T
Ajzen, I., & Fishbein, M. (1980). Understanding attitudes and predicting social
behavior (Pbk. ed). Englewood Cliffs, N.J: Prentice-Hall.
Armitage, C. J., & Conner, M. (2001). Efficacy of the Theory of Planned Behaviour:
A meta-analytic review. British Journal of Social Psychology, 40(4), 471–
499. https://doi.org/10.1348/014466601164939
Babin, B. J., Darden, W. R., & Griffin, M. (1994). Work and/or Fun: Measuring
Hedonic and Utilitarian Shopping Value. Journal of Consumer Research,
20(4), 644. https://doi.org/10.1086/209376
Barahona, I., Hernández, D. M., Pérez-Villarreal, H. H., & Martínez-Ruíz, M.
(2018). Identifying research topics in marketing science along the past
decade: A content analysis. Scientometrics, 117(1), 293–312.
https://doi.org/10.1007/s11192-018-2851-2
Batra, R., & Ahtola, O. T. (1991). Measuring the hedonic and utilitarian sources of
consumer attitudes. Marketing Letters, 2(2), 159–170.
https://doi.org/10.1007/BF00436035
97

Doctoral Thesis
Héctor Hugo Pérez Villarreal
Bazzani, C., Gustavsen, G. W., Nayga, R. M., & Rickertsen, K. (2018). A
comparative study of food values between the United States and Norway.
European Review of Agricultural Economics, 45(2), 239–272.
https://doi.org/10.1093/erae/jbx033
Beatriz Madeira, A., & Giampaoli, V. (2017). Agglomeration of fast food companies
in Brazil. Management Research: Journal of the Iberoamerican Academy of
Management, 15(3), 292–312. https://doi.org/10.1108/MRJIAM-06-2017-
0752
Bloch, P. H. (1986). The product enthusiast: implications for marketing strategy.
Journal of Consumer Marketing, 3(3), 51–62.
https://doi.org/10.1108/eb008170
Bonne, K., Vermeir, I., & Verbeke, W. (2008). Impact of Religion on Halal Meat
Consumption Decision Making in Belgium. Journal of International Food &
Agribusiness Marketing, 21(1), 5–26.
https://doi.org/10.1080/08974430802480628
Bredahl, L. (2001). Determinants of Consumer Attitudes and Purchase Intentions
With Regard to Genetically Modified Food – Results of a Cross-National
Survey. Journal of Consumer Policy, 24(1), 23–61.
https://doi.org/10.1023/A:1010950406128
98
Chapter 3. Food values, benefits and their influence on attitudes and intention to buy hamburgers: Evidence obtained in Mexico
C. Otnes, C., A. Ruth, J., & Marie Crosby, E. (2014). Product-agency benefits:
Consumer perspectives and strategic implications. European Journal of
Marketing, 48(5/6), 878–898. https://doi.org/10.1108/EJM-02-2012-0063
Carrión, G. C., Nitzl, C., & Roldán, J. L. (2017). Mediation Analyses in Partial Least
Squares Structural Equation Modeling: Guidelines and Empirical Examples.
In H. Latan & R. Noonan (Eds.), Partial Least Squares Path Modeling (pp.
173–195). https://doi.org/10.1007/978-3-319-64069-3_8
Chan, K., & Tsang, L. (2011). Promote healthy eating among adolescents: A Hong
Kong study. Journal of Consumer Marketing, 28(5), 354–362.
https://doi.org/10.1108/07363761111150008
Chen, M. (2009). Attitude toward organic foods among Taiwanese as related to
health consciousness, environmental attitudes, and the mediating effects of a
healthy lifestyle. British Food Journal, 111(2), 165–178.
https://doi.org/10.1108/00070700910931986
Chin, W. W. (2010). How to Write Up and Report PLS Analyses. In V. Esposito
Vinzi, W. W. Chin, J. Henseler, & H. Wang (Eds.), Handbook of Partial
Least Squares (pp. 655–690). https://doi.org/10.1007/978-3-540-32827-8_29
Chitturi, R., Raghunathan, R., & Mahajan, V. (2008). Delight by Design: The Role
of Hedonic Versus Utilitarian Benefits. Journal of Marketing, 72(3), 48–63.
https://doi.org/10.1509/jmkg.72.3.48 99

Doctoral Thesis
Héctor Hugo Pérez Villarreal
Close, M. A., Lytle, L. A., Chen, D.-G., & Viera, A. J. (2018). Using the theory of
planned behavior to explain intention to eat a healthful diet among
Southeastern United States office workers. Nutrition & Food Science, 48(2),
365–374. https://doi.org/10.1108/NFS-06-2017-0123
Conner, M., & Armitage, C. J. (1998). Extending the Theory of Planned Behavior: A
Review and Avenues for Further Research. Journal of Applied Social
Psychology, 28(15), 1429–1464. https://doi.org/10.1111/j.1559-
1816.1998.tb01685.x
Cramer, L., & Antonides, G. (2011). Endowment effects for hedonic and utilitarian
food products. Food Quality and Preference, 22(1), 3–10.
https://doi.org/10.1016/j.foodqual.2010.05.020
Crowley, A. E., Spangenberg, E. R., & Hughes, K. R. (1992). Measuring the hedonic
and utilitarian dimensions of attitudes toward product categories. Marketing
Letters, 3(3), 239–249. https://doi.org/10.1007/BF00994132
Dhar, R., & Wertenbroch, K. (2000). Consumer Choice between Hedonic and
Utilitarian Goods. Journal of Marketing Research, 37(1), 60–71.
https://doi.org/10.1509/jmkr.37.1.60.18718
Diamantopoulos, A., & Papadopoulos, N. (2010). Assessing the cross-national
invariance of formative measures: Guidelines for international business
100

Chapter 3. Food values, benefits and their influence on attitudes and intention to buy hamburgers: Evidence obtained in Mexico
researchers. Journal of International Business Studies, 41(2), 360–370.
https://doi.org/10.1057/jibs.2009.37
Dunn, K. I., Mohr, P. B., Wilson, C. J., & Wittert, G. A. (2008). Beliefs about fast
food in Australia: A qualitative analysis. Appetite, 51(2), 331–334.
https://doi.org/10.1016/j.appet.2008.03.003
Dunn, K. I., Mohr, P., Wilson, C. J., & Wittert, G. A. (2011). Determinants of fast-
food consumption. An application of the Theory of Planned Behaviour.
Appetite, 57(2), 349–357. https://doi.org/10.1016/j.appet.2011.06.004
Eagly, A. H., & Chaiken, S. (1993). The psychology of attitudes. Fort Worth, TX:
Harcourt Brace Jovanovich College Publishers.
Enneking, U., Neumann, C., & Henneberg, S. (2007). How important intrinsic and
extrinsic product attributes affect purchase decision. Food Quality and
Preference, 18(1), 133–138. https://doi.org/10.1016/j.foodqual.2005.09.008
Estiri, M., Hasangholi, T., Yazdani, H., Nejad, H. J., & Rayej, H. (2010). Food
Products Consumer Behaviors: The Role of Packaging Elements. Journal of
Applied Sciences, 10(7), 535–543. https://doi.org/10.3923/jas.2010.535.543
Fishbein, M., & Ajzen, I. (1975). Belief, attitude, intention, and behavior: An
introduction to theory and research. Reading, Mass: Addison-Wesley Pub.
Co.
101

Doctoral Thesis
Héctor Hugo Pérez Villarreal
Fornell, C., & Larcker, D. F. (1981). Evaluating Structural Equation Models with
Unobservable Variables and Measurement Error. Journal of Marketing
Research, 18(1), 39. https://doi.org/10.2307/3151312
Ghoochani, O. M., Torabi, R., Hojjati, M., Ghanian, M., & Kitterlin, M. (2018).
Factors influencing Iranian consumers’ attitudes toward fast-food
consumption. British Food Journal, 120(2), 409–423.
https://doi.org/10.1108/BFJ-12-2016-0612
Ghosh Chowdhury, T., Murshed, F., & Khare, A. (2018). Flexible flexibility! Food
categorization flexibility and utilitarian preference. Journal of Consumer
Marketing, 35(1), 1–10. https://doi.org/10.1108/JCM-11-2016-2010
Goyal, A., & Singh, N. P. (2007). Consumer perception about fast food in India: An
exploratory study. British Food Journal, 109(2), 182–195.
https://doi.org/10.1108/00070700710725536
Grunert, K. G., & Grunert, K. G. (2006). How changes in consumer behaviour and
retailing affect competence requirements for food producers and processors.
https://doi.org/10.22004/ag.econ.8007
Hair, J. F. (Ed.). (2010). Multivariate data analysis: A global perspective (7. ed.,
global ed). Upper Saddle River, NJ: Pearson.
102

Chapter 3. Food values, benefits and their influence on attitudes and intention to buy hamburgers: Evidence obtained in Mexico
Hair, J. F. (Ed.). (2014). A primer on partial least squares structural equations
modeling (PLS-SEM). Los Angeles: SAGE.
Hair, J., Hollingsworth, C. L., Randolph, A. B., & Chong, A. Y. L. (2017). An
updated and expanded assessment of PLS-SEM in information systems
research. Industrial Management & Data Systems, 117(3), 442–458.
https://doi.org/10.1108/IMDS-04-2016-0130
Haws, K. L., & Winterich, K. P. (2013). When Value Trumps Health in a Supersized
World. Journal of Marketing, 77(3), 48–64.
https://doi.org/10.1509/jm.11.0261
Huang, C.-C., Wang, Y.-M., Wu, T.-W., & Wang, P.-A. (2013). An Empirical
Analysis of the Antecedents and Performance Consequences of Using the
Moodle Platform. International Journal of Information and Education
Technology, 217–221. https://doi.org/10.7763/IJIET.2013.V3.267
Izquierdo-Yusta, A., Gómez-Cantó, C. M., Pelegrin-Borondo, J., & Martínez-Ruiz,
M. P. (2019). Consumers’ behaviour in fast-food restaurants: A food value
perspective from Spain. British Food Journal, 121(2), 386–399.
https://doi.org/10.1108/BFJ-01-2018-0059
Jekanowski, M. D., Binkley, J. K., Eales, J. S., Jekanowski, M. D., Binkley, J. K., &
Eales, J. S. (2001). Convenience, accessibility, and the demand for fast food.
https://doi.org/10.22004/ag.econ.31162 103
Doctoral Thesis
Héctor Hugo Pérez Villarreal
Jöreskog, K. G. (1971). Statistical analysis of sets of congeneric tests.
Psychometrika, 36(2), 109–133. https://doi.org/10.1007/BF02291393
Jun, J., Kang, J., & Arendt, S. W. (2014). The effects of health value on healthful
food selection intention at restaurants: Considering the role of attitudes
toward taste and healthfulness of healthful foods. International Journal of
Hospitality Management, 42, 85–91.
https://doi.org/10.1016/j.ijhm.2014.06.002
Khongrangjem, T., Dsouza, S. M., Prabhu, P., Dhange, V. B., Pari, V., Ahirwar, S.
K., & Sumit, K. (2018). A study to assess the knowledge and practice of fast
food consumption among Pre-University students in Udupi Taluk, Karnataka,
India. Clinical Epidemiology and Global Health, 6(4), 172–175.
https://doi.org/10.1016/j.cegh.2017.11.003
Lang, J. (2003). Food Nations: Selling Taste in Consumer Societies (review).
Technology and Culture, 44(2), 419–421.
https://doi.org/10.1353/tech.2003.0074
Lascu, D. N. (1991). Consumer guilt: Examining the potential of a new marketing
construct. 18, 290–295.
Law, A. K. Y., Hui, Y. V., & Zhao, X. (2004). Modeling repurchase frequency and
customer satisfaction for fast food outlets. International Journal of Quality &
104

Chapter 3. Food values, benefits and their influence on attitudes and intention to buy hamburgers: Evidence obtained in Mexico
Reliability Management, 21(5), 545–563.
https://doi.org/10.1108/02656710410536563
Lister, G., Tonsor, G. T., Brix, M., Schroeder, T. C., & Yang, C. (2017). Food
Values Applied to Livestock Products. Journal of Food Products Marketing,
23(3), 326–341. https://doi.org/10.1080/10454446.2014.1000436
Loebnitz, N., & Grunert, K. G. (2018). Impact of self-health awareness and
perceived product benefits on purchase intentions for hedonic and utilitarian
foods with nutrition claims. Food Quality and Preference, 64, 221–231.
https://doi.org/10.1016/j.foodqual.2017.09.005
Louis, W., Davies, S., Smith, J., & Terry, D. (2007). Pizza and Pop and the Student
Identity: The Role of Referent Group Norms in Healthy and Unhealthy
Eating. The Journal of Social Psychology, 147(1), 57–74.
https://doi.org/10.3200/SOCP.147.1.57-74
Luomala, H., Jokitalo, M., Karhu, H., Hietaranta-Luoma, H.-L., Hopia, A., &
Hietamäki, S. (2015). Perceived health and taste ambivalence in food
consumption. Journal of Consumer Marketing, 32(4), 290–301.
https://doi.org/10.1108/JCM-11-2014-1233
Lusk, J. L. (2011). External validity of the food values scale. Food Quality and
Preference, 22(5), 452–462. https://doi.org/10.1016/j.foodqual.2011.02.009
105

Doctoral Thesis
Héctor Hugo Pérez Villarreal
Lusk, J. L., & Briggeman, B. C. (2009). Food Values. American Journal of
Agricultural Economics, 91(1), 184–196. https://doi.org/10.1111/j.1467-
8276.2008.01175.x
Maehle, N., Iversen, N., Hem, L., & Otnes, C. (2015). Exploring consumer
preferences for hedonic and utilitarian food attributes. British Food Journal,
117(12), 3039–3063. https://doi.org/10.1108/BFJ-04-2015-0148
Martínez-Ruiz, M. P., & Gómez-Cantó, C. M. (2016). Key External Influences
Affecting Consumers’ Decisions Regarding Food. Frontiers in Psychology, 7.
https://doi.org/10.3389/fpsyg.2016.01618
Mattsson, J., & Helmersson, H. (2007). Eating fast food: Attitudes of high-school
students. International Journal of Consumer Studies, 31(1).
https://doi.org/10.1111/j.1470-6431.2006.00576.x
Mcneal, J. U., Stem, D. E., & Nelson, C. S. (1980). Consumers’ Nutritional Ratings
of Fast-Food Meals. Journal of Consumer Affairs, 14(1), 165–179.
https://doi.org/10.1111/j.1745-6606.1980.tb00660.x
Mowen, J. C., & Minor, M. (1998). Consumer behavior (5. ed., international ed).
Upper Saddle River, NJ: Prentice-Hall.
Nitzl, C., Roldan, J. L., & Cepeda, G. (2016). Mediation analysis in partial least
squares path modeling: Helping researchers discuss more sophisticated
106

Chapter 3. Food values, benefits and their influence on attitudes and intention to buy hamburgers: Evidence obtained in Mexico
models. Industrial Management & Data Systems, 116(9), 1849–1864.
https://doi.org/10.1108/IMDS-07-2015-0302
Raghunathan, R., Naylor, R. W., & Hoyer, W. D. (2006). The Unhealthy = Tasty
Intuition and Its Effects on Taste Inferences, Enjoyment, and Choice of Food
Products. Journal of Marketing, 70(4), 170–184.
https://doi.org/10.1509/jmkg.70.4.170
Saba, A., & Di Natale, R. (1998). Attitudes, intention and habit: Their role in
predicting actual consumption of fats and oils. Journal of Human Nutrition
and Dietetics, 11(1), 21–32. https://doi.org/10.1046/j.1365-
277X.1998.00078.x
Shepherd, R. (1989). Factors influencing food preferences and choice. Shepherd, R.
(Ed.), 3-24.
Sirois, F. M. (2004). Procrastination and intentions to perform health behaviors: The
role of self-efficacy and the consideration of future consequences.
Personality and Individual Differences, 37(1), 115–128.
https://doi.org/10.1016/j.paid.2003.08.005
Strahilevitz, M., & Myers, J. G. (1998). Donations to Charity as Purchase Incentives:
How Well They Work May Depend on What You Are Trying to Sell. Journal
of Consumer Research, 24(4), 434–446. https://doi.org/10.1086/209519
107

Doctoral Thesis
Héctor Hugo Pérez Villarreal
Strathman, A., Gleicher, F., Boninger, D. S., & Edwards, C. S. (1994). The
consideration of future consequences: Weighing immediate and distant
outcomes of behavior. Journal of Personality and Social Psychology, 66(4),
742–752. https://doi.org/10.1037/0022-3514.66.4.742
Thøgersen, J. (2009). Consumer decision-making with regard to organic food
products. In Traditional Food Production Facing Sustainability: A European
Challenge.
Tuu, H. H., Olsen, S. O., Thao, D. T., & Anh, N. T. K. (2008). The role of norms in
explaining attitudes, intention and consumption of a common food (fish) in
Vietnam. Appetite, 51(3), 546–551.
https://doi.org/10.1016/j.appet.2008.04.007
Verbeke, W., & Viaene, J. (1999). Beliefs, attitude and behaviour towards fresh meat
consumption in Belgium: Empirical evidence from a consumer survey. Food
Quality and Preference, 10(6), 437–445. https://doi.org/10.1016/S0950-
3293(99)00031-2
Voss, K. E., Spangenberg, E. R., & Grohmann, B. (2003). Measuring the Hedonic
and Utilitarian Dimensions of Consumer Attitude. Journal of Marketing
Research, 40(3), 310–320. https://doi.org/10.1509/jmkr.40.3.310.19238
108

Chapter 3. Food values, benefits and their influence on attitudes and intention to buy hamburgers: Evidence obtained in Mexico
Wakefield, K. L., & Inman, J. J. (2003). Situational price sensitivity: The role of
consumption occasion, social context and income. Journal of Retailing,
79(4), 199–212. https://doi.org/10.1016/j.jretai.2003.09.004
Werts, C. E., Linn, R. L., & Jöreskog, K. G. (1974). Intraclass Reliability Estimates:
Testing Structural Assumptions. Educational and Psychological
Measurement, 34(1), 25–33. https://doi.org/10.1177/001316447403400104
Zhang, Y., Jing, L., Bai, Q., Shao, W., Feng, Y., Yin, S., & Zhang, M. (2018).
Application of an integrated framework to examine Chinese consumers’
purchase intention toward genetically modified food. Food Quality and
Preference, 65, 118–128. https://doi.org/10.1016/j.foodqual.2017.11.001
Zhao, X., Lynch, J. G., & Chen, Q. (2010). Reconsidering Baron and Kenny: Myths
and Truths about Mediation Analysis. Journal of Consumer Research, 37(2),
197–206. https://doi.org/10.1086/651257
109

Doctoral Thesis
Héctor Hugo Pérez Villarreal
Table 3.6 Variables and measure
Latent
variable
Observed variables How to measure
Food
values =
general
food
attributes
consumers
believed
were
relatively
more
important
when
purchasing
food.
Appearance = extent to which food looks appealing Source: Lusk (2011); Likert
scale 1 - 5 (1 = not at all
important to 5 = extremely
important)
Convenience = ease with which food is cooked
and/or consumed
Environmental = effect of food production on the
environment
Fairness = the extent to which all parties involved in
the production of the food equally benefit
Naturalness = extent to which food is produced
without modern technologies
Nutrition = amount and type of fat, protein,
vitamins, etc.
Origin = where the agricultural commodities were
grown
Price = the price that is paid for the food
Safety = extent to which consumption of food will
not cause illness
Taste = extent to which consumption of the food is
appealing to the senses
Tradition = preserving traditional consumption
patterns
Utilitarian
benefits
related to
food values
UB appearance = the appearance and presentation of
the product is useful and necessary
Adapted from Lusk (2011);
Likert scale 1 - 5 (1 = not at all
important to 5 = extremely
important). The items were
constructed according to the
UB convenience = the convenience of consumption
and preparation is useful for me need to eat
UB fairness = by consuming favoring fair trade is
useful and necessary
110

Chapter 3. Food values, benefits and their influence on attitudes and intention to buy hamburgers: Evidence obtained in Mexico
UB nutrition = the nutrition obtained from eating a
hamburger is useful to what I need at a certain time
adaptation of food values with
the utility of the product.
UB origin = the origin of the hamburger I think is
elementary when consuming the product
UB price = the price of the hamburger is adequate
for the need to eat that I have
UB safety = the safety of the food helps me to satisfy
my need to eat
Hedonic
benefits
related to
food values
HB appearance = the appearance and presentation of
the product give me pleasure
Adapted from Lusk (2011);
Likert scale 1 - 5 (1 = not at all
important to 5 = extremely
important). The items were
constructed according to the
adaptation of food values with
the pleasure of the product.
HB convenience = the comfort of consumption and
preparation of the hamburger is pleasant
HB safety = the safety of the hamburger gives me
pleasure
HB taste = the taste of the hamburger gives me
pleasure
Attitudes
toward
eating
hamburger
s
ATE1 = Eating a hamburger would be pleasurable Adapted from Haws and
Winterich (2013); Likert scale
1 - 5 (1 = strongly disagree to
5 = strongly agree)
ATE2 = I would enjoy eating a hamburger
ATE3 = Eating a hamburger would be satisfying for
me
ATE4 = I eat hamburgers because of the good taste
they have
Purchase
intention
PI1 = You probably buy McDonald’s products Adapted from Chiu, Hsieh and
Kuo (2012); Diallo (2012);
Likert scale 1 - 5 (1 = strongly
disagree to 5 = strongly agree).
PI2 = I would consider buying McDonald’s products
if I need a product of this type
PI3 = It is possible to buy a McDonald’s product
PI5 = The probability that you would consider
buying a McDonald’s product is high
111


Chapter 4. Testing Model of Purchase Intention for Fast
Food in Mexico: How do consumers react to food
values, positive anticipated emotions, attitude toward the
brand, and attitude toward eating hamburgers?


Chapter 4. Testing Model of Purchase Intention for Fast Food in Mexico: How do consumers react to food values, positive anticipated emotions, attitude toward the brand, and attitude toward eating hamburgers?
Abstract:
This research investigated the effect of the food values, positive anticipated emotions,
attitude toward the brand, and attitude toward eating a hamburger on purchase
intention in fast food restaurants in Mexico conjointly. The purpose of this study was
to discover which variables influenced the consumer´s intention to buy. Data was
collected from a survey of 512 Mexicans fast-food consumers. Structural equation
modeling was used to test the hypothesized associations. The results showed that food
values and positive anticipated emotions absolutely impact the attitude toward the
brand, which impacts the purchase intention of the Mexican consumers. Nonetheless,
the positive anticipated emotions impact stronger than food values and the best way to
get a purchase intention is toward the attitude of the brand rather than attitude toward
eating a hamburger. The authors discussed inferences and suggestions for consumer
approaches.
Keywords: food values; positive anticipated emotions; attitude toward the brand;
attitude toward eating a hamburger; purchase intention
115


Chapter 4. Testing Model of Purchase Intention for Fast Food in Mexico: How do consumers react to food values, positive anticipated emotions, attitude toward the brand, and attitude toward eating hamburgers?
4.1 Introduction
Food choice decisions are complicated when every day the consumers make a lot of
decisions about one excellent fast food (Manan, 2016). Over the past few years, some
studies have a primordial objective to explain how interaction facts affect purchase
intention through theory planned behavior (TPB) (Chen & Lu, 2011; Liu, Lin, & Feng,
2018; Yuzhanin & Fisher, 2016). But none focused on the food values, especially when
the research was about food choice and positive anticipated emotions like a central
variable in the model. Based on a dataset of 1,169 abstracts of marketing from 2005 to
2014, Barahona, Hernández, Pérez-Villarreal, & Martínez-Ruíz (2018) explained that
one crucial dimension for researchers is emotional marketing. Topics such as
evaluation, experience, message, people, emotional, goal and hedonic are the
keywords for studies in this field. Therefore, this research was based on the purpose
of explaining the purchase intention in four main premises. First, the fast food
consumption has a purchase intention by the attitude toward the brand into the means
of an emotional need according to a physiological desire (Ding & Tseng, 2015;
Handley, 2010; Ruth, 2001). Second, the consumers´ emotions influence the purchase
intention (Wang, 2009). Third, what is the role of food values to attitude toward the
brand and attitude toward eating a hamburger (Goldsmith, Freiden, & Henderson,
1995)? Fourth, what is more essential to predict the purchase intention: attitude toward
the brand or attitude toward eating a hamburger (Lorenz, Langen, Hartmann, & Klink-
Lehmann, 2018)?
Through this research, a model with these variables was proposed because there is a
synergistic effect between them. The approach rests with the effects of food values and
positive early emotions directed towards the form of the attitude as a predecessor of
117

Doctoral Thesis
Héctor Hugo Pérez Villarreal
the purchase intention (Koenig-Lewis & Palmer, 2014; Song & Qu, 2019; Zhao, Deng,
& Zhou, 2017). This model was designed from the separation of attitudes: one directed
towards the act of eating and another towards the brand. The application covers the
principle on attitudes directed towards the product and another towards the brand.
Thus, this model is the first that uses the rational and emotional part of consumption
and separates the attitude of eating from the attitude towards the brand. In this case,
the model provides information on the importance of the product and the brand and
towards launch, modifications and valuations of products and brands. The consumer’s
decisions are based on some level of rational or emotional effect (Nicolini, Cassia, &
Bellotto, 2017; H. Zhang, Sun, Liu, & G. Knight, 2014).
This study forms the rational (food values) and emotional (positive anticipated
emotions) parts to connect them with different attitudes to predict purchase intention.
Consequently, it used these two attitudes roles, eating versus brand, to test the
relationship to purchase intention. The importance of the study is to predict the
purchase intention and to knowing the consumers’ behavior choices with a hamburger.
If the calculations, weights, loadings, etc. contribute to explaining more of the
purchase intention, it should make an important and significant contribution to
academic literature. This is because it gives off too many forms to investigates and
implement strategies in fast food restaurants, knowing the protrusion factors in the
model.
For these reasons, it is intended to identify which emotions, food values and types of
attitudes impact significantly and positively on the purchase intention. Through these
findings, marketing strategies can be formulated and it is possible to know what the
most convenient way for this field is. The objective of the present study was to
explicitly test the purchase intention toward attitudes, food values and positive
118

Chapter 4. Testing Model of Purchase Intention for Fast Food in Mexico: How do consumers react to food values, positive anticipated emotions, attitude toward the brand, and attitude toward eating hamburgers?
anticipated emotions. The study built a model on purchase intention research by
examining the consumer before the purchase decision. Also, this study emphasized the
meaning of the role of attitudes (eating hamburger and brand) on purchase intentions
of fast food consumers. Finally, the study tested and confirmed the hypotheses planted
in this research.
4.1.1 Attitudes in consumer behavior
Attitude toward something is an antecedent of intention, but it is also the degree to
which an individual has a favorable or unfavorable evaluation or appraisal of the
behavior to any purchase situations (Ajzen, 1991). Some research has also highlighted
the role of purchase intention and the attitude impact (Ajzen & Fishbein, 1980). On
the other hand, the attitude that is formed in the first stage is formed of the decision
process of purchase in the consumer (recognition of the need/problem). Some studies
proved that the attitude directly affects the consumer's buying behavior (Garg,
Wansink, & Inman, 2007; Talih Akkaya, Akyol, & Gölbaşı Şimşek, 2018; Wu, 2003).
This attitude is influenced by elements such as information, nature of the product,
social media, ads and other behavioral factors. In the context of food consumption, the
role of attitudes is at the top for research in consumer behavior. Thus, some consumers
have attitudes toward eating hamburgers and others have attitudes toward the brand.
This is because they keep both positive and negative evaluations, such as purchases
intentions, purchases and repurchases (Chang, 2011). However, in marketing as a
discipline, the gap is different between attitude toward eating hamburger and attitude
toward the brand.
Attitudes toward eating hamburgers play a significant role in understanding consumer
behavior. These attitudes can be decision-making components for the choice and
119

Doctoral Thesis
Héctor Hugo Pérez Villarreal
intention to eat some food (Chen, 2009; Ghoochani, Torabi, Hojjati, Ghanian, &
Kitterlin, 2018). Once consumers recognize their need for food, they enter into a stage
of searching and evaluating the alternatives (Bai, Wang, Yang, & Gong, 2019). It is at
this stage, where people positively or negatively value the desired behavior without
implying the degree of eating habits or the level of hunger (Coricelli, Foroni, Osimo,
& Rumiati, 2019). Hence the attitude of eating evaluates the favorable or unfavorable
predisposition towards the act of eating any food (Ajzen, 1991). Rezai et al. (2017)
(Rezai, Teng, Shamsudin, Mohamed, & Stanton, 2017) pointed to a direct relationship
between attitudes towards eating foods that generate a healthy benefit and the intention
to buy. For this reason, it is vital to know one’s attitude towards the act of eating as a
central point towards the intention to buy.
On the other side, attitudes are cognitions and can sometimes be directed towards the
brand (Diallo & Seck, 2018). So it is necessary to comment that attitudes towards the
brand can generate a behavioral intent and the same behavior of the consumer's final
purchase (Johye Hwang, Yoon, & Park, 2011). Therefore, attitudes towards the brand
mean that consumers adopt or reject conduct based on experiences, personal
recommendations and media exposure, as well as other media that use the brand and
may have a point of contact with the consumer (Foroudi, 2019). Hence, attitudes
towards the brand have become one of the intangible components valued by consumers
because when choosing the behavior, they do it more for the brand than for the product.
Similarly, the attitude towards the brand makes consumers acquire feelings of security,
confidence, convenience and credibility among others, so for them, it is easier to
recognize and choose the purchase (Jeng, 2016). Thus, the literature agrees that
attitude towards the brand is the highest point through which the consumer
disseminates the choice.
120

Chapter 4. Testing Model of Purchase Intention for Fast Food in Mexico: How do consumers react to food values, positive anticipated emotions, attitude toward the brand, and attitude toward eating hamburgers?
4.1.2 Purchase intention
Assael (1992) called purchase intention the conduct that seeks in response to an object
and is before the purchase. Subsequently, Zhang et al. (2018) approved the relationship
between attitudes and purchase intention. Phau & Teah (2009) demonstrated when the
consumer has a strong positive attitude; more is the intention to buy.
Rezai et al. (2017) pointed out the importance of determining the intention to purchase
functional products from examining the factors involved in the purchase decision
process. For example, Jahn, Tsalis, & Lähteenmäki (2019) indicated that the general
attitude towards products has a direct effect towards the intention to purchase, as long
as the people are in a condition of suitability and knowledge of the problem. Asif,
Xuhui, Nasiri, & Ayyub (2018) pointed out that it is possible to find differences in
intent to buy from one country to another, but they agreed that attitude and health
awareness are the best predictors of the intention to buy in organic foods. Some studies
pointed to some additional variables to the TPB including moral attitude and healthy
awareness towards purchasing intent in organic foods (Yadav & Pathak, 2016).
Consequently, it is possible to include other variables in the purchase intention by
extending the TPB. On the other hand, another study pointed to the involvement
towards the consumption of products, price sensitivity and moderation of the effect of
the identity of the local product towards the intention of purchase (Ghali-Zinoubi &
Toukabri, 2019).
Chiu, Hsieh, & Kuo (2012) and Diallo (2012) underlined aspects about the probability
to buy, not before the consumer formed an attitude and experience of the past. Now,
as the intention is testified to be a significant factor of buy, it was thus, hypothesized
that:
121

Doctoral Thesis
Héctor Hugo Pérez Villarreal
H1. Attitude toward the brand will positively influence intention to buy.
H2. Attitude toward eating hamburger will positively influence the intention to
buy.
4.1.3 Food values
The situation of obtaining information on the attributes of the product has always been
a relevant topic in food consumer research. Today, exotic consumption attributes,
towards the ethics of consumption, healthy awareness, animal impact and organic food
are topics of interest in knowing one’s behavior (Clarkson, Mirosa, & Birch, 2018;
Ditlevsen, Sandøe, & Lassen, 2019; Ghvanidze, Velikova, Dodd, & Oldewage-
Theron, 2017; Raaijmakers, Sijtsema, Labrie, & Snoek, 2018). According to Basha &
Lal (2019), the ratio of environmental concern, health, and lifestyle, supporting local
farmers, product quality, convenience, price, animal welfare, safety-trust, subjective
norms and attitude is valued. The food choice has been becoming an advantage to
improve healthy and sustainable diets and to know the different roles of high and low
involvement Boer & Schösler (2016). Nevertheless, Boer & Schösler (2016)
mentioned the differences in the affinities could be predicted by food-related value
motivation.
Sprotles & Kendall (1986), through consumer styles inventory (CSI), claimed that
consumers choose to make their purchase decision through eight basic styles: high
quality, innovation, brand awareness, price, hedonism, confusion with other brands,
impulsivity and habit. Other studies emphasized product presentation, food safety,
environmental impact and ethical consumer identity (Jiyoung Hwang, 2016). Another
study found that depending on the type of food (organic or conventional) used, the
122

Chapter 4. Testing Model of Purchase Intention for Fast Food in Mexico: How do consumers react to food values, positive anticipated emotions, attitude toward the brand, and attitude toward eating hamburgers?
effect on the consumer perception component (e.g., healthy consciousness) differs
Rana & Paul (2017).
When researches talk about the food attributes, it can be partial with the real concept
because the food attributes can be an infinite number of characteristics, but only some
of them are important for the moment of choice (Martínez-Ruiz & Gómez-Cantó,
2016). For this reason, the attributes of the product became the consumer's values
regarding food. Some researchers affirmed that these values were influenced through
many factors, which relate to personal values (Lang & Lemmerer, 2019; P. Y. Lee,
Lusk, Mirosa, & Oey, 2014; Manan, 2016; Tey et al., 2018). This means that food
values are exercised by the consumer and not by the product itself. However, each
attribute mentioned above falls within a factor of the eleven described by Lusk (2011).
Thus, it is possible that each product, depending on belonging in the category,
constitutes intra-group differences, but it is possible to categorize them in general
forms.
Lusk & Briggeman (2009) explored all the factors that integrated the attributes of food.
After this plan, Lusk (2011) opened wide eleven items to identify the food values scale.
These items are 1) naturalness (the extent to which food is produced without modern
technologies), 2) taste (the extent to which consumption of food is appealing to the
senses), 3) price (the amount paid for food), 4) safety (the extent to which consumption
of food will not cause illness), 5) convenience (the ease with which food is cooked and
consumed), 6) nutrition (the amount and type of fat, protein, vitamins, etc.), 7) tradition
(preserving traditional consumption patterns), 8) origin (where the agricultural
commodities were grown), 9) fairness (the extent to which all parties involved in food
123

Doctoral Thesis
Héctor Hugo Pérez Villarreal
production equally benefit), 10) appearance (the extent to which food looks appealing)
and 11) environmental impact (the effect of food production on the environment).
Studies have shown food values are essential to explain the attitudes. For example,
Manan (2016) emphasized the attitudes toward personal values, but the question is
whether personal values are influenced the food benefits, then these affect attitude. In
order, Lang and Lang & Lemmerer (2019) demonstrated the relationships across
personal values and attitudes toward local food, but they did not separate the attitude
toward eating a hamburger or the attitude toward the brand. As a result, it is
hypothesized that:
H3. Food values will positively influence attitude toward the brand.
H4. Food values will positively influence attitude toward eating a hamburger.
4.1.4 Anticipated emotions
Some researchers have been in charge of framing emotions as a fundamental, principal
axis and detonator of all purchasing behavior, this adding the part of information
processing and consumer action (Agrawal & Duhachek, 2010; Berger & Milkman,
2012; Hsee, Yang, Zheng, & Wang, 2015; Levav & Mcgraw, 2009; Poor, Duhachek,
& Krishnan, 2013; Teixeira, Wedel, & Pieters, 2012; Wood & Moreau, 2006).
Although the entire chain of observation (cognitive, conative and affective), the trigger
and the key factors of success cannot be established, some researchers have taken a
part of the chain towards the effective and successful verification of the application of
branding emotional, buyback, purchase decision, search and evaluation of purchase
alternatives (Golder, Mitra, & Moorman, 2012; C. J. Lee & Andrade, 2011;
Strahilevitz, Odean, & Barber, 2011; Thompson, Rindfleisch, & Arsel, 2006).
124

Chapter 4. Testing Model of Purchase Intention for Fast Food in Mexico: How do consumers react to food values, positive anticipated emotions, attitude toward the brand, and attitude toward eating hamburgers?
Within the contributions of advertising, it is possible to highlight that the emotional
contagion may have main effects on the physiological changes of the people (Small &
Verrochi, 2009). In this study, the participants felt sadder when they saw a victim with
a sad face, and their sadness emanated the effect on the expression of the emotion in
the sympathy. The effects of contagion are automatic and not inferential but are
diminished by deliberative thinking. On the other hand, Nielsen, Shapiro, & Mason
(2010) showed that the "pre-attention" processing of semantic information in non-focal
announcement titles can provoke orientations towards attention responses. The same
results in foreseeable increases in the ad and knowledge of the brand. Equally, Teixeira
et al. (2012) showed that surprise and joy concentrate effective attention and retains
the viewers with more time. But, the most important thing is the level of retention
instead of the speed of surprise, and it affects more the concentration of attention.
Therefore, speed influences the level of joy, which affects spectator retention. These
three studies placed the emotional part as the main factor in their research with the
impact on advertising. It could be specified that the authors discussed the implications
of the use of emotional expressions, titles of advertisements, consumer knowledge of
the brand to promote emotions in the consumer and help the purchasing decision
process.
However, the emotions are present throughout the process of consumer behavior, but
it is vital determinate what the origin of this is. Pelsmaeker et al. (2017) explained the
relationship of emotions in the begging of the process of consumer intention, and they
determined the relevance of applying an evaluation before recognizing the need.
Emotions can indeed be positive and negative depending on the moment or value.
However, some researchers in recent years were working only for positive emotions
because only these matter. Wen, Hu, & Kim (2018) examined the effect of individual
125

Doctoral Thesis
Héctor Hugo Pérez Villarreal
culture on positive emotions for the recommendation intention. Finally, positive
emotions are the principal element to determine the satisfaction of the consumer (Io,
2017).
Williams & Aaker (2002) believed that when individuals are exposed to mixed
emotions, they influenced the individual´s attitudes in general. They also demonstrated
that the detonation of emotions with duality (e.g., sadness and happiness) is less prone
to form an attitude towards their behavior. Haws & Winterich (2013) described the
factors to measure the attitude toward eating directly to these items: pleasure, enjoy,
satisfied and good taste. However, the consumer can have an attitude toward the brand
and not for eating. That reason describes Aggarwal & McGill (2012) finding of what
consumers like, think, admire and fit in their life is a good positive attitude that helps
to stimulate the intention. This study proposed two constructs, one for eating the
hamburger and the other for the brand.
Thus, the following hypothesis can be derived:
H5. Positive anticipated emotions will positively influence attitude toward the
brand.
H6. Positive anticipated emotions will positively influence attitude toward
eating a hamburger.
H7. Positive anticipated emotions will positively influence the intention to buy.
Therefore, seven hypotheses were tested in this research and based on the discussion
above (see Figure 4.1), considers seven proposed effects: 1) attitude toward the brand
on purchase intention, 2) attitude toward eating hamburger on purchase intention, 3)
food values on attitude toward the brand, 4) food values on attitude toward eating
126
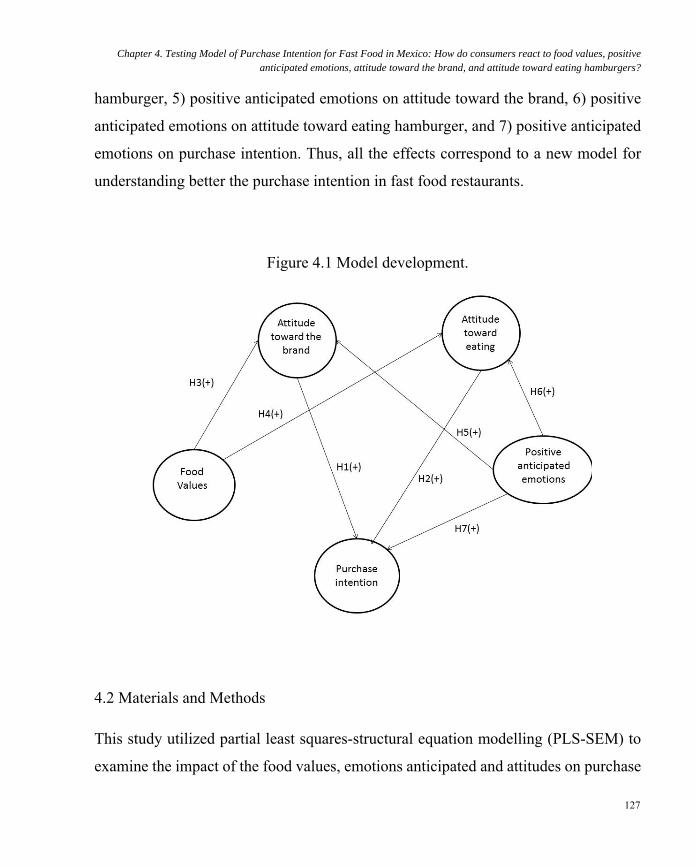
Chapter 4. Testing Model of Purchase Intention for Fast Food in Mexico: How do consumers react to food values, positive anticipated emotions, attitude toward the brand, and attitude toward eating hamburgers?
hamburger, 5) positive anticipated emotions on attitude toward the brand, 6) positive
anticipated emotions on attitude toward eating hamburger, and 7) positive anticipated
emotions on purchase intention. Thus, all the effects correspond to a new model for
understanding better the purchase intention in fast food restaurants.
Figure 4.1 Model development.
4.2 Materials and Methods
This study utilized partial least squares-structural equation modelling (PLS-SEM) to
examine the impact of the food values, emotions anticipated and attitudes on purchase
127

Doctoral Thesis
Héctor Hugo Pérez Villarreal
intention (see Table 4.1 for technical details). The proposal was to estimate a model
that includes a mix of factors and composites using the PLS algorithm procedure
(Sarstedt, Hair, Ringle, Thiele, & Gudergan, 2016). The idea was to maximize the
explained variance of all dependent variables used in the research model. In this case,
the research intent was to know the predictor variable and to identify possible drivers
(J. Hair, Hollingsworth, Randolph, & Chong, 2017; Shmueli, Ray, Velasquez Estrada,
& Chatla, 2016). Therefore, the independent variables that the literature reports as
important predecessors of purchase intention were also included.
Table 4.1 Technical details.
Universe Residents in Puebla State in México
Sample unit People over 17 years old and buying fast food
Information collection method Personal survey
Sample error ± 4.335
Level of reliability 95%
Sample procedure Probabilistic
Number surveyed 512 valid surveys
Period of information collection January 26—May 23 (2018)
Language Spanish
4.2.1 Data collection
The data was collected from Puebla City in Mexico with a consumer survey of 512
participants. Participation was voluntary and all of them completed the questionnaire.
128

Chapter 4. Testing Model of Purchase Intention for Fast Food in Mexico: How do consumers react to food values, positive anticipated emotions, attitude toward the brand, and attitude toward eating hamburgers?
4.2.2 Statistics analysis
The study used structural equation modeling (SEM) to test the conceptual model with
SmartPLS 3.0 software. According to Streukekens and Leroi-Werelds (2016)
(Streukens & Leroi-Werelds, 2016), this study used partial least squares (PLS) with a
10,000 subsample bootstrapping procedure and the same software to know if the
relationship was supported or not with the results. In the beginning, this model was
composted from 34 items reduced to 28 items in 5 constructs. From there, no
preliminary empirical parameters for this particular market were found.
4.2.3 Questionnaire development
The questionnaire was constructed and divided into five sections: a) food values, b)
positive and negative anticipated emotions, c) attitude toward the brand, d) attitude
toward eating a hamburger, and e) purchase intention (see Table 4.2). The first table
shows the questionnaire section by source and the second explain details on how to
measure each variable.
129

Doctoral Thesis
Héctor Hugo Pérez Villarreal
Table 4.2 Questionnaire sections.
Latent
variable
Observed
variables Definition Source
Food values
are general
food attributes
that
consumers
believed were
relatively
more
important
when
purchasing
food
Appearance Extent to which food looks appealing
Lusk
(2011)
Convenience Ease with which food is cooked and consumed
Environmental Effect of food production on the environment
Fairness The extent to which all parties involved in the
production of the food equally benefit
Naturalness Extent to which food is produced without modern
technologies
Nutrition Amount and type of fat, protein, vitamins, etc.
Origin Where the agricultural commodities were grown
Price The price that is paid for the food
Safety Extent to which consumption of food will not cause
illness
Taste Extent to which consumption of the food is appealing
to the senses
Tradition Preserving traditional consumption patterns
Positive and
negative
anticipated
emotions
Contentment If I can go to eat a hamburger in fast-food restaurants
the next month, I feel contentment
Adapted
from
Bagozzi
and
Dholakia
(2006)
Delighted If I can go to eat a hamburger in fast-food restaurants
the next month, I feel delighted
Excited If I can go to eat a hamburger in fast-food restaurants
the next month, I feel excited
Proud If I can go to eat a hamburger in fast-food restaurants
the next month, I feel proud
Satisfied If I can go to eat a hamburger in fast-food restaurants
the next month, I feel satisfied
130

Chapter 4. Testing Model of Purchase Intention for Fast Food in Mexico: How do consumers react to food values, positive anticipated emotions, attitude toward the brand, and attitude toward eating hamburgers?
Selfassured If I can go to eat a hamburger in fast-food restaurants
the next month, I feel self-assured
Attitude
toward the
brand (ATB)
ATB1 Like the brand Aggarwal
and
McGill
(2012)
ATB2 Admire the brand
ATB3 Fit in your life the brand
Attitude
toward eating
a hamburger
(ATEH)
ATEH1 Eating the hamburger would be pleasurable Adapted
from Haws
and
Winterich
(2013)
ATEH2 I would enjoy eating the hamburger
ATEH3 If I eat a hamburger, it would be satisfying for me
ATEH4 If I eat a hamburger because of the good taste it has
Purchase
intention
PI1 You probably buy products in fast-food restaurants Adapted
from Chiu,
Hsieh, and
Kuo
(2012),
Diallo
(2012)
PI2 I would consider buying a product in fast-food
restaurants if I need a product of this type
PI3 It is possible to buy a product in fast-food restaurants
PI5 The probability that you consider buying in fast-food
restaurants is high
The food values utilized a Likert scale 1 - 5 (1 = not at all important, to 5 = extremely
important). The scale was adapted from 7-points to 5-points, because it was planned
to explain each item as a formative construct. It is better to get an answer from the
consumer on the assumption that some items do not have a relation with the construct.
Positive and negative anticipated emotions applied a Likert scale 1 - 7 (1 = none, to 7
= severe). From the original items, it supported the positive emotions because the
negatives did not have an impact, and did not comply with the test of validity and
reliability. It deleted the emotions for: glad, relief and happy for the reason to have
multicollinearity and the VIF factor > 3.2. Also, it used the 7-point Likert scale as the
131

Doctoral Thesis
Héctor Hugo Pérez Villarreal
author marked it. According to Becker & Ismail (2016), it is possible to use different
Likert scales within the same model. In the attitude toward the brand (ATB) it used a
Likert scale 1 - 5, (1 = strongly disagree, to 5 = strongly agree). From the original
contribution, it supported only the positive items because the weights were weak (item
4 “shame” and 5 “avoidance”). It changed the inverse items for the nature of the scale.
For the attitude toward eating a hamburger (ATEH) it was handled with a Likert scale
1 - 5, (1 = strongly disagree, to 5 = strongly agree). These items were adapted to the
specific product (in this case, hamburger). The variable purchase intention was
measured by a Likert scale 1 - 5, (1 = strongly disagree, to 5 = strongly agree). PI4 was
excluded because it had multicollinearity with PI3. The item was "I would buy in
McDonald´s next time".
All the constructs were reflective, not including food values. The construct formed the
interpretations depending on the dependent variable. Hence, the formative indicators
may show non-significant. Also, the indicators were correlated with other indicators
in the model proposal (Diamantopoulos & Papadopoulos, 2010). Similarly, all the
formative indicators required a census of all items for the construct because each one
(it can be negative or positive) was formed into the complete variable. Even the
negative influences in the consumer were one item that needed to be taken care of
(Jarvis, MacKenzie, & Podsakoff, 2003). Finally, the overall fit of this model does not
matter; the other covariances like the exogenous variables are outside the model
proposal and all the items are independent with themselves, according to Jarvis et al.
(2003).
132
Chapter 4. Testing Model of Purchase Intention for Fast Food in Mexico: How do consumers react to food values, positive anticipated emotions, attitude toward the brand, and attitude toward eating hamburgers?
4.3 Results
The development model was constructed on an amalgamation of items, concepts,
models, effects and principles about two parts: functional and emotional. This model
was also composited about a series of research studies around four exceptional areas:
1) food values, 2) attitude toward the brand, 3) attitude toward eating a hamburger,
and 4) positive anticipated emotions. All were within the proposal to better explain the
purchase intention in fast food restaurants in Mexico.
To assess the goodness of model fit, the root mean square residual (SRMR) was
utilized. According to Hu & Bentler (1998) and Hu & Bentler (1999), SRMR < 0.08
is a good fit for SRMR. This model has a SRMR=0.049<0.08 SRMR criteria; these
measures found that this model has a good fit with the parameters mentioned before.
The normed fit index (NIF) results in values from 0 to 1, and the closer to 1, the better
the fit (Bentler & Bonett, 1980). In this model, the NIF was .899 and represented an
acceptable fit.
To get confidence in this model, reliability and construct validity testing were carried
out. Cronbach´s alpha coefficient was accepted for all the constructs, having a value
greater than .7 ( Hair, 2010). The rho_A value was reflected regularly if this index was
larger than 0.7 (Werts, Linn, & Jöreskog, 1974). The composite reliability (CR) values
under 0.6 indicated a deficiency of internal consistency reliability (Hair, 2017). The
AVE of each construct was above the tolerability value 0.5 (Fornell & Larcker, 1981;
Huang, Wang, Wu, & Wang, 2013) (see Table 4.3).
133

Doctoral Thesis
Héctor Hugo Pérez Villarreal
Table 4.3 Validity testing.
Cronbach´s alpha
coefficient rho_A
Composite
reliability (CR)
Average variance
extracted (AVE)
Attitude toward
eating a hamburger 0.847 0.862 0.897 0.687
Attitude toward the
brand 0.822 0.836 0.893 0.736
Positive anticipated
emotions 0.916 0.921 0.934 0.704
Purchase intention 0.895 0.896 0.927 0.760
As a final point, the discriminant validity of constructs showed the factor loading
indicators on the assigned construct. Therefore, they had to be above all loading of
other constructs (in the same column) with the condition that the cut-off value of factor
loading was higher than .70 (Fornell & Larcker, 1981). In addition, the model proved
satisfactory reliability with, convergent and discriminant validity. After this step, it
was necessary to test the discriminant validity of constructs. According to Fornell &
Larcker (1981), with the correlation coefficient of the two dimensions less than the
square root of the AVE, two dimensions were understood to have discriminant validity
because of AVE >0.5 (see Table 4.4).
134

Chapter 4. Testing Model of Purchase Intention for Fast Food in Mexico: How do consumers react to food values, positive anticipated emotions, attitude toward the brand, and attitude toward eating hamburgers?
Table 4.4 Association testing.
Attitude
toward
Eating a
Hamburger
Attitude
toward the
Brand
Food
Values
Positive
Anticipated
Emotions
Purchase
Intention
Attitude toward
eating a
hamburger
0.829
Attitude toward
the brand 0.538 0.858
Food values 0.431 0.444 Formative
Positive
anticipated
emotions
0.482 0.544 0.401 0.839
Purchase intention 0.537 0.665 0.407 0.544 0.872
The study confirmed the hypothesis with path coefficient, standard error, t-value and
p-value (see Table 4.5). It was concluded that all the hypotheses planted were
supported and positive to predict the purchase intention with a high level, even though
the study observed some differences about each association. The first force is the
association between attitude toward the brand on purchase intention had the best path
coefficient (β=.447). Moreover, the results showed that attitude toward eating a
hamburger also had importance to purchase intention (β=.197). However, the other
association to predict purchase intention was throughout the positive anticipated
emotions and for this model was (β=.206), more than attitude toward eating a
hamburger.
135

Doctoral Thesis
Héctor Hugo Pérez Villarreal
The great force to constitute the attitude toward the brand was with the construct
positive anticipated emotions (β=.436). It was because in comparison, the attitude
toward eating a hamburger only has β=.368. Something relevant was about the impact
on attitudes about the food values, where it had some consideration to attitude toward
eating a hamburger (β=.270), but not much to the brand (β=.284).
Some reflections about all the hypotheses proposed are the level of significance, where
p-value <.001 with the 99%; it means that these study results were statistically
significant.
Also, the H5 line of positive anticipated emotions to attitude toward the brand (β=.436,
t=10.126, p=<0.001) and the H1 line of attitude to purchase intention (β=.447,
t=10.849, p=<0.001) indicated an abundant positive effect to form the purchase
intention; this was the best way to predict it. Table 4.5 shows that in all the relations,
t-value≥1.96 and p-value≤0.05; thus, this model supported all the hypotheses with high
path coefficients and t-values. Hence, outer model loadings were highly significant. In
addition, f2 was utilized to confirm the hypotheses null in the model and the outcomes
supported each hypothesis but with different effects from weak <.15 to large >.15
(Hair, Sarstedt, Hopkins, & G. Kuppelwieser, 2014). All q2 are above zero, which
supports the model presenting in the Figure 4.2 (Hair, 2017).
136
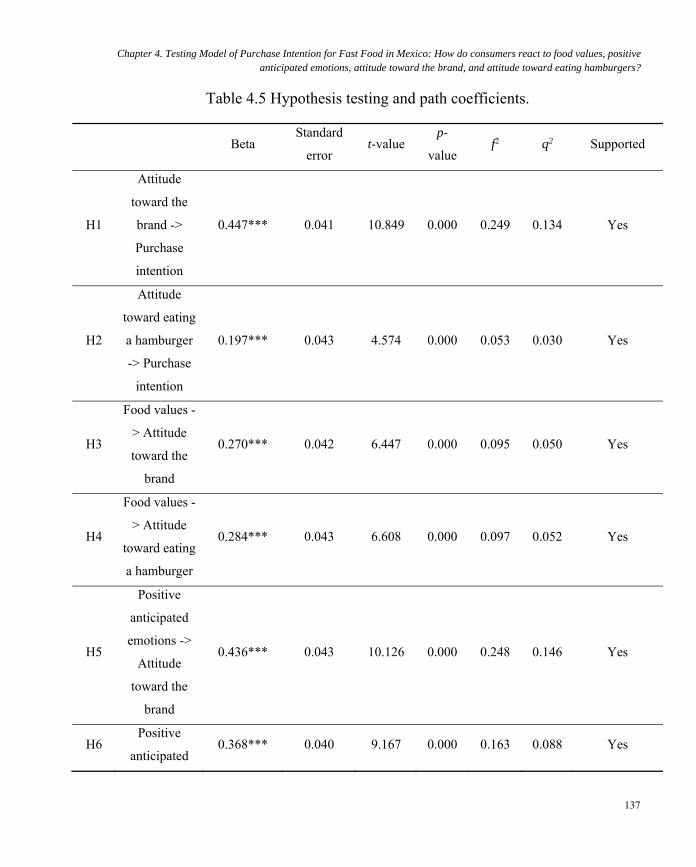
Chapter 4. Testing Model of Purchase Intention for Fast Food in Mexico: How do consumers react to food values, positive anticipated emotions, attitude toward the brand, and attitude toward eating hamburgers?
Table 4.5 Hypothesis testing and path coefficients.
Beta Standard
error t-value
p-
value f2 q2 Supported
H1
Attitude
toward the
brand ->
Purchase
intention
0.447*** 0.041 10.849 0.000 0.249 0.134 Yes
H2
Attitude
toward eating
a hamburger
-> Purchase
intention
0.197*** 0.043 4.574 0.000 0.053 0.030 Yes
H3
Food values -
> Attitude
toward the
brand
0.270*** 0.042 6.447 0.000 0.095 0.050 Yes
H4
Food values -
> Attitude
toward eating
a hamburger
0.284*** 0.043 6.608 0.000 0.097 0.052 Yes
H5
Positive
anticipated
emotions ->
Attitude
toward the
brand
0.436*** 0.043 10.126 0.000 0.248 0.146 Yes
H6 Positive
anticipated 0.368*** 0.040 9.167 0.000 0.163 0.088 Yes
137

Doctoral Thesis
Héctor Hugo Pérez Villarreal
emotions ->
Attitude
toward eating
a hamburger
H7
Positive
anticipated
emotions ->
Purchase
intention
0.206*** 0.050 4.129 0.000 0.057 0.030 Yes
Note: n=10,000 subsamples; ***p<.001; R2 (Attitude toward the brand =0.357;
Attitude toward eating=0.300; Purchase intention=0.515); q2=Predictive relevance
calculated ((R-Sq included)-(Q-Sq excluded))/(1-R-Sq included).
Esposito Vinzi, Chin, Henseler, & Wang (2010) stated formative constructs need not
be correlated between them. Also, the construct needs to be supported with the
theory about food values. Similarly, the PLS algorithm produced loadings for
reflective construct and weight for formative. Moreover, the study used the loadings
and weights indicator for each construct by nature.
138

Chapter 4. Testing Model of Purchase Intention for Fast Food in Mexico: How do consumers react to food values, positive anticipated emotions, attitude toward the brand, and attitude toward eating hamburgers?
Figure 4.2 PLS analysis results.
Figure 4.2 indicates the formative construct (food values), and inside the construct, the
best items are taste and tradition (.490; .380). On the other hand, the food values show
negative loading with environment and nutrition (-.256; -.233). These facts do not have
a position for the food value. Also, the model indicated that the emotions of
contentment, excited and satisfied are the best loadings in the model (.869, .856, .843).
It is distinguished that R2 (ATEH) is .357 higher than ATB (.300). Additionally, R2
(PI) is .515, signifying that both attitudes toward eating and the brand plus positive
anticipated emotions explain 51% of purchase intention. Even though R2-ATEH and
R2-ATB are weak, the R2-purchase intention is substantial (Hair et al., 2014).
139
Doctoral Thesis
Héctor Hugo Pérez Villarreal
4.4 Discussion
All the hypotheses proposed were supported and confirmed. It accepted the difference
by two types of attitudes: one of them toward the brand and the other toward eating a
hamburger. Also, it showed the gap between the beta indicators with .250 to predict
the purchase intention. The attitude toward the brand got the first place in the
hypotheses. Based on the previous study, the theory and empirical research suggested
that attitude toward the brand will positively influence the intention to buy. After the
results, it confirmed the positive influence and on the same road with other studies. In
this case, it corroborated with the results of Hwang et al. (2011) were mentioned that
the affective responses positively influence to brand attitudes and purchase intention.
The attitude toward eating had the right place in the final model. This hypothesis was
confirmed, and the values obtained help to explain with more percentage the purchase
intention. Others authors affirm the importance to investigate the eating behavior from
to get knowledge about the positive or negative predisposition to eat (Chen, 2009;
Ghoochani et al., 2018). The hypotheses related to food values were an essential
variable in this model, i.e., the relationship of this variable to both attitudes. At this
point, it demonstrated that the food values could be impacted in a different way to each
attitude. It validated the influence of food values affecting indirectly on the purchase
intention. With this information, it led to some discussion to add more food values and
to get an effect indirect to purchase intention. For example, these results match to Lang
& Lemmerer (2019) which affirm that personal values impact on forming a food
attitude. Last, the positive anticipated emotion positively influenced attitude toward
the brand, attitude toward eating, and intention to buy a hamburger. The results are
consistent with previous research; with assert that emotion is an irreplaceable variable
to try predicting the purchase intention. Positive anticipated emotion is a significant
140
Chapter 4. Testing Model of Purchase Intention for Fast Food in Mexico: How do consumers react to food values, positive anticipated emotions, attitude toward the brand, and attitude toward eating hamburgers?
variable, which participates in three hypotheses addressing to attitude toward the
brand, attitude toward eating a hamburger and purchase intention. This confirms
findings in other studies (Aggarwal & McGill, 2012; Evers, Adriaanse, de Ridder, &
de Witt Huberts, 2013; Jiang, King, & Prinyawiwatkul, 2014).
Managerial implications are confirmations derived from this research. First of all,
managers of fast food restaurants have to focus on the purchase intention of consumers.
The findings support that purchase intention is more influenced by attitude toward the
brand than by attitude toward eating a hamburger. Subsequently, the food value does
not impact very strongly, rather than the positive anticipated emotions. The managers
need to study how powerful is each emotion as contentment, excited and satisfied
before thinking about eating something at McDonald´s. Also, the best values to build
into the product are the taste and tradition. Hence, in this case, the managers need to
investigate about preferences, tastes and culture around the consumption in the fast
food restaurants. In that way, they need to prefer a strategy with a focus to increase
and improve the value of the brand toward the brand equity oriented into the consumer.
Correspondingly, positive anticipated emotions do not have a good association directly
with purchase intention. This explains that without an attitude toward eating a
hamburger or the attitude toward the brand, the consumer does not perceive the
intention to buy a hamburger at McDonald´s.
141

Doctoral Thesis
Héctor Hugo Pérez Villarreal
4.4.1 Limitations and future orientations
There are limitations and suggested future lines of research. First of all, the sample
should be increased to raise the level of confidence and lower the level of sampling
error. Alternatively, it is recommended to add other variables related to TPB as
perceived control, perceived difficulty and subjective norms on purchase intention.
Finally, it is suggested to apply these surveys in other cities, products, and brands to
know if there are significant differences between the samples.
4.5 Conclusions
The goal for this study was building a development and testing model and having one
comprehensive model about the purchase intention. The study planted a model with
the importance of the functional and emotional aspects through their effects on two
attitudes. This model is an approximation to better explain the purchase intention. The
food values have a low position on attitude toward the brand and attitude toward eating
a hamburger. In the other hand, anticipated positive emotions have more relevance on
attitudes, especially the attitude toward the brand and to purchase intention.
The positive food values are taste and tradition in fast food consumers. This model
provides information to fast food restaurants to pay attention to constantly evaluate the
taste that has the consumers’ favor and to explore insights about a different perception
of taste in the hamburger. Also, the tradition is significant because it includes and
preserves traditional consumption patterns, since children families and reference
groups help to educate this kind of consumption. In the other view, the consumer does
not care about the nutrition of the hamburger against the knowledge of the brand. This
142

Chapter 4. Testing Model of Purchase Intention for Fast Food in Mexico: How do consumers react to food values, positive anticipated emotions, attitude toward the brand, and attitude toward eating hamburgers?
confirms the results from Barone, Rose, Manning, & Miniard (1996) that examined
the cause to form incorrect conclusions about the product. In this case, the consumer
does not give value to the type of fat, proteins, vitamins and carbohydrates that the
hamburgers have. This demonstrates the lack of sensitivity and knowledge of healthy
and responsible consumption.
Similarly, it is happening with the environment value where the most significant
weight in the variable of food value is. The consumer does not care if the burger is
produced while taking care of the environment. The problem of having production for
the environment and pollution does not see some or any benefit knowing how the food
was manufactured. So the adequacy of practices in favor of the environment and eco-
friendly consumption is not significantly crucial for attitude or purchase intention.
It was also shown that positive anticipated emotions form the best way to explain the
purchase intention. First of all, it was verified that the anticipated negative emotions
did not show any relevant data that included that variable within the model.
Subsequently, the items with the greatest loading were analyzed, and the results were
positive anticipated emotions like contentment, delighted, excited, proud, satisfied and
self-assured. If the consumer has one type of this emotion, it is probably to have a good
level of attitude toward the brand and to get a purchase intention.
For this reason, the results of the study confirm the existence of a strong relationship
between attitudes toward the brand on purchase intention by way of anticipated
positive emotions in the consumer of McDonald´s. This proves as in previous
literature, that emotions are a necessary measure of the decision-making process of the
consumer (Bagozzi, Dholakia, & Basuroy, 2003).
143

Doctoral Thesis
Héctor Hugo Pérez Villarreal
4.6 References
Aggarwal, P., & McGill, A. L. (2012). When Brands Seem Human, Do Humans Act
Like Brands? Automatic Behavioral Priming Effects of Brand
Anthropomorphism. Journal of Consumer Research, 39(2), 307–323.
https://doi.org/10.1086/662614
Agrawal, N., & Duhachek, A. (2010). Emotional Compatibility and the Effectiveness
of Antidrinking Messages: A Defensive Processing Perspective on Shame
and Guilt. Journal of Marketing Research, 47(2), 263–273.
https://doi.org/10.1509/jmkr.47.2.263
Ajzen, I. (1991). The theory of planned behavior. Organizational Behavior and
Human Decision Processes, 50(2), 179–211. https://doi.org/10.1016/0749-
5978(91)90020-T
Ajzen, I., & Fishbein, M. (1980). Understanding attitudes and predicting social
behavior (Pbk. ed). Englewood Cliffs, N.J: Prentice-Hall.
Asif, M., Xuhui, W., Nasiri, A., & Ayyub, S. (2018). Determinant factors influencing
organic food purchase intention and the moderating role of awareness: A
comparative analysis. Food Quality and Preference, 63, 144–150.
https://doi.org/10.1016/j.foodqual.2017.08.006
Assael, H. (1992). Consumer behavior and marketing action. Boston: PWS-KENT
Pub.
Bagozzi, R. P., & Dholakia, U. M. (2006). Antecedents and purchase consequences
of customer participation in small group brand communities. International
Journal of Research in Marketing, 23(1), 45–61.
https://doi.org/10.1016/j.ijresmar.2006.01.005
144

Chapter 4. Testing Model of Purchase Intention for Fast Food in Mexico: How do consumers react to food values, positive anticipated emotions, attitude toward the brand, and attitude toward eating hamburgers?
Bagozzi, R. P., Dholakia, U. M., & Basuroy, S. (2003). How effortful decisions get
enacted: The motivating role of decision processes, desires, and anticipated
emotions. Journal of Behavioral Decision Making, 16(4), 273–295.
https://doi.org/10.1002/bdm.446
Bai, L., Wang, M., Yang, Y., & Gong, S. (2019). Food safety in restaurants: The
consumer perspective. International Journal of Hospitality Management, 77,
139–146. https://doi.org/10.1016/j.ijhm.2018.06.023
Barahona, I., Hernández, D. M., Pérez-Villarreal, H. H., & del Pilar Martínez-Ruíz,
M. (2018). Identifying research topics in marketing science along the past
decade: A content analysis. Scientometrics, 117(1), 293–312.
https://doi.org/10.1007/s11192-018-2851-2
Barone, M. J., Rose, R. L., Manning, K. C., & Miniard, P. W. (1996). Another Look
at the Impact of Reference Information on Consumer Impressions of
Nutrition Information. Journal of Public Policy & Marketing, 15(1), 55–62.
https://doi.org/10.1177/074391569601500105
Basha, M. B., & Lal, D. (2019). Indian consumers’ attitudes towards purchasing
organically produced foods: An empirical study. Journal of Cleaner
Production, 215, 99–111. https://doi.org/10.1016/j.jclepro.2018.12.098
Becker, J.-M., & Ismail, I. R. (2016). Accounting for sampling weights in PLS path
modeling: Simulations and empirical examples. European Management
Journal, 34(6), 606–617. https://doi.org/10.1016/j.emj.2016.06.009
Bentler, P. M., & Bonett, D. G. (1980). Significance tests and goodness of fit in the
analysis of covariance structures. Psychological Bulletin, 88(3), 588–606.
https://doi.org/10.1037/0033-2909.88.3.588
145
Doctoral Thesis
Héctor Hugo Pérez Villarreal
Berger, J., & Milkman, K. L. (2012). What Makes Online Content Viral? Journal of
Marketing Research, 49(2), 192–205. https://doi.org/10.1509/jmr.10.0353
Chang, C. (2011). Feeling Ambivalent About Going Green. Journal of Advertising,
40(4), 19–32. https://doi.org/10.2753/JOA0091-3367400402
Chen, M. (2009). Attitude toward organic foods among Taiwanese as related to
health consciousness, environmental attitudes, and the mediating effects of a
healthy lifestyle. British Food Journal, 111(2), 165–178.
https://doi.org/10.1108/00070700910931986
Chen, M., & Lu, T. (2011). Modeling e-coupon proneness as a mediator in the
extended TPB model to predict consumers’ usage intentions. Internet
Research, 21(5), 508–526. https://doi.org/10.1108/10662241111176344
Chiu, H.-C., Hsieh, Y.-C., & Kuo, Y.-C. (2012). How to Align your Brand Stories
with Your Products. Journal of Retailing, 88(2), 262–275.
https://doi.org/10.1016/j.jretai.2012.02.001
Clarkson, C., Mirosa, M., & Birch, J. (2018). Consumer acceptance of insects and
ideal product attributes. British Food Journal, 120(12), 2898–2911.
https://doi.org/10.1108/BFJ-11-2017-0645
Coricelli, C., Foroni, F., Osimo, S. A., & Rumiati, R. I. (2019). Implicit and explicit
evaluations of foods: The natural and transformed dimension. Food Quality
and Preference, 73, 143–153. https://doi.org/10.1016/j.foodqual.2018.11.014
de Boer, J., & Schösler, H. (2016). Food and value motivation: Linking consumer
affinities to different types of food products. Appetite, 103, 95–104.
https://doi.org/10.1016/j.appet.2016.03.028
De Pelsmaeker, S., Schouteten, J. J., Gellynck, X., Delbaere, C., De Clercq, N.,
Hegyi, A., … Dewettinck, K. (2017). Do anticipated emotions influence
146

Chapter 4. Testing Model of Purchase Intention for Fast Food in Mexico: How do consumers react to food values, positive anticipated emotions, attitude toward the brand, and attitude toward eating hamburgers?
behavioural intention and behaviour to consume filled chocolates? British
Food Journal, 119(9), 1983–1998. https://doi.org/10.1108/BFJ-01-2016-0006
Diallo, M. F. (2012). Effects of store image and store brand price-image on store
brand purchase intention: Application to an emerging market. Journal of
Retailing and Consumer Services, 19(3), 360–367.
https://doi.org/10.1016/j.jretconser.2012.03.010
Diallo, M. F., & Seck, A. M. (2018). How store service quality affects attitude
toward store brands in emerging countries: Effects of brand cues and the
cultural context. Journal of Business Research, 86, 311–320.
https://doi.org/10.1016/j.jbusres.2017.08.017
Diamantopoulos, A., & Papadopoulos, N. (2010). Assessing the cross-national
invariance of formative measures: Guidelines for international business
researchers. Journal of International Business Studies, 41(2), 360–370.
https://doi.org/10.1057/jibs.2009.37
Ding, C. G., & Tseng, T. H. (2015). On the relationships among brand experience,
hedonic emotions, and brand equity. European Journal of Marketing, 49(7/8),
994–1015. https://doi.org/10.1108/EJM-04-2013-0200
Ditlevsen, K., Sandøe, P., & Lassen, J. (2019). Healthy food is nutritious, but organic
food is healthy because it is pure: The negotiation of healthy food choices by
Danish consumers of organic food. Food Quality and Preference, 71, 46–53.
https://doi.org/10.1016/j.foodqual.2018.06.001
Esposito Vinzi, V., Chin, W. W., Henseler, J., & Wang, H. (Eds.). (2010). Handbook
of Partial Least Squares: Concepts, Methods and Applications.
https://doi.org/10.1007/978-3-540-32827-8
147

Doctoral Thesis
Héctor Hugo Pérez Villarreal
Evers, C., Adriaanse, M., de Ridder, D. T. D., & de Witt Huberts, J. C. (2013). Good
mood food. Positive emotion as a neglected trigger for food intake. Appetite,
68, 1–7. https://doi.org/10.1016/j.appet.2013.04.007
F. Hair Jr, J., Sarstedt, M., Hopkins, L., & G. Kuppelwieser, V. (2014). Partial least
squares structural equation modeling (PLS-SEM): An emerging tool in
business research. European Business Review, 26(2), 106–121.
https://doi.org/10.1108/EBR-10-2013-0128
Fornell, C., & Larcker, D. F. (1981). Evaluating Structural Equation Models with
Unobservable Variables and Measurement Error. Journal of Marketing
Research, 18(1), 39. https://doi.org/10.2307/3151312
Foroudi, P. (2019). Influence of brand signature, brand awareness, brand attitude,
brand reputation on hotel industry’s brand performance. International
Journal of Hospitality Management, 76, 271–285.
https://doi.org/10.1016/j.ijhm.2018.05.016
Garg, N., Wansink, B., & Inman, J. J. (2007). The Influence of Incidental Affect on
Consumers’ Food Intake. Journal of Marketing, 71(1), 194–206.
https://doi.org/10.1509/jmkg.71.1.194
Ghali-Zinoubi, Z., & Toukabri, M. (2019). The antecedents of the consumer
purchase intention: Sensitivity to price and involvement in organic product:
Moderating role of product regional identity. Trends in Food Science &
Technology, 90, 175–179. https://doi.org/10.1016/j.tifs.2019.02.028
Ghoochani, O. M., Torabi, R., Hojjati, M., Ghanian, M., & Kitterlin, M. (2018).
Factors influencing Iranian consumers’ attitudes toward fast-food
consumption. British Food Journal, 120(2), 409–423.
https://doi.org/10.1108/BFJ-12-2016-0612
148

Chapter 4. Testing Model of Purchase Intention for Fast Food in Mexico: How do consumers react to food values, positive anticipated emotions, attitude toward the brand, and attitude toward eating hamburgers?
Ghvanidze, S., Velikova, N., Dodd, T., & Oldewage-Theron, W. (2017). A discrete
choice experiment of the impact of consumers’ environmental values, ethical
concerns, and health consciousness on food choices: A cross-cultural
analysis. British Food Journal, 119(4), 863–881. https://doi.org/10.1108/BFJ-
07-2016-0342
Golder, P. N., Mitra, D., & Moorman, C. (2012). What is Quality? An Integrative
Framework of Processes and States. Journal of Marketing, 76(4), 1–23.
https://doi.org/10.1509/jm.09.0416
Goldsmith, R. E., Freiden, J., & Henderson, K. V. (1995). The impact of social
values on food-related attitudes. Journal of Product & Brand Management,
4(4), 6–14. https://doi.org/10.1108/10610429510097654
Hair, J. F. (Ed.). (2010). Multivariate data analysis: A global perspective (7. ed.,
global ed). Upper Saddle River, NJ: Pearson.
Hair, J. F. (Ed.). (2017). A primer on partial least squares structural equation
modeling (PLS-SEM) (Second edition). Los Angeles: Sage.
Hair, J., Hollingsworth, C. L., Randolph, A. B., & Chong, A. Y. L. (2017). An
updated and expanded assessment of PLS-SEM in information systems
research. Industrial Management & Data Systems, 117(3), 442–458.
https://doi.org/10.1108/IMDS-04-2016-0130
Handley, L. (2010). Brands are the vital ingredient of health drive. Marketing Week,
p. 22.
Haws, K. L., & Winterich, K. P. (2013). When Value Trumps Health in a Supersized
World. Journal of Marketing, 77(3), 48–64.
https://doi.org/10.1509/jm.11.0261
149

Doctoral Thesis
Héctor Hugo Pérez Villarreal
Hsee, C. K., Yang, Y., Zheng, X., & Wang, H. (2015). Lay Rationalism: Individual
Differences in using Reason versus Feelings to Guide Decisions. Journal of
Marketing Research, 52(1), 134–146. https://doi.org/10.1509/jmr.13.0532
Hu, Li-tze, & Bentler, P. M. (1998). Fit indices in covariance structure modeling:
Sensitivity to underparameterized model misspecification. Psychological
Methods, 3(4), 424–453. https://doi.org/10.1037/1082-989X.3.4.424
Hu, Li-tze, & Bentler, P. M. (1999). Cutoff criteria for fit indexes in covariance
structure analysis: Conventional criteria versus new alternatives. Structural
Equation Modeling: A Multidisciplinary Journal, 6(1), 1–55.
https://doi.org/10.1080/10705519909540118
Huang, C.-C., Wang, Y.-M., Wu, T.-W., & Wang, P.-A. (2013). An Empirical
Analysis of the Antecedents and Performance Consequences of Using the
Moodle Platform. International Journal of Information and Education
Technology, 217–221. https://doi.org/10.7763/IJIET.2013.V3.267
Hwang, Jiyoung. (2016). Organic food as self-presentation: The role of
psychological motivation in older consumers’ purchase intention of organic
food. Journal of Retailing and Consumer Services, 28, 281–287.
https://doi.org/10.1016/j.jretconser.2015.01.007
Hwang, Johye, Yoon, Y.-S., & Park, N.-H. (2011). Structural effects of cognitive and
affective reponses to web advertisements, website and brand attitudes, and
purchase intentions: The case of casual-dining restaurants. International
Journal of Hospitality Management, 30(4), 897–907.
https://doi.org/10.1016/j.ijhm.2011.01.011
Io, M.-U. (2017). Understanding the effects of multi-dimensional tourism
experiences on tourists’ positive emotions and satisfaction in the context of
150

Chapter 4. Testing Model of Purchase Intention for Fast Food in Mexico: How do consumers react to food values, positive anticipated emotions, attitude toward the brand, and attitude toward eating hamburgers?
casino hotels. International Journal of Culture, Tourism and Hospitality
Research, 11(2), 142–156. https://doi.org/10.1108/IJCTHR-05-2016-0050
Jahn, S., Tsalis, G., & Lähteenmäki, L. (2019). How attitude towards food
fortification can lead to purchase intention. Appetite, 133, 370–377.
https://doi.org/10.1016/j.appet.2018.11.022
Jarvis, C. B., MacKenzie, S. B., & Podsakoff, P. M. (2003). A Critical Review of
Construct Indicators and Measurement Model Misspecification in Marketing
and Consumer Research. Journal of Consumer Research, 30(2), 199–218.
https://doi.org/10.1086/376806
Jeng, S.-P. (2016). The influences of airline brand credibility on consumer purchase
intentions. Journal of Air Transport Management, 55, 1–8.
https://doi.org/10.1016/j.jairtraman.2016.04.005
Jiang, Y., King, J. M., & Prinyawiwatkul, W. (2014). A review of measurement and
relationships between food, eating behavior and emotion. Trends in Food
Science & Technology, 36(1), 15–28.
https://doi.org/10.1016/j.tifs.2013.12.005
Koenig-Lewis, N., & Palmer, A. (2014). The effects of anticipatory emotions on
service satisfaction and behavioral intention. Journal of Services Marketing,
28(6), 437–451. https://doi.org/10.1108/JSM-09-2013-0244
Lang, M., & Lemmerer, A. (2019). How and why restaurant patrons value locally
sourced foods and ingredients. International Journal of Hospitality
Management, 77, 76–88. https://doi.org/10.1016/j.ijhm.2018.06.015
Lee, C. J., & Andrade, E. B. (2011). Fear, Social Projection, and Financial Decision
Making. Journal of Marketing Research, 48(SPL), S121–S129.
https://doi.org/10.1509/jmkr.48.SPL.S121
151

Doctoral Thesis
Héctor Hugo Pérez Villarreal
Lee, P. Y., Lusk, K., Mirosa, M., & Oey, I. (2014). The role of personal values in
Chinese consumers’ food consumption decisions. A case study of healthy
drinks. Appetite, 73, 95–104. https://doi.org/10.1016/j.appet.2013.11.001
Levav, J., & Mcgraw, A. P. (2009). Emotional Accounting: How Feelings about
Money Influence Consumer Choice. Journal of Marketing Research, 46(1),
66–80. https://doi.org/10.1509/jmkr.46.1.66
Liu, J., Lin, S., & Feng, Y. (2018). Understanding why Chinese contractors are not
willing to purchase construction insurance. Engineering, Construction and
Architectural Management, 25(2), 257–272. https://doi.org/10.1108/ECAM-
08-2016-0186
Lorenz, B. A.-S., Langen, N., Hartmann, M., & Klink-Lehmann, J. (2018).
Decomposing attitudes towards food leftovers: Implications for general
attitude, intention and behavior. British Food Journal, 120(11), 2498–2509.
https://doi.org/10.1108/BFJ-08-2017-0430
Lusk, J. L. (2011). External validity of the food values scale. Food Quality and
Preference, 22(5), 452–462. https://doi.org/10.1016/j.foodqual.2011.02.009
Lusk, J. L., & Briggeman, B. C. (2009). Food Values. American Journal of
Agricultural Economics, 91(1), 184–196. https://doi.org/10.1111/j.1467-
8276.2008.01175.x
Manan, H. A. (2016). The Hierarchical Influence of Personal Values on Attitudes
Toward Food and Food Choices. Procedia Economics and Finance, 37, 439–
446. https://doi.org/10.1016/S2212-5671(16)30149-6
Martínez-Ruiz, M. P., & Gómez-Cantó, C. M. (2016). Key External Influences
Affecting Consumers’ Decisions Regarding Food. Frontiers in Psychology, 7.
https://doi.org/10.3389/fpsyg.2016.01618
152

Chapter 4. Testing Model of Purchase Intention for Fast Food in Mexico: How do consumers react to food values, positive anticipated emotions, attitude toward the brand, and attitude toward eating hamburgers?
Nicolini, V., Cassia, F., & Bellotto, M. (2017). Children perceptions of emotional
and rational appeals in social advertisements. Young Consumers, 18(3), 261–
277. https://doi.org/10.1108/YC-02-2017-00665
Nielsen, J. H., Shapiro, S. A., & Mason, C. H. (2010). Emotionality and Semantic
Onsets: Exploring Orienting Attention Responses in Advertising. Journal of
Marketing Research, 47(6), 1138–1150.
https://doi.org/10.1509/jmkr.47.6.1138
Phau, I., & Teah, M. (2009). Devil wears (counterfeit) Prada: A study of antecedents
and outcomes of attitudes towards counterfeits of luxury brands. Journal of
Consumer Marketing, 26(1), 15–27.
https://doi.org/10.1108/07363760910927019
Poor, M., Duhachek, A., & Krishnan, H. S. (2013). How Images of Other Consumers
Influence Subsequent Taste Perceptions. Journal of Marketing, 77(6), 124–
139. https://doi.org/10.1509/jm.12.0021
Raaijmakers, I., Sijtsema, S., Labrie, C., & Snoek, H. (2018). Consumer
segmentation based on health-related motive orientations and fruit and
vegetable consumption. British Food Journal, 120(8), 1749–1763.
https://doi.org/10.1108/BFJ-02-2018-0098
Rana, J., & Paul, J. (2017). Consumer behavior and purchase intention for organic
food: A review and research agenda. Journal of Retailing and Consumer
Services, 38, 157–165. https://doi.org/10.1016/j.jretconser.2017.06.004
Rezai, G., Teng, P. K., Shamsudin, M. N., Mohamed, Z., & Stanton, J. L. (2017).
Effect of perceptual differences on consumer purchase intention of natural
functional food. Journal of Agribusiness in Developing and Emerging
Economies, 7(2), 153–173. https://doi.org/10.1108/JADEE-02-2015-0014
153

Doctoral Thesis
Héctor Hugo Pérez Villarreal
Ruth, J. A. (2001). Promoting a Brand’s Emotion Benefits: The Influence of Emotion
Categorization Processes on Consumer Evaluations. Journal of Consumer
Psychology, 11(2), 99–113. https://doi.org/10.1207/S15327663JCP1102_03
Sarstedt, M., Hair, J. F., Ringle, C. M., Thiele, K. O., & Gudergan, S. P. (2016).
Estimation issues with PLS and CBSEM: Where the bias lies! Journal of
Business Research, 69(10), 3998–4010.
https://doi.org/10.1016/j.jbusres.2016.06.007
Shmueli, G., Ray, S., Velasquez Estrada, J. M., & Chatla, S. B. (2016). The elephant
in the room: Predictive performance of PLS models. Journal of Business
Research, 69(10), 4552–4564. https://doi.org/10.1016/j.jbusres.2016.03.049
Small, D. A., & Verrochi, N. M. (2009). The Face of Need: Facial Emotion
Expression on Charity Advertisements. Journal of Marketing Research,
46(6), 777–787. https://doi.org/10.1509/jmkr.46.6.777_JMR6F
Song, J., & Qu, H. (2019). How does consumer regulatory focus impact perceived
value and consumption emotions? International Journal of Contemporary
Hospitality Management, 31(1), 285–308. https://doi.org/10.1108/IJCHM-03-
2017-0136
Sprotles, G. B., & Kendall, E. L. (1986). A Methodology for Profiling Consumers’
Decision-Making Styles. Journal of Consumer Affairs, 20(2), 267–279.
https://doi.org/10.1111/j.1745-6606.1986.tb00382.x
Strahilevitz, M. A., Odean, T., & Barber, B. M. (2011). Once Burned, Twice Shy:
How Naive Learning, Counterfactuals, and Regret Affect the Repurchase of
Stocks Previously Sold. Journal of Marketing Research, 48(SPL), S102–
S120. https://doi.org/10.1509/jmkr.48.SPL.S102
154

Chapter 4. Testing Model of Purchase Intention for Fast Food in Mexico: How do consumers react to food values, positive anticipated emotions, attitude toward the brand, and attitude toward eating hamburgers?
Streukens, S., & Leroi-Werelds, S. (2016). Bootstrapping and PLS-SEM: A step-by-
step guide to get more out of your bootstrap results. European Management
Journal, 34(6), 618–632. https://doi.org/10.1016/j.emj.2016.06.003
Talih Akkaya, D., Akyol, A., & Gölbaşı Şimşek, G. (2018). Sosyal medya
reklamciliğinda tüketici algilarinin tutum, davraniş ve satin alma niyeti
üzerine etkisi. M U Iktisadi ve Idari Bilimler Dergisi, 361–388.
https://doi.org/10.14780/muiibd.384073
Teixeira, T., Wedel, M., & Pieters, R. (2012). Emotion-Induced Engagement in
Internet Video Advertisements. Journal of Marketing Research, 49(2), 144–
159. https://doi.org/10.1509/jmr.10.0207
Tey, Y. S., Arsil, P., Brindal, M., Liew, S. Y., Teoh, C. T., & Terano, R. (2018).
Personal values underlying ethnic food choice: Means-end evidence for
Japanese food. Journal of Ethnic Foods, 5(1), 33–39.
https://doi.org/10.1016/j.jef.2017.12.003
Thompson, C. J., Rindfleisch, A., & Arsel, Z. (2006). Emotional Branding and the
Strategic Value of the Doppelgänger Brand Image. Journal of Marketing,
70(1), 50–64. https://doi.org/10.1509/jmkg.70.1.050.qxd
Wang, E. S.-T. (2009). Displayed emotions to patronage intention: Consumer
response to contact personnel performance. The Service Industries Journal,
29(3), 317–329. https://doi.org/10.1080/02642060701846747
Wen, J., Hu, Y., & Kim, H. J. (2018). Impact of individual cultural values on hotel
guests’ positive emotions and positive eWOM intention: Extending the
cognitive appraisal framework. International Journal of Contemporary
Hospitality Management, 30(3), 1769–1787. https://doi.org/10.1108/IJCHM-
07-2017-0409
155

Doctoral Thesis
Héctor Hugo Pérez Villarreal
Werts, C. E., Linn, R. L., & Jöreskog, K. G. (1974). Intraclass Reliability Estimates:
Testing Structural Assumptions. Educational and Psychological
Measurement, 34(1), 25–33. https://doi.org/10.1177/001316447403400104
Williams, P., & Aaker, J. L. (2002). Can Mixed Emotions Peacefully Coexist?
Journal of Consumer Research, 28(4), 636–649.
https://doi.org/10.1086/338206
Wood, S. L., & Moreau, C. P. (2006). From Fear to Loathing? How Emotion
Influences the Evaluation and Early Use of Innovations. Journal of
Marketing, 70(3), 44–57. https://doi.org/10.1509/jmkg.70.3.044
Wu, S. (2003). The relationship between consumer characteristics and attitude
toward online shopping. Marketing Intelligence & Planning, 21(1), 37–44.
https://doi.org/10.1108/02634500310458135
Yadav, R., & Pathak, G. S. (2016). Intention to purchase organic food among young
consumers: Evidences from a developing nation. Appetite, 96, 122–128.
https://doi.org/10.1016/j.appet.2015.09.017
Yuzhanin, S., & Fisher, D. (2016). The efficacy of the theory of planned behavior for
predicting intentions to choose a travel destination: A review. Tourism
Review, 71(2), 135–147. https://doi.org/10.1108/TR-11-2015-0055
Zhang, H., Sun, J., Liu, F., & G. Knight, J. (2014). Be rational or be emotional:
Advertising appeals, service types and consumer responses. European
Journal of Marketing, 48(11/12), 2105–2126. https://doi.org/10.1108/EJM-
10-2012-0613
Zhang, Y., Jing, L., Bai, Q., Shao, W., Feng, Y., Yin, S., & Zhang, M. (2018).
Application of an integrated framework to examine Chinese consumers’
purchase intention toward genetically modified food. Food Quality and
Preference, 65, 118–128. https://doi.org/10.1016/j.foodqual.2017.11.001 156

Chapter 4. Testing Model of Purchase Intention for Fast Food in Mexico: How do consumers react to food values, positive anticipated emotions, attitude toward the brand, and attitude toward eating hamburgers?
Zhao, X., Deng, S., & Zhou, Y. (2017). The impact of reference effects on online
purchase intention of agricultural products: The moderating role of
consumers’ food safety consciousness. Internet Research, 27(2), 233–255.
https://doi.org/10.1108/IntR-03-2016-0082
157


Chapter 5. Discussions

Chapter 5. Discussions
5.1 Discussions
The food sector underscores the importance of studies aimed at ascertaining consumer
perception. Thus, this thesis includes three studies aimed at understanding the value of
consumer behaviour in strategic marketing research.
The analysis of the first study provides evidence of the importance of consumer
problems. This proves the relevance of the "consumer" as the central axis of research
throughout the research period. Similarly, the "product" is also positioned as a next
factor of importance. The first study provides value for academics, researchers and
professionals within the area of marketing sciences by tracking and identifying the
most relevant publications with respect to time periods and topics. By providing
graphs, readers can quickly identify those articles that made significant contributions
in the field or locate specific publication niches. This work also illustrates how reviews
of marketing literature can be carried out effectively while reducing time spent. The
main theme, "customer choice," plays a strategic role in establishing a link between
consumers and purchasing decisions. Two other main themes of interest were "strategy
development" and "pricing programs". This provides evidence for the idea that pricing
policies are relevant to contemporary marketing, bearing in mind that pricing policies
encompass concepts such as "action indicators", "performance measures" and
"profitability metrics". The results provide partial support for the popularity that
Customer Relationship Management (CRM) has gained in recent years. In this sense,
the topics most related to CRM are "value added", "orientation" and "service". Here,
the importance of long-term customer relationships, which is a fundamental concept
in marketing science, is also highlighted. “Emotional marketing" is another major
theme that recognizes the generation of knowledge in this discipline by researching
the emotions of individuals. This work also contributes to the discussion of how
161
Doctoral Thesis
Héctor Hugo Pérez Villarreal
literature reviews can be conducted within marketing science or in other disciplines.
The main objective is resolved by proposing useful methods for classifying
publications according to content similarities. The methods presented here could be
used as general guidelines for authors and researchers who are interested in conducting
systematic literature reviews. By identifying the specialized vocabulary used in this
discipline and then incorporating it into their papers, authors can be assured that they
are at the forefront of the use of modern vocabulary. In the same vein, it was found
that "consumers" and "customers" are the central topics of marketing research journals
and that the concept of "product" has become a fundamental concept where new
consideration emerges towards the development of new products and their interactions
with the consumer. According to the analysis it was detected that the word "food" is
one of the most worrying sectors for marketing researchers. This generated the
continuation with the following two studies.
For the second study, all the hypotheses proposed in this study have been confirmed,
evidencing positive and significate relations between the construct proposed. First,
with regard to the influence of food values on attitude, this research has revealed the
importance that consumers attach to each of the values of the proposed scale. So taste,
tradition, appearance and convenience are the best valued. Previous studies have also
emphasized these values and as in this research, the price is not one of the values that
have much weight. The latter is in line with the product category, since its cost is
reduced. It is noteworthy that the weights of the values “environmental impact”,
"nutrition" and "origin" (although to a very minor extent) are negative. In relation to
the “environmental impact” food value, it could be an indication that consumers think
that the intake of a hamburger has no impact on the environment. With regard to the
"nutrition" food value, it may be motivated by the fact that it is considered an
162

Chapter 5. Discussions
"unhealthy" product with a high amount of calories. In relation to the “origin” food
value, maybe it could be a hint that consumers do not care about the origin of this type
of food. Second, the importance of hedonic and utilitarian benefits should be stressed.
The items that value these benefits are consistent as previous research. However, it
should be noted that "convenience" has been valued as a hedonic benefit. Sometimes,
the “delight” of a meal, or dinner, can be frustrated by the waiting times to be attended,
to the delay in providing the service (once requested). All these aspects are very well
valued for the enjoyment of the consumers. A benefit that has a utilitarian character -
convenience - can be converted into a hedonic benefit. As for the utilitarian benefits,
all of them have been very well valued by the consumers. Highlighting here as a
benefit, which can be considered hedonic-appearance-has been valued as a utilitarian
benefit. This result is consistent with the value perceived by a consumer when
purchasing any product or service. The consumer when assessing the product, not only
takes into account its cost, but also how the product is presented to be consumed, so it
becomes a utilitarian benefit. In addition, both hedonic and utilitarian benefits,
positively support the formation of positive attitudes towards hamburger consumption
and specifically those sell by McDonald’s. It is noteworthy of this last aspect, since it
is not the same to eat a product such as hamburgers when the whole process is
controlled by the consumer, or when attending a restaurant (not fast-food), which has
some quality indicator (Michellin stars, number of forks, etc.), when consumed at
McDonald's, where no quality process is controlled and is considered a fast-food
restaurant. Additionally, this mediating effect of the attitude in the relation of
utilitarian / hedonic benefits and intentions should be highlighted, which shows the
weight that both benefits have on intentions, this weight being higher for hedonic
benefits. This is a novelty, since until now these mediating effects had not been tested.
Finally, it has been observed how there is an association between attitudes toward
163

Doctoral Thesis
Héctor Hugo Pérez Villarreal
eating hamburgers and purchase intention. This would be a consistent finding
according to the previous research.
The objective of the last study was to construct a development and testing model,
where a complete model of explanation of consumers' purchase intention is generated.
The study planted a model with the importance of functional and emotional aspects
through their effects on two types of attitudes. Food values have a low position in
brand attitude and hamburger attitude. On the other hand, the positive emotions
anticipated have more relevance in attitudes, especially the attitude towards the brand
and the intention to buy. The positive values of food are taste and tradition in fast food
consumers. This model provides information to fast-food restaurants to pay attention
to constantly assessing the taste value of consumers and to explore ideas about a
different perception of taste in the hamburger. In addition, tradition is significant
because it includes and preserves traditional consumption patterns, as children's
families and reference groups help to educate this type of consumption. From the other
point of view, the consumer does not care about the nutrition of the hamburger versus
brand awareness. In this case, the consumer does not value the types of fats, proteins,
vitamins and carbohydrates that burgers have. This shows the lack of sensitivity and
knowledge of healthy and responsible consumption. Similarly, it is also happening
with the environmental value where the most significant weight is in the food value
variable. The consumer does not care if the hamburger is produced while caring for
the environment. The problem of having production for the environment and pollution
sees no benefit or no benefit in knowing how the food was manufactured. Therefore,
the adequacy of practices in favor of the environment and consumption respectful of
the environment is not significantly crucial to the attitude or intention to purchase. It
was also shown that positive anticipated emotions are the best way to explain the
164
Chapter 5. Discussions
purchase intention. Firstly, it was verified that the expected negative emotions did not
show any relevant data that included that variable within the model. Subsequently, the
items with the highest loads were analyzed, and the results were anticipated positive
emotions such as satisfaction, charm, emotion, pride and security. If the consumer is
going to have one of these emotions, he is likely to have a good level of attitude
towards the brand and then develop a purchase intention. For this reason, the results
of the study confirm the existence of a strong relationship between attitudes towards
the brand in the intention to buy through positive emotions anticipated in the consumer
of fast food restaurants. This demonstrates that emotions are a necessary measure of
the consumer's decision-making process.
The objectives of this research were met throughout the research process. The general
objective was to analyze consumer behavior in the food consumption decision process.
This implied strongly analyzing the impact of food on consumer behavior in two axes:
scientific research and empirical research. This fulfilled the task of performing a
content analysis over a nine-year period of the journals with the greatest impact factor
in the marketing discipline in order to identify the research topics according to science.
It was also determined the impact of food values in their transformation towards
hedonic and utilitarian benefits, within the output variables such as consumption
attitude and purchase intention. Finally, the explanation of purchase intention was
increased by adding variables related to the hedonic part of consumption, such as
positive anticipated emotions. A more punctual model of their purchasing behavior
was presented, separating different types of attitudes, one towards the act of eating and
the other towards the brand.
The highlights of this Doctoral Thesis can be summary in six result-oriented points: 1)
The consumers and customers are the main research topics in marketing journals,
165

Doctoral Thesis
Héctor Hugo Pérez Villarreal
which show a growth in consumer buying behavior; 2) Unlike previous periods, the
product has been conferred as an essential factor to apply a new consideration to the
design of new products in line with consumer information; 3) The positive influence
of food values on the incorporation of the utilitarian and hedonic benefits of
consumption was also confirmed; 4) The great impact was the attitude toward the
brand rather than the attitude toward eating oneself was detected in the model of
predicting the consumer's purchase intention; 5) Food values and anticipated positive
emotions positively influence brand attitude, which in turn affects the consumer's
buying intention; 6) Anticipated positive emotions have a stronger impact than food
values, and it is reaffirmed the best way to explain the purchase intention is through
the brand attitude rather than the food attitude.
5.2 Business implications
According to the business implications, fast-food companies should keep in mind that
despite the heavy investments in advertising they have made, consumers still think that
their hamburgers are “unhealthy” (negative weight of food values), that it is a product
of convenience and they have managed to capture the consumer for those values that
are closely related to the act of consumption, such as: taste, tradition, appearance and
convenience. It can be believe that in the long term, these companies should change
their advertising message and try to emphasize healthier values. The new consumer
segments are more informed, they look at the nutritional components and above all
they value eating “healthy” products that do not harm the environment, although for
this they must pay a premium price. This change in strategy may be favored, due to
the importance of both hedonic benefits (enjoying food, delighting) and utilitarian, in
the formation of attitudes.
166

Chapter 5. Discussions
Also, managers of fast food restaurants have to focus on the purchase intention of
consumers. The findings support that purchase intention is more influenced by attitude
toward the brand than by attitude toward eating a hamburger. Subsequently, the food
values do not impact very strongly, rather than the positive anticipated emotions. The
managers need to study how powerful is each emotion as contentment, excited and
satisfied before thinking about eating something at McDonald´s. Also, the best values
to build into the product are the taste and tradition. Hence, in this case, the managers
need to investigate about preferences, tastes and culture around the consumption in the
fast food restaurants. In that way, they need to prefer a strategy with a focus to increase
and improve the value of the brand toward the brand equity oriented into the consumer.
Correspondingly, positive anticipated emotions do not have a good association directly
with purchase intention. This explains that without an attitude toward eating a
hamburger or the attitude toward the brand, the consumer does not perceive the
intention to buy a hamburger at McDonald´s.
5.3 Future lines of study
This Doctoral Thesis has some future lines of study for each objective proposed in this
research. In the first study of the identification of research topics in marketing science,
the following points are proposed.
- It is recommended to build another analysis period 2015-2024 and to be able to
visualize the different ones with the previous period in terms, topics and dimensions
that have made marketing science consolidate.
167

Doctoral Thesis
Héctor Hugo Pérez Villarreal
- Add more abstracts of other journals of the same category to the database to enrich
the vocabulary and reaffirm or reject the findings found in the first study.
- Analyze another category of journals focused on food marketing topics to find the
main topics in food consumption behavior.
For the second and third study it is recommended to add other variables related to TPB
as perceived control, perceived risk and subjective norms on purchase intention.
Finally, it is suggested to apply these surveys in other cities, products and brands to
know if there are significant differences between the samples.
168

Appendices


Appendices
Appendice 1. Survey A
Estimado Encuestado:
En esta encuesta pretendemos obtener su opinión respecto al consumo de comida
rápida. Este estudio es conducido por la Universidad de Castilla-La Mancha. Las
opiniones que usted nos proporcione serán clasificadas como confidenciales y serán
utilizadas solamente para propósitos de investigación académica.
En el apartado siguiente, por favor indica cuan tan importante son los siguientes
factores cuando acudes a comprar algún producto de Mcdonalds.
Valore LOS ATRIBUTOS QUE MÁS APRECIA DE LA COMIDA DE
MCDONALD. Siendo (1) la valoración más baja y (5) la valoración más alta.
Naturalidad (producto producido sin tecnologías modernas) 1 2 3 4 5
Sabor del producto 1 2 3 4 5
Precio 1 2 3 4 5
Seguridad (de que el alimento no causará ninguna enfermedad) 1 2 3 4 5
Conveniencia (facilidad con que el alimento es cocinado o consumido) 1 2 3 4 5
Nutrición (cantidad y tipo de grasas, proteínas, vitaminas, etc.) 1 2 3 4 5
Tradición (conservación de las pautas de consumo tradicionales) 1 2 3 4 5
Origen (donde se han producido las materias primas de los alimentos) 1 2 3 4 5
Justicia (el grado en el que todas las partes implicadas en la producción del
alimento salen igualmente beneficiadas)
1 2 3 4 5
Apariencia (grado en el que el alimento parece atractivo, presentación) 1 2 3 4 5
Impacto medioambiental (efecto de la producción del alimento en el medio
ambiente)
1 2 3 4 5
171

Doctoral Thesis
Héctor Hugo Pérez Villarreal
Valoración BENEFICIOS de McDonald. Siendo (1) la valoración más baja y (5) la
valoración más alta.
Siento que la naturalidad de los productos de me causa placer. 1 2 3 4 5
Siento que el sabor de los productos me da placer. 1 2 3 4 5
El precio de los productos me da placer. 1 2 3 4 5
La seguridad e inocuidad del alimento me da placer. 1 2 3 4 5
La comodidad de consumo y de preparación de los alimentos es placentera. 1 2 3 4 5
Siento que la nutrición de los productos es placentera. 1 2 3 4 5
Siento que la tradición de Mcdonald me causa placer. 1 2 3 4 5
El origen de los productos me da placer al consumir el producto. 1 2 3 4 5
Al consumir favoreciendo al comercio justo me causa placer. 1 2 3 4 5
El aspecto y presentación de los productos me da placer. 1 2 3 4 5
Siento que el impacto al medio ambiente al producir algún producto me da placer. 1 2 3 4 5
172

Appendices
Valoración BENEFICIOS de McDonald. Siendo (1) la valoración más baja y (5) la
valoración más alta.
La naturalidad del producto me ayuda quitarme el hambre. 1 2 3 4 5
Siento que el sabor me ayuda a quitarme el hambre. 1 2 3 4 5
El precio es adecuado para la necesidad de comer que tengo. 1 2 3 4 5
La seguridad e inocuidad del alimento me ayuda a satisfacer mi necesidad de
comer.
1 2 3 4 5
La comodidad de consumo y de preparación es útil para mí necesidad de comer. 1 2 3 4 5
La nutrición es útil a lo que necesito en un momento determinado. 1 2 3 4 5
Siento que la tradición es útil y necesaria. 1 2 3 4 5
El origen de los productos de la hamburguesa los creo útiles y elementales al
consumir el producto.
1 2 3 4 5
Al consumir favoreciendo al comercio justo es útil y necesario. 1 2 3 4 5
El aspecto y presentación del producto es útil y necesaria.
1 2 3 4 5
Siento que el impacto al medio ambiente que se tiene al producir el alimento es
útil y necesario.
1 2 3 4 5
En el apartado siguiente, por favor indica cuan tan fuerte estás de acuerdo o
desacuerdo con las siguientes afirmaciones de tu primera elección de fast food de
acuerdo a su producto principal. Evalúa cada ítem usando una escala de 5 puntos
donde: 1=Extremadamente desacuerdo, 2=Ligeramente desacuerdo, 3=neutral,
4=Ligeramente de acuerdo, y 5=Extremadamente de acuerdo.
173

Doctoral Thesis
Héctor Hugo Pérez Villarreal
Actitud a través del consumo de alimentos
1. Al comer la hamburguesa es placentero. (1) (2) (3) (4) (5)
2. Me gustaría divertirme comiendo la hamburguesa. (1) (2) (3) (4) (5)
3. Si como la hamburguesa sería satisfactorio para mí. (1) (2) (3) (4) (5)
4. Si como una hamburguesa es por el buen sabor que tiene. (1) (2) (3) (4) (5)
Actitud a través de la marca McDonald´s.
1. Me gusta la marca. (1) (2) (3) (4) (5)
2. Admiro a la marca. (1) (2) (3) (4) (5)
3. La marca encaja en mi vida. (1) (2) (3) (4) (5)
4. Me da vergüenza que me vean con la marca. (1) (2) (3) (4) (5)
5. Evito estar con la marca. (1) (2) (3) (4) (5)
Intención de compra en McDonald´s.
1. Es probable que compre productos de McDonald´s. (1) (2) (3) (4) (5)
2. Consideraría comprar el producto de McDonald´s si necesito un producto de este
tipo. (1) (2) (3) (4) (5)
3. Es posible comprar algún producto de McDonald´s. (1) (2) (3) (4) (5)
4. Compraría en McDonald´s la próxima vez. (1) (2) (3) (4) (5)
5. La probabilidad de que considere comprar en McDonald´s es alta. (1) (2) (3) (4)
(5)
174
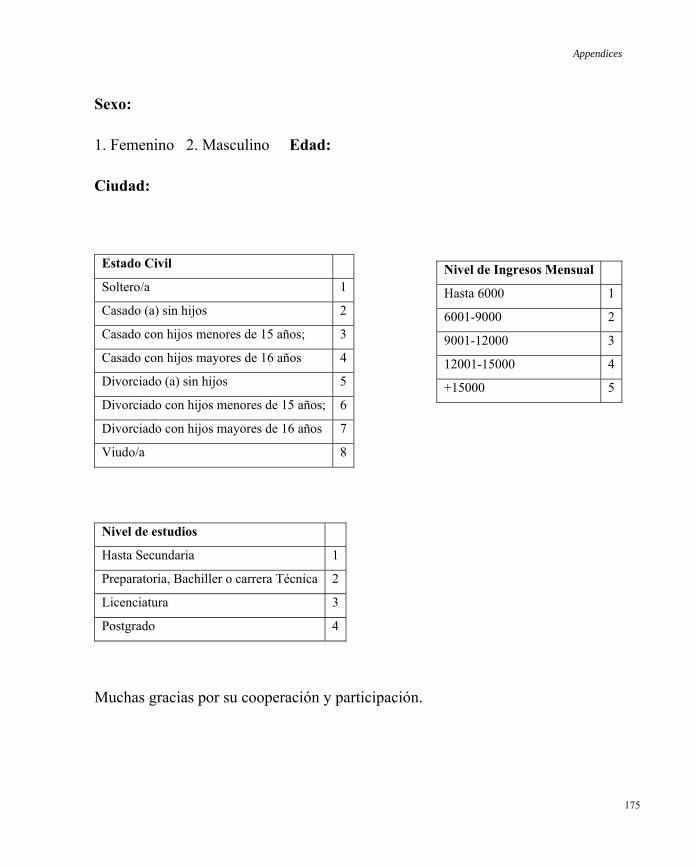
Appendices
Sexo:
1. Femenino 2. Masculino Edad:
Ciudad:
Muchas gracias por su cooperación y participación.
Estado Civil
Soltero/a 1
Casado (a) sin hijos 2
Casado con hijos menores de 15 años; 3
Casado con hijos mayores de 16 años 4
Divorciado (a) sin hijos 5
Divorciado con hijos menores de 15 años; 6
Divorciado con hijos mayores de 16 años 7
Viudo/a 8
Nivel de Ingresos Mensual
Hasta 6000 1
6001-9000 2
9001-12000 3
12001-15000 4
+15000 5
Nivel de estudios
Hasta Secundaria 1
Preparatoria, Bachiller o carrera Técnica 2
Licenciatura 3
Postgrado 4
175


Appendices
Appendice 2. Survey B
Estimado Encuestado:
En esta encuesta pretendemos obtener su opinión respecto al consumo de comida
rápida. Este estudio es conducido por la Universidad de Castilla-La Mancha. Las
opiniones que usted nos proporcione serán clasificadas como confidenciales y serán
utilizadas solamente para propósitos de investigación académica.
En el apartado siguiente, por favor indica cuan tan importante son los siguientes
factores cuando acudes a comprar algún producto de Mcdonalds.
Valore LOS ATRIBUTOS QUE MÁS APRECIA DE LA COMIDA DE
MCDONALD. Siendo (1) la valoración más baja y (5) la valoración más alta.
Naturalidad (producto producido sin tecnologías modernas) 1 2 3 4 5
Sabor del producto 1 2 3 4 5
Precio 1 2 3 4 5
Seguridad (de que el alimento no causará ninguna enfermedad) 1 2 3 4 5
Conveniencia (facilidad con que el alimento es cocinado o consumido) 1 2 3 4 5
Nutrición (cantidad y tipo de grasas, proteínas, vitaminas, etc.) 1 2 3 4 5
Tradición (conservación de las pautas de consumo tradicionales) 1 2 3 4 5
Origen (donde se han producido las materias primas de los alimentos) 1 2 3 4 5
Justicia (el grado en el que todas las partes implicadas en la producción del
alimento salen igualmente beneficiadas)
1 2 3 4 5
Apariencia (grado en el que el alimento parece atractivo, presentación) 1 2 3 4 5
Impacto medioambiental (efecto de la producción del alimento en el medio
ambiente)
1 2 3 4 5
177
Doctoral Thesis
Héctor Hugo Pérez Villarreal
En el siguiente apartado selecciona con una “X” la línea según la intensidad de cada
factor según corresponda.
-Si puedo ir a comer una hamburguesa en McDonald´s en el próximo mes, me
sentiría…
1. Emocionado
Nada __ __ __ __ __ __ __ Demasiado
2. Relajado
Nada __ __ __ __ __ __ __ Demasiado
3. Feliz
Nada __ __ __ __ __ __ __ Demasiado
4. Alegre
Nada __ __ __ __ __ __ __ Demasiado
5. Satisfecho
Nada __ __ __ __ __ __ __ Demasiado
6. Orgulloso
Nada __ __ __ __ __ __ __ Demasiado
178

Appendices
7. Seguro de sí mismo
Nada __ __ __ __ __ __ __ Demasiado
8. Aliviado
Nada __ __ __ __ __ __ __ Demasiado
9. Contento
Nada __ __ __ __ __ __ __ Demasiado
-Si NO puedo ir a comer una hamburguesa en McDonald´s en el próximo mes, me
sentiría…
10. Enfadado
Nada __ __ __ __ __ __ __ Demasiado
11. Frustrado
Nada __ __ __ __ __ __ __ Demasiado
12. Culpable
Nada __ __ __ __ __ __ __ Demasiado
13. Avergonzado
Nada __ __ __ __ __ __ __ Demasiado
179

Doctoral Thesis
Héctor Hugo Pérez Villarreal
14. Triste
Nada __ __ __ __ __ __ __ Demasiado
15. Deprimido
Nada __ __ __ __ __ __ __ Demasiado
16. Aburrido
Nada __ __ __ __ __ __ __ Demasiado
17. Inconfortable
Nada __ __ __ __ __ __ __ Demasiado
18. Ansioso
Nada __ __ __ __ __ __ __ Demasiado
19. Agitado
Nada __ __ __ __ __ __ __ Demasiado
20. Nervioso
Nada __ __ __ __ __ __ __ Demasiado
180

Appendices
En el apartado siguiente, por favor indica cuan tan fuerte estás de acuerdo o
desacuerdo con las siguientes afirmaciones de tu primera elección de fast food de
acuerdo a su producto principal. Evalúa cada ítem usando una escala de 5 puntos
donde: 1=Extremadamente desacuerdo, 2=Ligeramente desacuerdo, 3=neutral,
4=Ligeramente de acuerdo, y 5=Extremadamente de acuerdo.
Actitud a través del consumo de alimentos
5. Al comer la hamburguesa es placentero. (1) (2) (3) (4) (5)
6. Me gustaría divertirme comiendo la hamburguesa. (1) (2) (3) (4) (5)
7. Si como la hamburguesa sería satisfactorio para mí. (1) (2) (3) (4) (5)
8. Si como una hamburguesa es por el buen sabor que tiene. (1) (2) (3) (4) (5)
Actitud a través de la marca McDonald´s.
6. Me gusta la marca. (1) (2) (3) (4) (5)
7. Admiro a la marca. (1) (2) (3) (4) (5)
8. La marca encaja en mi vida. (1) (2) (3) (4) (5)
9. Me da vergüenza que me vean con la marca. (1) (2) (3) (4) (5)
10. Evito estar con la marca. (1) (2) (3) (4) (5)
Intención de compra en McDonald´s.
6. Es probable que compre productos de McDonald´s. (1) (2) (3) (4) (5)
7. Consideraría comprar el producto de McDonald´s si necesito un producto
de este tipo. (1) (2) (3) (4) (5)
8. Es posible comprar algún producto de McDonald´s. (1) (2) (3) (4) (5)
181

Doctoral Thesis
Héctor Hugo Pérez Villarreal
9. Compraría en McDonald´s la próxima vez. (1) (2) (3) (4) (5)
10. La probabilidad de que considere comprar en McDonald´s es alta. (1) (2)
(3) (4) (5)
Muchas gracias por su cooperación y participación
182

Identifying research topics in marketing sciencealong the past decade: a content analysis
Igor Barahona1 • Darıa Micaela Hernandez2 • Hector Hugo Perez-Villarreal3 •
Marıa del Pilar Martınez-Ruız4
Received: 20 January 2018 / Published online: 27 July 2018� Akademiai Kiado, Budapest, Hungary 2018
AbstractIn recent years, how marketing science is conceptualized has changed, as have the methods
through which data are investigated. This reconceptualization is making a significant
impact on the most important topics of this discipline. Here, a novel approach is used to
analyse a collection of 1169 abstracts from articles published in the Journal of Marketing
Research and the Journal of Marketing from 2005 to 2014. We apply statistical methods to
answer the following questions: How is vocabulary commonly used in marketing science?
What are the most relevant topics of these journals? Which articles are the most influ-
ential? What words do authors prefer? Is the consumer among the primary topics in
marketing research? A set of easy-to-read visual representations are provided to answer
these questions. We highlight two main findings: (i) consumers and customers are the main
topics of these marketing research journals, which emphasizes the growing interest in
consumers and consumer behaviour as the core of both brick-and-mortar and online
businesses; and (ii) in contrast to previous periods, product has become an essential
concept, perhaps due to the emergence of new product considerations and new and
enhanced interrelations.
Keywords Marketing � Content analysis � Keywords analysis � Multivariate statistics
Introduction
Considering that marketing science is constantly evolving, exploring feasible changes and
trends that might occur in the future is of strategic importance. Technology-enabled
marketing research comprises pertinent quantitative methods that allow for the retrieval of
& Igor [email protected]
1 Instituto de Matematicas, Universidad Nacional Autonoma de Mexico, Catedras CONACYT, Av.Universidad s/n. Col. Lomas Chamilpa Codigo, 62210 Cuernavaca, Morelos, Mexico
2 Universitat Politecnica de Catalunya - BarcelonaTech, Barcelona, Spain
3 Universidad Popular Autonoma del Estado de Puebla, Puebla, Mexico
4 Universidad de Castilla - La Mancha, Ciudad Real, Spain
123
Scientometrics (2018) 117:293–312https://doi.org/10.1007/s11192-018-2851-2(0123456789().,-volV)(0123456789().,-volV)
183
Appendice 3.Publications

coherent sequential information from massive datasets in a rapid and accurate manner
(Wang et al. 2014). In this sense, it is also relevant to investigate the triggers that create
breakthroughs in the evolution of this discipline (Kumar 2015). Within marketing research,
a key idea is investigating differences among topics, an idea that has been of interest to the
most prestigious marketing journals in the last decade. These kinds of studies typically use
content analysis and text mining. In a study by Huber et al. (2014) that was published in a
special 50th anniversary issue of the Journal of Marketing Research (JMR), the authors
clustered main topics according to each editor’s tenure. Later, the topics preferred by each
editor were identified by calculating a correspondence analysis (CA). Similarly, Kolbe and
Burnett (1991) reviewed 128 studies that used different kinds of content analysis as their
primary method. Their findings suggested coefficients of reliability for content-analysis
methods. In Morris (1994), the author performed a comparison between computerized and
human outputs, and his results showed that computerized content-analysis tends to be more
reliable and stable.
If these methodologies are applied to conducting a literature review, a common factor
arises: All of these methods are capable of disclosing topics and key concepts on which
researchers are focusing. Additionally, the relevance of these types of studies is enhanced
if they are drawn from the most prestigious marketing science journals, namely the Journal
of Marketing (JM) and the Journal of Marketing Research (JMR). We also consider three
important academic indexes: Scopus, Thomson-Reuters or Web of Science (WoS), and ISI.
Scopus has more indexed publications than ISI (Leydesdorff et al. 2010). However, ISI is
considered more prestigious in the social sciences. According to SCImago (2017), the JM
is the top journal in the marketing industry; the JMR is third. As pioneering publications,
these journals represent the trajectory of the discipline. Currently, they are the official
media of the American Marketing Association (AMA).
In addition to being official media for the AMA, these journals are focused on
demonstrating new techniques for tackling marketing challenges, and thus can be con-
sidered a strong link between theory and practice. According to Thomson-Reuters indexes,
in 2016 the JM had an impact factor of 5.318 and the JMR had a 3.654 impact factor
(Thomson Reuters 2016a, b). A complementary criterion for evaluating these journals is
their impact factor performance during the last decade (2005–2014). Both publications
should be included on the Journal Citations Reports (JCR) for the aforementioned period,
as shown in the following table.
Considering the information presented Table 1, it is clear that in the marketing area the
JM has been consistently strong over time. On the other hand, although the JMR did not
achieve the highest impact factors for 2013–2014, it earned higher scores from 2007 to
2014. Their respective impact factor scores were considered as a criterion for selecting
these two journals for the present study.
Furthermore, the JM, which has a long tradition in marketing (we highlight that the first
issue of this journal was published in 1936) and has some of the greatest scientific rele-
vance, recently published a similar study. In this work, Kumar (2015) discussed the
evolution of marketing science by investigating its ‘triggers.’ The author also proposes
future lines of research and predominant metaphors in the field. Using Kerin (1996) cat-
egorization as a starting point, a new perspective on marketing science is drawn. By
investigating how the topics published in the JMR have evolved as well as by identifying
their corresponding triggers and the scope of the covered topics, the contributing factors
are discussed. A trigger is the influence of academics who introduce new knowledge in
response to practitioners’ concerns. These factors influence the way marketing science will
be shaped in the future.
123
294 Scientometrics (2018) 117:293–312
184

Given this framework for marketing science and bibliometric studies over the last two
decades, the general objective of this paper is to investigate the two most important
journals in the marketing area: the JM and the JMR. This paper is structured in five
sections. First, a literature review, which discusses applications of the techniques proposed
herein, is provided. Then, the methodology is introduced in section three. Section four
contains the obtained results. Discussion and limitations of this research are presented on
the last section.
Literature review
The historic evolution of marketing science between 1936 and 1945 was accurately drawn
by Kerin (1996), who proposed the prominent topic ‘illuminating marketing principles and
concepts’ as a starting point, as well as the metaphor ‘marketing as applied economics,’
and its triggers ‘understanding of marketing principles through case studies,’ ‘need to
comprehend government legislation and trade regulations,’ and ‘marketing research topics
and implications for marketing practice.’ For the most recent period, 2013 and onward, the
most prominent topic is ‘marketing at the core and influence of new media.’ Similarly, the
related metaphor for this period is ‘marketing as an integral part of the organization,’ and
the triggers are ‘changes in media usage patterns,’ ‘focus on marketing efficiency and
effectiveness,’ and ‘value generated by engaging stakeholders of the firm.’ Moreover,
Huber et al.’s (2014) study ‘A topical history of the JMR’ also warrants attention. The way
topics and contents evolved during a 50-year period (1964–2012) is discussed. Huber et al.
(2014) also identify how this journal gradually increased its emphasis on marketing
research methods and advertising, and also expanded its coverage to other substantive
Table 1 Impact factor JCR marketing category
Journal 2005 2006 2007 2008 2009 2010 2011 2012 2013 2014
Journal of Marketing 4.132 4.831 3.75 3.598 3.779 3.77 5.472 3.368 3.819 3.938
Journal of Supply ChainManagement
0 0 0 0 0 5.853 2.65 3.32 3.717 3.857
Journal of MarketingResearch
2.611 2.389 1.739 2.574 3.099 2.8 2.517 2.254 2.66 2.256
Marketing Science 3.788 3.977 3.964 3.309 2.194 1.724 2.36 2.201 2.208 1.86
Journal of ConsumerResearch
2.161 2.043 1.738 1.592 3.021 2.59 3.101 3.542 2.783 3.125
Journal of the Academyof Marketing Science
1.485 1.463 1.18 1.289 1.578 3.269 2.671 2.57 3.41 3.818
Journal of PublicAdministrationResearch and Theory
1.451 1.655 1.982 1.509 1.776 2.086 2.176 1.951 2.875 2.833
Academy ofManagementPerspectives
0 0 0.594 1.118 1.405 2.47 3.75 3.174 2.826 3.354
International Journal ofResearch in Marketing
1.222 1.28 1.071 1.611 1.873 1.365 1.662 1.781 1.71 1.575
Journal of Retailing 0.894 1.196 2.054 4.095 4.567 2.257 2.75 1.152 1.193 1.754
Source: Own elaboration with 2016 Journal Citation Reports� (Thomson Reuters 2016a, b)
123
Scientometrics (2018) 117:293–312 295
185

topics, such as consumer behaviour and social networks. Based on this analysis, it can be
inferred that the editorial style of the journal moved from ‘evolutionary’ to ‘revolutionary.’
The study concluded that during the investigated period, the most common topic based on
the number of published articles was ‘consumer behaviour.’
Since 1990, the emergence of more powerful computers prompted the proliferation of
two of the most important methods for retrieval data: text mining (TM) and content
analysis (CAN). According to Stavrianou et al. (2007), TM focuses on analysing textual
data ‘so that, new previously unknown knowledge is discovered.’ By comparison, CAN
attempts to compress large volumes of words and texts into fewer categories by a given set
of coding rules. TM and CAN both aim to extract common themes and threads by counting
words. Although both can use computer algorithms, TM has the capacity to process natural
languages. Meanwhile, CAN is a systemic and replicable technique, which makes it
possible to synthesize a large number of words into smaller sets of categories (Stemler
2001). For instance, Stemler et al. (2011) conducted a content analysis of school mission
statements to identify their primary stated reasons for existence, detect shifts in public
opinion with respect to the passing of time and recognize those schools that introduce key
concepts. Weismayer and Pezenka (2017) investigated keywords in articles published by
International Marketing Review (IMR) from 1988 to 2016 and ENTER conference pro-
ceedings from 2005 to 2016. Their goal was to identify relevant topics in different research
areas and predict trends on published articles. Weismayer and Pezenka (2017) suggested
that CAN is the most valid way to determine editor/reviewer predilections. Fang et al.
(2017) conducted a bibliometric study with a five-step methodology using 105 published
articles related to electronic commerce (e-commerce). The study provided evidence of the
suitability of methods such as TM and CAN for performing literature reviews and bib-
liometric studies. Nel et al. (2011) conducted a content analysis of 407 papers published by
the Journal of Services Marketing during 1998–2008 and showed trends in research topics.
Similarly, Glaser et al. (2017) and Munoz-Leiva et al. (2012) found that the number of
bibliometric studies, which apply either TM or CAN, increased.
Methodology
A five-step methodology was implemented to address our research objectives. First, how
data were collected is described, followed by an explanation of the properties of the
dataset. The third step introduces the statistical methods, and details of how the charac-
teristic words are identified is provided in step four. The software is presented in the final
step (see Fig. 1).
Data collection
Over the years, marketing science has changed in terms of its focus, emphasis, and pri-
orities. In this regard, the JMR and the JM have been forerunners introducing these
changes, thus garnering the attention of academics, businesspeople, and practitioners. A
collection of 1169 abstracts, which cover the period from 2005 to 2014, were obtained
from the websites of JMR and JM. As additional measures of standardization, all abstracts
included the title, name of the first author, country, university, and year of publication.
Figure 2 is a classification of the documents based on country. Similarly, Fig. 3 classifies
the same group of abstracts according to the year of publication.
123
296 Scientometrics (2018) 117:293–312
186

As shown in Fig. 2, about 70% of the articles published between 2005 and 2014 were
submitted by U.S. authors. In second place, the Netherlands accounted for 6.5% of the
publications; Canada was in third place with 4.4% of the articles published. Researchers
from these three countries represent 81% of the all papers published by both journals. The
remaining 19% is distributed among 26 different countries.
Fig. 1 Five-step methodologyapplied to this research
821
76 52 50 22 19 19 16 14 13 11 10 8 7 5 4 3 3 2 2 2 2 2 1 1 1 1 1 1
Fig. 2 Published articles in JMR and JM by country, from 2005 to 2014
105 102 108 110134 140
156
12099
143
2005 2006 2007 2008 2009 2010 2011 2012 2013 2014
Fig. 3 Published articles in JMR and JM by year, from 2005 to 2014
123
Scientometrics (2018) 117:293–312 297
187

With respect to the year of publication, the highest number of articles (n = 156) was
published in 2011. In contrast, 2013 was the year with the lowest number, with 99 pub-
lished articles. In short, between 2005 and 2014, both journals published an average of 116
articles per year, with a standard deviation of 28.1. In Tables 2 and 3 information related
with published articles by JM and JMR is provided in a more detailed way.
Properties of the dataset
The body under analysis includes 1169 documents and 120,340 terms. On average, each
abstract contains 103 terms. Regarding the total number of words, the total text analysed
has 185,437 words, which is equal to 158 words for each abstract. This last measure is
relevant because it documents the usual length of abstracts, which is used by researchers
who publish in these journals.
Table 4 shows the percentage of unique terms. This number refers to words that appear
at least one time in the text regardless of their frequency (a catalogue of words). The total
number of words is obtained by counting all in the document. While the whole dataset
contains 7.4% unique terms, the mean per abstract is 70.4%. The low percentage of unique
Table 2 JMR articles by Issue and year
Year Issues Editor (tenure)
2005 42 (1): 13 articles, 42 (2): 14 articles,42 (3): 15 articles, 42 (4): 16 articles
Dick R. Wittink (2003–2005)Russell S. Winer (2005–2006)
2006 43 (1): 13 articles, 43 (2): 15 articles,43 (3): 17 articles, 43 (4): 15 articles
Russell S. Winer (2005–2006)Joel Huber (2006–2009)
2007 44 (1): 17 articles, 44 (2): 14 articles,44 (3): 14 articles, 44 (4): 13 articles
Joel Huber(2006–2009)
2008 45 (1): 9 articles, 45 (2): 9 articles,45 (3): 10 articles, 45 (4): 9 articles,45 (5): 9 articles, 45 (6): 10 articles
Joel Huber(2006–2009)
2009 46 (1): 11 articles, 46 (2): 11 articles,46 (3): 10 articles, 46 (4): 11 articles,46 (5): 11 articles, 46 (6): 11 articles
Joel Huber (2006–2009)Tulim Erden (2009–2012)
2010 47 (1): 16 articles, 47 (2): 15 articles,47 (3): 15 articles, 47 (4): 15 articles,47 (5): 15 articles, 47 (6): 15 articles
Tulim Erden (2009–2012)
2011 48 (1): 15 articles, 48 (2): 15 articles,48 (3): 15 articles, 48 (4): 11 articles,48 (5): 10 articles, 48 (Supplement 1): 15 articles48 (6): 11 articles
Tulim Erden (2009–2012)
2012 49 (1): 10 articles, 49 (2): 11 articles,49 (3): 11 articles, 49 (4): 11 articles,49 (5): 11 articles, 49 (6): 18 articles
Tulim Erden (2009–2012)Robert Meyer (2012–2016)
2013 50 (1): 10 articles, 50 (2): 9 articles,50 (3): 9 articles, 50 (4): 9 articles,50 (5): 7 articles, 50 (6): 7 articles
Robert Meyer (2012–2016)
2014 51 (1): 21 articles, 51 (2): 8 articles,51 (3): 8 articles, 51 (4): 11 articles,51 (5): 7 articles
Robert Meyer (2012–2016)
Source: Own elaboration
123
298 Scientometrics (2018) 117:293–312
188

terms is a measure of the vocabulary consistency. The percentage is inversely related to the
uniformity of the vocabulary of a given document. With this regard, Becue-Bertaut (2014)
suggested that percentages closer to 1.0 indicate a high diversity of vocabulary. In this
case, it can be inferred that the whole dataset is uniform in terms of vocabulary use. This
makes sense, given that all the abstracts were published in journals of the same field, and
therefore have similar features.
Table 3 JM articles by Issue and year
Year Issues Editor (tenure)
2005 69 (1): 9 articles, 69 (2): 9 articles69 (3): 10 articles, 69 (Special Section): 11 articles69 (4): 8 articles
Ruth N. Bolton (2002–2005)Roland T. Rust (2005–2008)
2006 70 (1): 10 articles, 70 (2): 10 articles70 (3): 10 articles, 70 (4): 12 articles
Roland T. Rust (2005–2008)
2007 71 (1): 13 articles, 71 (2): 13 articles71 (3): 12 articles, 71 (4): 12 articles
Roland T. Rust (2005–2008)
2008 72 (1): 9 articles, 72 (2): 9 articles72 (3): 9 articles, 72 (4): 9 articles72 (5): 9 articles, 72 (6): 9 articles
Roland T. Rust (2005–2008)Ajay K. Kohli (2008–2011)
2009 73 (Special Section): 9 articles73 (1): 9 articles 73 (2): 9 articles73 (3): 8 articles 73 (4): 8 articles73 (5): 8 articles 73 (6): 18 articles
Ajay K. Kohli (2008–2011)
2010 74 (1): 8 articles, 74 (2): 9 articles74 (3): 8 articles, 74 (4): 8 articles74 (5): 8 articles, 74 (6): 8 articles
Ajay K. Kohli (2008–2011)
2011 75 (1): 8 articles, 75 (2): 8 articles75 (3): 8 articles, 75 (4): 15 articles75 (5): 8 articles, 75 (Supplement 1): 9 articles75 (6): 8 articles
Ajay K. Kohli (2008–2011)
2012 76 (1): 8 articles, 76 (2): 8 articles76 (3): 8 articles, 76 (4): 8 articles76 (5): 8 articles, 76 (6): 8 articles
Gary L. Frazier (2011–2014)
2013 77 (1): 8 articles, 77 (2): 8 articles77 (3): 8 articles, 77 (4): 8 articles77 (5): 8 articles, 77 (6): 8 articles
Gary L. Frazier (2011–2014)
2014 78 (1): 8 articles, 78 (2): 8 articles78 (3): 8 articles, 78 (4): 8 articles78 (5): 8 articles
Gary L. Frazier (2011–2014)
Source: Own elaboration
Table 4 Descriptive statistics ofthe dataset under analysis
Descriptive statistics Abstract mean Total
Number of terms 103.0 120,340.0
Number of unique terms 71.0 8874.0
Percent of unique terms 70.4% 7.4%
Number of words 158.6 185,437.0
Average word length 5.9 5.9
123
Scientometrics (2018) 117:293–312 299
189

The two most common techniques used for information retrieval are lemmatization and
stemming. Bartol and Stopar (2015) described the first as the methods for removing
inflectional endings on words; Meyer et al. (2008) explained stemming as the algorithms
used for removing word suffixes while preserving their radical. One advantage of
lemmatization is that it first uses glossaries to ensure words are properly grouped. A
limitation observed in our work is that stemming was carried out manually, and thus is
extremely time consuming. Therefore, we suggest the use of glossaries (based on the
lemmatization approach) for future research to reduce time spent on repetitive manual
tasks.
Prior to calculating the basic descriptive statistics, the dataset was prepared. Preposi-
tions, conjunctions, personal pronouns, articles, and demonstratives were removed.
Although the stop-words proposed in the R package ‘tm’ (Feinerer 2017) were used as a
reference, the stemming procedures were implemented manually. The central idea is to
reduce text’s complexity without severe loss or distortion of information. The algorithm
proposed by Porter (1997), which has been proven to provide accurate results for stemming
texts in English in a variety of disciplines, was taken as guideline. Using this approach,
corresponding equivalences were obtained; that is, words with the same meaning and
words that appeared in singular and plural were grouped as one word. For example, the
words ‘accountability,’ ‘accountable,’ and ‘accounted’ should be treated as ‘account’; the
words ‘branding’ and ‘brands’ should be treated as ‘brand.’ With the purpose of creating
graphical representations, minimum thresholds were imposed. Only words with frequen-
cies equal to 20 and higher were retained. Similarly, abstracts using a given word 15 times
or more, were also kept. As a result, 994 of the 8874 different words and 80,123 of the
185,437 occurrences were kept. The yielded document text matrix (dtm) is of order
994 9 1164. The rows are related to the abstracts and the columns are related to the words.
In addition, there are three categorical variables in the dataset that relate to year of
publication, author name, and institution. These categorical variables were incorporated for
the last part of the analysis.
Multivariate methods (CA and MFACT)
According to Benzecri (1979), Murtagh (2005), Barahona (2016) and Becue-Bertaut
(2014), CA is widely used in the field of text mining. The most remarkable feature of CA in
the context of a literature review is its capacity for plotting abstracts and words in such a
way that hidden relationships are uncovered. For example, similarities and differences
among abstracts, in terms of the vocabulary used, are identified. Below is a list of outputs
obtained through the CA.
• Identifying similarities between abstracts, given their verbal contents.
• Detecting similar words, based on their distribution.
• Making associations about similar words, given the context in which the words were
used.
• Providing visual representations of abstracts and words.
Bansard et al. (2006) stated that words frequently used in the same abstract are all
together building a topic and they are considered to belong to the same metakey. It is
important to note that one word can belong to one or more metakeys (indeed, this is very
frequent). This scenario indicates that the same word can be used in several contexts, each
of which might have a different meaning. For instance, the word ‘environment’ may be
123
300 Scientometrics (2018) 117:293–312
190

related to the quality levels of air or water, but in another context, ‘environment’ could
mean conditions and settings in the workplace. Finally, CA is capable of quantitatively
associating a given metadoc with a metakey that together characterize the same axis. In this
case, it is inferred that abstracts belonging to a same metadoc are using words, which in
turn are associated on the same metakey. If this lexical table is complemented with the
categorical year of publication, then the analysis changes into a Multiple Factor Analysis
of Contingency Tables (MFACT). A detailed explanation of metakey and metadoc con-
cepts, as well as the results obtained through both methodologies (CA and MFACT) and
their graphical representations, are provided in Sect. 4.2.
Types of results
The application of the correspondence analysis and its variants makes the inclusion of
categorical variables possible. This allows us to obtain two types of results, as follows:
• The first approach comprises results that are commonly obtained through CA: namely
eigenvalues, representations of row-abstracts and column-words, and distances
between abstracts based on both Euclidean and Chi-squared distances. While the
former is given by the squared sum of differences, the last includes a constant
adjustment that is calculated in terms of each column-row profile. The distributional
equivalence, which is a property of a traditional CA, allows for merging two or more
column-profiles that have the same relative values without affecting distance between
row-profiles.
• Second, an edited version of the original table is yielded by linking each row-abstract
with the year of publication. The result is a table of quantitative and categorical
variables. The MFACT is a suitable tool for dealing with mixed data tables (Kostov
et al. 2015). MFACT balances the groups’ effect (given by year of publication) on the
first dimension by dividing the columns-words profiles of each group by the first
eigenvalue. Then, the highest inertia of each group is standardized to 1. Interpretation
for the MFACT remains identical to the classical CA. Graphical representations based
on the MFACT allow us to compare typologies of each group in a reduced dimensional
space with the purpose of evaluating extent to which positions of row-abstracts are
similar from one group to another.
Characteristic words and abstracts
With the purpose of providing quantitative indicators of the most frequent terms in the
dataset, modelling a hypergeometric distribution (HD) is proposed. HD is a discrete
probability distribution, which defines the probability of achieving k successes in n at-
tempts, without replacement. Assuming N is a finite population that contains K successes,
the following notation is proposed:
– n::; The total number of words-occurrences in the whole dataset;
– n;j;, The number of words-occurrences in part j;
– ni::; The total count of the word i in the whole corpus;
– nij The count of the word i in part j.
The total frequency nij of word i in part j is contrasted with other sums. These sums are
obtained with all possible samples composed of nj occurrences randomly extracted from
123
Scientometrics (2018) 117:293–312 301
191
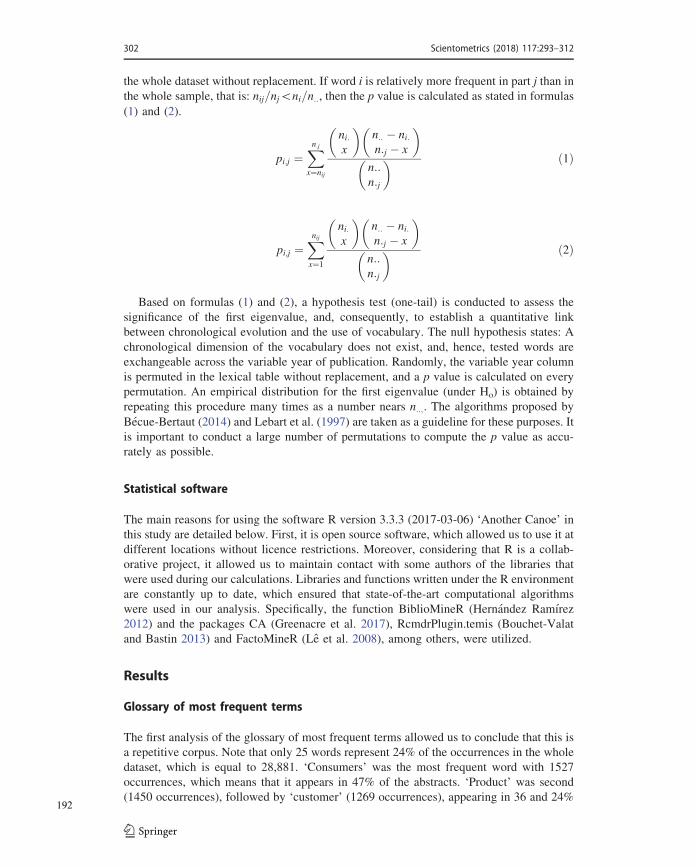
the whole dataset without replacement. If word i is relatively more frequent in part j than in
the whole sample, that is: nij=nj\ni=n::, then the p value is calculated as stated in formulas
(1) and (2).
pi;j ¼Xn:jx¼nij
ni:x
� �n:: � ni:n:j � x
� �
n::n:j
� � ð1Þ
pi;j ¼Xnijx¼1
ni:x
� �n:: � ni:n:j � x
� �
n::n:j
� � ð2Þ
Based on formulas (1) and (2), a hypothesis test (one-tail) is conducted to assess the
significance of the first eigenvalue, and, consequently, to establish a quantitative link
between chronological evolution and the use of vocabulary. The null hypothesis states: A
chronological dimension of the vocabulary does not exist, and, hence, tested words are
exchangeable across the variable year of publication. Randomly, the variable year column
is permuted in the lexical table without replacement, and a p value is calculated on every
permutation. An empirical distribution for the first eigenvalue (under Ho) is obtained by
repeating this procedure many times as a number nears n::;. The algorithms proposed by
Becue-Bertaut (2014) and Lebart et al. (1997) are taken as a guideline for these purposes. It
is important to conduct a large number of permutations to compute the p value as accu-
rately as possible.
Statistical software
The main reasons for using the software R version 3.3.3 (2017-03-06) ‘Another Canoe’ in
this study are detailed below. First, it is open source software, which allowed us to use it at
different locations without licence restrictions. Moreover, considering that R is a collab-
orative project, it allowed us to maintain contact with some authors of the libraries that
were used during our calculations. Libraries and functions written under the R environment
are constantly up to date, which ensured that state-of-the-art computational algorithms
were used in our analysis. Specifically, the function BiblioMineR (Hernandez Ramırez
2012) and the packages CA (Greenacre et al. 2017), RcmdrPlugin.temis (Bouchet-Valat
and Bastin 2013) and FactoMineR (Le et al. 2008), among others, were utilized.
Results
Glossary of most frequent terms
The first analysis of the glossary of most frequent terms allowed us to conclude that this is
a repetitive corpus. Note that only 25 words represent 24% of the occurrences in the whole
dataset, which is equal to 28,881. ‘Consumers’ was the most frequent word with 1527
occurrences, which means that it appears in 47% of the abstracts. ‘Product’ was second
(1450 occurrences), followed by ‘customer’ (1269 occurrences), appearing in 36 and 24%
123
302 Scientometrics (2018) 117:293–312
192

of the abstracts, respectively. These three terms with ‘effect’ (1239 occurrences), ‘brand’
(1160 occurrences), ‘marketing’ (1077 occurrences), and ‘firm’ (1019) shape the main
content of both journals. We found that nearly 28% of the abstracts include all of these
words together. This overall perspective allows us to take a first approach in identifying
what seems to be of interest to JMR and JM authors. Their efforts are directed toward
discussing effects on products, consumers, and brands through ‘study’ (880), ‘model’
(748), ‘market’ (691), ‘research’ (659), and ‘price’ (617).
These findings yield supporting evidence that consumer behaviour was one of the most
relevant topics during the investigated decade. The terms ‘consumers’ and ‘customer’ are
among the top ten recurrences for the whole dataset. Moreover, these results are similar to
those obtained by Huber, Kamakura, and Mela (2014), which highlighted how the JMR
gave increasing importance to the topic of consumer behaviour during the investigated
period. Moreover, conclusions obtained by Huber, Kamakura, and Mela (2014) in relation
to the term ‘product’ also drew our attention. Consistent with these results, they ranked
‘product’ at position nine of prevalence in abstracts for 1964–2012. It appears in second
place of the rankings in the current study (see Table 5). Considering this, it is inferred that
the concept of ‘product’ gained more attention in the last decade in contrast to previous
periods (1964–2001).
Table 5 List of the 25 most fre-quent terms
Word Glossary frequency No. documents
Consumer 1527 554
Product 1450 417
Customer 1269 284
Effect 1239 574
Brand 1160 228
Marketing 1077 442
Firm 1019 336
Study 880 518
Use 786 537
Model 748 360
Market 691 282
Research 659 462
Price 617 173
Data 577 394
Relationship 522 222
Value 509 203
Sale 495 169
Decision 456 236
Performance 455 193
Choice 440 183
Level 426 253
Show 398 334
Behaviour 386 222
Find 383 302
Source: Own elaboration
123
Scientometrics (2018) 117:293–312 303
193

Most relevant topics and its related abstracts
Correspondence analysis is a multivariate statistical technique that is applied to categorial
data and provides means for summarizing large datasets on a reduced dimensional space.
In this context, CA is applied to identify those ‘metakeys’ and ‘metadocs,’ which better
describe similarities among abstracts based on the words they use. It is important to clarify
that a metakey is related to a given word used in one or more abstracts, whereas a metadoc
is related to an abstract. In this way, two or more metadocs might be related in function to
the same metakeys. Researchers might identify the set of words (metakey ?/metakey-) that
most contribute to the inertia and lie on the positive/negative part of the axis. Simulta-
neously, the set of documents that most contribute to the inertia (metadoc ?/metadoc-) and
lie on its positive/negative part might also be identified.
For the purpose of creating intuitive visualizations, only those metakeys and metadocs
with strong presence on the principal axes were considered. Abstracts using a given word
15 times or more were kept. Words with frequencies equal to 20 and higher were also
retained. According Lebart et al. (1997), this improves the comprehension of associations
among words and abstracts. The first five components, obtained through the correspon-
dence analysis, were retained. From this group, the pair with the highest eigenvalues was
taken as axes of the charts provided below. While the eigenvalue for the first axis is equal
to 0.25, its value for the second axis is 0.21. These two axes are able to accurately describe
the emergence of the most relevant words of the investigated dataset, taking into account
that they also have the biggest eigenvalues. Note that previously mentioned rules apply
only to visual representations (Fig. 4). Additional criterion, which consisted of retaining
Fig. 4 Most contributory abstracts/words (CA)
123
304 Scientometrics (2018) 117:293–312
194

only those words and abstracts with a contribution three times higher than the mean
(average), was applied for elements listed in Table 6.
With regard to Fig. 4, note the positive part of the first axis, which is also called
(DIM1?), which notes a set of words (metakey?) that is closely related with a metadoc? .
The words ‘consumer,’ ‘choice,’ ‘price,’ ‘consumption,’ ‘preference,’ and ‘self’ are
highlighted in this area. We also identify the negative section of the first axis (D1M1-),
where the metakey- is located (consumer relationship). It is composed of the words
‘customer,’ ‘firm,’ ‘marketing,’ ‘relationship,’ ‘performance,’ ‘business,’ and ‘market.’ At
the same time, the mentioned words are closely related to the metadoc-, which is composed
of the articles ‘363,’ ‘715,’ ‘731,’ and others.
Similarly, metakey2 ? is distinguished by the topic ‘Developing strategies and pro-
grams for pricing.’ Note that it is located in the positive part of the second axis (D1M2?),
and it is composed of the words ‘price,’ ‘retailer,’ ‘store,’ ‘model,’ ‘search,’ and ‘pricing.’
Note that articles ‘92,’ ‘77,’ and ‘277’ compose metadoc2? . With respect to the negative
part of (D1M2-), ‘emotional marketing’ is identified as the most remarkable topic. The
articles that feature this topic are ‘118,’ ‘309,’ ‘1045,’ and ‘726.’
While the most contributing metakeys (words) are related to a given topic and also
introduced in Table 6, the way abstracts and words were aggregated in respect to the year
of publication is presented in Table 7. The criterion for selecting words and abstracts was
their contribution to the total inertia. In Table 6, those contributions higher than three times
the mean (average) of the total inertia were kept. In Table 7, elements equal or higher than
the mean of the total inertia are presented. In both cases, axes with the biggest eigenvalues
are used as references.
Chronological evolution
To investigate the chronological evolution of the vocabulary, the abstract-words matrix
was transformed into a mixed table by adding the variable year of publication as a cate-
gorical variable. Consequently, the CA turned out to be a MFACT. This makes it possible
to identify similarities and differences in vocabulary over time. Periods characterized by
specific terms and important variations in the use of the vocabulary were also identified. By
conducting this analysis, we can answer questions such as: Which groups of documents,
given a year of publication, are similar or different? Which periods are characterized by the
introduction of new vocabulary? How has vocabulary evolved over time?
The input for the MFACT consisted of a mixed table on which the categorical variable
year of publication is distributed on rows. Columns are reserved for words. In this form,
our matrix contains 10 rows (years) and 994 columns (words). The eigenvalues for the first
five components (obtained from the MFACT) are presented in Table 8. Note that the
eigenvalues are, in general, smaller than those obtained through the traditional corre-
spondence analysis. Typical structures on mixed tables are among the main causes of the
small eigenvalues. These properties were exhaustively studied by Kostov et al. (2015),
Greenacre et al. (2017) and Lebart et al. (1997) among others. While the eigenvalue for the
first component is 0.032, the value for the second is 0.026. The same rules previously
applied to the CA are repeated for the MFACT: retain five axes in the initial calculation
and select the two with the biggest eigenvalues. Finally, the projection of words with a
contribution of three times higher than the mean (average) was carried out. Therefore, it
ensured that the most representative words were visualized, either due to the biggest
eigenvalues on the axes or the high contribution of the chosen words.
123
Scientometrics (2018) 117:293–312 305
195

Table 6 Main topics
DIM TOPICS Metakeys
DIM1?
Consumer Choice ‘‘consumer’’ ‘‘choice’’ ‘‘price’’ ‘‘consumption’’‘‘preference’’ ‘‘self’’ ‘‘people’’ ‘‘option’’ ‘‘attribute’’‘‘food’’ ‘‘product’’ ‘‘hedonic’’ ‘‘brand’’ ‘‘evaluation’’‘‘goal’’ ‘‘extension’’ ‘‘experiment’’ ‘‘search’’ ‘‘health’’‘‘purchase’’ ‘‘less’’ ‘‘versus’’
DIM1-
Customer Relationship Management ‘‘customer’’ ‘‘firm’’ ‘‘marketing’’ ‘‘relationship’’‘‘performance’’ ‘‘business’’ ‘‘market’’ ‘‘satisfaction’’‘‘supplier’’ ‘‘value’’ ‘‘orientation’’ ‘‘employee’’ ‘‘return’’‘‘service’’ ‘‘stock’’ ‘‘capability’’ ‘‘financial’’‘‘shareholder’’ ‘‘management’’ ‘‘innovation’’ ‘‘ties’’‘‘organizational’’ ‘‘portfolio’’ ‘‘relational’’ ‘‘risk’’‘‘equity’’ ‘‘trust’’ ‘‘metric’’ ‘‘governance’’ ‘‘frontline’’‘‘salesperson’’ ‘‘development’’ ‘‘knowledge’’ ‘‘manager’’‘‘loyalty’’ ‘‘network’’ ‘‘strategic’’ ‘‘retention’’
DIM2?
Developing strategies and programsfor pricing
‘‘price’’ ‘‘retailer’’ ‘‘store’’ ‘‘model’’ ‘‘search’’ ‘‘pricing’’‘‘manufacturer’’ ‘‘demand’’ ‘‘data’’ ‘‘household’’‘‘advertising’’ ‘‘endogeneity’’ ‘‘category’’ ‘‘elasticity’’‘‘distribution’’ ‘‘retail’’ ‘‘method’’ ‘‘promotion’’‘‘elasticities’’ ‘‘channel’’ ‘‘private’’ ‘‘parameter’’‘‘heterogeneity’’ ‘‘estimates’’ ‘‘grocery’’ ‘‘market’’‘‘channels’’ ‘‘share’’ ‘‘unobserved’’ ‘‘sale’’ ‘‘estimation’’‘‘shopping’’ ‘‘estimate’’ ‘‘label’’ ‘‘competitive’’‘‘quantity’’ ‘‘optimal’’ ‘‘competition’’ ‘‘profit’’
DIM2-
Emotional Marketing ‘‘self’’ ‘‘emotion’’ ‘‘employee’’ ‘‘emotional’’ ‘‘evaluation’’‘‘goal’’ ‘‘message’’ ‘‘regulatory’’ ‘‘brand’’ ‘‘extension’’‘‘hedonic’’ ‘‘people’’ ‘‘fit’’ ‘‘experience’’ ‘‘corporate’’‘‘influence’’ ‘‘personality’’ ‘‘knowledge’’ ‘‘frontline’’‘‘utilitarian’’ ‘‘identity’’ ‘‘process’’ ‘‘positive’’‘‘participation’’ ‘‘attitude’’ ‘‘study’’ ‘‘consumption’’‘‘engagement’’ ‘‘role’’ ‘‘processing’’ ‘‘versus’’ ‘‘focus’’‘‘service’’ ‘‘negative’’
DIM3?
Design and management ofintegrated marketing channels
‘‘supplier’’ ‘‘price’’ ‘‘goal’’ ‘‘customer’’ ‘‘service’’‘‘relationship’’ ‘‘consumption’’ ‘‘pricing’’ ‘‘saving’’‘‘food’’ ‘‘trade’’ ‘‘decision’’ ‘‘employee’’ ‘‘people’’‘‘business’’ ‘‘buyer’’ ‘‘aversion’’ ‘‘option’’ ‘‘salesperson’’‘‘choice’’ ‘‘ties’’ ‘‘seller’’ ‘‘outcome’’ ‘‘reference’’‘‘retailer’’ ‘‘performance’’ ‘‘orientation’’ ‘‘hedonic’’‘‘manufacturer’’
DIM3-
Brand Equity ‘‘brand’’ ‘‘extension’’ ‘‘personality’’ ‘‘association’’‘‘advertising’’ ‘‘branding’’ ‘‘equity’’ ‘‘fit’’ ‘‘branded’’‘‘category’’ ‘‘success’’ ‘‘stock’’ ‘‘value’’ ‘‘metric’’‘‘return’’ ‘‘similarity’’ ‘‘risk’’ ‘‘measure’’ ‘‘image’’‘‘shareholder’’ ‘‘measures’’ ‘‘attitude’’
DIM4?
Design and management ofintegrated marketingcommunications
‘‘marketing’’ ‘‘advertising’’ ‘‘method’’ ‘‘media’’ ‘‘choice’’‘‘design’’ ‘‘model’’ ‘‘stock’’ ‘‘search’’ ‘‘review’’‘‘conjoint’’ ‘‘attribute’’ ‘‘recommendations’’ ‘‘approach’’‘‘traditional’’ ‘‘complexity’’ ‘‘network’’ ‘‘investor’’‘‘rating’’ ‘‘web’’ ‘‘advertisement’’ ‘‘site’’ ‘‘emotion’’‘‘option’’ ‘‘heterogeneity’’ ‘‘metric’’ ‘‘firm’’‘‘respondents’’ ‘‘content’’ ‘‘response’’ ‘‘activity’’‘‘preference’’ ‘‘decision’’ ‘‘researcher’’ ‘‘social’’
123
306 Scientometrics (2018) 117:293–312
196

Table 6 continued
DIM TOPICS Metakeys
DIM4-
Marketing Channels ‘‘price’’ ‘‘brand’’ ‘‘extension’’ ‘‘retailer’’ ‘‘store’’‘‘manufacturer’’ ‘‘private’’ ‘‘supplier’’ ‘‘label’’ ‘‘image’’‘‘category’’ ‘‘retail’’ ‘‘pricing’’ ‘‘employee’’ ‘‘loyalty’’‘‘labels’’ ‘‘shopping’’ ‘‘promotion’’ ‘‘reference’’‘‘grocery’’ ‘‘share’’ ‘‘personality’’ ‘‘national’’ ‘‘success’’‘‘frontline’’ ‘‘service’’ ‘‘identification’’ ‘‘discounts’’‘‘business’’ ‘‘evaluation’’ ‘‘buying’’
DIM5?
Value Networks ‘‘supplier’’ ‘‘extension’’ ‘‘governance’’ ‘‘method’’ ‘‘trust’’‘‘model’’ ‘‘relationship’’ ‘‘conjoint’’ ‘‘knowledge’’‘‘attribute’’ ‘‘partner’’ ‘‘design’’ ‘‘ties’’ ‘‘choice’’‘‘network’’ ‘‘measurement’’ ‘‘parameter’’ ‘‘approach’’‘‘brand’’ ‘‘performance’’ ‘‘selection’’ ‘‘proposed’’‘‘relational’’ ‘‘decision’’ ‘‘innovation’’ ‘‘organizational’’‘‘predictive’’ ‘‘unobserved’’ ‘‘incentive’’ ‘‘preference’’‘‘approaches’’ ‘‘validity’’ ‘‘distribution’’
DIM5-
Marketing Metrics ‘‘stock’’ ‘‘advertising’’ ‘‘return’’ ‘‘emotion’’ ‘‘risk’’‘‘investor’’ ‘‘price’’ ‘‘spending’’ ‘‘shareholder’’‘‘satisfaction’’ ‘‘negative’’ ‘‘finance’’ ‘‘financial’’‘‘message’’ ‘‘impact’’ ‘‘review’’ ‘‘systematic’’ ‘‘food’’‘‘loss’’ ‘‘firm’’ ‘‘long’’ ‘‘promotion’’ ‘‘equity’’ ‘‘store’’‘‘term’’ ‘‘health’’ ‘‘value’’ ‘‘consumption’’ ‘‘cash’’‘‘positive’’ ‘‘abnormal’’ ‘‘metric’’ ‘‘short’’ ‘‘search’’‘‘emotional’’ ‘‘online’’ ‘‘expenditures’’ ‘‘net’’ ‘‘customer’’
Source: Own elaboration
Table 7 Distribution of abstracts/words
Aggregation of abstracts and words according to the categorical variable year
Years Abstracts Occurrences before Occurrences after Mean length Words before Words after
2005 105 12,251 6122 116.68 2507 881
2006 102 13,285 6675 130.25 2653 912
2007 108 15,577 7903 144.23 2849 929
2008 110 16,497 8402 149.97 2912 939
2009 134 19,516 9827 145.64 3207 957
2010 140 19,286 9415 138.75 3321 965
2011 156 21,729 10,558 139.29 3466 958
2012 120 17,381 8855 144.84 3069 947
2013 51 6734 3304 132.04 1818 752
2014 143 19,377 9596 135.50 3269 935
Overall 1169 161,633 80,657 138.27 8800 994
Source: Own elaboration
123
Scientometrics (2018) 117:293–312 307
197

How has the vocabulary evolved over time?
A type of big picture of how the vocabulary had evolved over the years is shown in Fig. 5.
There are three important periods where the vocabulary shifted: 2005–2006 in blue,
2007–2009 in grey, and 2010–2014 in green. For the horizontal axis, while words related to
‘customer satisfaction’ and ‘market model’ are displayed on the negative part of the axis,
words referring to ‘social networks’ and ‘mobile technologies’ are projected in the positive
area. With respect to the vertical axis, the positive area is characterized by the words
‘regulatory,’ ‘fit,’ and ‘retailer.’ On the negative part, the words ‘brand,’ ‘networks,’
‘demonstrate,’ and ‘stock’ are found.
In the first period, from 2005 to 2006, authors published in the journals were mainly
writing about regulatory issues, emotional shopping, and fitting models. During the second
period (2007–2009), authors focused their attention on the customer’s satisfaction, loyalty,
and trust. Topics such as market models, branding, firm returns, and stocks are charac-
teristic of this period. Finally, in the third period, which comprises 2010–2014, topics such
as social networks and contents, mobile technologies, online shoppers, reviews, and
demonstrations emerged.
Table 8 Eigenvalues for first fivecomponents
Measures Dim. 1 Dim. 2 Dim. 3 Dim. 4 Dim. 5
Eigenvalues 0.032 0.026 0.023 0.020 0.020
% Variance 18.23 14.34 12.70 11.46 11.00
Cumulative 18.23 32.57 45.27 56.72 67.72
-0.6 -0.4 -0.2 0.0 0.2 0.4 0.6
-0.2
0.0
0.2
Dim 1 (18.23%)
Dim
2 (1
4.34
%)
2005
2006
2007
2008
2009
2010
2011
20122013
2014
emotionalfit
manufacturers
models regulatory
retailershopping
competitive
customer
firm
market
model
satisfaction
trust
brand
loyalty returnsrisk stock
content
food
group
media
reveal
reviews
self
social
spendingdemonstrate
website
mobileratings
online
shoppers
networks
Fig. 5 Visual representation of years and words (MFACT)
123
308 Scientometrics (2018) 117:293–312
198

This draws our attention to the radical change in words that emerged during period
three, in contrast to the previous periods. It is clear that authors focused their attention on
contemporary issues, including the proliferation of online marketing and social networks.
Table 9 presents the characteristic words according to each analysed period. In the first
period (2005–2007), we identified words such as ‘fit,’ ‘manufacturer,’ ‘regulatory,’ and
‘model’ among others. The second period is characterized by the words ‘firm,’ ‘stock,’
‘loyalty,’ ‘efficiency,’ ‘competitive,’ ‘risk,’ and others. Finally, the third period gathered
words such as ‘media,’ ‘social,’ ‘network,’ ‘customer,’ and ‘mobile.’ These results are
consistent with the work proposed by Karvanen et al. (2014), who observed the growing
relevance of social media in contemporary marketing research.
Finally, in Fig. 6, the periods are shown again. Rather than highlight just those words
that characterize each period, each main topic is included in this visualization. For
instance, topics including regulatory issues, emotional aspects, and fit models shape the
first period. The second period features topics of consumer satisfaction and trust, firm risk,
and stock returns. The most recent period is made up of topics such as social media, food
reviews, food studies, online consumers, and mobile technologies. In this form, the
investigated period was accurately clustered into smaller ones by considering content
similarities of each abstract included in the analysis.
Discussion and limitations
In this research, a collection of 1169 abstracts from over the course of a decade was
investigated by proposing novel forms of applying classical statistical methods. All
abstracts correspond to articles that the most prestigious journals in the field have pub-
lished (JM and JMR). First, basic descriptive statistics of average words per abstract, the
percentage of unique terms, and average word length were provided. Thereafter, the most
frequent words were identified and allowed us to disclose the authors’ preferred vocabu-
lary. By conducting a correspondence analysis, the most influential abstracts were iden-
tified. Finally, a multifactor analysis of contingency tables was calculated to disclose how
the use of vocabulary has evolved. Three important periods that characterize how
vocabulary has evolved over time were disclosed.
This analysis gives evidence to the importance that authors have put on customer issues.
That is, the consumer was the center of marketing research during the investigated decade.
Similarly, the term ‘product’ comes next in importance. This is obvious, considering that
Table 9 Characteristic words by period
Period Characteristic words
2005–2006 Fit, manufacturer, regulatory, model, aversion, net, web, retailer, relationship, satisfaction,article, price, intention, author, emotional, structural, enhanced, shopping, involvement,relational, bias, parameter, reference, retailing
2007–2009 Firm, stock, loyalty, efficiency, competitive, risk, finance, customer, promotion, investments,market, chain, corporate, trust, manager, duration, valuation, revenue, shares, benefits,improvement, industry, impact, equity, scholars, interface, competitors, costs, marketing
2010–2014 Media, social, consumer, group, spending, rating, reveal, demonstrate, user, line, review,product, sale, food, content, online, advertising, network, employee, goal, position,campaign
123
Scientometrics (2018) 117:293–312 309
199
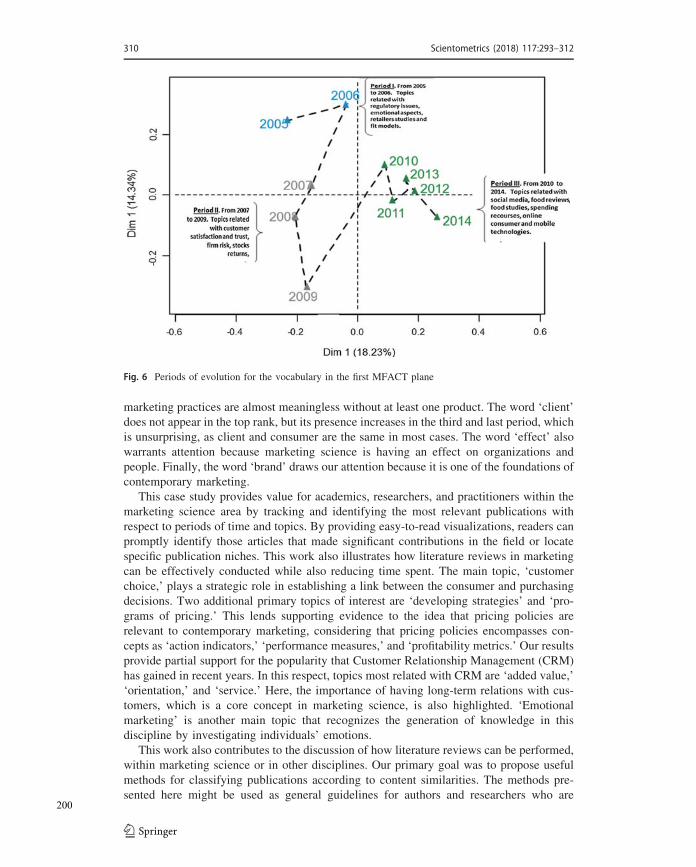
marketing practices are almost meaningless without at least one product. The word ‘client’
does not appear in the top rank, but its presence increases in the third and last period, which
is unsurprising, as client and consumer are the same in most cases. The word ‘effect’ also
warrants attention because marketing science is having an effect on organizations and
people. Finally, the word ‘brand’ draws our attention because it is one of the foundations of
contemporary marketing.
This case study provides value for academics, researchers, and practitioners within the
marketing science area by tracking and identifying the most relevant publications with
respect to periods of time and topics. By providing easy-to-read visualizations, readers can
promptly identify those articles that made significant contributions in the field or locate
specific publication niches. This work also illustrates how literature reviews in marketing
can be effectively conducted while also reducing time spent. The main topic, ‘customer
choice,’ plays a strategic role in establishing a link between the consumer and purchasing
decisions. Two additional primary topics of interest are ‘developing strategies’ and ‘pro-
grams of pricing.’ This lends supporting evidence to the idea that pricing policies are
relevant to contemporary marketing, considering that pricing policies encompasses con-
cepts as ‘action indicators,’ ‘performance measures,’ and ‘profitability metrics.’ Our results
provide partial support for the popularity that Customer Relationship Management (CRM)
has gained in recent years. In this respect, topics most related with CRM are ‘added value,’
‘orientation,’ and ‘service.’ Here, the importance of having long-term relations with cus-
tomers, which is a core concept in marketing science, is also highlighted. ‘Emotional
marketing’ is another main topic that recognizes the generation of knowledge in this
discipline by investigating individuals’ emotions.
This work also contributes to the discussion of how literature reviews can be performed,
within marketing science or in other disciplines. Our primary goal was to propose useful
methods for classifying publications according to content similarities. The methods pre-
sented here might be used as general guidelines for authors and researchers who are
Fig. 6 Periods of evolution for the vocabulary in the first MFACT plane
123
310 Scientometrics (2018) 117:293–312
200
interested in performing literature reviews in a systematic way. By identifying the spe-
cialized vocabulary that is used in this discipline and later incorporating it into their
documents, authors may be assured that they are at the forefront of modern vocabulary
usage.
Text mining is an emerging discipline. As such, there are still some significant limi-
tations. Taking into account that only 1169 abstracts were incorporated in this study, our
results are more illustrative than truly generalizable. Therefore, we are not providing
compelling evidence about one accurate ‘radiography’ of marketing science; our work is
much more modest. Rather, the main objective was to demonstrate the suitability of text
mining techniques for conducting precise and standardized literature reviews. A broader
investigation should include the full text of each article to improve the accuracy of these
results. Moreover, categorical variables such as research center, country, and keywords
should be incorporated to better describe the ideal profile of the authors. A second paper,
which effectively incorporates these ideas, is currently in progress.
References
Bansard, J.-Y., Kerbaol, M., & Coatrieux, J.-L. (2006). An analysis of IEEE publications in biomedicalengineering. IEEE Engineering in Medicine and Biology Magazine, 25(5), 6–12. https://doi.org/10.1109/MEMB.2006.1705735.
Barahona, I. (2016). Poverty in Mexico: Its relationship to social and cultural indicators. Social IndicatorsResearch, 135(2), 599–627. https://doi.org/10.1007/s11205-016-1510-3.
Bartol, T., & Stopar, K. (2015). Nano language and distribution of article title terms according to powerlaws. Scientometrics, 103(2), 435–451. https://doi.org/10.1007/s11192-015-1546-1.
Becue-Bertaut, M. (2014). Tracking verbal-based methods beyond conventional descriptive analysis in foodscience bibliography. A statistical approach. Food Quality and Preference, 32, 2–15. https://doi.org/10.1016/j.foodqual.2013.08.010.
Benzecri, J. P. (1979). Pratique de l’analyse des donnees: Abdi, H. et al. Linguistique & lexicologie (Vol. 3).Paris, Francia: Dunod.
Bouchet-Valat, M., & Bastin, G. (2013). RcmdrPlugin. temis, a graphical integrated text mining solution inR. The R Journal, 5(1), 188–196.
Fang, C., Zhang, J., & Qiu, W. (2017). Online classified advertising: A review and bibliometric analysis.Scientometrics, 113(3), 1481–1511. https://doi.org/10.1007/s11192-017-2524-6.
Feinerer, I. (2017). Introduction to the tm package text mining in R, 1–8. Retrieved September 4, 2017, fromhttp://cran.r-project.org/web/packages/tm/vignettes/tm.pdf.
Glaser, J., Glanzel, W., & Scharnhorst, A. (2017). Same data—Different results? Towards a comparativeapproach to the identification of thematic structures in science. Scientometrics, 111(2), 981–998.https://doi.org/10.1007/s11192-017-2296-z.
Greenacre, M., Nenadic, O., & Friendly, M. (2017). Simple, multiple and joint correspondence analysis.Retrieved October 26, 2017, from https://cran.r-project.org/web/packages/ca/ca.pdf.
Hernandez Ramırez, D. M. (2012). BiblioMineR: una herramienta estadıstica para la revision bibliografica.(Master on Statistics and Operations Research), Technical University of Catalonia. BarcelonaTech,Barcelona, Spain. Retrieved June 18, 2017, from http://upcommons.upc.edu/pfc/bitstream/2099.1/16500/1/memoria.pdf.
Huber, J., Kamakura, W., & Mela, C. F. (2014). A topical history of JMR. Journal of Marketing Research(JMR), 51(1), 84–91. https://doi.org/10.1509/jmr.51.1.02.
Karvanen, J., Rantanen, A., & Luoma, L. (2014). Survey data and Bayesian analysis: A cost-efficient way toestimate customer equity. Quantitative Marketing and Economics, 12(3), 305–329. https://doi.org/10.1007/s11129-014-9148-4.
Kerin, R. (1996). In pursuit of an ideal: The editorial and literary history of the journal of marketing. Journalof Marketing, 60(1), 1–13.
Kolbe, R., & Burnett, M. (1991). Content-analysis research: An examination of applications with directivesfor improving research reliability and objectivity. Journal of Consumer Research, 18(2), 243–250.
123
Scientometrics (2018) 117:293–312 311
201

Kostov, B., Becue-Bertaut, M., & Francois, H. (2015). Correspondence analysis on generalised aggregatedlexical tables (CA-GALT) in the FactoMineR Package. The R Journal, 7(1), 109–117.
Kumar, V. (2015). Evolution of marketing as a discipline: What has happened and what to look out for.Journal of Marketing, 79(1), 1–9. https://doi.org/10.1509/jm.79.1.1.
Le, S., Josse, J., & Husson, F. (2008). FactoMineR: An R package for multivariate analysis. Journal ofStatistical Software, 25(1), 1–18. https://doi.org/10.18637/jss.v025.i01.
Lebart, L., Salem, A., & Berry, L. (1997). Exploring textual data (Vol. 4). Netherlands: Springer.Leydesdorff, L., de Moya-Anegon, F., & Guerrero-Bote, V. P. (2010). Journal maps on the basis of Scopus
data: A comparison with the Journal Citation Reports of the ISI. Journal of the American Society forInformation Science and Technology, 61(2), 352–369. https://doi.org/10.1002/asi.21250.
Meyer, D., Hornik, K., & Feinerer, I. (2008). Text mining infrastructure in R. Journal of Statistical Soft-ware, 25(5), 1–54. https://doi.org/10.18637/jss.v025.i05.
Morris, R. (1994). Computerized content analysis in management research: A demonstration of advantages& limitations. Journal of Management, 20(4), 903–931. https://doi.org/10.1016/0149-2063(94)90035-3.
Munoz-Leiva, F., Viedma-del-Jesus, M. I., Sanchez-Fernandez, J., & Lopez-Herrera, A. G. (2012). Anapplication of co-word analysis and bibliometric maps for detecting the most highlighting themes inthe consumer behaviour research from a longitudinal perspective. Quality & Quantity, 46(4),1077–1095. https://doi.org/10.1007/s11135-011-9565-3.
Murtagh, F. (2005). Correspondence analysis and data coding with Java and R. London: CRC Press.Nel, D., van Heerden, G., Chan, A., Ghazisaeedi, M., Halvorson, W., & Steyn, P. (2011). Eleven years of
scholarly research in the Journal of Services Marketing. Journal of Services Marketing, 25(1), 4–12.https://doi.org/10.1108/08876041111107014.
Porter, M. F. (1997). An algorithm for suffix stripping. In J. Karen Sparck & W. Peter (Eds.), Readings ininformation retrieval (pp. 313–316). Massachusetts: Morgan Kaufmann.
SCImago. (2017). Journal and Country Rank, 2017. Retrieved May 25, 2017, from http://www.scimagojr.com/journalrank.php?category=1406.
Stavrianou, A., Andritsos, P., & Nicoloyannis, N. (2007). Overview and semantic issues of text mining.SIGMOD Record, 36(3), 23–34. https://doi.org/10.1145/1324185.1324190.
Stemler, S. (2001). An overview of content analysis. Practical Assessment, Research & Evaluation, 7(17).Retrieved January 4, 2017, from http://PAREonline.net/getvn.asp?v=7&n=17.
Stemler, S. E., Bebell, D., & Sonnabend, L. A. (2011). Using school mission statements for reflection andresearch. Educational Administration Quarterly, 47(2), 383–420. https://doi.org/10.1177/0013161x10387590.
Thomson Reuters. (2016a). 2016 Journal Citation Reports� Impact Factor Journal of Marketing. RetrievedFebruary 14, 2017, from https://jcr.incites.thomsonreuters.com/JCRJournalProfileAction.action?pg=JRNLPROF&journalImpactFactor=3.938&year=2014&journalTitle=JOURNAL%20OF%20MARKETING&edition=SSCI&journal=J%20MARKETING.
Thomson Reuters. (2016b). 2016 Journal Citation Reports� Impact Factor Journal of Marketing. RetrievedFebruary 14, 2017, from https://jcr.incites.thomsonreuters.com/JCRJournalProfileAction.action?pg=JRNLPROF&journalImpactFactor=2.256&year=2014&journalTitle=JOURNAL%20OF%20MARKETING%20RESEARCH&edition=SSCI&journal=J%20MARKETING%20RES.
Wang, P., Bradlow, E. T., & George, E. I. (2014). Meta-analyses using information reweighting: Anapplication to online advertising. Quantitative Marketing and Economics, 12(2), 209–233. https://doi.org/10.1007/s11129-014-9145-7.
Weismayer, C., & Pezenka, I. (2017). Identifying emerging research fields: A longitudinal latent semantickeyword analysis. Scientometrics, 113(3), 1757–1785. https://doi.org/10.1007/s11192-017-2555-z.
123
312 Scientometrics (2018) 117:293–312
202
foods
Article
Testing Model of Purchase Intention for Fast Food inMexico: How do Consumers React to Food Values,Positive Anticipated Emotions, Attitude toward theBrand, and Attitude toward Eating Hamburgers?
Héctor Hugo Pérez-Villarreal 1,2,* , María Pilar Martínez-Ruiz 1 and Alicia Izquierdo-Yusta 3
1 Faculty of Economics and Business Studies, University of Castilla-La Mancha, 02071 Albacete, Spain2 Engineering and Business Postgraduate Center, Popular Autonomous University of Puebla State,
72410 Puebla, Mexico3 Faculty of Economics and Business Studies, University of Burgos, 09001 Burgos, Spain* Correspondence: [email protected]
Received: 13 July 2019; Accepted: 21 August 2019; Published: 27 August 2019���������������
Abstract: This research investigated the effect of the food values, positive anticipated emotions,attitude toward the brand, and attitude toward eating a hamburger on purchase intention in fast-foodrestaurants in Mexico conjointly. The purpose of this study was to discover which variables influencedthe consumer´s intention to buy. Data was collected from a survey of 512 Mexicans fast-foodconsumers. Structural equation modeling was used to test the hypothesized associations. The resultsshowed that food values and positive anticipated emotions absolutely impact the attitude toward thebrand, which impacts the purchase intention of the Mexican consumers. Nonetheless, the positiveanticipated emotions impact stronger than food values, and the best way to get a purchase intentionis toward the attitude of the brand rather than attitude toward eating a hamburger. The authorsdiscussed inferences and suggestions for consumer approaches.
Keywords: food values; positive anticipated emotions; attitude toward the brand; attitude towardeating a hamburger; purchase intention
1. Introduction
Food choice decisions are complicated when every day the consumers make a lot of decisionsabout one excellent fast food [1]. Over the past few years, some studies have had a primordial objectiveto explain how interaction facts affect purchase intention through theory planned behavior (TPB) [2–4].However, none focused on the food values, especially when the research was about food choice andpositive anticipated emotions like a central variable in the model. Based on a dataset of 1169 abstractsof marketing from 2005 to 2014, Barahona et al. (2018) [5] explained that one crucial dimension forresearchers is emotional marketing. Topics such as evaluation, experience, message, people, emotional,goal, and hedonic are the keywords for studies in this field. Therefore, this research was based on thepurpose of explaining the purchase intention in four main premises. First, fast food consumption has apurchase intention by the attitude toward the brand into the means of an emotional need according toa physiological desire [6–8]. Second, the consumers´ emotions influence the purchase intention [9].Third, what is the role of food values on attitude toward the brand and attitude toward eating ahamburger [10]? Fourth, what is more essential to predict the purchase intention: attitude toward thebrand or attitude toward eating a hamburger [11]?
Through this research, a model with these variables was proposed because there is a synergisticeffect between them. The approach rests with the effects of food values and positive early emotions
Foods 2019, 8, 369; doi:10.3390/foods8090369 www.mdpi.com/journal/foods
203

Foods 2019, 8, 369 2 of 17
directed towards the form of the attitude as a predecessor of the purchase intention [12–14]. This modelwas designed from the separation of attitudes: one directed towards the act of eating and anothertowards the brand. The application covers the principle on attitudes directed towards the product andanother towards the brand. Thus, this model is the first that uses the rational and emotional part ofconsumption and separates the attitude of eating from the attitude towards the brand. In this case,the model provides information on the importance of the product and the brand and towards launch,modifications and valuations of products and brands. The consumer’s decisions are based on somelevel of rational or emotional effect [15,16].
This study forms the rational (food values) and emotional (positive anticipated emotions) parts toconnect them with different attitudes to predict purchase intention. Consequently, it used these twoattitudes roles, eating versus brand, to test the relationship to purchase intention. The importance ofthe study is to predict the purchase intention and to know the consumers’ behavior choices with ahamburger. If the calculations, weights, loadings, etc. contribute to explaining more of the purchaseintention, it should make an important and significant contribution to academic literature. This isbecause it gives off too many forms to investigates and implement strategies in fast-food restaurants,knowing the protrusion factors in the model.
For these reasons, it is intended to identify which emotions, food values and types of attitudesimpact significantly and positively on the purchase intention. Through these findings, marketingstrategies can be formulated and it is possible to know what the most convenient way for this field is.The objective of the present study was to explicitly test the purchase intention toward attitudes, foodvalues and positive anticipated emotions. The study built a model on purchase intention research byexamining the consumer before the purchase decision. Also, this study emphasized the meaning of therole of attitudes (eating hamburger and brand) on purchase intentions of fast food consumers. Finally,the study tested and confirmed the hypotheses planted in this research.
1.1. Attitudes in Consumer Behavior
Attitude toward something is an antecedent of intention, but it is also the degree to which anindividual has a favorable or unfavorable evaluation or appraisal of the behavior to any purchasesituation [17]. Some research has also highlighted the role of purchase intention and the attitudeimpact [18]. On the other hand, the attitude that is formed in the first stage is formed of the decisionprocess of purchase in the consumer (recognition of the need/problem). Some studies proved thatthe attitude directly affects the consumer’s buying behavior [19–21]. This attitude is influenced byelements such as information, nature of the product, social media, ads and other behavioral factors. Inthe context of food consumption, the role of attitudes is at the top for research in consumer behavior.Thus, some consumers have attitudes toward eating hamburgers and others have attitudes toward thebrand. This is because they keep both positive and negative evaluations, such as purchases intentions,purchases and repurchases [22]. However, in marketing as a discipline, the gap is different betweenattitude toward eating a hamburger and attitude toward the brand.
Attitudes toward eating hamburgers play a significant role in understanding consumer behavior.These attitudes can be decision-making components for the choice and intention to eat some food [23,24].Once consumers recognize their need for food, they enter into a stage of searching and evaluating thealternatives [25]. It is at this stage, where people positively or negatively value the desired behaviorwithout implying the degree of eating habits or the level of hunger [26]. Hence, the attitude of eatingevaluates the favorable or unfavorable predisposition towards the act of eating any food [17]. Rezai etal. (2017) [27] pointed to a direct relationship between attitudes towards eating foods that generate ahealthy benefit and the intention to buy. For this reason, it is vital to know one’s attitude towards theact of eating as a central point towards the intention to buy.
204

Foods 2019, 8, 369 3 of 17
On the other side, attitudes are cognitions and can sometimes be directed towards the brand [28].So it is necessary to comment that attitudes towards the brand can generate a behavioral intent andthe same behavior of the consumer’s final purchase [29]. Therefore, attitudes towards the brandmean that consumers adopt or reject conduct based on experiences, personal recommendations andmedia exposure, as well as other media that use the brand and may have a point of contact with theconsumer [30]. Hence, attitudes towards the brand have become one of the intangible componentsvalued by consumers because when choosing the behavior, they do it more for the brand than forthe product. Similarly, the attitude towards the brand makes consumers acquire feelings of security,confidence, convenience, and credibility among others, so for them, it is easier to recognize and choosethe purchase [31]. Thus, the literature agrees that attitude towards the brand is the highest pointthrough which the consumer disseminates the choice.
1.2. Purchase Intention
Assael (1998) [32] called purchase intention the conduct that seeks in response to an object andis before the purchase. Subsequently, Zhang et al. (2018) [33] approved the relationship betweenattitudes and purchase intention. Phau and Teah (2009) [34] demonstrated that when the consumerhas a strong positive attitude, there is a higer intention to buy.
Rezai et al. (2017) [27] pointed out the importance of determining the intention to purchasefunctional products from examining the factors involved in the purchase decision process. For example,Jahn, Tsalis, and L’hteenm-ki (2019) [35] indicated that the general attitude towards products has adirect effect towards the intention to purchase, as long as the people are in a condition of suitabilityand knowledge of the problem. Asif et al. (2018) [36] pointed out that it is possible to find differencesin intent to buy from one country to another, but they agreed that attitude and health awareness arethe best predictors of the intention to buy in organic foods. Some studies pointed to some additionalvariables to the TPB including moral attitude and healthy awareness towards purchasing intent inorganic foods [37]. Consequently, it is possible to include other variables in the purchase intentionby extending the TPB. On the other hand, another study pointed to the involvement towards theconsumption of products, price sensitivity and moderation of the effect of the identity of the localproduct towards the intention of purchase [38].
Chiu, Hsieh, and Kuo (2012) [39] and Diallo (2012) [40] underlined aspects about the probabilityto buy, not before the consumer formed an attitude and experience of the past. Now, as the intention istestified to be a significant factor of buying, it was thus, hypothesized that:
Hypothesis 1 (H1). Attitude toward the brand will positively influence intention to buy.
Hypothesis 2 (H2). Attitude toward eating hamburger will positively influence the intention to buy.
1.3. Food Values
The situation of obtaining information on the attributes of the product has always been arelevant topic in food consumer research. Today, exotic consumption attributes, towards the ethics ofconsumption, healthy awareness, animal impact and organic food are topics of interest in knowing one’sbehavior [41–44]. According to Basha and Lal (2019) [45], the ratio of environmental concern, healthand lifestyle, supporting local farmers, product quality, convenience, price, animal welfare, safety-trust,subjective norms, and attitude is valued. The food choice has been becoming an advantage to improvehealthy and sustainable diets and to know the different roles of high and low involvement [46].Nevertheless, Boer and Schösler (2016) [46] mentioned that the differences in the affinities could bepredicted by food-related value motivation.
205

Foods 2019, 8, 369 4 of 17
Sprotles and Kendall (1986) [47], through consumer styles inventory (CSI), claimed that consumerschoose to make their purchase decision through eight basic styles: high quality, innovation, brandawareness, price, hedonism, confusion with other brands, impulsivity, and habit. Other studiesemphasized product presentation, food safety, environmental impact, and ethical consumer identity [48].Another study found that depending on the type of food (organic or conventional) used, the effect onthe consumer perception component (e.g., healthy consciousness) differs [49].
When researches talk about the food attributes, it can be partial to the real concept because thefood attributes can be an infinite number of characteristics, but only some of them are important forthe moment of choice [50]. For this reason, the attributes of the product became the consumer’s valuesregarding food. Some researchers affirmed that these values were influenced through many factors,which relate to personal values [1,51–53]. This means that food values are exercised by the consumerand not by the product itself. However, each attribute mentioned above falls within a factor of the11 described by Lusk (2011) [54]. Thus, it is possible that each product, depending on belonging in thecategory, constitutes intra-group differences, but it is possible to categorize them in general forms.
Lusk and Briggeman (2009) [55] explored all the factors that integrated the attributes of food.After this plan, Lusk (2011) [54] opened wide 11 items to identify the food values scale. These itemsare (1) naturalness (the extent to which food is produced without modern technologies), (2) taste (theextent to which consumption of food is appealing to the senses), (3) price (the amount paid for food),(4) safety (the extent to which consumption of food will not cause illness), (5) convenience (the easewith which food is cooked and consumed), (6) nutrition (the amount and type of fat, protein, vitamins,etc.), (7) tradition (preserving traditional consumption patterns), (8) origin (where the agriculturalcommodities were grown), (9) fairness (the extent to which all parties involved in food productionequally benefit), (10) appearance (the extent to which food looks appealing), and (11) environmentalimpact (the effect of food production on the environment).
Studies have shown that food values are essential to explain attitudes. For example, Manan(2016) [1] emphasized to know the attitudes through personal values, but the question is whetherpersonal values are influenced by the food benefits, if that correct, then these affect attitude. In order,Lang and Lemmerer (2019) [53] demonstrated the relationships across personal values and attitudestoward local food, but they did not separate the attitude toward eating a hamburger or the attitudetoward the brand. As a result, it is hypothesized that:
Hypothesis 3 (H3). Food values will positively influence attitude toward the brand.
Hypothesis 4 (H4). Food values will positively influence attitude toward eating a hamburger.
1.4. Anticipated Emotions
Some researchers have been in charge of framing emotions as a fundamental, principal axis anddetonator of all purchasing behavior, this adding to the part of information processing and consumeraction [56–62]. Although the entire chain of observation (cognitive, conative and affective), the triggerand the key factors of success cannot be established, some researchers have taken a part of the chaintowards the effective and successful verification of the application of branding emotional, buyback,purchase decision, search, and evaluation of purchase alternatives [63–66].
Within the contributions of advertising, it is possible to highlight that the emotional contagionmay have main effects on the physiological changes of the people [67]. In this study, the participantsfelt sadder when they saw a victim with a sad face, and their sadness emanated the effect on theexpression of the emotion in the sympathy. The effects of contagion are automatic and not inferentialbut are diminished by deliberative thinking. On the other hand, Nielsen et al. (2010) [68] showed thatthe “pre-attention” processing of semantic information in non-focal announcement titles can provokeorientations towards attention responses. The same results were in foreseeable increases in the ad and
206

Foods 2019, 8, 369 5 of 17
knowledge of the brand. Equally, Teixeira et al. (2012) [59] showed that surprise and joy concentrateeffective attention and retain the viewers with more time. However, the most important thing is thelevel of retention instead of the speed of surprise, and it affects the concentration of attention more.Therefore, speed influences the level of joy, which affects spectator retention. These three studiesplaced the emotional part as the main factor in their research with the impact on advertising. It couldbe specified that the authors discussed the implications of the use of emotional expressions, titles ofadvertisements, and consumer knowledge of the brand to promote emotions in the consumer and helpthe purchasing decision process.
However, the emotions are present throughout the process of consumer behavior, but it is vitalto determine what the origin of this is. Pelsmaeker et al. (2017) [69] explained the relationship ofemotions in the begging of the process of consumer intention, and they determined the relevance ofapplying an evaluation before recognizing the need. Emotions can indeed be positive and negativedepending on the moment or value. However, some researchers in recent years were working onlyfor positive emotions because only these matter. Wen, Hu and Kim (2018) [70] examined the effect ofindividual culture on positive emotions for the recommendation intention. Finally, positive emotionsare the principal element to determine the satisfaction of the consumer [71].
Williams and Aaker (2002) [72] believed that when individuals are exposed to mixed emotions,they influenced the individual´s attitudes in general. They also demonstrated that the detonation ofemotions with duality (e.g., sadness and happiness) is less prone to form an attitude towards theirbehavior. Haws and Winterich (2013) [73] described the factors to measure the attitude toward eatingdirectly to these items: pleasure, enjoy, satisfied, and good taste. However, the consumer can have anattitude toward the brand and not for eating. That reason describes Aggarwal and Mcgill’s (2012) [74]finding that what consumers like, think, admire, and fit in their life is a good positive attitude thathelps to stimulate the intention. This study proposed two constructs, one for eating the hamburgerand the other for the brand.
Thus, the following hypothesis can be derived:
Hypothesis 5 (H5). Positive anticipated emotions will positively influence attitude toward the brand.
Hypothesis 6 (H6). Positive anticipated emotions will positively influence attitude toward eating a hamburger.
Hypothesis 7 (H7). Positive anticipated emotions will positively influence the intention to buy.
Therefore, seven hypotheses were tested in this research and based on the discussion above (seeFigure 1), and considers seven proposed effects: (1) attitude toward the brand on purchase intention,(2) attitude toward eating hamburger on purchase intention, (3) food values on attitude toward thebrand, (4) food values on attitude toward eating hamburger, (5) positive anticipated emotions onattitude toward the brand, (6) positive anticipated emotions on attitude toward eating hamburger,and (7) positive anticipated emotions on purchase intention. Thus, all the effects correspond to a newmodel for understanding better the purchase intention in fast-food restaurants.
207

Foods 2019, 8, 369 6 of 17
Figure 1. Model development.
2. Materials and Methods
This study utilized partial least squares-structural equation modelling (PLS-SEM) to examine theimpact of the food values, emotions anticipated and attitudes on purchase intention (see Table 1 fortechnical details). The proposal was to estimate a model that includes a mix of factors and compositesusing the PLS algorithm procedure [75]. The idea was to maximize the explained variance of alldependent variables used in the research model. In this case, the research intent was to know thepredictor variable and to identify possible drivers [76,77]. Therefore, the independent variables thatthe literature reports as important predecessors of purchase intention were also included.
Table 1. Technical Details.
Universe Residents in Puebla State in México
Sample unit People over 17 years old and buying fast food
Information collection method Personal survey
Sample error ±4.335
Level of reliability 95%
Sample procedure Probabilistic
Number surveyed 512 valid surveys
Period of information collection January 26–May 23 (2018)
Language Spanish
2.1. Data Collection
The data was collected from Puebla City in Mexico with a consumer survey of 512 participants.Participation was voluntary and all of them completed the questionnaire.
208

Foods 2019, 8, 369 7 of 17
2.2. Statistics Analysis
The study used structural equation modeling (SEM) to test the conceptual model with SmartPLS3.0 software. According to Streukekens and Leroi-Werelds (2016) [78], this study used partial leastsquares (PLS) with a 10,000 subsample bootstrapping procedure and the same software to know if therelationship was supported or not with the results. In the beginning, this model was composted from34 items reduced to 28 items in five constructs. From there, no preliminary empirical parameters forthis particular market were found.
2.3. Questionnaire Development
The questionnaire was constructed and divided into five sections: (a) food values, (b) positive andnegative anticipated emotions, (c) attitude toward the brand, (d) attitude toward eating a hamburger,and (e) purchase intention (see Table 2). The first table shows the questionnaire section by source andthe second explains details on how to measure each variable.
Table 2. Questionnaire sections.
Latent VariableObservedVariables
Definition Source
Food values aregeneral food
attributes thatconsumers believedwere relatively more
important whenpurchasing food
Appearance Extent to which food looks appealing
Lusk (2011) [54]
Convenience Ease with which food is cooked and consumed
Environmental Effect of food production on the environment
Fairness The extent to which all parties involved in theproduction of the food equally benefit
Naturalness Extent to which food is produced withoutmodern technologies
Nutrition Amount and type of fat, protein, vitamins, etc.
Origin Where the agricultural commoditieswere grown
Price The price that is paid for the food
Safety Extent to which consumption of food will notcause illness
Taste Extent to which consumption of the food isappealing to the senses
Tradition Preserving traditional consumption patterns
Positive and negativeanticipated emotions
Contentment If I can go to eat a hamburger in fast-foodrestaurants the next month, I feel contentment
Adapted fromBagozzi and
Dholakia (2006)[79]
Delighted If I can go to eat a hamburger in fast-foodrestaurants the next month, I feel delighted
Excited If I can go to eat a hamburger in fast-foodrestaurants the next month, I feel excited
Proud If I can go to eat a hamburger in fast-foodrestaurants the next month, I feel proud
Satisfied If I can go to eat a hamburger in fast-foodrestaurants the next month, I feel satisfied
Selfassured If I can go to eat a hamburger in fast-foodrestaurants the next month, I feel self-assured
209

Foods 2019, 8, 369 8 of 17
Table 2. Cont.
Latent VariableObservedVariables
Definition Source
Attitude toward thebrand (ATB)
ATB1 Like the brandAggarwal and
McGill (2012) [74]ATB2 Admire the brand
ATB3 Fit in your life the brand
Attitude towardeating a hamburger
(ATEH)
ATEH1 Eating the hamburger would be pleasurable
Adapted fromHaws and
Winterich (2013)[73]
ATEH2 I would enjoy eating the hamburger
ATEH3 If I eat a hamburger, it would be satisfyingfor me
ATEH4 If I eat a hamburger because of the good tasteit has
Purchase intention
PI1 You probably buy products infast-food restaurants
Adapted fromChiu, Hsieh, andKuo (2012) [39],
Diallo (2012) [40]
PI2 I would consider buying a product in fast-foodrestaurants if I need a product of this type
PI3 It is possible to buy a product infast-food restaurants
PI5 The probability that you consider buying infast-food restaurants is high
The food values utilized a Likert scale 1–5 (1 = not at all important, to 5 = extremely important).The scale was adapted from 7 points to 5 points, because it was planned to explain each item as aformative construct. It is better to get an answer from the consumer on the assumption that some itemsdo not have a relation with the construct. Positive and negative anticipated emotions applied a Likertscale 1–7 (1 = none, to 7 = severe). From the original items, it supported the positive emotions becausethe negatives did not have an impact and did not comply with the test of validity and reliability. Itdeleted the emotions for: glad, relief and happy for the reason to have multicollinearity and the VIFfactor > 3.2. Also, it used the 7-point Likert scale as the author marked it. According to Becker andIsmail (2016) [80], it is possible to use different Likert scales within the same model. In the attitudetoward the brand (ATB), it used a Likert scale 1–5, (1 = strongly disagree, to 5 = strongly agree). Fromthe original contribution, it supported only the positive items because the weights were weak (item 4“shame” and 5 “avoidance”). It changed the inverse items for the nature of the scale. For the attitudetoward eating a hamburger (ATEH), it was handled with a Likert scale 1–5, (1 = strongly disagree, to5 = strongly agree). These items were adapted to the specific product (in this case, hamburger). Thevariable purchase intention was measured by a Likert scale 1–5, (1 = strongly disagree, to 5 = stronglyagree). PI4 was excluded because it had multicollinearity with PI3. The item was “I would buy in fastfood restaurants next time”.
All the constructs were reflective, not including food values. The construct formed theinterpretations depending on the dependent variable. Hence, the formative indicators may show up asnon-significant. Also, the indicators were correlated with other indicators in the model proposal [81].Similarly, all the formative indicators required a census of all items for the construct because each one(it can be negative or positive) was formed into a complete variable. Even the negative influences onthe consumer were one item that needed to be taken care of [82]. Finally, the overall fit of this modeldoes not matter; the other covariances like the exogenous variables are outside the model proposal, andall the items are independent of themselves, according to Jarvis, MacKenzie and Podsakoff (2003) [82].
3. Results
The development model was constructed on an amalgamation of items, concepts, models, effectsand principles about two parts: functional and emotional. This model was also composited about aseries of research studies around four exceptional areas: (1) food values, (2) attitude toward the brand,
210

Foods 2019, 8, 369 9 of 17
(3) attitude toward eating a hamburger, and (4) positive anticipated emotions. All were within theproposal to better explain the purchase intention in fast-food restaurants in Mexico.
To assess the goodness of model fit, the root mean square residual (SRMR) was utilized. Accordingto Hu and Bentler (1998) [83] and Hu and Bentler (1999) [84], SRMR < 0.08 is a good fit for SRMR. Thismodel has an SRMR = 0.049 < 0.08 SRMR criteria; these measures found that this model has a good fitwith the parameters mentioned before. The normed fit index (NIF) results in values from 0 to 1, andthe closer to 1, the better the fit [85]. In this model, the NIF was 0.899 and represented an acceptable fit.
To get confidence in this model, reliability and construct validity testing were carried out.Cronbach’s alpha coefficient was accepted for all the constructs, having a value greater than 0.7 [86].The rho_A value was reflected regularly if this index was larger than 0.7 [87]. The composite reliability(CR) values under 0.6 indicated a deficiency of internal consistency reliability [88]. The AVE of eachconstruct was above the tolerability value 0.5 [89,90] (see Table 3).
Table 3. Validity Testing.
Cronbach’s AlphaCoefficient
rho_AComposite
Reliability (CR)Average VarianceExtracted (AVE)
Attitude towardeating a hamburger 0.847 0.862 0.897 0.687
Attitude towardthe brand 0.822 0.836 0.893 0.736
Positive anticipatedemotions 0.916 0.921 0.934 0.704
Purchase intention 0.895 0.896 0.927 0.760
As a final point, the discriminant validity of constructs showed the factor loading indicators on theassigned construct. Therefore, they had to be above all loading of other constructs (in the same column)with the condition that the cut-off value of factor loading was higher than 0.70 [89]. In addition, themodel proved to have satisfactory reliability with convergent and discriminant validity. After thisstep, it was necessary to test the discriminant validity of constructs. According to Fornell and Larcker(1981) [89], with the correlation coefficient of the two dimensions less than the square root of the AVE,two dimensions were understood to have discriminant validity because of AVE > 0.5 (see Table 4).
Table 4. Association Testing.
Attitudetoward Eatinga Hamburger
Attitudetoward the
BrandFood Values
PositiveAnticipated
Emotions
PurchaseIntention
Attitudetoward eating a
hamburger0.829
Attitudetoward the
brand0.538 0.858
Food values 0.431 0.444 Formative
Positiveanticipatedemotions
0.482 0.544 0.401 0.839
Purchaseintention 0.537 0.665 0.407 0.544 0.872
211

Foods 2019, 8, 369 10 of 17
The study confirmed the hypothesis with path coefficient, standard error, t-value, and p-value(see Table 5). It was concluded that all the hypotheses planted were supported and positive to predictthe purchase intention with a high level, even though the study observed some differences about eachassociation. The first force is the association between attitude toward the brand on purchase intentionhad the best path coefficient (β = 0.447). Moreover, the results showed that attitude toward eating ahamburger was also important to purchase intention (β = 0.197). However, the other association topredict purchase intention was throughout the positive anticipated emotions and for this model was(β = 0.206), more than attitude toward eating a hamburger.
Table 5. Hypothesis Testing and Path Coefficients.
Beta Standard Error t-Value p-Value f 2 q2 Supported
H1Attitude toward thebrand -> Purchase
intention0.447 *** 0.041 10.849 0.000 0.249 0.134 Yes
H2
Attitude towardeating a hamburger
-> Purchaseintention
0.197 *** 0.043 4.574 0.000 0.053 0.030 Yes
H3Food values ->
Attitude toward thebrand
0.270 *** 0.042 6.447 0.000 0.095 0.050 Yes
H4Food values ->
Attitude towardeating a hamburger
0.284 *** 0.043 6.608 0.000 0.097 0.052 Yes
H5
Positive anticipatedemotions ->
Attitude toward thebrand
0.436 *** 0.043 10.126 0.000 0.248 0.146 Yes
H6
Positive anticipatedemotions ->
Attitude towardeating a hamburger
0.368 *** 0.040 9.167 0.000 0.163 0.088 Yes
H7Positive anticipated
emotions ->Purchase intention
0.206 *** 0.050 4.129 0.000 0.057 0.030 Yes
Note: n = 10,000 subsamples; *** p < 0.001; R2 (Attitude toward the brand = 0.357; Attitude toward eating = 0.300;Purchase intention= 0.515); q2 = Predictive relevance calculated ((R-Sq included)-(Q-Sq excluded))/(1-R-Sq included).
The great force to constitute the attitude toward the brand was with the construct positiveanticipated emotions (β = 0.436). Because, in comparison, the attitude toward eating a hamburger onlyhas β = 0.368. Something relevant was the impact of food values to the attitudes, where it had someconsideration to attitude toward eating a hamburger (β = 0.270), in contrast to the brand, where washigher (β = 0.284).
Some reflections about all the hypotheses proposed are the level of significance, where p-value<0.001 with the 99%; it means that these study results were statistically significant.
Also, the H5 line of positive anticipated emotions to attitude toward the brand (β= 0.436, t = 10.126,p = < 0.001) and the H1 line of attitude to purchase intention (β = 0.447, t = 10.849, p = <0.001) indicatedan abundant positive effect to form the purchase intention; this was the best way to predict it. Table 5shows that in all the relations, t-value ≥ 1.96 and p-value ≤ 0.05; thus, this model supported allthe hypotheses with high path coefficients and t-values. Hence, outer model loadings were highlysignificant. In addition, f2 was utilized to confirm the hypotheses null in the model and the outcomessupported each hypothesis but with different effects from weak <0.15 to large >0.15 [91]. All q2 areabove zero, which supports the model presenting in Figure 2 [88].
212

Foods 2019, 8, 369 11 of 17
Figure 2. PLS analysis results.
Esposito et al. (2010) [92] stated that formative constructs need not be correlated between them.Also, the construct needs to be supported with the theory about food values. Similarly, the PLSalgorithm produced loadings for reflective construct and weight for formative. Moreover, the studyused the loadings and weights indicator for each construct by nature.
Figure 2 indicates the formative construct (food values), and inside the construct, the best itemsare taste and tradition (0.490; 0.380). On the other hand, the food values show negative loading withenvironment and nutrition (−0.256; −0.233). These facts do not have a position for the food value. Also,the model indicates that the emotions of contentment, excited and satisfied are the best loadings in themodel (0.869, 0.856, 0.843).
It is distinguished that R2 (ATEH) is 0.357 higher than ATB (0.300). Additionally, R2 (PI) is 0.515,signifying that both attitudes toward eating and the brand plus positive anticipated emotions explain51% of purchase intention. Even though R2-ATEH and R2-ATB are weak, the R2-purchase intention issubstantial [91].
4. Discussion
All the hypotheses proposed were supported and confirmed. It accepted the difference by twotypes of attitudes: one of them toward the brand and the other toward eating a hamburger. Also, itshowed the gap between the beta indicators with 0.250 to predict the purchase intention. The attitudetoward the brand got first place in the hypotheses. Based on the previous study, the theory andempirical research suggested that attitude toward the brand will positively influence the intention tobuy. After the results, it confirmed the positive influence and on the same road with other studies. Inthis case, it corroborated with the results of Hwang, Yoon and Park (2011) [29] which mentioned thatthe affective responses positively influence brand attitudes and purchase intention. The attitude towardeating had the right place in the final model. This hypothesis was confirmed, and the values obtainedhelp to explain, with a higher percentage, the purchase intention. Other authors affirm the importanceto investigate eating behavior to get knowledge about the positive or negative predisposition toeat [23,24]. The hypotheses related to food values were an essential variable in this model, i.e., therelationship of this variable to both attitudes. At this point, it is demonstrated that the food valuescould be impacted in a different way to each attitude. It validated the influence of food values affecting
213

Foods 2019, 8, 369 12 of 17
indirectly on the purchase intention. With this information, it led to some discussion to add more foodvalues and to get an effect indirect to purchase intention. For example, these results match to Lang andLemmerer (2019) [53] which affirm that personal values impact on forming a food attitude. Last, thepositive anticipated emotion positively influenced attitude toward the brand, attitude toward eating,and intention to buy a hamburger. The results are consistent with previous research, which assertthat emotion is an irreplaceable variable to try predicting the purchase intention. Positive anticipatedemotion is a significant variable, which participates in three hypotheses addressing attitude towardthe brand, attitude toward eating a hamburger and purchase intention. This confirms findings in otherstudies [74,93,94].
Managerial implications are confirmations derived from this research. First of all, managers offast-food restaurants have to focus on the purchase intention of consumers. The findings support thatpurchase intention is more influenced by attitude toward the brand than by attitude toward eatinga hamburger. Subsequently, the food values do not impact very strongly, but positive anticipatedemotions do. The managers need to study how powerful each emotion (contentment, excited andsatisfied) is before thinking about eating something at a fast-food restaurant. Also, the best values tobuild into the product are taste and tradition. Hence, in this case, the managers need to investigateabout preferences, tastes and culture around consumption in fast-food restaurants. In that way, theyneed to prefer a strategy with a focus to increase and improve the value of the brand toward the brandequity oriented into the consumer. Correspondingly, positive anticipated emotions do not have a goodassociation directly with purchase intention. This explains that without an attitude toward eating ahamburger or the attitude toward the brand, the consumer does not perceive the intention to buy ahamburger at a fast-food restaurant.
Limitations and Future Orientations
There are limitations and suggested future lines of research. First of all, the sample should beincreased to raise the level of confidence and lower the level of sampling error. Alternatively, it isrecommended to add other variables related to TPB as perceived control, perceived difficulty andsubjective norms on purchase intention. Finally, it is suggested to apply these surveys in other cities,products, and brands to know if there are significant differences between the samples.
5. Conclusions
The goal for this study was building a development and testing model, having one comprehensivemodel about the purchase intention. The study planted a model with the importance of functional andemotional aspects through their effects on two attitudes. This model is an approximation to betterexplain the purchase intention. The food values have a low position on attitude toward the brandand attitude toward eating a hamburger. On the other hand, anticipated positive emotions have morerelevance on attitudes, especially the attitude toward the brand and to purchase intention.
The positive food values are taste and tradition in fast-food consumers. This model providesinformation to fast-food restaurants to pay attention to constantly evaluate the taste that has theconsumers’ favor and to explore insights about a different perception of taste in the hamburger. Also,the tradition is significant because it includes and preserves traditional consumption patterns, sincechildren families and reference groups help to educate this kind of consumption. From the otherview, the consumer does not care about the nutrition of the hamburger against the knowledge ofthe brand. This confirms the results from Barone et al. (1996) [95] that examined the cause to formincorrect conclusions about the product. In this case, the consumer does not give value to the types offat, proteins, vitamins, and carbohydrates that the hamburgers have. This demonstrates the lack ofsensitivity and knowledge of healthy and responsible consumption.
Similarly, it is also happening with the environment value where the most significant weightin the variable of food value is. The consumer does not care if the burger is produced while takingcare of the environment. The problem of having production for the environment and pollution does
214

Foods 2019, 8, 369 13 of 17
not see some or any benefit knowing how the food was manufactured. So, the adequacy of practicesin favor of the environment and eco-friendly consumption is not significantly crucial for attitude orpurchase intention.
It was also shown that positive anticipated emotions form the best way to explain the purchaseintention. First of all, it was verified that the anticipated negative emotions did not show any relevantdata that included that variable within the model. Subsequently, the items with the greatest loadingswere analyzed, and the results were positive anticipated emotions like contentment, delighted, excited,proud, satisfied, and self-assured. If the consumer is to have one of these emotions, it is probably tohave a good level of attitude toward the brand and then to get a purchase intention.
For this reason, the results of the study confirm the existence of a strong relationship betweenattitudes toward the brand on purchase intention by way of anticipated positive emotions in theconsumer of fast-food restaurant. This proves, as in previous literature, that emotions are a necessarymeasure of the decision-making process of the consumer [96].
Author Contributions: Conceptualization, H.H.P.-V. and M.P.M.-R.; Methodology, H.H.P.-V. and A.I.-Y.; software,H.H.P.-V. and A.I.-Y.; validation, H.H.P.-V. and A.I.-Y.; formal analysis, H.H.P.-V., M.P.M.-R., and A.I.-Y.;investigation, H.H.P.-V.; resources; H.H.P.-V.; data curation, A.I.-Y.; writing—original draft preparation, H.H.P.-V.,M.P.M.-R., and A.I.-Y.; writing—review and editing, H.H.P.-V., M.P.M.-R., and A.I.-Y.; visualization, H.H.P.-V.;supervision, M.P.M.-R., and A.I.-Y.; project administration, H.H.P.-V.; funding acquisition, H.H.P.-V.
Funding: This research was funded by Universidad Popular Autónoma del Estado de Puebla (UPAEP), Sistemasde Información de Marketing: Sistemas de información, modelización y gestión para la toma de decisiones enMarketing and the APC was funded by UPAEP.
Conflicts of Interest: The authors declare no conflict of interest.
References
1. Manan, H.A. The Hierarchical Influence of Personal Values on Attitudes toward Food and Food Choices.Procedia Econ. Financ. 2016, 37, 439–446. [CrossRef]
2. Chen, M.; Lu, T. Modeling e-coupon proneness as a mediator in the extended TPB model to predict consumers’usage intentions. Internet Res. 2011, 21, 508–526. [CrossRef]
3. Yuzhanin, S.; Fisher, D. The efficacy of the theory of planned behavior for predicting intentions to choose atravel destination: A review. Tour. Rev. 2016, 71, 135–147. [CrossRef]
4. Liu, J.; Lin, S.; Feng, Y. Understanding why Chinese contractors are not willing to purchase constructioninsurance. Eng. Constr. Archit. Manag. 2018, 25, 257–272. [CrossRef]
5. Barahona, I.; Hernández, D.M.; Pérez-Villarreal, H.H.; del Pilar Martínez-Ruíz, M. Identifying research topicsin marketing science along the past decade: A content analysis. Scientometrics 2018, 117, 293–312. [CrossRef]
6. Ruth, J.A. Promoting a Brand’s Emotion Benefits: The Influence of Emotion Categorization Processes onConsumer Evaluations. J. Consum. Psychol. 2001, 11, 99–113. [CrossRef]
7. Handley, L. Brands are the vital ingredient of health drive. Marketting Week. 2010. Available online: https://www.marketingweek.com/brands-are-the-vital-ingredient-of-health-drive/ (accessed on 31 May 2019).
8. Ding, C.G.; Tseng, T.H. On the relationships among brand experience, hedonic emotions, and brand equity.Eur. J. Mark. 2015, 49, 994–1015. [CrossRef]
9. Wang, E.S.-T. Displayed emotions to patronage intention: Consumer response to contact personnelperformance. Serv. Ind. J. 2009, 29, 317–329. [CrossRef]
10. Goldsmith, R.E.; Freiden, J.; Henderson, K.V. The impact of social values on food-related attitudes. J. Prod.Brand Manag. 1995, 4, 6–14. [CrossRef]
11. Lorenz, B.A.-S.; Langen, N.; Hartmann, M.; Klink-Lehmann, J. Decomposing attitudes towards food leftovers:Implications for general attitude, intention and behavior. Br. Food J. 2018, 120, 2498–2509. [CrossRef]
12. Koenig-Lewis, N.; Palmer, A. The effects of anticipatory emotions on service satisfaction and behavioralintention. J. Serv. Mark. 2014, 28, 437–451. [CrossRef]
13. Zhao, X.; Deng, S.; Zhou, Y. The impact of reference effects on online purchase intention of agriculturalproducts: The moderating role of consumers’ food safety consciousness. Internet Res. 2017, 27, 233–255.[CrossRef]
215

Foods 2019, 8, 369 14 of 17
14. Song, J.; Qu, H. How does consumer regulatory focus impact perceived value and consumption emotions?Int. J. Contemp. Hosp. Manag. 2019, 31, 285–308. [CrossRef]
15. Zhang, H.; Sun, J.; Liu, F.; Knight, J.G. Be rational or be emotional: advertising appeals, service types andconsumer responses. Eur. J. Mark. 2014, 48, 2105–2126. [CrossRef]
16. Nicolini, V.; Cassia, F.; Bellotto, M. Children perceptions of emotional and rational appeals in socialadvertisements. Young Consum. 2017, 18, 261–277. [CrossRef]
17. Ajzen, I. The theory of planned behavior. Organ. Behav. Hum. Decis. Process. 1991, 50, 179–211. [CrossRef]18. Ajzen, I.; Fishbein, M. Understanding Attitudes and Predicting Social Behavior; Prentice-Hall: Englewood Cliffs,
NJ, USA, 1980; ISBN 978-0-13-936443-3.19. Wu, S. The relationship between consumer characteristics and attitude toward online shopping. Mark. Intell.
Plan. 2003, 21, 37–44. [CrossRef]20. Garg, N.; Wansink, B.; Inman, J.J. The Influence of Incidental affect on Consumers’ Food Intake. J. Mark.
2007, 71, 194–206. [CrossRef]21. Talih Akkaya, D.; Akyol, A.; Gölbası Simsek, G. Sosyal medya reklamciliginda tüketici algilarinin tutum,
davranis ve satin alma niyeti üzerine etkisi. Marmmara Univ. Econ. Adm. Sci. 2018, 39, 361–388. [CrossRef]22. Chang, C. Feeling Ambivalent About Going Green. J. Advert. 2011, 40, 19–32. [CrossRef]23. Chen, M. Attitude toward organic foods among Taiwanese as related to health consciousness, environmental
attitudes, and the mediating effects of a healthy lifestyle. Br. Food J. 2009, 111, 165–178. [CrossRef]24. Ghoochani, O.M.; Torabi, R.; Hojjati, M.; Ghanian, M.; Kitterlin, M. Factors influencing Iranian consumers’
attitudes toward fast-food consumption. Br. Food J. 2018, 120, 409–423. [CrossRef]25. Bai, L.; Wang, M.; Yang, Y.; Gong, S. Food safety in restaurants: The consumer perspective. Int. J. Hosp.
Manag. 2019, 77, 139–146. [CrossRef]26. Coricelli, C.; Foroni, F.; Osimo, S.A.; Rumiati, R.I. Implicit and explicit evaluations of foods: The natural and
transformed dimension. Food Qual. Prefer. 2019, 73, 143–153. [CrossRef]27. Rezai, G.; Teng, P.K.; Shamsudin, M.N.; Mohamed, Z.; Stanton, J.L. Effect of perceptual differences on
consumer purchase intention of natural functional food. J. Agribus. Dev. Emerg. Econ. 2017, 7, 153–173.[CrossRef]
28. Diallo, M.F.; Seck, A.M. How store service quality affects attitude toward store brands in emerging countries:Effects of brand cues and the cultural context. J. Bus. Res. 2018, 86, 311–320. [CrossRef]
29. Hwang, J.; Yoon, Y.-S.; Park, N.-H. Structural effects of cognitive and affective reponses to web advertisements,website and brand attitudes, and purchase intentions: The case of casual-dining restaurants. Int. J. Hosp.Manag. 2011, 30, 897–907. [CrossRef]
30. Foroudi, P. Influence of brand signature, brand awareness, brand attitude, brand reputation on hotelindustry’s brand performance. Int. J. Hosp. Manag. 2019, 76, 271–285. [CrossRef]
31. Jeng, S.-P. The influences of airline brand credibility on consumer purchase intentions. J. Air Transp. Manag.2016, 55, 1–8. [CrossRef]
32. Assael, H. Consumer Behavior and Marketing Action; PWS-KENT Pub.: Boston, MA, USA, 1992;ISBN 978-0-534-92552-9.
33. Zhang, Y.; Jing, L.; Bai, Q.; Shao, W.; Feng, Y.; Yin, S.; Zhang, M. Application of an integrated framework toexamine Chinese consumers’ purchase intention toward genetically modified food. Food Qual. Prefer. 2018,65, 118–128. [CrossRef]
34. Phau, I.; Teah, M. Devil wears (counterfeit) Prada: a study of antecedents and outcomes of attitudes towardscounterfeits of luxury brands. J. Consum. Mark. 2009, 26, 15–27. [CrossRef]
35. Jahn, S.; Tsalis, G.; Lähteenmäki, L. How attitude towards food fortification can lead to purchase intention.Appetite 2019, 133, 370–377. [CrossRef]
36. Asif, M.; Xuhui, W.; Nasiri, A.; Ayyub, S. Determinant factors influencing organic food purchase intention andthe moderating role of awareness: A comparative analysis. Food Qual. Prefer. 2018, 63, 144–150. [CrossRef]
37. Yadav, R.; Pathak, G.S. Intention to purchase organic food among young consumers: Evidences from adeveloping nation. Appetite 2016, 96, 122–128. [CrossRef]
38. Ghali-Zinoubi, Z.; Toukabri, M. The antecedents of the consumer purchase intention: Sensitivity to price andinvolvement in organic product: Moderating role of product regional identity. Trends Food Sci. Technol. 2019,90, 175–179. [CrossRef]
216

Foods 2019, 8, 369 15 of 17
39. Chiu, H.-C.; Hsieh, Y.-C.; Kuo, Y.-C. How to Align your Brand Stories with Your Products. J. Retail. 2012, 88,262–275. [CrossRef]
40. Diallo, M.F. Effects of store image and store brand price-image on store brand purchase intention: Applicationto an emerging market. J. Retail. Consum. Serv. 2012, 19, 360–367. [CrossRef]
41. Ghvanidze, S.; Velikova, N.; Dodd, T.; Oldewage-Theron, W. A discrete choice experiment of the impact ofconsumers’ environmental values, ethical concerns, and health consciousness on food choices: A cross-culturalanalysis. Br. Food J. 2017, 119, 863–881. [CrossRef]
42. Clarkson, C.; Mirosa, M.; Birch, J. Consumer acceptance of insects and ideal product attributes. Br. Food J.2018, 120, 2898–2911. [CrossRef]
43. Raaijmakers, I.; Sijtsema, S.; Labrie, C.; Snoek, H. Consumer segmentation based on health-related motiveorientations and fruit and vegetable consumption. Br. Food J. 2018, 120, 1749–1763. [CrossRef]
44. Ditlevsen, K.; Sandøe, P.; Lassen, J. Healthy food is nutritious, but organic food is healthy because it is pure:The negotiation of healthy food choices by Danish consumers of organic food. Food Qual. Prefer. 2019, 71,46–53. [CrossRef]
45. Basha, M.B.; Lal, D. Indian consumers’ attitudes towards purchasing organically produced foods: Anempirical study. J. Clean. Prod. 2019, 215, 99–111. [CrossRef]
46. De Boer, J.; Schösler, H. Food and value motivation: Linking consumer affinities to different types of foodproducts. Appetite 2016, 103, 95–104. [CrossRef]
47. Sprotles, G.B.; Kendall, E.L. A Methodology for Profiling Consumers’ Decision-Making Styles. J. Consum.Aff. 1986, 20, 267–279. [CrossRef]
48. Hwang, J. Organic food as self-presentation: The role of psychological motivation in older consumers’purchase intention of organic food. J. Retail. Consum. Serv. 2016, 28, 281–287. [CrossRef]
49. Rana, J.; Paul, J. Consumer behavior and purchase intention for organic food: A review and research agenda.J. Retail. Consum. Serv. 2017, 38, 157–165. [CrossRef]
50. Martínez-Ruiz, M.P.; Gómez-Cantó, C.M. Key External Influences Affecting Consumers’ Decisions RegardingFood. Front. Psychol. 2016, 7, 1618. [CrossRef]
51. Lee, P.Y.; Lusk, K.; Mirosa, M.; Oey, I. The role of personal values in Chinese consumers’ food consumptiondecisions. A case study of healthy drinks. Appetite 2014, 73, 95–104. [CrossRef]
52. Tey, Y.S.; Arsil, P.; Brindal, M.; Liew, S.Y.; Teoh, C.T.; Terano, R. Personal values underlying ethnic food choice:Means-end evidence for Japanese food. J. Ethn. Foods 2018, 5, 33–39. [CrossRef]
53. Lang, M.; Lemmerer, A. How and why restaurant patrons value locally sourced foods and ingredients. Int. J.Hosp. Manag. 2019, 77, 76–88. [CrossRef]
54. Lusk, J.L. External validity of the food values scale. Food Qual. Prefer. 2011, 22, 452–462. [CrossRef]55. Lusk, J.L.; Briggeman, B.C. Food Values. Am. J. Agric. Econ. 2009, 91, 184–196. [CrossRef]56. Wood, S.L.; Moreau, C.P. From Fear to Loathing? How Emotion Influences the Evaluation and Early Use of
Innovations. J. Mark. 2006, 70, 44–57. [CrossRef]57. Levav, J.; Mcgraw, A.P. Emotional Accounting: How Feelings about Money Influence Consumer Choice.
J. Mark. Res. 2009, 46, 66–80. [CrossRef]58. Agrawal, N.; Duhachek, A. Emotional Compatibility and the Effectiveness of Antidrinking Messages: A
Defensive Processing Perspective on Shame and Guilt. J. Mark. Res. 2010, 47, 263–273. [CrossRef]59. Teixeira, T.; Wedel, M.; Pieters, R. Emotion-Induced Engagement in Internet Video Advertisements. J. Mark.
Res. 2012, 49, 144–159. [CrossRef]60. Berger, J.; Milkman, K.L. What Makes Online Content Viral? J. Mark. Res. 2012, 49, 192–205. [CrossRef]61. Poor, M.; Duhachek, A.; Krishnan, H.S. How Images of Other Consumers Influence Subsequent Taste
Perceptions. J. Mark. 2013, 77, 124–139. [CrossRef]62. Hsee, C.K.; Yang, Y.; Zheng, X.; Wang, H. Lay Rationalism: Individual Differences in using Reason versus
Feelings to Guide Decisions. J. Mark. Res. 2015, 52, 134–146. [CrossRef]63. Thompson, C.J.; Rindfleisch, A.; Arsel, Z. Emotional Branding and the Strategic Value of the Doppelgänger
Brand Image. J. Mark. 2006, 70, 50–64. [CrossRef]64. Strahilevitz, M.A.; Odean, T.; Barber, B.M. Once Burned, Twice Shy: How Naive Learning, Counterfactuals,
and Regret Affect the Repurchase of Stocks Previously Sold. J. Mark. Res. 2011, 48, S102–S120. [CrossRef]65. Lee, C.J.; Andrade, E.B. Fear, Social Projection, and Financial Decision Making. J. Mark. Res. 2011, 48,
S121–S129. [CrossRef]
217

Foods 2019, 8, 369 16 of 17
66. Golder, P.N.; Mitra, D.; Moorman, C. What is Quality? An Integrative Framework of Processes and States.J. Mark. 2012, 76, 1–23. [CrossRef]
67. Small, D.A.; Verrochi, N.M. The Face of Need: Facial Emotion Expression on Charity Advertisements. J. Mark.Res. 2009, 46, 777–787. [CrossRef]
68. Nielsen, J.H.; Shapiro, S.A.; Mason, C.H. Emotionality and Semantic Onsets: Exploring Orienting AttentionResponses in Advertising. J. Mark. Res. 2010, 47, 1138–1150. [CrossRef]
69. De Pelsmaeker, S.; Schouteten, J.J.; Gellynck, X.; Delbaere, C.; De Clercq, N.; Hegyi, A.; Kuti, T.; Depypere, F.;Dewettinck, K. Do anticipated emotions influence behavioural intention and behaviour to consume filledchocolates? Br. Food J. 2017, 119, 1983–1998. [CrossRef]
70. Wen, J.; Hu, Y.; Kim, H.J. Impact of individual cultural values on hotel guests’ positive emotions and positiveeWOM intention: Extending the cognitive appraisal framework. Int. J. Contemp. Hosp. Manag. 2018, 30,1769–1787. [CrossRef]
71. Io, M.-U. Understanding the effects of multi-dimensional tourism experiences on tourists’ positive emotionsand satisfaction in the context of casino hotels. Int. J. Cult. Tour. Hosp. Res. 2017, 11, 142–156. [CrossRef]
72. Williams, P.; Aaker, J.L. Can Mixed Emotions Peacefully Coexist? J. Consum. Res. 2002, 28, 636–649.[CrossRef]
73. Haws, K.L.; Winterich, K.P. When Value Trumps Health in a Supersized World. J. Mark. 2013, 77, 48–64.[CrossRef]
74. Aggarwal, P.; McGill, A.L. When Brands Seem Human, Do Humans Act Like Brands? Automatic BehavioralPriming Effects of Brand Anthropomorphism. J. Consum. Res. 2012, 39, 307–323. [CrossRef]
75. Sarstedt, M.; Hair, J.F.; Ringle, C.M.; Thiele, K.O.; Gudergan, S.P. Estimation issues with PLS and CBSEM:Where the bias lies! J. Bus. Res. 2016, 69, 3998–4010. [CrossRef]
76. Shmueli, G.; Ray, S.; Velasquez Estrada, J.M.; Chatla, S.B. The elephant in the room: Predictive performanceof PLS models. J. Bus. Res. 2016, 69, 4552–4564. [CrossRef]
77. Hair, J.; Hollingsworth, C.L.; Randolph, A.B.; Chong, A.Y.L. An updated and expanded assessment ofPLS-SEM in information systems research. Ind. Manag. Data Syst. 2017, 117, 442–458. [CrossRef]
78. Streukens, S.; Leroi-Werelds, S. Bootstrapping and PLS-SEM: A step-by-step guide to get more out of yourbootstrap results. Eur. Manag. J. 2016, 34, 618–632. [CrossRef]
79. Bagozzi, R.P.; Dholakia, U.M. Antecedents and purchase consequences of customer participation in smallgroup brand communities. Int. J. Res. Mark. 2006, 23, 45–61. [CrossRef]
80. Becker, J.-M.; Ismail, I.R. Accounting for sampling weights in PLS path modeling: Simulations and empiricalexamples. Eur. Manag. J. 2016, 34, 606–617. [CrossRef]
81. Diamantopoulos, A.; Papadopoulos, N. Assessing the cross-national invariance of formative measures:Guidelines for international business researchers. J. Int. Bus. Stud. 2010, 41, 360–370. [CrossRef]
82. Jarvis, C.B.; MacKenzie, S.B.; Podsakoff, P.M. A Critical Review of Construct Indicators and MeasurementModel Misspecification in Marketing and Consumer Research. J. Consum. Res. 2003, 30, 199–218. [CrossRef]
83. Hu, L.; Bentler, P.M. Fit indices in covariance structure modeling: Sensitivity to underparameterized modelmisspecification. Psychol. Methods 1998, 3, 424–453. [CrossRef]
84. Hu, L.; Bentler, P.M. Cutoff criteria for fit indexes in covariance structure analysis: Conventional criteriaversus new alternatives. Struct. Equ. Model. Multidiscip. J. 1999, 6, 1–55. [CrossRef]
85. Bentler, P.M.; Bonett, D.G. Significance tests and goodness of fit in the analysis of covariance structures.Psychol. Bull. 1980, 88, 588–606. [CrossRef]
86. Hair Rolph, E.A., Jr.; Barry, J.B.; William, C.B. Multivariate Data Analysis: A Global Perspective, 7th ed.; PearsonEducation: Upper Saddle River, NJ, USA, 2010; ISBN 978-0-13-515309-3.
87. Werts, C.E.; Linn, R.L.; Jöreskog, K.G. Intraclass Reliability Estimates: Testing Structural Assumptions. Educ.Psychol. Meas. 1974, 34, 25–33. [CrossRef]
88. Hair, J.F. (Ed.) A Primer on Partial Least Squares Structural Equation Modeling (PLS-SEM), 2nd ed.; Sage:Los Angeles, CA, USA, 2017; ISBN 978-1-4833-7744-5.
89. Fornell, C.; Larcker, D.F. Evaluating Structural Equation Models with Unobservable Variables andMeasurement Error. J. Mark. Res. 1981, 18, 39. [CrossRef]
90. Huang, C.-C.; Wang, Y.-M.; Wu, T.-W.; Wang, P.-A. An Empirical Analysis of the Antecedents and PerformanceConsequences of Using the Moodle Platform. Int. J. Inf. Educ. Technol. 2013, 3, 217–221. [CrossRef]
218

Foods 2019, 8, 369 17 of 17
91. Hair, F.J.; Sarstedt, M.; Hopkins, L.; Kuppelwieser, G.V. Partial least squares structural equation modeling(PLS-SEM): An emerging tool in business research. Eur. Bus. Rev. 2014, 26, 106–121. [CrossRef]
92. Esposito Vinzi, V.; Chin, W.W.; Henseler, J.; Wang, H. (Eds.) Handbook of Partial Least Squares: Concepts,Methods and Applications; Springer: Berlin/Heidelberg, Germany, 2010; ISBN 978-3-540-32825-4.
93. Evers, C.; Adriaanse, M.; de Ridder, D.T.D.; de Witt Huberts, J.C. Good mood food. Positive emotion as aneglected trigger for food intake. Appetite 2013, 68, 1–7. [CrossRef]
94. Jiang, Y.; King, J.M.; Prinyawiwatkul, W. A review of measurement and relationships between food, eatingbehavior and emotion. Trends Food Sci. Technol. 2014, 36, 15–28. [CrossRef]
95. Barone, M.J.; Rose, R.L.; Manning, K.C.; Miniard, P.W. Another Look at the Impact of Reference Informationon Consumer Impressions of Nutrition Information. J. Public Policy Mark. 1996, 15, 55–62. [CrossRef]
96. Bagozzi, R.P.; Dholakia, U.M.; Basuroy, S. How effortful decisions get enacted: the motivating role of decisionprocesses, desires, and anticipated emotions. J. Behav. Decis. Mak. 2003, 16, 273–295. [CrossRef]
© 2019 by the authors. Licensee MDPI, Basel, Switzerland. This article is an open accessarticle distributed under the terms and conditions of the Creative Commons Attribution(CC BY) license (http://creativecommons.org/licenses/by/4.0/).
219


Appendices
Appendice 4. Impact factor
Original article: Identifying research topics in marketing science along
the past decade: a content analysis.
Journal: Scientometrics
Impact Factor
2.77 2.71 2018 5 años
Categoría de JCR® Clasificación en la categoría Cuartil en la categoría
COMPUTER SCIENCE, INTERDISCIPLINARY APPLICATIONS
41 de 106 Q2
INFORMATION SCIENCE & LIBRARY SCIENCE
20 de 89 Q1
Datos de la edición 2018 de Journal Citation Reports
Editorial: SPRINGER, VAN GODEWIJCKSTRAAT 30, 3311 GZ DORDRECHT,
NETHERLANDS
ISSN: 0138-9130
eISSN: 1588-2861
Dominio de investigación: Computer Science
Information Science & Library Science
221

Doctoral Thesis
Héctor Hugo Pérez Villarreal
Original article. Testing Model of Purchase Intention for Fast Food in
Mexico: How do Consumers React to Food Values, Positive Anticipated
Emotions, Attitude toward the Brand, and Attitude toward Eating
Hamburgers?
Journal: Foods
Impact Factor
3.011 2018
Categoría de JCR® Clasificación en la categoría Cuartil en la categoría
FOOD SCIENCE & TECHNOLOGY
36 de 135 Q2
Datos de la edición 2018 de Journal Citation Reports
Editorial: MDPI, ST ALBAN-ANLAGE 66, CH-4052 BASEL, SWITZERLAND
ISSN: 2304-8158
Dominio de investigación: Food Science & Technology
222