Embed Size (px)
Citation preview

Analysis Effect of External Variables on System
Usage and User Satisfaction Using Technology
Acceptance Model
(Empirical Study on Bank Pekreditan Rakyat in Semarang City Region)
A THESIS
Submitted as one of the requirements
to complete the Undergraduate Program (S1)
on the Undergraduate Program Faculty of Economics
Diponegoro University
Submitted by:
STEFANUS ADRIAN WINARTO
C2C007124
FACULTY OF ECONOMICS
DIPONEGORO UNIVERSITY
SEMARANG
2011

ii
THESIS APPROVAL
Author Name : Stefanus Adrian Winarto
Student Number : C2C007124
Faculty/ Department : Economics/ Accounting
Thesis Title : Analysis Effect of External Variables on
System Usage and User Satisfaction Using
Technology Acceptance Model
Thesis Advisor : P. Basuki Hadiprajitno, MBA, M.Acc, Akt.
Semarang, March 2011
Advisor
(P. Basuki Hadiprajitno, MBA, M.Acc, Akt.
NIP 19610109 198803 1001
iii
Graduation Legalization
Author Name : Stefanus Adrian Winarto
Student Number : C2C007124
Faculty/ Department : Economics/ Accounting
Thesis Title : Analysis Effect of External Variables on
System Usage and User Satisfaction Using
Technology Acceptance Model (Case Study
on Bank Pekreditan Rakyat in Semarang
City Region)
Has been declared passed the examination on March 28, 2011
Examining Committee Member :
1. P. Basuki Hadiprajitno, MBA, M.Acc, Akt. (…………………………..)
2. Sudarno, M.Si., Ph.D., Akt. (…………………………..)
3. Tri Jatmiko Wahyu Prabowo, S.E., M.Si., Akt. (…………………………..)

iv
ORIGINALITY STATEMENT
I who undersigned below, Stefanus Adrian Winarto, declares that the
thesis with title: “Analysis Effect of External Variables on System Usage and
User Satisfaction Using Technology Acceptance Model” was my own writings. I
hereby state that in this paper there is no whole or partial text of others writings
that I took with copying or imitating in the form series of letters or symbols that
show the ideas or opinions or thoughts of another author, which I admit as if they
were my own writings, and/ or there is no part or all from the writings that I copy,
imitate, or that I took from the others writings without giving recognition of the
original authors.
If I do contrary acts like the statement above said, whether intentional or
not, I hereby declares that I will withdraw the thesis that I have submitted as my
own writing result. When it turned out that I copying or imitating the others
writing as if the ideas came from my own self, the academic title and bachelor
title which awarded by the university will be returned.
Semarang, March 17, 2011
Author,
Stefanus Adrian Winarto
NIM C2C007124

v
ABSTRACT
Advancement in the information system and technology has attracted both
small and large businesses to use accounting information system in order enhance
the financial information output which is produced by the system user. This
research is aimed to study the influence of external variables factor which
represented by top management support (TMS), training (TR), and user
involvement UI on information system (IS/ IT) acceptance in small scale business.
Indicator which often used to measure the success information system (IS/ IT)
implementation are IS/ IT acceptance through system usage and user satisfaction.
This acceptance indicator was developed by DeLone and McLean, later was used
by many information system (IS/ IT) researchers. This study based on Rouibah et
al. who built a model construct that link the external variables which consists of
top management support (TMS), training (TR), and user involvement (UI) on
system usage and user satisfaction through applying technology acceptance model
(TAM).
This research uses survey data from operational and financial department
of micro banking in Indonesia which known as Bank Pekreditan Rakyat (BPR).
The data is analyzed with structural equation model (SEM) to know the effect a
variable to another variable.
Analysis result finds that top management support both directly and
indirectly affects perceived usefulness, perceived ease of use, and system usage.
However, training is found only directly affects the user satisfaction. While user
involvement is found affects perceived ease of use and user satisfaction directly.
According the result perceived usefulness is found has higher influence towards
system usage than perceived ease of use. The other result, there is a significant
positive relation between system usage to user satisfaction which means
consistent with Rouibah et al. model.
Keywords: Accounting information systems, user acceptance of information
system, technology acceptance model, top management support,
training, user involvement

vi
ABSTRAK
Kemajuan dalam sistem informasi dan teknologi telah menarik perhatian
usaha kecil dan besar untuk menggunakan sistem informasi akuntansi dalam
rangka meningkatkan output informasi keuangan yang dihasilkan oleh pengguna
sistem. Penelitian ini bertujuan untuk mempelajari pengaruh faktor variabel
eksternal yang diwakili oleh dukungan manajemen puncak (TMS), pelatihan (TR),
dan keterlibatan pengguna UI pada penerimaan sistem informasi (SI / TI) pada
bisnis skala kecil. Indikator yang sering digunakan untuk mengukur diterimanya
sistem informasi (SI / TI) adalah sistem penggunaan sistem dan kepuasan
pengguna. Indikator penerimaan ini dikembangkan oleh delone dan McLean,
kemudian digunakan oleh banyak peneliti sistem informasi (SI / TI). Penelitian
pada riset ini didasarkan pada Rouibah, dkk. yang membangun model yang
menghubungkan variabel eksternal dukungan manajemen puncak (TMS),
pelatihan (TR), dan keterlibatan pengguna (UI) pada penggunaan sistem dan
kepuasan pengguna melalui model penerimaan teknologi (TAM).
Penelitian ini menggunakan survei data dari departemen operasional dan
keuangan pada mikro perbankan di Indonesia yang dikenal dengan nama Bank
Pekreditan Rakyat (BPR). Data dianalisis dengan model persamaan struktural
(SEM) untuk mengetahui pengaruh variabel ke variabel lain.
Hasil analisis menemukan ada efek langsung dan tidak langsung antara
hubungan dukungan manajemen puncak yang mempengaruhi persepsi kegunaan,
persepsi kemudahan penggunaan, dan penggunaan sistem. Namun, variabel
pelatihan ditemukan hanya mempengaruhi kepuasan pengguna secara langsung
dan tidak langsung. Sementara itu keterlibatan pengguna ditemukan
mempengaruhi persepsi kemudahan penggunaan dan kepuasan pengguna. Hasil
lainnya mengungkapkan bahwa persepsi kegunaan ditemukan memiliki pengaruh
yang lebih tinggi dengan penggunaan sistem daripada persepsi kemudahan
penggunaan. Penelitian ini juga menghasilkan ada hubungan positif yang
signifikan antara penggunaan sistem terhadap kepuasan pengguna yang berarti
konsisten dengan yang diusulkan Rouibah et al.
Keywords: Sistem informasi akuntansi, penerimaan sistem informasi, model
penerimaan teknologi, dukungan manajemen puncak, pelatihan,
keterlibatan pengguna

vii
ACKNOWLEDGEMENT
With humble, the author grateful to the savior Jesus Christ for blessing and
giving the author passions to complete this thesis with title “Analysis Effect of
External Variables on System Usage and User Satisfaction Using Technology
Acceptance Model.” This thesis intended to fulfill the requirement for
undergraduate program in accounting department on Faculty of Economics,
Diponegoro University.
There are many people who contributed to this thesis in variety of ways,
from giving me advice on the research to personal support during ongoing
research. Especially the author wants to say thank you to:
1. P. Basuki Hadiprajitno, MBA, M.Acc, Akt. as my thesis advisor who
gives much suggestion, advice, support and motivation when I conducted
this research.
2. Prof. Mohamad Nasir, M.Si., Ph.D., Akt. as dean on faculty of economics
Diponegoro University.
3. Prof. Dr. Muchamad Syafruddin, M.Si., Akt. as head of accounting
department on Faculty of Economics, Diponegoro University.
4. Surya Rahardja, SE, M.Si, Akt. as my lecture advisor.
5. Lecturers and staffs on Faculty of Economics, Diponegoro University.
6. My beloved parents, F.X Edy S and Endang S who always give me love,
support, and pray for me. Thank you for your care to me, you are the best
parents in my life.

viii
7. My best friends in faculty of economics. Huala Jackson P (La. PT/ TPX/
napodoan), Hari Suryono (kusumawardhani, sumiyatun), Ariawan Aji
(bebek), Hari Utomo (tom, M.U.L), Tangguh (koteng), Yosua (si Josh),
Adi (uno), Arie W, Lencoung Girls, William (adjubs), Anto, Teye, Timo,
and others friend that I cannot mention one by one. Thank you for your
friendship as long as we together.
8. All people who contributed to this thesis completion that I can’t mentioned
one by one.
The author realizes this thesis is far away from perfect. Therefore if there
are any errors in this thesis as well as shortcomings, the author accept criticism
and constructive suggestions to perfect this research. Finally, the author hope this
thesis may be useful for related society, institution and others researcher.
Semarang, March 2011
Author
ix
TABLE OF CONTENTS
Page
TITLE PAGE ..................................................................................................... i
APPROVAL PAGE ........................................................................................... ii
GRADUATION LEGALIZATION PAGE ....................................................... iii
ORIGINALITY STATEMENT ......................................................................... iv
ABSTRACT ....................................................................................................... v
ABSTRAK ......................................................................................................... vi
ACKNOWLEDGEMENT ................................................................................. vii
TABLE OF CONTENTS ................................................................................... ix
LIST OF TABLES ............................................................................................. xii
LIST OF FIGURES ........................................................................................... xiii
LIST OF APPENDIX ........................................................................................ xiv
CHAPTER I INTRODUCTION ........................................................................ 1
1.1. Background ................................................................................................. 1
1.2. Problem Formulation .................................................................................. 6
1.3. Research Objectives .................................................................................... 7
1.4. Research Purpose ........................................................................................ 8
1.5. Structure of This Thesis .............................................................................. 8
CHAPTER II LITERATURE REVIEW ............................................................ 11
2.1. Underlying Theories and Previous Research .............................................. 11
2.1.1 Expectancy Theories .......................................................................... 11
2.1.2 Technology Acceptance Model ......................................................... 12
2.1.3 Perceived Usefulness ......................................................................... 14
2.1.4 Perceived Ease of Use ........................................................................ 15
2.1.5 Variance of External Variables in TAM ............................................ 16
2.1.6 The Relationship between Data, Information, and System ................ 17
2.1.7 Accounting Information System Role in Business ............................ 20
2.1.8 Computer Based Accounting Information System ............................ 22
2.1.9 Previous Researches ........................................................................... 23
2.2. Theoretical Framework ............................................................................... 32
2.3. Hypothesis Development ............................................................................ 34
2.3.1 Effect of Top Management Support on Perceived Usefulness,
Perceived Ease of Use, System Usage, and User Satisfaction .......... 34
2.3.2 Effect of Training on Perceived Usefulness, Perceived Ease of
Use, System Usage, and User Satisfaction ........................................ 35
2.3.3 Effect of User Involvement on Perceived Usefulness, Perceived
Ease of Use, System Usage, and User Satisfaction ........................... 37
2.3.4 Effect of Perceived Usefulness, and Perceived Ease of Use on
System Usage and User Satisfaction, and Effect of Perceived Ease
of Use on Perceived Usefulness ........................................................ 38
2.3.5 Effect of System Usage on User Satisfaction .................................... 39
CHAPTER III RESEARCH METHOD ............................................................ 41

x
3.1 Research Variables and Operational Definition ........................................... 41
3.1.1 Top Management Support .................................................................. 41
3.1.2 Training .............................................................................................. 42
3.1.3 User Involvement ............................................................................... 43
3.1.4 Perceived Usefulness ......................................................................... 44
3.1.5 Perceived Ease of Use ........................................................................ 46
3.1.6 System Usage ..................................................................................... 47
3.1.7 User Satisfaction ................................................................................ 48
3.2 Population and Sample Determination ........................................................ 48
3.3 Data Types and Sources ............................................................................... 49
3.4 Data Collection Method ............................................................................... 50
3.5 Analysis Method .......................................................................................... 51
3.5.1 Descriptive Statistic ........................................................................... 51
3.5.2 Hypothesis Test .................................................................................. 51
CHAPTER IV RESULT AND ANALYSIS ...................................................... 53
4.1 Research Object Description ........................................................................ 53
4.2 Descriptive Analysis .................................................................................... 55
4.3 Path Diagram ................................................................................................ 57
4.4 Confirmatory Factor Analysis and Construct Validity ................................ 60
4.4.1 Convergent Validity ........................................................................... 60
4.4.2 Variance Extracted ............................................................................. 62
4.4.3 Construct Reliability .......................................................................... 63
4.4.4 Discriminant Validity ......................................................................... 64
4.4.5 Squared Multiple Correlations Analysis ............................................ 65
4.5 Assessing Goodness of Fit ........................................................................... 66
4.6 Hypothesis Test ............................................................................................ 68
4.6.1 Effect of Top Management Support on Perceived Usefulness,
Perceived Ease of Use, System Usage, and
User Satisfaction ................................................................................ 68
4.6.2 Effect of Training on Perceived Usefulness, Perceived Ease
of Use, System Usage,and User Satisfaction ..................................... 69
4.6.3 Effect of User Involvement on Perceived Usefulness,
Perceived Ease of Use, System Usage, and User
Satisfaction ........................................................................................ 70
4.6.4 Effect of Perceived Usefulness, and Perceived Ease of Use on
System Usage, and User satisfaction, and
Effect of Perceived Ease of Use on Perceived Usefulness ................ 70
4.6.5 Effect of System Usage on User Satisfaction .................................... 71
4.7 Effect between Variables ............................................................................. 72
4.8 Discussion .................................................................................................... 73
4.8.1 Effect of Top Management Support on Perceived Usefulness,
Perceived Ease of Use, System Usage, and User Satisfaction .......... 73
4.8.2 Effect of Training on Perceived Usefulness, Perceived Ease of
Use, System Usage, and User Satisfaction ........................................ 74
4.8.3 Effect of User Involvement on Perceived Usefulness, Perceived
Ease of Use, System Usage, and User Satisfaction ........................... 74

xi
4.8.4 Effect of Perceived Usefulness and Perceived Ease of Use on
System Usage and User Satisfaction, and Effect of
Perceived Ease of Use on Perceived Usefulness ............................... 75
4.8.5 Effect of System Usage on User Satisfaction .................................... 76
CHAPTER V CONCLUSION ........................................................................... 78
5.1 Conclusion ................................................................................................... 78
5.2 Limitation ..................................................................................................... 80
5.3 Implication and Suggestion .......................................................................... 81
REFERENCES ................................................................................................... 82
APPENDIX ........................................................................................................ 86

xii
LIST OF TABLES
Page
Table 2.1 Variance of External Variables .......................................................... 16
Table 2.2 List of Previous Researchers .............................................................. 29
Table 4.1 List of Respondents ............................................................................ 53
Table 4.2 Questionnaires Detail ......................................................................... 54
Table 4.3 Descriptive Statistic ........................................................................... 55
Table 4.4 Standardized Regression Weight of Full Structural Model ............... 60
Table 4.5 Variance Extracted Result of Full Structural Model .......................... 62
Table 4.6 Construct Reliability Result of Full Structural Model ....................... 63
Table 4.7 AVE and AVE Square Root of Full Structural Model....................... 64
Table 4.8 Correlations of Latent Construct and AVE Square Root ................... 65
Table 4.9 Squared Multiple Correlations Analysis ............................................ 65
Table 4.10 Full Structural Model Goodness of Fit ............................................ 68
Table 4.11 Result of Regression Weight for Effect of Top Management
Support on Perceived Usefulness, Perceived Ease of Use, System
Usage, and User Satisfaction ........................................................... 69
Table 4.12 Result of Regression Weight for Effect of Training on
Perceived Usefulness, Perceived Ease of Use, System
Usage and User Satisfaction .............................................................. 69
Table 4.13 Result of Regression Weight for Effect of User Involvement
on Perceived Usefulness, Perceived Ease of Use, System Usage,
and User Satisfaction ......................................................................... 70
Table 4.14 Result of Regression Weight for Effect of Perceived Usefulness,
and Perceived Ease of Use on System Usage and
User Satisfaction and Effect of Perceived Ease of Use on Perceived
Usefulness .......................................................................................... 71
Table 4.15 Result of Regression Weight for Effect of System
Usage on User Satisfaction ................................................................ 71
Table 4.16 Standardized Indirect Effects ........................................................... 72
Table 4.17 Standardized Direct Effects ............................................................. 72
Table 4.18 Standardized Total Effects ............................................................... 72

xiii
LIST OF FIGURES
Page
Figure 2.1 Technology Acceptance Model ........................................................ 13
Figure 2.2 Relations between Data and Information ......................................... 17
Figure 2.3 Accounting Information System Process.......................................... 22
Figure 2.4 Theoretical Framework ..................................................................... 33
Figure 4.1 Structural Mode ................................................................................ 58
Figure 4.2 Output of Structural Model Estimation ............................................ 59
Figure 4.3 Full Structural Model ........................................................................ 67

xiv
LIST OF APPENDIX
Page
APPENDIX A RESULT OF SPSS OUTPUT ................................................... 86
APPENDIX B RESULT OF AMOS OUTPUT ................................................. 87
APPENDIX C FORMAT OF THE QUESTIONNAIRES ................................ 100
APPENDIX D PROOF OF CONDUCTING RESEARCH ............................... 107

1
CHAPTER I
INTRODUCTION
1.1. Background
Business organizations, foreign and domestic, large and small need to be
competitive in the global marketplace (Merchant, 2007). The business
organizations seek new ways to manage their business toward global competition
with other companies (Merchant, 2007). One of them is how the business
organizations should manage their financial information. Nowadays, with the
advance development in the information system (IS) or information technology
(IT) many companies have changed the way to manage information, especially
financial information that using computer/ technology based information system.
Venkatesh (2000), Wixom and Todd (2005), and Selamat et al. (2009)
explained that successful in IT investment can lead to enhanced productivity,
while failed systems can lead to undesirable consequences such as financial losses
and dissatisfaction among employees. Hence information system (IS) and
information technology (IT) considered as competitive advantage which have an
important role towards businesses (Rouibah et al., 2009). Rouibah et al. (2009)
argued that a competitive advantage occurs from IS/IT utilization, not the IS/IT
solution. Similarly, Agarwal and Prasad (in Ramayah and Jantan, 2002) argued
systems that are not utilized do not result in expected efficiency and effectiveness
gains.
2
The continues development of information system and technology which
never stop make many researches about information system became subject of
much debate among information system researchers (Davis, 1989; Igbaria et al,
1995; Venkatesh, 2000; Rouibah et al, 2009). Much of these researches
highlighted human factors which are influenced by other factors like individual
perception, and other external factors. Many researchers studied these factors
through the user attitudes toward the system. User attitudes can be known from
the acceptance level of a new information system which is implemented in the
business organizations (Selamat et al., 2009). Igbaria et al. (1995) also mentioned
that the focus of IS implementation research is to examine the factors affecting
user acceptance of computer technology. Rouibah et al. (2009) defined IS/ IT
acceptance as the potential user`s predisposition toward personally using a
specific system and being satisfied about it.
DeLone and McLean (1992) mentioned that the success of IS which
implemented can be measured at different levels, including the technical level, the
semantic level, and the effectiveness level. DeLone and McLean (1992) defined
the technical level as the accuracy and efficiency of the system which produces
the information, the semantic level as the success of the information in conveying
the intended meaning, and the effectiveness level as the effect of the information
on receiver.
Seddon, Staples, Patnayakuni and Bowtell (in Urbach, 2009) stated to
measure the IS success depends on the type of system being evaluated. In order to
evaluate, multiple models were constructed by many researchers. Several

3
researchers like Delone and Mclean (1992), Soegiharto (2001), Komara (2005),
Briggs et al. (2008), Rouibah and Hamdy (2009), Lee et al. (2009) suggested
there are two most commonly used as the measure of user acceptance towards
information system, they are system usage (SU) and user satisfaction (US). Both
system usage (SU) and user satisfaction (US) measurement based on the attitudes
of information system user towards the system which being used by them.
Further researches found system usage (SU) and user satisfaction (US)
were linking each other. Rouibah and Hamdy (2009) suggest three models for the
relationship between system usage (SU) and user satisfaction (US): (a)
satisfaction and usage are not related, (b) satisfaction influences usage, and (c)
usage influences satisfaction. In the study between the relation system usage and
user satisfaction, the relation among the models must be further investigated
because the causal relationship was influenced by many external factors and its
various among researchers. In order linking the external factors with system usage
(SU) and user satisfaction (US), usually researchers used a well grounded theory
such Theory of Research Action (TRA), Theory of Planned Behavior (TPB) and
the Technology Acceptance Model (TAM).
Among of the three theories which mentioned above technology
acceptance model (Davis, 1989) is the most commonly used because of its
understandability and simplicity (Legris et al., 2003), explains much of the
variance in users’ behavioral intention related to IT adoption and usage across a
wide variety of context (Taylor and Todd, 1995). This model is implemented
because the decision made by an individual to accept information system and
4
technology is a conscious act that can be explained and predicted (Jogiyanto,
2007). Technology acceptance model (TAM) is an acceptance model of
information system and technology which used two kinds perceived of the user.
There are two mediating factors: Perceived Ease-of-Use (PEOU) and Perceived
Usefulness (PU), which have been reported to mediate the effect of several
external factors on IS/IT usage and US (Rouibah and Hamdy, 2009; Lee et al.,
2009).
Since the original TAM was made by Davis in 1989, TAM can be tested in
various ways with the wide selection of external variables and choice of
dependant variables with different subjects, work-setting and different technology
features across the globe (Seyal and Rahman, 2007). The variation of external
variables can be seen on literature review done by Yousafzai et al. (2007).
Yousafzai et al. (2007) grouped the variables into four groups: organizational
characteristics, system characteristic, user personal characteristics, and other
variables. According to Rouibah et al. (2009) the variation external factors is
differ depending on the cultural society and the business environment. This was
also has been proved by Rai et al. (2002) that the dependent variables can be
variance along with advancement of era, development of technology, and human
needs. In this research three organizational factors which consists of top
management support (TMS), user involvement (UI), and training (TR) is used.
Three organizational factors top management support (TMS), user
involvement (UI), and training (TR) are chosen because these three factors were
found less received attention and very few studies examined the simultaneous
5
effect of these organization factors (TR, TMS and UI) on IS/IT acceptance, hence
the result is still unknown that the presence of UI, TMS, and TR impact other
variables (Rouibah et al., 2009).
The researches of information system have been widely applied. However,
much of the researches were using large or macro business organizations. There
were little researches which conducted in small or micro business organizations.
As the fact, information system is not only used by large business but also the
small ones (Ashari, 2008). One of the businesses which often related with the high
use of information system is banking sectors. Indonesian micro banking as known
as Bank Pekreditan Rakyat also start changed the manual system in accounting
with computer based system. With the changing in the new implemented of the
accounting information system need to be known that the system will create a
competitive advantage through the successful or otherwise will cause the failure.
The better quality of information system is important for banking sectors
since its need more carefully due to make decisions since they carry out public
funds. In order to be effectively and efficiently, sectors banking applying AIS to
record transactions, observe data to make report that will influence decisions
about credit policies, and many more. However, users who use of new information
system often got several problems because the complexity of the system.
Therefore accounting information system which has been implemented to support
their activity should be measure in order to know about the information system is
successful or not. Based on the above description, the author conducts a research

6
about "Analysis Effect of External Variables on System Usage and User
Satisfaction Using Technology Acceptance Model.”
1.2. Problem Formulation
Business organizations whether foreign and domestic, large and small need
to be competitive in the global marketplace (Merchant, 2007). The use of
information system organization can creates competitive advantage against the
rivals (Rouibah and Hamdy, 2009). The succession implementing IS enhanced
productivity, while failed systems can lead to undesirable consequences such as
financial losses and dissatisfaction among employees (Venkatesh, 2000; Wixom
and Todd, 2005; Selamat et al., 2009)
There are many models to measure IS success, two that commonly used are
SU and US (Rouibah et al., 2009). Using TAM which mediated by perceived ease
of use (PEOU), and perceived usefulness (PU), Rouibah et al. (2009) studied
about the relationship of SU and US with three organizational variables: Top
Management Support (TMS), User Involvement (UI), and User Training (UT).
This study is conducted with replicating on Rouibah et al. (2009) that found those
variables affect each other. This research takes sample on Bank Pekreditan Rakyat
in the Semarang City Region, Indonesia. Based on this, the author makes problem
formulation as follows:
1. Does user involvement affect user satisfaction and system usage via
perceived usefulness and perceived ease of use or directly?
7
2. Does top management support affect user satisfaction and system usage via
perceived usefulness and perceived ease of use or directly?
3. Does user training affect user satisfaction and system usage via perceived
usefulness and perceived ease of use or directly?
4. Does perceived usefulness affect user satisfaction via system usage or
directly?
5. Does perceived ease of use affect user satisfaction via perceived usefulness
and system usage or directly?
6. Does system usage affect user satisfaction directly?
1.3. Research Objectives
Based on the background and problem formulation that have been
described previously, this research is aimed to study the influence of external
variables factor which represented by top management support (TMS), training
(TR), and user involvement (UI) on IS/IT usage and satisfaction in micro banking
sector. According to problem formulation, this research has objectives as follows:
1. To test the effect of user involvement on user satisfaction and system usage,
perceived usefulness, and perceived ease of use.
2. To test the effect of top management support on user satisfaction and system
usage, perceived usefulness, and perceived ease of use.
3. To test the effect of training on user satisfaction and system usage, perceived
usefulness, and perceived ease of use.
8
4. To test the effect of perceived usefulness on user satisfaction and system
usage.
5. To test the effect of perceived ease of use on user satisfaction, system usage,
and perceived usefulness.
6. To test the effect of system usage on user satisfaction.
1.4. Research Purpose
The purpose of this research is based on background, problem formulation,
and research purpose. This research has several purposes, such as:
1. For researchers, this study is part of the learning process that is expected to
increase understanding of the complexity factors that influence the
performance of accounting information systems within one organization.
2. For management of the micro banking, the result of this study is expected to
be useful as an evaluation on the company's accounting information system
which is used in the work place through the acceptance level of the
accounting information system.
3. For academics, the result is expected to provide an input in the research field
of accounting information system in Indonesia. Especially, because there is
few researches which use two kinds perceive in TAM as mediating factor to
study the causal relation between external variables and user acceptance.
1.5. Structure of This Thesis
CHAPTER I : INTRODUCTION

9
This chapter consists of background which explains about the
determinant factors that will affect on user satisfaction and system
use of Accounting Information System (AIS), problem
formulation, the purpose of the research, research benefit, and the
structure of this thesis.
CHAPTER II : LITERATURE REVIEW
This chapter consists of theories that use as research basis such as
expectancy theories, and TAM. Despite explain the theories, this
chapter also explains the previous researches which relate with
TAM to user satisfaction and system use, conceptual framework,
and the hypothesis development.
CHAPTER III : RESEARCH METHODS
This chapter explains about research design, type and source of
data, data collect method, research object, and data analysis. This
research use quantitative approach with structural equation
method (SEM) that is applied using AMOS 6 software.
CHAPTER IV : RESULT AND ANALYSIS
This chapter explains about the research object, descriptive
analysis, data analysis that consists of measures the goodness fit
of the model, confirmatory factor analysis, and regression weight
analysis to measure how far a variable affect another variable.
Further in this chapter explain about the hypothesis that are
proposed in this research.

10
CHAPTER V : CONCLUSION
This chapter consists of conclusion which found from the analysis
result, research limitation in this research, and implication and
suggestion for further research.

11
CHAPTER II
LITERATURE REVIEW
2.1. Underlying Theories and The Previous Researches
2.1.1. Expectancy Theory
According to Vroom (in Issac et al., 2001) expectancy theories based on
people who consciously choose particular courses of action, based upon
perceptions, attitudes, and beliefs, as a consequence of their desires to enhance
pleasure and avoid pain. Expectancy theory also called theory of motivation
because it emphasizes individual perceptions of the environment and subsequent
interactions arising as a consequence of personal expectation (Issac et al., 2001).
The expectancy theories itself relies upon extrinsic motivators to explain
causes for behaviors exhibited in the workplace Leonard (in Issac et al., 2001).
The motivations for employer determine affective and behavioral reactions in
numerous situations (Eveleth and Stone, 2008). Based on this theory, three
organizational variables which are used in this research is the determinant
motivation which influences the user of information system to accept the
information system. When business implemented information system, the
motivation to use system in the business is non-volitional but is mandatory. This
means that an employee may not be required to use the system but the influences
in the workplace itself suggest the employee should use it (Eveleth and Stone,
2008).

12
According to Issac et al. (2001) individual in the workplace feels
motivated when three conditions are perceived:
1. The personal expenditure of effort will result in an acceptable level of
performance (expectancy)
2. The performance level achieved will result in a specific outcome for the
person (instrumentality)
3. The outcome attained is personally valued (valence)
2.1.2. Technology Acceptance Model
The technology acceptance model (TAM) was originally formulated by
Davis in 1986. TAM is one of the most widely model that used to test technology
acceptance. The TAM adapted Ajzen and Fishbein’s (1980) theory of reasoned
action (TRA) to explain the causal relationship between users, internal beliefs
(usefulness and ease of use), attitude, intentions, and computer usage behavior
(Davis et al., 1989).
Technology acceptance model (TAM) has two primary construct:
perceived usefulness (PU) and perceived ease of use (PEOU). TAM argued that
individual acceptance toward information systems technology is determined by
both of the construct (Jogiyanto, 2007).
Both of perceived usefulness (PU) and perceived ease of use (PEOU) have
influence to behavioral intention. The user of IS/ IT will intend to use technology
if the user feels the technology will useful for them and they feel easy to use it.
Despite that, perceived ease of use (PEOU) also influencing perceived usefulness

13
(PU) but not vice versa. The user will use the system whether the system is easy
to use or not as long as the system usefulness for them (Jogiyanto, 2007).
The original TAM is shown in Figure 2.1. The originally TAM use five
primary construct:
1. Perceived usefulness
2. Perceived ease of use
3. Attitude towards behavior or attitude towards using technology
4. Behavioral intention or behavioral intention to use
5. Behavior or actual technology use
Figure 2.1
Technology Acceptance Model
Source: Davis et al. (1989)
In order to apply the technology acceptance context, it is necessary to
measure attitudes and beliefs regarding the use of technology rather than attitude
and beliefs directed towards the technology itself, since individuals might hold a
positive view about a technology without being favorably disposed towards its use
(Yousafzai et al., 2007).
External Variables
PU
PEOU
Attitude Behavioral Intention Actual Behavior

14
Chau, Hu et al., Mathieson, Szajna (in Yousafzai et al., 2007) mentioned
that the widespread popularity of the TAM is broadly attributable to three factors:
(1) it is parsimonious, IT-specific, and is designed to provide an adequate
explanation and prediction of a diverse user population’s acceptance of a wide
range of systems and technologies within varying organizational and cultural
contexts and expertise levels; (2) it has a strong theoretical base and a well
researched and validated inventory of psychometric measurement scales, making
its use operationally appealing; and (3) it has accumulated strong empirical
support for its overall explanatory power and has emerged as a pre-eminent model
of users acceptance of technology.
2.1.3. Perceived Usefulness
Davis et al. (1989) defined PU as the degree to which an individual
believes that using the system will enhance his job performance. The definition
means people who using computers in the workplace would increase their
productivity, improve job performance and enhance job effectiveness and
usefulness. When the user believes using information system is useful then the
user will use the system because the system gives benefit to them. Conversely, if
the user beliefs the system not useful, the user would not use it (Jogiyanto, 2007).
Previous researches have showed that construct of perceived usefulness
influence significantly positive towards the user of information system (e.g.
Davis, 1989; Igbaria et al., 1995; Rouibah et al., 2009). Igbaria et al., (1995)
studied the effect of perceived usefulness on usage in a field study of Finnish
computer users. The result was found strong relationships between perceived

15
usefulness and usage. Previous research also showed that perceived usefulness
was constructs the most significant and important which influences attitude,
behavioral intention, and behavior (Jogiyanto, 2007).
2.1.4. Perceived Ease of Use
According to TAM, PEOU is a major factor that affects acceptance of
information system (Davis et al, 1989). PEOU is defined as the degree to which
an individual believes that using computer or computerized system will be free
from physical and mental efforts (Davis et al, 1989). From the definition can be
known perceived ease of use is a user belief which means with using information
and technology their task will be easier. Hence perceived ease of use is more
likely to be accepted by users and the more complex a technology is perceived as
being, the slower will be its rate of adoption (Yousafzai et al., 2007).
Previous researches showed tht the construct of paerceived ease of use iis
influencing on perceived usefulness, attitude, behavioral intention, and behavior.
Igbaria et al. (in Yousafzai et al., 2007) examined the factors affecting personal
computer acceptance in small firms in New Zealand. As the result, among these
factors, perceived ease of use was found directly influence personal computer
acceptance. The findings indicate that perceived ease of use is a dominant factor
in explaining perceived usefulness and system usage and it was also found that
perceived usefulness is a strong antecedent of system usage. Other research by
Sanchez et al. (in Yousafzai et al., 2007) also found the relationship between
PEOU and PU was significant and positively related. The conclusion can be
drawn the more complex system it will be useless.

16
2.1.5. Variance of External Variables in TAM
There are many external variables which can be used with TAM.
Yousafzai et al. (2007) conducts a meta-analysis to combine the previous TAM
researches. The first external variable added to the TAM was output quality Davis
et al., in 1992, and since then researchers have proposed more than 70 external
variables for PU and PEOU. Yousafzai et al. (2007) divided these external
variables into four categories of organizational, system, user`s personal
characteristics, and other variables. The variance of external variables can be seen
in table 2.1
Table 2.1
Variance External Variables
Organizational
Characteristic
System
Characteristic
User Personal
Characteristic Other Variables
Competitive
Environment Accessibility Age
Argument for
Change
End User Support Access Cost Awareness Cultural Affinity
Group`s
Innovativeness
Norm
Comparability Cognitive Absorption
External
Computing
Support
Implementation
Gap
Confirmation
Mechanism Computer Anxiety
External
Computing
Training
Internal Computing
Support Convenience Computer Attitude
Facilitating
Condition
Internal Computing
Training Image/ Interface Computer Literacy Subjective Norms
Job Insecurity Information Quality Educational level Situational
Normality
Management
Support Media Style Experience Social Influence
Organizational
Policies Navigation Gender Social Pressure
Organizational
Structure Objective Usability Intrinsic Motivation
Task Technology
Fit
Organizational
Support Output Quality
Involvement
(Situational/ Intrinsic)
Task
Characteristic
Organizational Perceived Personality Vendor`s Co-

17
Usage Attractiveness operation
Peer Influence Perceived
Complexity
Perceived Developer`s
Responsiveness
Peer Usage Perceived
Importance Perceived Enjoyment
Training Perceived Software
Correctness Perceived Playfulness
Transactional
Support Perceived Risk Perceived Resources
Relevance With Job
Personal
Innovativeness Role
with Technology
Reliability and
Accuracy Self Efficacy
Response Time Shopping Orientation
Result
Demonstrability Skills and Knowledge
Screen Design Trust
Social Presence Tenure in Work Force
System Quality Voluntariness
Terminology
Trialability
Visibility
Web Security
Source: Yousafzai et al. (2007)
As can be seen the proposed external variables in this research are
organization characteristic. This means, the variables are exhibited from
workplace as the place that the user used the system. This variables occurs from
the environment of the business organization to influence the user.
2.1.6. The Relationship Between Data, Information, and System
Figure 2.2
Data and Information Relation
Source: Wilkinson (1989)
Processing steps (within
information system)
Data
(Input
)
Information
(Output)

18
Data and information are related each other in order to produce
information through process in the information system, see figure 2.2. Wilkinson
(1989) defined data are the raw facts and figures and even symbols that together
form the inputs to an information system. Data also can be defined into facts or
figures in raw form (Gelinas and Dull, 2008).
Data are facts that are collected, recorded, stored, and processed by an
information system. Data usually represent observations or measurements of
business activities that are of importance to information system users. According
to Romney and Steinbart (2009) several kinds of data need to be collected in
business, such as:
1. Facts about the activities that take place,
2. The resources affected by the activities, and
3. The people who participate in the activity
In order to make data become useful, data must be transformed to
information through any information systems. Accounting Information System
(AIS) is Information system that process data to become useful information.
Information serves as the basis for making decisions and taking action
(Wilkinson, 1989). Arnold and Hope (1990) also stated that information is
essentially financial and mainly used for the purpose of decision making,
supervision and implementation of corporate decisions. The information has
value to the decision maker because it reduces uncertainty and increases
knowledge about a particular area of concern (Gelinas and Dull, 2008). Good
information must have standards before information can be called into useful

19
information. Romney and Steinbart (2009) categorized this into seven
characteristic, they are:
1. Relevant
Information is relevant if it reduces uncertainty, improves decision makers’
ability to make predictions, or confirms or corrects their prior expectation.
2. Reliable
Information is reliable if it is free from error or bias and accurately represents
the events or activities of the organization.
3. Complete
Information is complete if it does not omit important aspects of the
underlying events or activities that it measures
4. Timely
Information is timely if it provided in time for decision makers to make
decisions
5. Understandable
Information is understandable if it is presented in a useful and intelligible
format
6. Verifiable
Information is verifiable if two knowledgeable people acting independently
would each produce same information
7. Accessible
Information is accessible if it is available to users when they need it and in a
format they can use.

20
According to Wilkinson (1989) system is an integrated entity that attempts
to achieve a set of objectives. Hall (2008) defined a system is a group of two or
more interrelated components or subsystems that server a common purpose.
Wilkinson (1989) defined a system is a unified group of interacting parts function
together to achieve it purposes. Gelinas and Dull (2008) defined a system is a set
of interdependent elements that together accomplished specific objectives.
Romney, and Steinbart (2009) defined a system is a set of two or more interrelated
components that interact to achieve a goal. The goal or objectives itself is to
provide useful information from the data.
2.1.7. Accounting Information System Role in Business
There are many definitions of AIS, but the primary goal is same. Bodnar
and Hopwood (2004) defined Accounting information system (AIS) is a collection
of resources, such as human and equipment, designed to change the financial data
and other data into information. Hall (2008) defined AIS as a group of two or
more components of interrelated or subsystems that come together to achieve
common purpose. Gelinas and Dull (2008) defined AIS as specialized subsystem
of the IS to collect, process, and report information related to the financial aspects
of business events. Romney and Steinbart (2009) defined AIS as a system that
collects, records, stores, and processes data to produce information for decision
makers.
Accounting information is classified into three types: (1) operation
information, (2) management accounting information, and (3) financial
accounting information (Anthony & Reece, 1989).

21
1. Operating Information
This information provides the raw data for the information of financial
accounting and management accounting information. The information contained
in the manufacturing company operations includes: production information,
purchase information and use of raw materials, payroll information, sales
information, etc. (Wilkinson, 1989).
2. Management Accounting Information
According to Anthony and Reece (1989) accounting information that
specifically addresses for management is called management accounting
information. This information is used in three management functions, namely: (1)
planning, (2) implementation, (3) control.
Management accounting information is presented to the company
management in various reports, such as budgets, sales reports, production cost
reports, cost reports according to responsibility center, cost reports according to
activity, and others.
3. Financial Accounting Information
Financial accounting information used by both company managers and
external parties, with aim to provide information concerning the financial
position, performance and financial changes in an enterprise that benefits a large
number of users in making economic decisions (Wilkinson, 1989).
Financial accounting information to outside parties presented in the
financial statements consisting of balance sheet, income statement, and statement
of retained earnings, statement of cash flows. In order to make data become
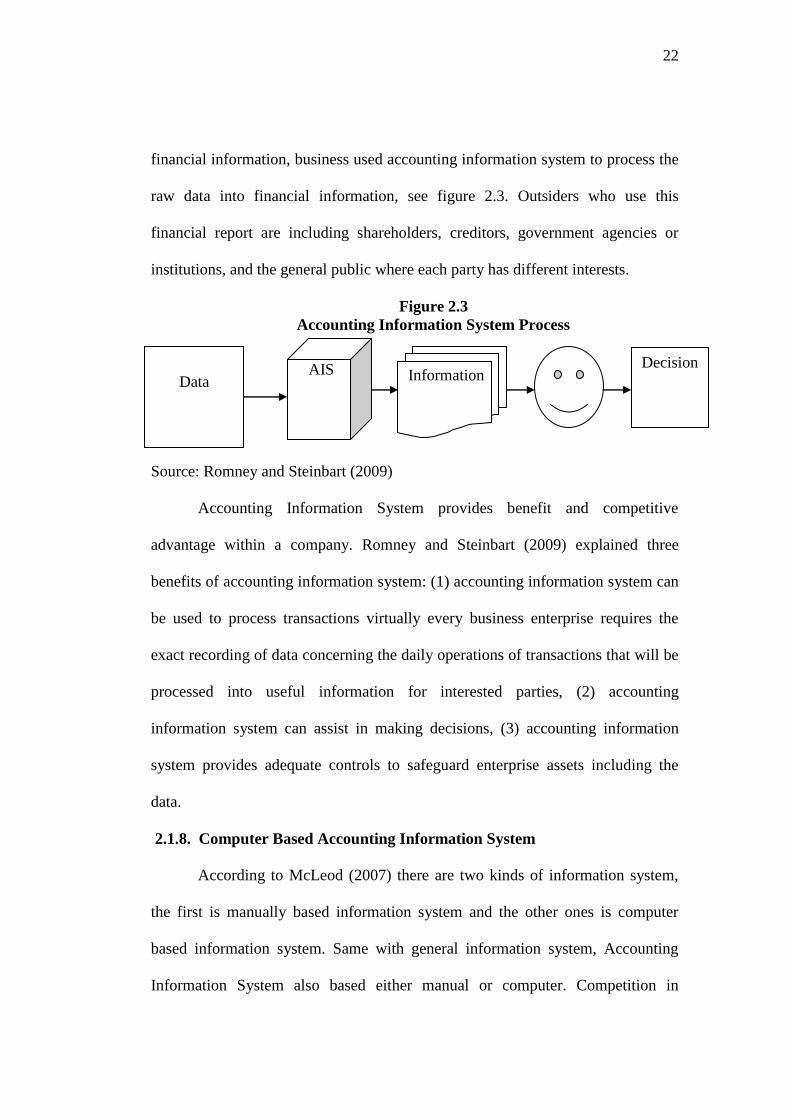
22
financial information, business used accounting information system to process the
raw data into financial information, see figure 2.3. Outsiders who use this
financial report are including shareholders, creditors, government agencies or
institutions, and the general public where each party has different interests.
Figure 2.3
Accounting Information System Process
Source: Romney and Steinbart (2009)
Accounting Information System provides benefit and competitive
advantage within a company. Romney and Steinbart (2009) explained three
benefits of accounting information system: (1) accounting information system can
be used to process transactions virtually every business enterprise requires the
exact recording of data concerning the daily operations of transactions that will be
processed into useful information for interested parties, (2) accounting
information system can assist in making decisions, (3) accounting information
system provides adequate controls to safeguard enterprise assets including the
data.
2.1.8. Computer Based Accounting Information System
According to McLeod (2007) there are two kinds of information system,
the first is manually based information system and the other ones is computer
based information system. Same with general information system, Accounting
Information System also based either manual or computer. Competition in
Data AIS Information
Decision

23
businesses have made many companies left the manually ways into computer or
technology based information system.
Computerizing AIS changed the character of the component become
automatically. However this can lead to benefit in order crating competitive
advantages (Wilkinson, 1989). The improvements in performance that computer
technology provides:
1. Faster processing of transactions and other data
2. Greater accuracy in computations and comparisons with data
3. Lower cost of processing each transaction
4. More timely preparation of reports and other output
5. More concise storage of the data, with greater accessibility when needed
6. Larger range of choices for entering data and providing outputs
7. Higher productivity for employees and managers, especially when they
effectively use computers to aid in their routine (and also decision-making)
responsibilities.
2.1.9. Previous Researches
Researches which tested the acceptance and use of technology with using a
model of Technology Acceptance Model (TAM) have been carried out widely by
the researchers of information systems. The researches were variety among the
researchers with the modification of TAM or using different external variable.
Here will be explained some previous research which related to this research
either directly or indirectly.
1. Davis (1989)

24
David (1989) conducted a research with title “Perceived Usefulness,
Perceived Ease of Use, and User Acceptance of Information Technology”. The
purpose of this research was to pursue better measures for predicting and
explaining use. The research was developed with TAM as the underlying theories
and focuses on two theoretical constructs, perceived usefulness and perceived ease
of use. Both these constructs are theoretically being fundamental determinants of
system usage. This research gives potential contribution because it provides the
basis for researches that recently done.
The research consists of two studies, study 1 at current usage and study 2
at future usage. The result of this research showed that perceived usefulness was
significantly correlated with both self reported current usage (r=0,63) and self-
predicted future usage (r=0,82). Perceived ease of use was also significantly
correlated with current usage (r-0,45) and future usage (r=0,59). The research also
resulted that usefulness had a significantly greater correlation with usage behavior
than did ease of use.
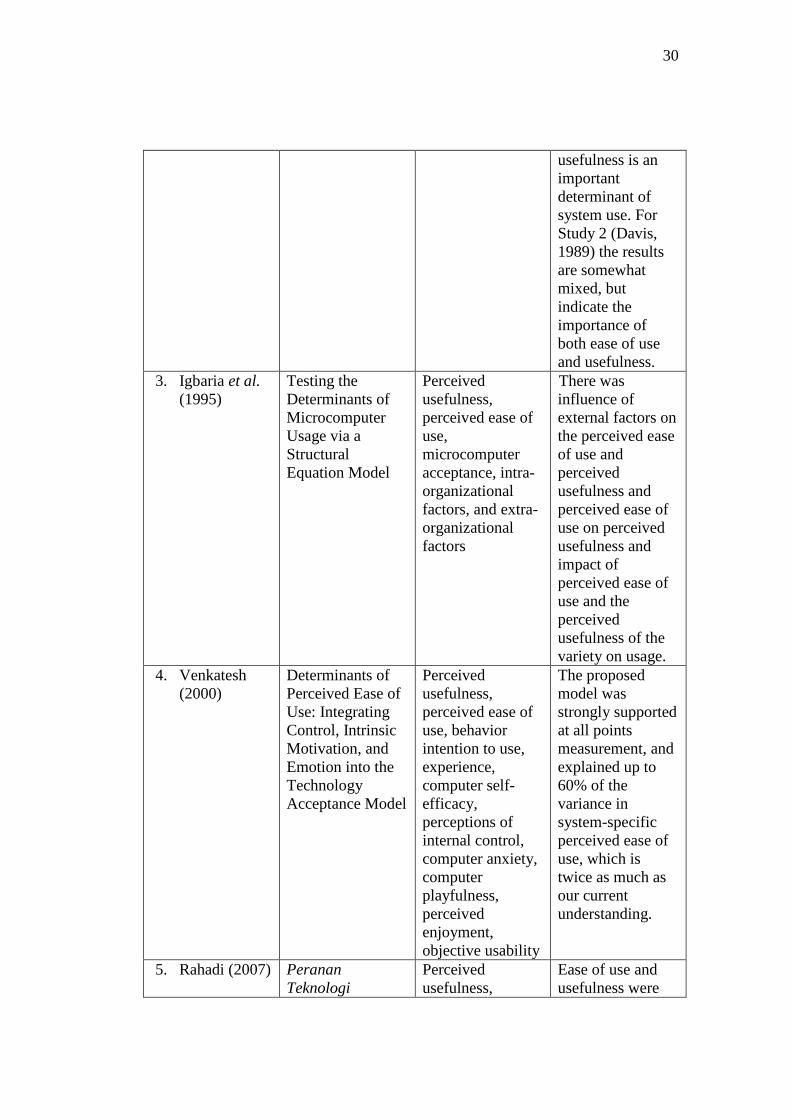
2. Adams et al. (1992)
Adams et al. (1992) conducted a research with title “Perceived Usefulness,
Ease of Use, and Usage of Information Technology: A Replication”. This research
was the replication of Davis (1989) research. This research focus on evaluating
the psychometric properties of the ease of use and usefulness scales, while
examining the relationship between ease of use, usefulness, and system usage.
In this study a total of 118 respondents from 10 different organizations were
surveyed for their attitudes toward two messaging technologies: voice and

25
electronic mail. The results of the studies demonstrate reliable and valid scales for
measurement of perceived ease of use and usefulness. The results of this model
are consistent with previous research for Study 1 (Davis, 1989), suggesting that
usefulness is an important determinant of system use. For Study 2 (Davis, 1989)
the results are somewhat mixed, but indicate the importance of both ease of use
and usefulness.
3. Igbaria et al. (1995)
Research conducted by Iqbaria et al. (1995) with title "Testing the
Determinants of Microcomputer Usage via a Structural Equation Model"
incorporate external factors such as characteristics of the system, organization,
individuals toward the usage of microcomputers, by integrating two models that
describes the use of computers. Two kinds of model were used. The first model
used by Davis, namely Technology Acceptance Model (TAM), the second model
namely Theory of Planned Behavior (TPB). The analysis used in this research is
using Structural Equation Modeling approach (SEM) with Partial Lease Square
(PLS).
This model proved there was influence of external factors on the perceived
ease of use and perceived usefulness and perceived ease of use on perceived
usefulness and impact of perceived ease of use and the perceived usefulness of the
variety of usage.
4. Venkatesh (2000)
Research by Venkatesh (2000) with title "Determinants of Perceived Ease
of Use: Integrating Control, Intrinsic Motivation, and Emotion into the

26
Technology Acceptance Model" was done because very little research have been
conducted to understand how the perception forms and changes over time toward
perceived usefulness that influencing user acceptance and usage behavior of
information technologies.
The model proposed control (internal and external-conceptualized as
computer self-efficacy and facilitating conditions, respectively), intrinsic
motivation (conceptualized as computer playfulness), and emotion
(conceptualized as computer anxiety) as anchors that determine early perceptions
about the ease of use of a new system.
The proposed model was tested in three different organizations among 246
employees using three measurements taken over a three-month period. The
proposed model was strongly supported at all points measurement, and explained
up to 60% of the variance in system-specific perceived ease of use, which is twice
as much as our current understanding.
5. Rahadi (2007)
Research by Rahadi (2007) with title "Peranan Teknologi Informasi Dalam
Peningkatan Pelayanan Di Sektor Publik" adopted the theory of technology
acceptance model (TAM) which consist of three primary variables, usefulness,
ease of use, and acceptance IT.
The research used analysis of structural equation model (SEM) with using
sample from government employees who work in public sectors. The result
showed ease of use and usefulness were not influenced to the acceptance IT.
Conversely, ease of use was influenced to usefulness.

27
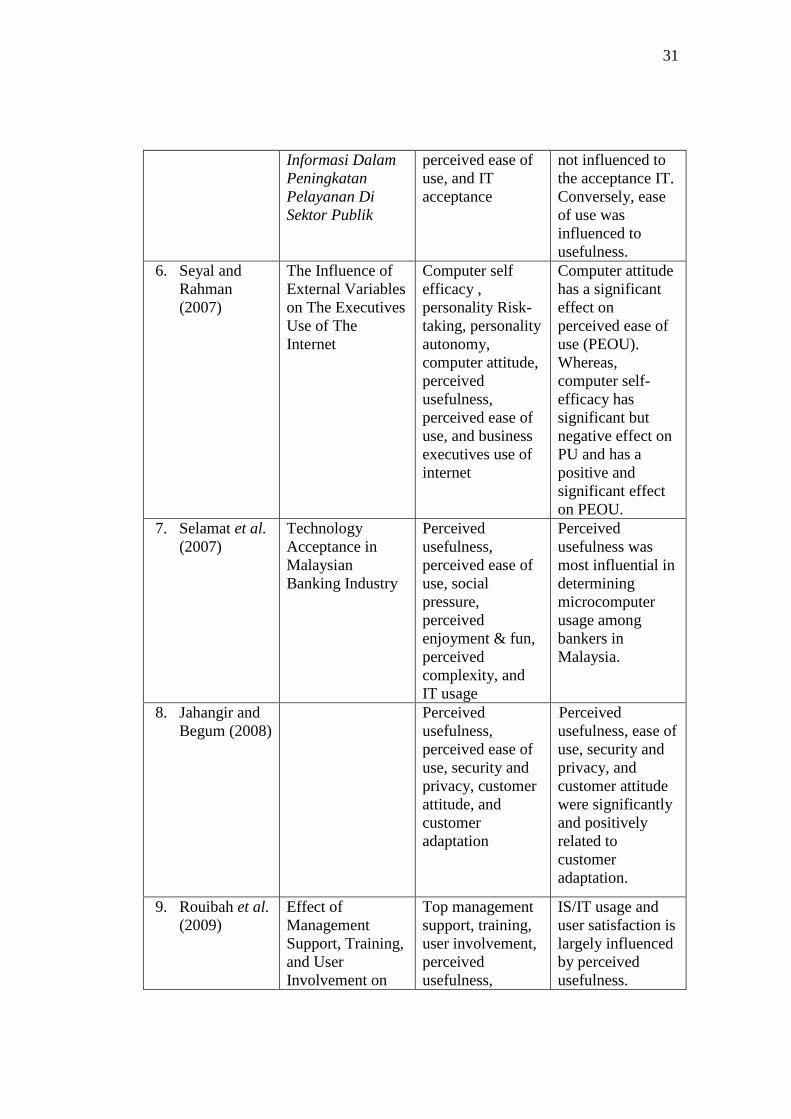
6. Seyal and Rahman (2007)
Research by Seyal and Rahman (2007) with title "The Influence of
External Variables on The Executives Use of The Internet" has purposed to test
and augment the original technology acceptance model (TAM) with three external
variables: computer attitude, computer self-efficacy and personality to study the
use of internet of the business executives not addressed previously.
The sample to this research was data from 105 business executives which
selected randomly. The result showed that computer attitude has a significant
effect on perceived ease of use (PEOU). Whereas, computer self-efficacy has
significant but negative effect on PU and has a positive and significant effect on
PEOU.
7. Selamat et al. (2009)
Research by Selamat et al. (2009) with title "Technology Acceptance in
Malaysian Banking Industry" has purposed to examine the determinant factors
and acceptance of information technology in the Malaysian banking industry. The
research based on technology acceptance model (TAM) to study the perceived
usefulness, perceived ease of use, social pressure, perceived enjoyment and fun, as
well as perceived complexity of IT usage and acceptance of Malaysian bankers.
The sample selected of 200 bankers located within the Klang Valley in
Malaysia. The results of the study established that perceived usefulness was the
most influential in determining microcomputer usage among bankers in Malaysia.
8. Jahangir and Begum (2008)

28
Research done by Jahangir and Begum (2008) with title "The Role of
Perceived Usefulness, Perceived Ease of Use, Security and Privacy, and Customer
Attitude to Engender Customer Adaptation in The Context of Electronic Banking”
was aimed to test the theoretical models to measure the causality whether
perceived usefulness, ease of use, security and privacy, and customer attitude can
foster customer adaptation.
The analysis method employ structural equation modeling techniques and
used data collected from 227 customers of private commercial banks in
Bangladesh. The initial results of the study indicate that perceived usefulness, ease
of use, security and privacy, and customer attitude are significantly and positively
related to customer adaptation.
9. Rouibah et al. (2009)
Rouibah et al. (2009) conducted a research with title "Effect of
Management Support, Training, and User Involvement on System Usage and
Satisfaction in Kuwait” The purpose of this research was to investigate the
organizational factors and human motivations affecting information systems and
information technology (IS/IT) usage and user’s satisfaction in an Arabic country.
Rouibah et al. (2009) developed a research model that links three
organizational factors (top management support – TMS, availability of training,
and user’s involvement) to IS/IT usage and end-user’s satisfaction via the
mediation of TAM beliefs (usefulness and ease-of-use) through 382 IS users in
public sectors. The model was examined with SEM through the LISREL.

29
The results in this research indicated that IS/IT usage and user satisfaction
is largely influenced by perceived usefulness. Among the organizational factors,
TMS was found to have the strongest effect on IS/IT usage and user’s satisfaction,
followed by availability of training and user involvement.
For further details, these studies can be summarized, see table 2.2., as
follows:
Table 2.2
List of Previous Researchers
Researcher Title of Research Variable Used Result
1. Davis (1989) Perceived
Usefulness,
Perceived Ease of
Use, and User
Acceptance of
Information
Technology
Perceived
usefulness,
perceived ease of
use, and system
usage
Perceived
usefulness was
found significantly
correlated with
both self reported
current usage
(r=0,63) and self-
predicted future
usage (r=0,82).
Perceived ease of
use was also
significantly
correlated with
current usage (r-
0,45) and future
usage (r=0,59).
The research also
resulted that
usefulness had a
significantly
greater correlation
with usage
behavior than did
ease of use.
2. Adams et al.
(1992)
Perceived
Usefulness, Ease
of Use, and Usage
of Information
Technology: A
Replication
Perceived
usefulness,
perceived ease of
use, and system
usage
The results of this
research are
consistent with
previous research
for Study 1
(Davis, 1989),
suggesting that
30
usefulness is an
important
determinant of
system use. For
Study 2 (Davis,
1989) the results
are somewhat
mixed, but
indicate the
importance of
both ease of use
and usefulness.
3. Igbaria et al.
(1995)
Testing the
Determinants of
Microcomputer
Usage via a
Structural
Equation Model
Perceived
usefulness,
perceived ease of
use,
microcomputer
acceptance, intra-
organizational
factors, and extra-
organizational
factors
There was
influence of
external factors on
the perceived ease
of use and
perceived
usefulness and
perceived ease of
use on perceived
usefulness and
impact of
perceived ease of
use and the
perceived
usefulness of the
variety on usage.
4. Venkatesh
(2000)
Determinants of
Perceived Ease of
Use: Integrating
Control, Intrinsic
Motivation, and
Emotion into the
Technology
Acceptance Model
Perceived
usefulness,
perceived ease of
use, behavior
intention to use,
experience,
computer self-
efficacy,
perceptions of
internal control,
computer anxiety,
computer
playfulness,
perceived
enjoyment,
objective usability
The proposed
model was
strongly supported
at all points
measurement, and
explained up to
60% of the
variance in
system-specific
perceived ease of
use, which is
twice as much as
our current
understanding.
5. Rahadi (2007) Peranan
Teknologi
Perceived
usefulness,
Ease of use and
usefulness were
31
Informasi Dalam
Peningkatan
Pelayanan Di
Sektor Publik
perceived ease of
use, and IT
acceptance
not influenced to
the acceptance IT.
Conversely, ease
of use was
influenced to
usefulness.
6. Seyal and
Rahman
(2007)
The Influence of
External Variables
on The Executives
Use of The
Internet
Computer self
efficacy ,
personality Risk-
taking, personality
autonomy,
computer attitude,
perceived
usefulness,
perceived ease of
use, and business
executives use of
internet
Computer attitude
has a significant
effect on
perceived ease of
use (PEOU).
Whereas,
computer self-
efficacy has
significant but
negative effect on
PU and has a
positive and
significant effect
on PEOU.
7. Selamat et al.
(2007)
Technology
Acceptance in
Malaysian
Banking Industry
Perceived
usefulness,
perceived ease of
use, social
pressure,
perceived
enjoyment & fun,
perceived
complexity, and
IT usage
Perceived
usefulness was
most influential in
determining
microcomputer
usage among
bankers in
Malaysia.
8. Jahangir and
Begum (2008)
Perceived
usefulness,
perceived ease of
use, security and
privacy, customer
attitude, and
customer
adaptation
Perceived
usefulness, ease of
use, security and
privacy, and
customer attitude
were significantly
and positively
related to
customer
adaptation.
9. Rouibah et al.
(2009)
Effect of
Management
Support, Training,
and User
Involvement on
Top management
support, training,
user involvement,
perceived
usefulness,
IS/IT usage and
user satisfaction is
largely influenced
by perceived
usefulness.

32
System Usage and
Satisfaction in
Kuwait
perceived ease of
use, system usage,
and user
satisfaction
Among the
organizational
factors, TMS was
found to have the
strongest effect on
IS/IT usage and
user’s satisfaction,
followed by
availability of
training and user
involvement.
Based on these studies can be concluded that technology acceptance model
(TAM) were used in varieties according to the needs. TAM can be modified with
either user acceptance variables or external variables. In this research, construct is
limited based on Rouibah et al. (2009) who study the user acceptance (user
satisfaction and system usage) with using two belief (perceived usefulness and
perceived ease of use) toward external organizational variables (top management
support, training, and user involvement).
2.2. Theoretical Framework
This study uses a framework based on variables that have been tested in
research by Rouibah et al. (2009). Thus, the framework of this research can be
described in figure 2.4.
As can be seen below in figure 2.4, this theoretical framework describes
the relation three organizational variables which are used (TMS, TR, and UI)
directly to user acceptance or indirectly through two belief, perceived usefulness
(PU) and perceived ease of use (PEOU).
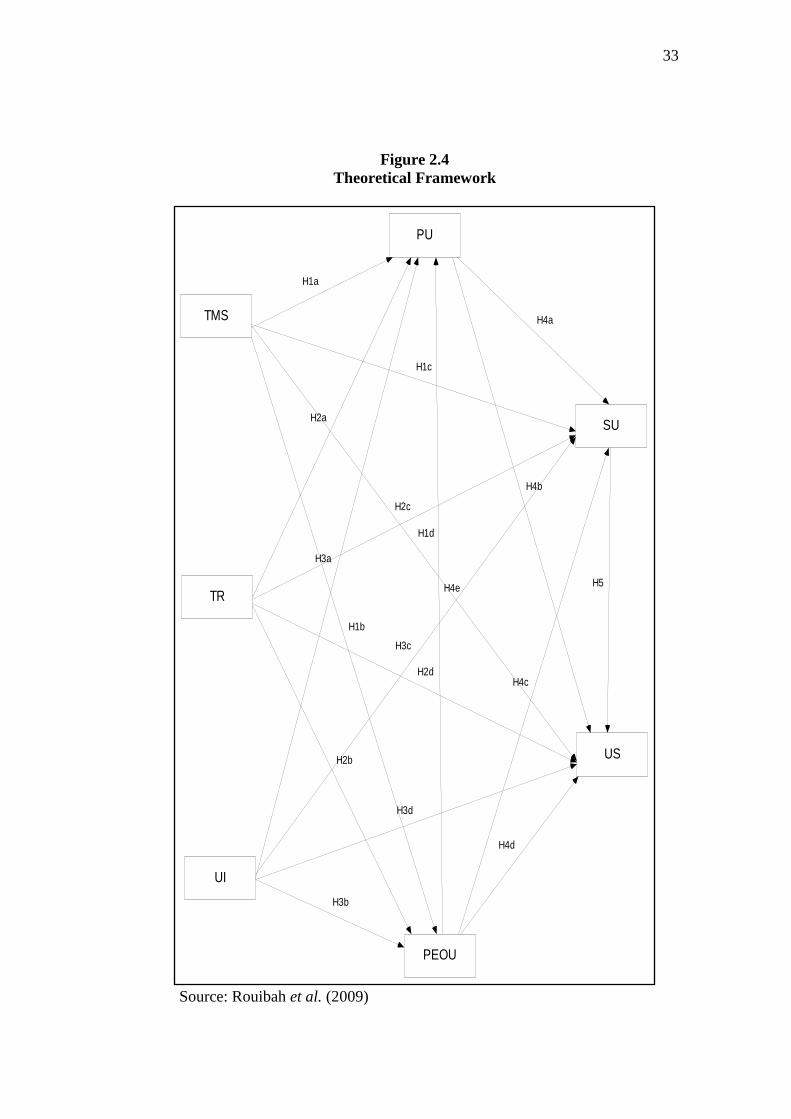
33
Figure 2.4
Theoretical Framework
Source: Rouibah et al. (2009)
PEOU
PU
TR
UI
TMS
SU
US
H3b
H3a
H3c
H3d
H4e
H2b
H2d
H2c
H2a
H1a
H1c
H1d
H1b
H4a
H4b
H4d
H4c
H5

34
2.3. Hypothesis Development
2.3.1. Effect of Top Management Support on Perceived Usefulness,
Perceived Ease of Use, System Usage, and User Satisfaction
The expectancy theory explains causes for behaviors exhibited in the
workplace Leonard et al (in Issac et al., 2001). Here can be explained that the
support that management given is viewed as stimuli to influence the attitude of
employees to using information system or technology that expected to enhance the
work performance of the employees.
Using technology acceptance model, support from top management that
given to the information system user will create belief, perceived usefulness and
ease of use for information system which is used. Several researches have proved
that given support from top management (TMS) will influence the perceived
usefulness (PU) for the user (Igbaria et al., 1995; Al-Gahtani and King, 1999;
Lewis et al., 2003; and Rouibah et al., 2009). As well as on perceived ease of use
(PEOU), the support of management purposed the user of the system will give
encourage to the user so it can create belief that use information system will
makes their task easier. This is supported by Igbaria et al. (1995), Lewis et al.
(2003), and Rouibah et al. (2009) that proved top management support (TMS)
affected perceived ease of use (PEOU).
Top management support (TMS) also influences both user satisfaction
(US) and system usage (SU). User satisfies and more willing to use the
information system if the system is useful and easy to use. Directly, the support
also will bring satisfaction and increasing usage of the information system.

35
Researches about the influence of top management support (TMS) on system
usage (SU) have been proved by Al-Gahtani and King (1999), Rouibah et al.
(2009). Influence of top management support (TMS) on user satisfaction (US)
were proved by Al-Gahtani and King (1999), Kim and Kim (2008), and Rouibah
et al. (2009).
Based on the theories that are mentioned above and previous researches
which showed the influence of top management support on perceived usefulness,
perceived ease of use, system usage, and user satisfaction, the hypothesis is stated
as follows:
H1a: Top management support (TMS) will directly and indirectly affect perceived
usefulness (PU)
H1b: Top management support (TMS) will directly affect perceived ease of use
(PEOU)
H1c: Top management support (TMS) will directly and indirectly affect system
usage (SU)
H1d: Top management support (TMS) will directly and indirectly affect user
satisfaction (US)
2.3.2. Effect of Training on Perceived Usefulness, Perceived Ease of Use,
System Usage, and User Satisfaction
Technology acceptance depends on the technology itself and level of skill
or expertise of the individual using technology (Igbaria et al. 1995). Expectancy
theory explain with the availability training given to the user of the information
system, it is expected the user ability to use the information system will increase.
36
The motivation that companies given will affect the user attitudes which will
increase their performance.
Using technology acceptance model, training that given to the information
system user will create belief, perceived usefulness and ease of use for
information system which is used. Several researches have proved that training
(TR) will influence the perceived usefulness (PU) for the user (Igbaria et al.,
1995; Rouibah et al., 2009). As well as on perceived ease of use (PEOU), the
training will ease user in using information system or technology because with
training user became more experience and skillful. Influence training (TR) on
perceived ease of use (PEOU) also supported by some researches like Taylor and
Todd (1995), Venkatesh (2000), Davis (1989), and Rouibah et al., (2009).
Training (TR) also influences both user satisfaction (US) and system usage
(SU). User satisfies and more willing to use the information system if the system
is useful and easy to use. The training also will bring satisfaction and increasing
usage of the information system. Research about the influence of training (TR) on
system usage (SU) has been proved by Igbaria et al. (1995), Al-Gahtani and King
(1999). Then Al-Gahtani (2004) proved that there was influence of training (TR)
on user satisfaction (US)
Based on the theories that are mentioned above and previous researches
which showed the influence of training on perceived usefulness, perceived ease of
use, system usage, and user satisfaction, the hypothesis is stated as follows:
H2a: Training will directly and indirectly affect perceived usefulness
H2b: Training will directly affect perceived ease of use
37
H2c: Training will directly and indirectly affect system usage
H2d: Training will directly and indirectly affect user satisfaction
2.3.3. Effect of User Involvement on Perceived Usefulness, Perceived Ease of
Use, System Usage, and User Satisfaction
According the expectancy theory involving the Information System user is
believed will improve the level of acceptance system. The information system
which developed will appropriate with what the user needs. Thus, user who
involved in information system is expected will increase their acceptance level
toward system and enhance their performance.
User involvement will create belief, perceived usefulness and ease of use
for information system which is used. User can decide whether the system is
appropriate with the work or not. Several researches have proved that user
involvement (UI) will influence the perceived usefulness (PU) for the user (Kujala
(2003); and Rouibah et al., 2009). As well as on perceived ease of use (PEOU),
involving the user will ease user in using information system or technology
because with the user will become more familiar with the information system.
Rouibah et al. (2009) proved that there was influence of user involvement (UI) on
perceived ease of use (PEOU).
User involvement (UI) also influences both user satisfaction (US) and
system usage (SU). User satisfies and more willing to use the information system
if the system is useful and easy to use. With involving user, it will bring
satisfaction that can lead in increasing usage of the information system. Research
about the influence of user involvement (UI) on system usage (SU) have been
38
proved by Igbaria et al. (1995), Rouibah et al. (2009), Kujala (2003). Al-Gahtani
and King (1999), and Kujala (2008) proved that there was influence of user
involvement (UI) on user satisfaction (US).
Based on the theories that are mentioned above and previous researches
which showed the influence of user involvement on perceived usefulness,
perceived ease of use, system usage, and user satisfaction, the hypothesis is stated
as follows:
H3a: User involvement (UI) will directly and indirectly affect perceived
usefulness (PU)
H3b: User involvement (UI) will directly affect perceived ease of use (PEOU)
H3c: User involvement (UI) will directly and indirectly affect system usage (SU)
H3d: User involvement (UI) will directly and indirectly affect user satisfaction
(US)
2.3.4. Effect of Perceived Usefulness, and Perceived Ease of Use on System
Usage and User satisfaction, and Effect of Perceived Ease of Use on
Perceived Usefulness
Based on TAM, Davis (1989) mentioned user satisfaction and system
usage known be affected by two belief, perceived usefulness (PU) and perceived
ease of use (PEOU). Research by Igbaria et al. (1995) and Al-Gahtani and King
(1999), and Rouibah et al. (2009) proved that there was influence that perceived
usefulness (PU) affect system usage (SU). Other research by Rouibah and Hamdy
(2009), and Rouibah et al. (2009) found that perceived usefulness (PU) also affect
user satisfaction (SU). Based on the theory that was mentioned above and

39
previous researches which showed the influence of perceived usefulness on
system usage, and user satisfaction, the hypothesis is stated as follows:
H4a: Perceived usefulness will directly affect perceived system usage
H4b: Perceived usefulness will directly and indirectly affect user satisfaction
Research by Igbaria et al. (1995), Rouibah and Hamdy (2009) proved that
there was influence that perceived ease of use (PEOU) affects system usage (SU).
Other research by Davis (1989), Taylor and Todd (1995) found that perceived
usefulness (PU) also affect user satisfaction (SU). Despite affects on system usage
(SU) and user satisfaction (SU), further research by Rouibah and Hamdy (2009)
found that perceived ease of use (PEOU) affect perceived usefulness (PU).
Rahadi, (2007) also proved that perceived usefulness affect on perceived
usefulness. Based on the theory that was mentioned above and previous
researches which showed the influence of perceived usefulness on system usage,
and user satisfaction, the hypothesis is stated as follows:
H4c: Perceived ease of use will directly and indirectly affect system usage
H4d: Perceived ease of use will directly affect perceived usefulness
H4e: Perceived ease of use will directly and indirectly affect user satisfaction
2.3.5. Effect of System Usage on User Satisfaction
According to Rouibah and Hamdy (2009), the more end-users use the
system, the more they will feel to be satisfied. The user which feels satisfied can
be looked from how often they use the system after they have used the
information system. This model also supported by other researchers like Al-

40
Gahtani (2004), and Rouibah et al. (2009). Based on the previous research, the
hypothesis is stated as follows:
H5: System usage will directly affect user satisfaction

41
CHAPTER III
RESEARCH METHOD
3.1. Research Variables and Operational Definition
3.1.1. Top Management Support
Top management support (TMS) is defined as set up the structures of
signification, legitimization, and domination that reveal to individuals the ways in
which the technology might be useful in their work process and task activities.
Purvis (in Lewis, 2003) stated that top management support shapes individuals
belief that the technology is useful for work activities and that its use in the salient
work activities will be normatively valued and instrumentally rewarded.
Based on the TAM, Davis et al. (1989) also proposed that belief
(perceived ease of use and perceived usefulness) were affected by organizational
support/ management support. Organizational support/ management support has
been emphasized by several researchers as a potential determinant of system
success (Igbaria et al., 1995). Igbaria et al. (1995) found that lack in the
organizational support is considered as a critical barrier to the effective utilization
of computers. The result was strengthened by Rouibah et al. (2009) who found
TMS as the largest variable which influence system usage and user satisfaction.
From the definition above is known that support from top management
gives guidance and encourage the information system user to more used system so
the task will be easier. Igbaria et al. (1995) stated that top management support
consists of two supports: end support and management support, the end support

42
includes the availability of system development assistance, specialized
instruction, and guidance in using information system whereas the management
support includes top management encouragement and allocation of resources.
Overall, top management support is the way for organizational management to
signaling the user to do the expected behavior.
In the structure equation model (SEM), this variable is known as
exogenous variable. Top management support in the path diagram abbreviated as
TMS. Top management support (TMS) that used in this research is used to know
the influence top management support on perceived usefulness, perceived ease of
use, system usage, and user satisfaction. Top management support (TMS) is
assessed with eight items adapted from Rouibah et al. (2009). Respondents are
asked to express their agreement/ disagreement with eight statements concerning
organizational support on a five-point Likert-scale ranging from (1) “strongly
disagree to (5) “strongly agree”.
3.1.2. Training
User training (TR) which represents as individual skills and expertise were
found to be related to user beliefs and usage (Igbaria et al. 1995). Research by
Zmud (in Igbaria et al., 1995) proved training as critical factor for IS success
through the acceptance of IS/ IT. Study by Igbaria et al. (1995) also found that
user training plays a very important role in influencing user beliefs toward the
system and that training programs are likely to increase user confidence in their
ability to master and use computers in their work. Concluded from the definition
that the more training is given to the user, the more they will adapt the system.

43
The training creates experience and build up user skill in order operates the
system.
In the structure equation model (SEM), this variable is known as
exogenous variable. Training in the path diagram abbreviated as TR. Training
(TR) that used in this research is used to know the influence training on perceived
usefulness, perceived ease of use, system usage, and user satisfaction. Training
(TR) is assessed with five items adapted from Rouibah et al. (2009). Respondents
are asked to express their agreement/ disagreement with five statements
concerning training on a five-point Likert-scale ranging from (1) “strongly
disagree to (5) “strongly agree”.
3.1.3. User Involvement
There is no clear definition about user involvement (UI), but Kujala (2003)
found user involvement (UI) was synonymous with “focus on user” (Wilson et al.
in Kujala 2003), “consulting end-user” (Noyes, et al. in Kujala, 2003), “contacting
with system user (Grudin in Kujala, 2003), “participation of users” (Heinbokel et
al. in Kujala, 2003). User involvement can be seen to a general term describing
contact with users and covering many approaches. Kujala (2003) conducted three
streams research and found clearly it has positive effect on both system success
and user satisfaction. Involving the user also will increase the chance system
being more accepted to support daily work. With the advancement of Information
System and software, Kujala (2008) showed that user involvement not only
provides useful information about users needs but also increases the
understanding of user’s values.
44
In the structure equation model (SEM), this variable is known as
exogenous variable. User involvement in the path diagram abbreviated as UI. User
involvement that used in this research is used to know the influence user
involvement on perceived usefulness, perceived ease of use, system usage, and
user satisfaction. User involvement (UI) is assessed with two items adapted from
Rouibah et al. (2009). Respondents are asked to express their agreement/
disagreement with two statements concerning user involvement on a five-point
Likert-scale ranging from (1) “strongly disagree to (5) “strongly agree”.
3.1.4. Perceived Usefulness
Davis (1989) defined perceived usefulness (PU) as the degree to which an
individual believes that using the system will enhance his job performance. Based
on the definition can be known that usefulness of using information systems is
purposed to improve performance, and achievement of people who use them.
Generally, user will use the information system if they feel it is useful to them
(Jogiyanto, 2007). Igbaria et al. (1995) found there was a strong relationship
between perceived usefulness and system usage. Similarly, Ndbusi and Jantan
(2003) proved perceived usefulness (PU) is robust in determining usage, while
having direct effect on usage and also mediating in the relationship between
PEOU and usage. In Rouibah et al. (2009) has been proved that perceived
usefulness (PU) influence largely on system usage and user satisfaction rather
than perceived ease of use (PEOU)
Chin and Todd (1995) developed several dimensions about IT usefulness
that included to two categories, (1) usefulness with a factor estimated, and (2)

45
usefulness with two factor estimated. Usefulness with a factor estimated include
as follows:
1. Makes job easier
2. Useful
3. Increase productivity
4. Enhance effectiveness
5. Improve job performance
Usefulness with two factors estimated by Chin and Todd (1995) divided
into two categories, as follows:
1. Usefulness that covered dimension:
a. Makes job easier
b. Useful
c. Increase productivity
2. Effectively that covered dimension:
a. Enhance my effectiveness
b. Improve my job performance
Based on some definitions and literature review above can be concluded
that the uses of information technology can be knew from how much the users
of information technology trust that information system will give positive
contribution to them.
In the structure equation model (SEM), this variable is known as
endogenous variable. Perceived usefulness in the path diagram abbreviated as PU.
Perceived usefulness (PU) that used in this research is used to know the influence

46
perceived usefulness (PU) on system usage, and user satisfaction. Perceived
usefulness (PU) is assessed with six items adapted from Rouibah et al. (2009).
Respondents are asked to express their agreement/ disagreement with six
statements concerning perceived usefulness on a five-point Likert-scale ranging
from (1) “strongly disagree to (5) “strongly agree”.
3.1.5. Perceived Ease of Use
Davis (1989) defined perceived ease of use (PEOU) as the degree to which
an individual believes that using computer or computerized system will be free
from physical and mental efforts. Hence an application perceived to be easier to
use than another is more likely to be accepted by users and the more complex
technology is perceived as being, the slower will be its rate of adoption (Selamat
et al. 2007). The definition above means ease of use will decrease effort which
user meets in learning information system. So that with using information system
the user feel easier in facing works rather than work without using information
system. Davis (1989) stated some indicators about ease of use, such as:
1. Computers are very easy to learn,
2. Computer easy to do with what is desired by users
3. User`s skills increased by using a computer
4. Computers are very easy to be operated
Adams et al. (1992) stated system that easy to use can be look from the
intensity the system being used. When the information system is often used it
creates satisfaction on the system user (Rouibah et al. 2009)

47
In the structure equation model (SEM), this variable is known as
endogenous variable. Perceived ease of use in the path diagram abbreviated as
PEOU. Perceived ease of use (PEOU) that used in this research is used to know
the influence perceived ease of use (PEOU) on perceived usefulness, system
usage, and user satisfaction. Perceived ease of use (PEOU) is assessed with two
items adapted from Rouibah et al. (2009). Respondents are asked to express their
agreement/ disagreement with two statements concerning perceived ease of use on
a five-point Likert-scale ranging from (1) “strongly disagree to (5) “strongly
agree”.
3.1.6. System Usage
DeLone and McLean (1992) mentioned system usage is one of measure in
information system success. The information system success can be looked from
the level system being used by the user to complete the job. Rouibah et al. (2009)
proved system being used if it’s found useful, while Rouibah and Hamdy (2009)
found the ease of use affected the current use. From the two results can be
concluding that both PU and PEOU altogether increase the usage of system.
In the structure equation model (SEM), this variable is known as
endogenous variable. System usage in the path diagram abbreviated as SU.
System usage (SU) that used in this research is used to know the influence system
usage on user satisfaction. System usage (SU) is assessed with three items adapted
from Rouibah et al. (2009). Respondents are asked to express their agreement/
disagreement with three statements concerning system usage on a five-point
Likert-scale ranging from (1) “strongly disagree to (5) “strongly agree”.

48
3.1.7. User Satisfaction
Like system usage (SU), user satisfaction was found as one construct in IS
success (DeLone and McLean, 1992). The successful interaction by user of the
information system with the system can be measure through satisfaction. DeLone
and McLean (1992) mentioned there are three reasons why user satisfaction
became widely used. Firstly, satisfaction has a high degree of face validity. It is
hard to deny the success of a system which its users say that they like. Second, the
development of the Bailey and Pearson instrument and its derivatives has provide
a reliable tool for measuring satisfaction and for making comparisons among
studies. The third reason for the appeal of satisfaction as a success measure is that
most of the other measures are so poor; they are either conceptually weak or
empirically difficult to obtain.
In the structure equation model (SEM), this variable is known as
endogenous variable. User satisfaction in the path diagram abbreviated as US.
User satisfaction (US) is assessed with seven items adapted from Rouibah et al.
(2009). Respondents are asked to express their agreement/ disagreement with
seven statements concerning user satisfaction on a five-point Likert-scale ranging
from (1) “strongly disagree to (5) “strongly agree”.
3.2. Population and Sample Determination
Population refers to the entire group of people, events, or things of interest
that the researcher wishes to investigate (Sekaran, 2003). Sample is a subset of
population (Sekaran, 2003). Population in this research is the users of accounting

49
information system who work on Bank Pekreditan Rakyat in the Semarang City
Region. In the Semarang city region there are 20 Bank Pekreditan Rakyat which
become population of this research. From this population, this research takes 10
samples on the users of accounting information system who work in the financial
and operational department on Bank Pekreditan Rakyat in Semarang City Region.
The sampling method of this research is purposive sampling. The reason is
the obtained data will accordance with the research objectives and can be
compared with previous studies. The criteria of the sample must using information
system that related to the accounting task and they must work in the operational
and financial department.
3.3. Types and Sources of the Data
This research uses two kind of data used during this research:
1. Primary data. Data collected firsthand for subsequent analysis to find
solutions to the problem researched (Sekaran, 2003). Primary data collected
from questioners which send to the respondents. The questioners is used to
measure IS success.
2. Secondary data. Data that have already been gathered by researchers, data
published in statistical and other journals, and information available from any
published or unpublished source available either within or outside the
organization, all of which might be useful to the researcher (Sekaran, 2003).
This research uses secondary as additional information to help the research
analysis.

50
3.4. Data Collection Method
Data collection in this study is conducted with survey method by spreading
directly the list of questions in the form of questionnaire. The questionnaire is
filled by the respondent from staff in Bank Pekreditan Rakyat (BPR) Semarang
City region who works in the financial and operational department. Before the
questionnaire is given, first each firm is asked about their willingness to become a
respondent and let their staff to fill the questionnaire. The next step is delivers a
pack of questionnaire which consists of ten questionnaires. When the
questionnaires are delivered, respondents are explained about the questioners
include the purpose of the research and how the questioners should be filled. This
step is purposed for gains high amount rate of return (response rate) and avoids
failed questionnaires. The questionnaire presented to the respondent along with a
written request to become respondent and an explanation about how to fill it with
some instructions. The questionnaire consists of two parts: the first part contains
the identity of respondents, while the second part contains a number of questions
and statements that have been structured on factors which influence the
acceptance in accounting information system such as, top management support
(TMS), training (TR), user involvement (UI), perceived ease of use (PEOU),
perceived usefulness (PU), system usage (SU), and user satisfaction (US).
The questionnaire also contains a request to return the questionnaire that
has been filled not later than two weeks commencing from time respondent
receives the questionnaire. Then, the questionnaires which have been filled by the
respondents are selected to separate usable questioners with the failed ones.

51
3.5. Analysis Method
3.5.1. Descriptive Statistic
This research uses descriptive statistics to illustrate about the demographic
of research respondents and description of independent variables to determine the
absolute frequency distribution that shows the average, median, range, and
standard deviation (Ghozali, 2006). SPSS 16 is used to conduct descriptive
statistic.
3.5.2. Hypothesis Test
Hypothesis test in this study is conducted by Structural Equation Model
with using AMOS 6 software. Structural equation model (SEM) is combination of
factor analysis and path analysis which makes it into a comprehensive statistic
method (Ghozali, 2008).
First, path diagram which based on the research by Rouibah et al. (2009) is
constructed. This path diagram is analyzed and resulting four regression equation
as follow:
PEOU =
PU =
SU =
US =
This research applied two kinds of analysis techniques, namely:
1. Confirmatory Factor Analysis and Construct Validity, confirmatory factor
analysis is used to ensure the data is valid and reliable. There are four test

52
in validity test, they are: (1) convergent validity, (2) variance extracted, (3)
construct reliability, and (4) discriminant validity.
2. Regression Weight Analysis, Regression Weight Analysis is used to
examine how much influence between the variables. Before Regression
weight analysis is applied. The model is assessed for its goodness of fit.
This research is using maximum likelihood estimation. The construct
model is assessed with goodness of fit measures such as: CMIN/DF, RMR,
GFI, NFI, RFI, IFI, TLI, CFI, RMSEA, AIC, CAIC and ECVI.
SEM is used in this research because of its ability to combines the
measurement model with the structural model simultaneously and efficiently
when compared with other multivariate techniques (Ghozali, 2008).


![ASIAN DEVELOPMENT BANK PCR: CAM 27410€¦ · ASIAN DEVELOPMENT BANK PCR: CAM 27410 PROJECT COMPLETION REPORT ON THE BASIC HEALTH SERVICES PROJECT (Loan 1447-CAM[SF]) IN CAMBODIA](https://img.pdfslide.us/doc/110x75/5f0729017e708231d41b9b0c/asian-development-bank-pcr-cam-27410-asian-development-bank-pcr-cam-27410-project.jpg)


![Proposal [ Nk ] Kecil](https://img.pdfslide.us/doc/110x75/5571fd9149795991699965fa/proposal-nk-kecil.jpg)