Embed Size (px)
DESCRIPTION
analisis
Citation preview
Executive Summary
Sales correlation analysis for L´Oréal
January 2014
Google Confidential and Proprietary
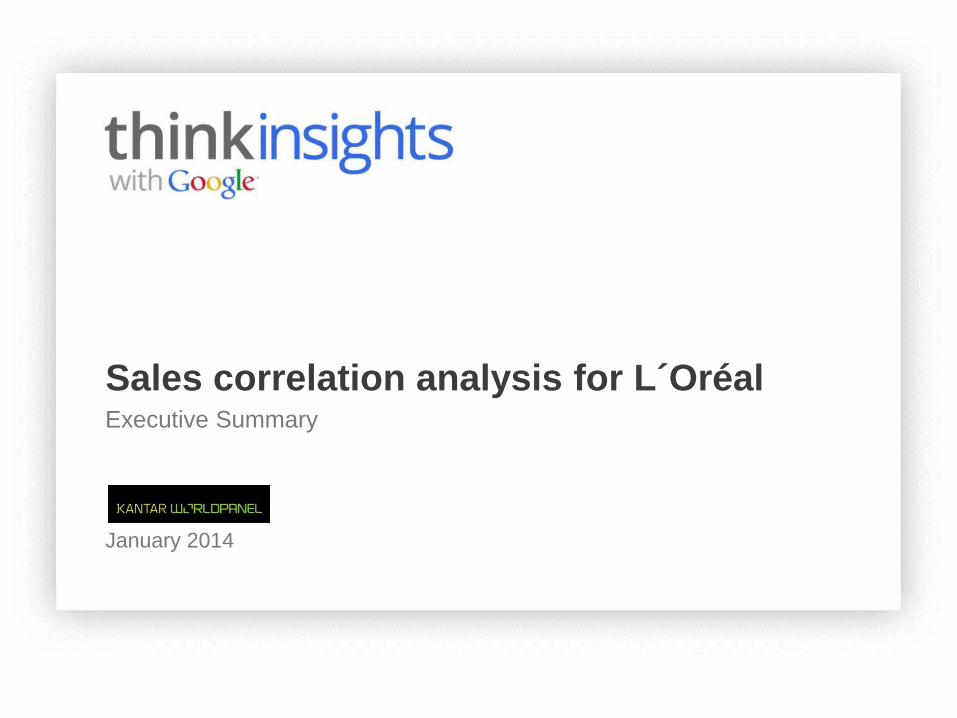
Research Key Findings
2
1
Digital media was particularly effective to optimize L´Oréal TV advertising reach and
frequency: it guaranteed that all those exposed to advertising has at least 5 OTS.
2
Shift in penetration among those exposed to TV (5+OTS) + Digital was +10% vs.
the shift among those exposed to TV (5+OTS) only
3 Shift in market share in value among those exposed to TV (5+OTS) + Digital was
+37% vs. the shift among those exposed to TV (5+OTS) only
!
This analysis under real environment conditions can not definitely attribute the
observed shifts to the presence of digital since other factors that could not be
totally controlled (price, promotions, ...) may have had an impact: this is a stop-
gap solution until more advanced methodologies (being developed in US and some
EU markets) are available in Spain
Google Confidential and Proprietary
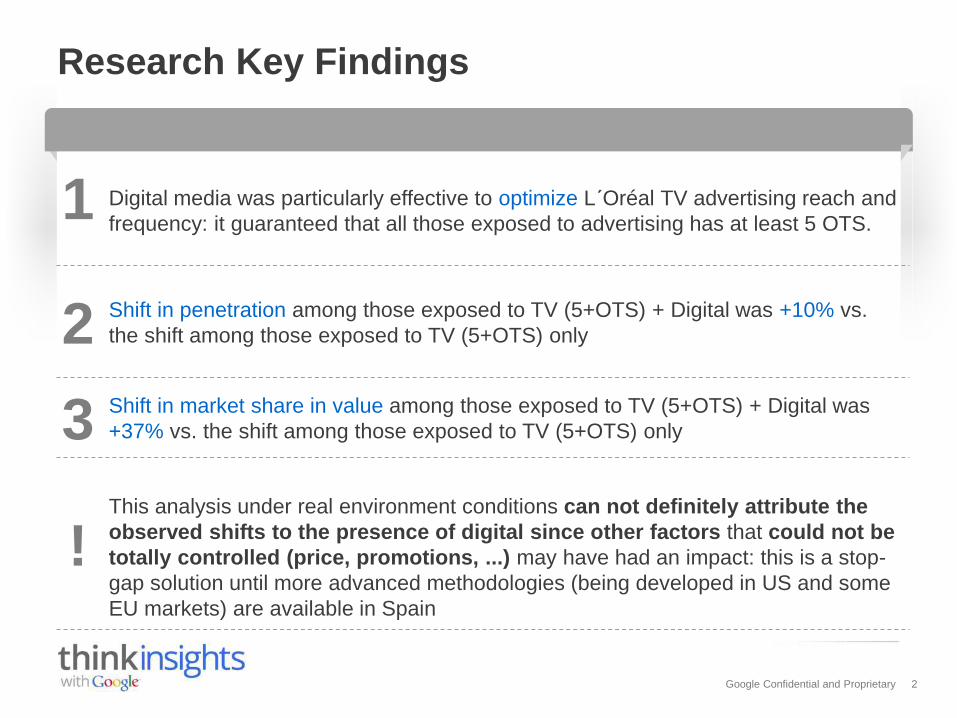
Scope of the analysis
3
All display and online video L´Oréal campaigns in H1 2013 were measured
Other digital campaign
TV campaign
TV campaign TV campaign
Other digital campaign
YouTube campaign
YouTube campaign
Month 1 Month 2 Month 3 Month 4 Month 5 Month 6
GDN campaign GDN campaign
GDN = Google Display Network
Google Confidential and Proprietary
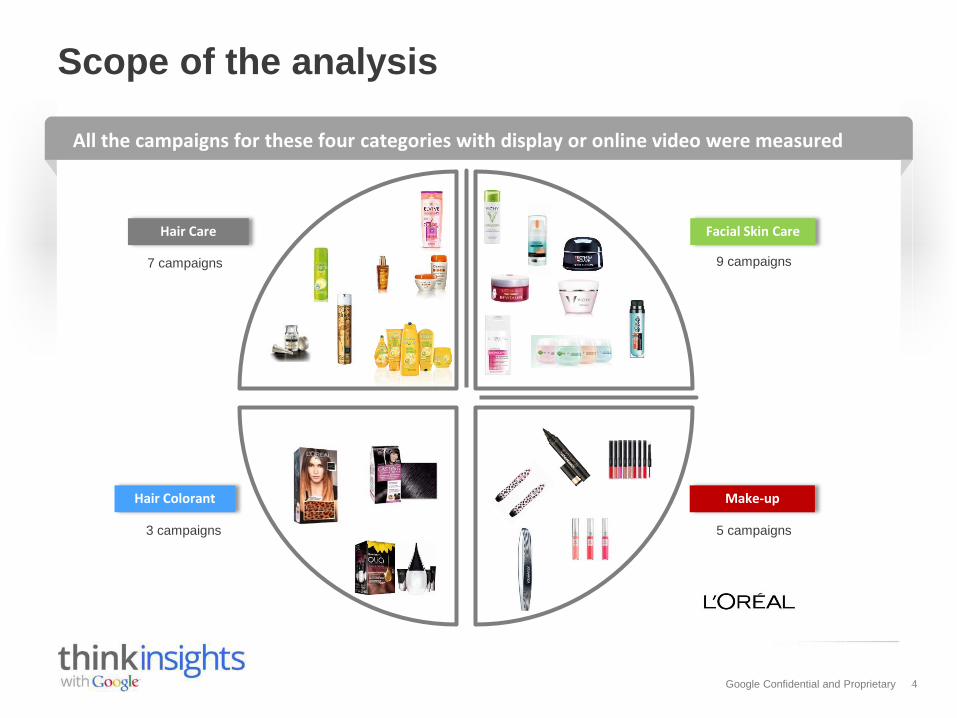
Scope of the analysis
4
Hair Care Facial Skin Care
Make-up Hair Colorant
7 campaigns
3 campaigns
9 campaigns
5 campaigns
All the campaigns for these four categories with display or online video were measured
Google Confidential and Proprietary
Methodological Highlights
5
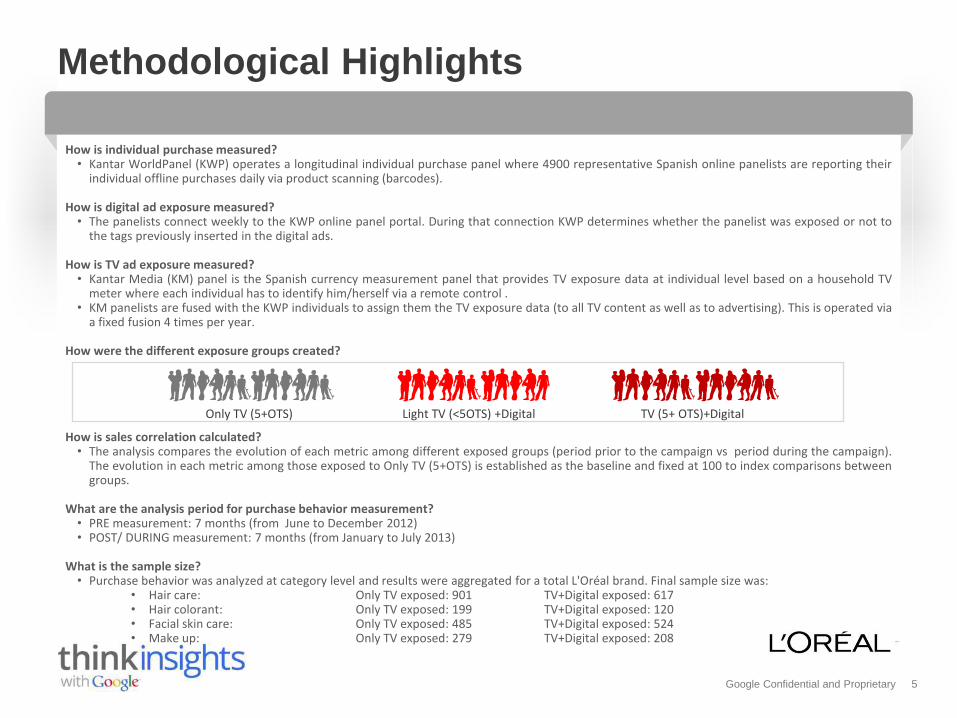
How is individual purchase measured? • Kantar WorldPanel (KWP) operates a longitudinal individual purchase panel where 4900 representative Spanish online panelists are reporting their
individual offline purchases daily via product scanning (barcodes).
How is digital ad exposure measured? • The panelists connect weekly to the KWP online panel portal. During that connection KWP determines whether the panelist was exposed or not to
the tags previously inserted in the digital ads.
How is TV ad exposure measured? • Kantar Media (KM) panel is the Spanish currency measurement panel that provides TV exposure data at individual level based on a household TV
meter where each individual has to identify him/herself via a remote control . • KM panelists are fused with the KWP individuals to assign them the TV exposure data (to all TV content as well as to advertising). This is operated via
a fixed fusion 4 times per year. How were the different exposure groups created? How is sales correlation calculated? • The analysis compares the evolution of each metric among different exposed groups (period prior to the campaign vs period during the campaign).
The evolution in each metric among those exposed to Only TV (5+OTS) is established as the baseline and fixed at 100 to index comparisons between groups.
What are the analysis period for purchase behavior measurement? • PRE measurement: 7 months (from June to December 2012) • POST/ DURING measurement: 7 months (from January to July 2013)
What is the sample size? • Purchase behavior was analyzed at category level and results were aggregated for a total L'Oréal brand. Final sample size was:
• Hair care: Only TV exposed: 901 TV+Digital exposed: 617 • Hair colorant: Only TV exposed: 199 TV+Digital exposed: 120 • Facial skin care: Only TV exposed: 485 TV+Digital exposed: 524 • Make up: Only TV exposed: 279 TV+Digital exposed: 208
TV (5+ OTS)+Digital Light TV (<5OTS) +Digital Only TV (5+OTS)
Google Confidential and Proprietary
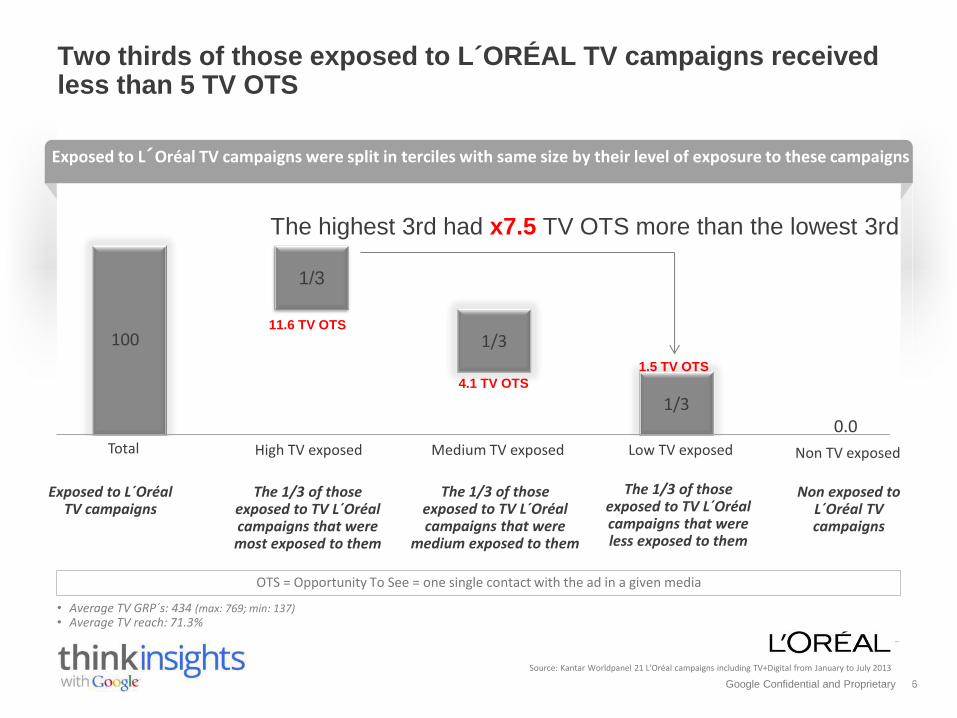
Two thirds of those exposed to L´ORÉAL TV campaigns received less than 5 TV OTS
6
100
1/3 0.0
1/3
1/3
Non TV exposed Total High TV exposed Medium TV exposed Low TV exposed
Source: Kantar Worldpanel 21 L'Oréal campaigns including TV+Digital from January to July 2013
The 1/3 of those exposed to TV L´Oréal campaigns that were most exposed to them
The 1/3 of those exposed to TV L´Oréal campaigns that were
medium exposed to them
The 1/3 of those exposed to TV L´Oréal campaigns that were less exposed to them
Exposed to L´Oréal TV campaigns
Non exposed to L´Oréal TV campaigns
Exposed to L´Oréal TV campaigns were split in terciles with same size by their level of exposure to these campaigns
11.6 TV OTS
4.1 TV OTS
1.5 TV OTS
The highest 3rd had x7.5 TV OTS more than the lowest 3rd
OTS = Opportunity To See = one single contact with the ad in a given media
• Average TV GRP´s: 434 (max: 769; min: 137) • Average TV reach: 71.3%
Google Confidential and Proprietary
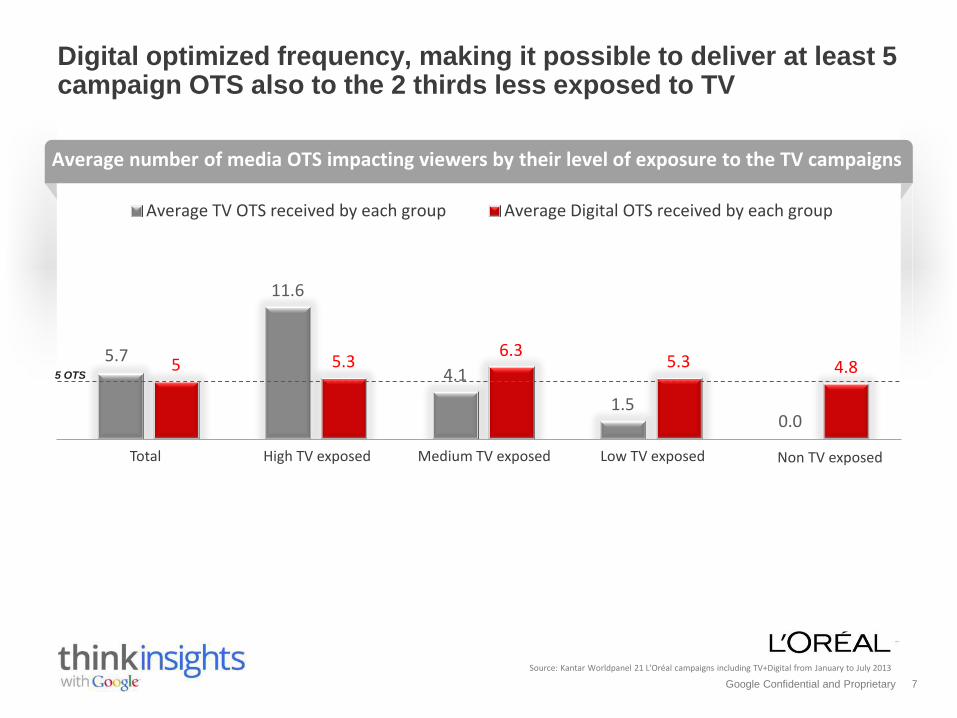
Digital optimized frequency, making it possible to deliver at least 5 campaign OTS also to the 2 thirds less exposed to TV
7
5.7
11.6
4.1
1.5 0.0
5 5.3 6.3
5.3 4.8
Average TV OTS received by each group Average Digital OTS received by each group
Non TV exposed Total High TV exposed Medium TV exposed Low TV exposed
Average number of media OTS impacting viewers by their level of exposure to the TV campaigns
Source: Kantar Worldpanel 21 L'Oréal campaigns including TV+Digital from January to July 2013
5 OTS
Google Confidential and Proprietary
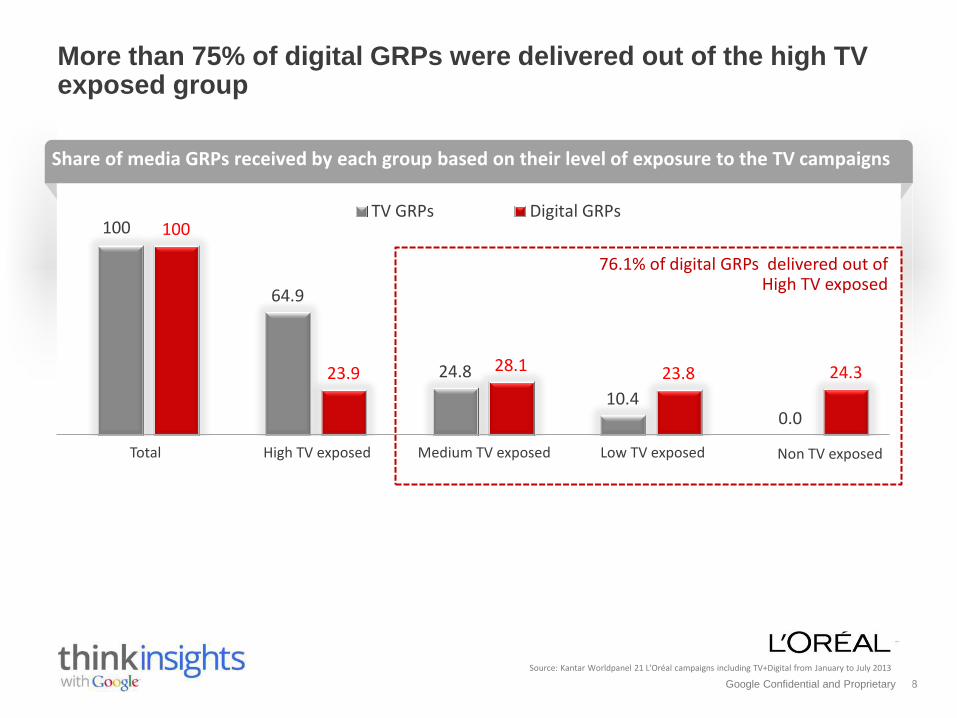
More than 75% of digital GRPs were delivered out of the high TV exposed group
8
100
64.9
24.8
10.4 0.0
100
23.9 28.1 23.8 24.3
TV GRPs Digital GRPs
Non TV exposed Total High TV exposed Medium TV exposed Low TV exposed
76.1% of digital GRPs delivered out of High TV exposed
Source: Kantar Worldpanel 21 L'Oréal campaigns including TV+Digital from January to July 2013
Share of media GRPs received by each group based on their level of exposure to the TV campaigns
Google Confidential and Proprietary
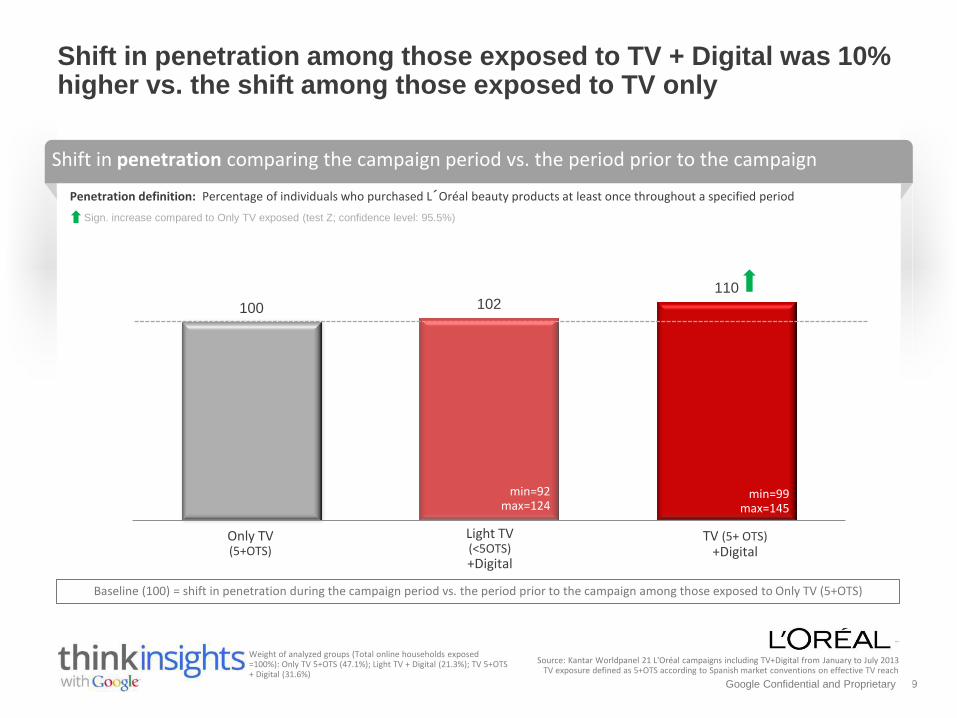
Shift in penetration among those exposed to TV + Digital was 10% higher vs. the shift among those exposed to TV only
9
100 102 110
Penetration definition: Percentage of individuals who purchased L´Oréal beauty products at least once throughout a specified period
Weight of analyzed groups (Total online households exposed =100%): Only TV 5+OTS (47.1%); Light TV + Digital (21.3%); TV 5+OTS + Digital (31.6%)
Shift in penetration comparing the campaign period vs. the period prior to the campaign
Baseline (100) = shift in penetration during the campaign period vs. the period prior to the campaign among those exposed to Only TV (5+OTS)
Only TV (5+OTS)
Light TV (<5OTS) +Digital
TV (5+ OTS) +Digital
Source: Kantar Worldpanel 21 L'Oréal campaigns including TV+Digital from January to July 2013 TV exposure defined as 5+OTS according to Spanish market conventions on effective TV reach
min=92 max=124
min=99 max=145
Sign. increase compared to Only TV exposed (test Z; confidence level: 95.5%)
Google Confidential and Proprietary
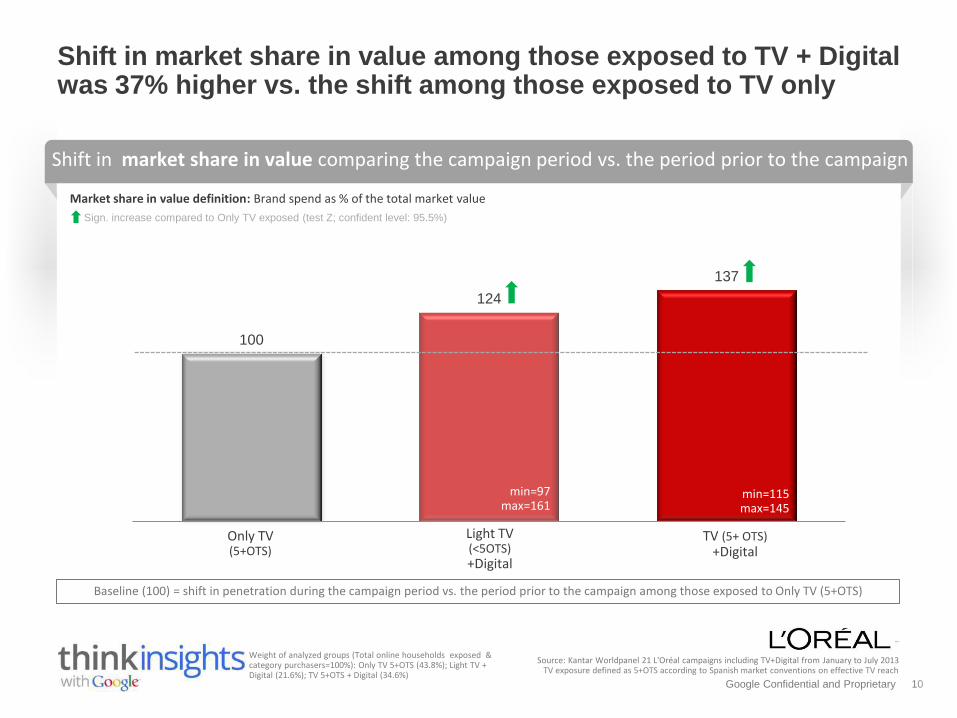
Shift in market share in value among those exposed to TV + Digital was 37% higher vs. the shift among those exposed to TV only
10
100
124
137
Shift in market share in value comparing the campaign period vs. the period prior to the campaign
Only TV (5+OTS)
Light TV (<5OTS) +Digital
TV (5+ OTS) +Digital
Market share in value definition: Brand spend as % of the total market value
min=97 max=161
min=115 max=145
Baseline (100) = shift in penetration during the campaign period vs. the period prior to the campaign among those exposed to Only TV (5+OTS)
Source: Kantar Worldpanel 21 L'Oréal campaigns including TV+Digital from January to July 2013 TV exposure defined as 5+OTS according to Spanish market conventions on effective TV reach
Weight of analyzed groups (Total online households exposed & category purchasers=100%): Only TV 5+OTS (43.8%); Light TV + Digital (21.6%); TV 5+OTS + Digital (34.6%)
Sign. increase compared to Only TV exposed (test Z; confident level: 95.5%)
Google Confidential and Proprietary 11
thank you!