Embed Size (px)
Citation preview
1
Experimental of the thermal energy storage through the utilization of Phase Change Materials (PCM)
in an office room
Ana Sofia Domingues Cabeça [email protected]
Instituto Superior Técnico, Universidade de Lisboa, Portugal
June 2018
Abstract
In order to assess the potential of six PCM gypsum wallboards an office room has been monitored during
approximatively eight days. Another room, identical to the first one, was not equipped with PCM wallboards but was
also monitored. Two experimental tests were performed and analyzed, using real measured data. Two different
configurations were taken into account: In scenario 1, PCM gypsum wallboards were incorporated into internal and
external walls as a final wall layer and in scenario 2, PCM wallboards located into the internal walls were removed and
suspended in the ceiling. A third experimental test was performed to validate several assumptions made in the analysis
of scenario 2. Air temperature fluctuating was reduced in the office with PCM in both experimental tests but was proven
that configuration of scenario 2 is the best choice. In the second test was found a maximum attenuation of 1°C between
the office with and without PCM. Results show that PCM was not able to solidify, and the effectiveness of the system
was reduced because of that. If night ventilation were used, the PCM inside the wallboards would have solidified during
the night and it would have the ability to complete thermal cycles. It was found that incorporate wallboards in external
walls is the best option since external factor like solar radiation and night cooling helps to complete the melting and
solidifying processes of PCM. If the study offices had low thermal inertia, PCM wallboards would reach a better thermal
performance.
Keywords: Phase Change Materials; High thermal inertia buildings; In-situ monitoring; Thermal energy storage;
1. Introduction
Phase change materials have received considerable attention since the first decade of the 21st century. The
major driving force behind intensification of R & D works is the increasing demand of global energy. Buildings are one
of the leading sectors in the energy consumption in the developed countries (Jelle & Kalnæs, 2017). Growth in
population, enhancement of building services and comfort levels, together with the rise in time spent inside buildings,
have raised building energy consumption. In the European Union this sector accounts for around 40% of the total energy
usage and a large part of this energy is directly related to the heating and cooling needs (Pérez-Lombard, Ortiz, & Pout,
2008).These needs can be reduced by incorporating phase change materials (PCMs) in passive latent heat thermal
energy storage systems (LHTES) of building’s walls, windows, ceilings or floors (Soares, Costa, Gaspar, & Santos,
2013).
In fact, PCMs are an effective way of storing thermal energy and have the advantages of high-energy storage
density and the isothermal nature of the storage process. This process occurs when at a certain temperature (melting
temperature) PCMs changes from solid to liquid (endothermic reaction). After that when air temperatures decrease,
PCMs change phase from liquid to solid and release heat (exothermic reaction). Given that the phase change
temperature is around the desired comfort room temperature, the energy used to change the phase of the material will
lead to a more stable and comfortable indoor climate, as well as cut peak cooling and heating loads (Sharma, Tyagi,
Chen, & Buddhi, 2009).
There are several materials that can be used as PCMs. They should have a large latent heat, high thermal
conductivity and melting temperature must lie in the practical range of operation. The material must melt congruently
with minimum subcooling and be chemical stable, low in cost, non-toxic and non-corrosive. Three groups are commonly
made: (i) organic compounds, (ii) inorganic compounds and (iii) inorganic eutectics or eutectic mixtures (Baetens, Jelle,
& Gustavsen, 2010). Organic PCMs could be paraffins, non-paraffins and inorganic PCMs are further described as
hydrated salts and metallics. A eutectic is a minimum-melting composition of 2 or more components that could be both
organics/inorganics or one organic and another inorganic.
The incorporation of PCMs in building application is needed to avoid problems like leaks of PCMs to the surface
and the diffuse of low viscous liquids throughout the material. Incorporation, immersion and encapsulation methods are
the three most promising methods to incorporate PCMs in the conventional construction materials, as reported by Hawes
(Hawes, Feldman, & Banu, 1993).
2
The optimization of integrating PCMs within passive LHTES systems and the optimal integration of these
systems within the building is a challenge. The major design parameters are the PCMs phase-change temperature, its
thermal mass quantity and its position within the LHTES system or, the position of the passive LHTES system within
the building (Soares et al., 2013). Moreover, parameters as climatic conditions, thermal inertia and ventilation rate need
to be specified. Thermal and energy performance of LHTES systems has different behaviors in lightweight and
heavyweight buildings. The first ones have low thermal inertia and consequently large temperature fluctuation, so PCMs
can provide a significant increase in thermal storage capacity and thermal comfort. In the other hand, heavyweight
buildings have already high thermal inertia so PCMs could improve thermal conditions but have marginal effects on
energy saving (Becker, 2014).
PCMs could be incorporated in construction materials as walls, windows, ceilings or floors. However, the most
common solution for implementing PCMs into buildings so far is by installing PCM wallboards in the inner side of the
building envelope. Several investigations have been conducted to evaluate how PCM wallboards affect the thermal and
energy performance of buildings. However, most of them are performed on a lightweight building and the results are
achieved by dynamic simulations.
In this study a heavyweight building is going to be used and results will be obtained by experimental tests. The
effect of incorporating six PCM gypsum wallboards in an office room going to be evaluated. Each wallboard has 18% in
mass of PCM (Micronal®) and a melting temperature of 23°C. In order to assess the potential of PCM gypsum
wallboards, the office room has been monitored during approximatively eight days (four days in each experimental
measurements). Another room, identical to the first one, was not equipped with PCM wallboards but also monitored, to
find and study the differences between thermal and energy performance of both offices. Two wallboards scenarios were
tested. In the scenario 1, PCM wallboards were incorporated into internal and external walls as a final wall layer and in
scenario 2, PCM wallboards located into the internal walls were removed and suspended in the ceiling. A third
experimental test was performed in order to validate several assumptions made in the analysis of scenario 2.
Fluctuation of air temperature was reduced in the office with PCM in both experimental tests but was proven
that scenario 2 was the best choice. In this experimental test was found a maximum attenuation of 1°C between the
office with and without PCM. In both cases, PCMs wallboards couldn’t complete thermal cycles because PCM was not
able to solidify, affecting the effectiveness of the system. Total heat stored and released by each wallboard and PCM
storage efficiency was computed and analyzed.
2. Material and Methodology
2.1 Building characterization
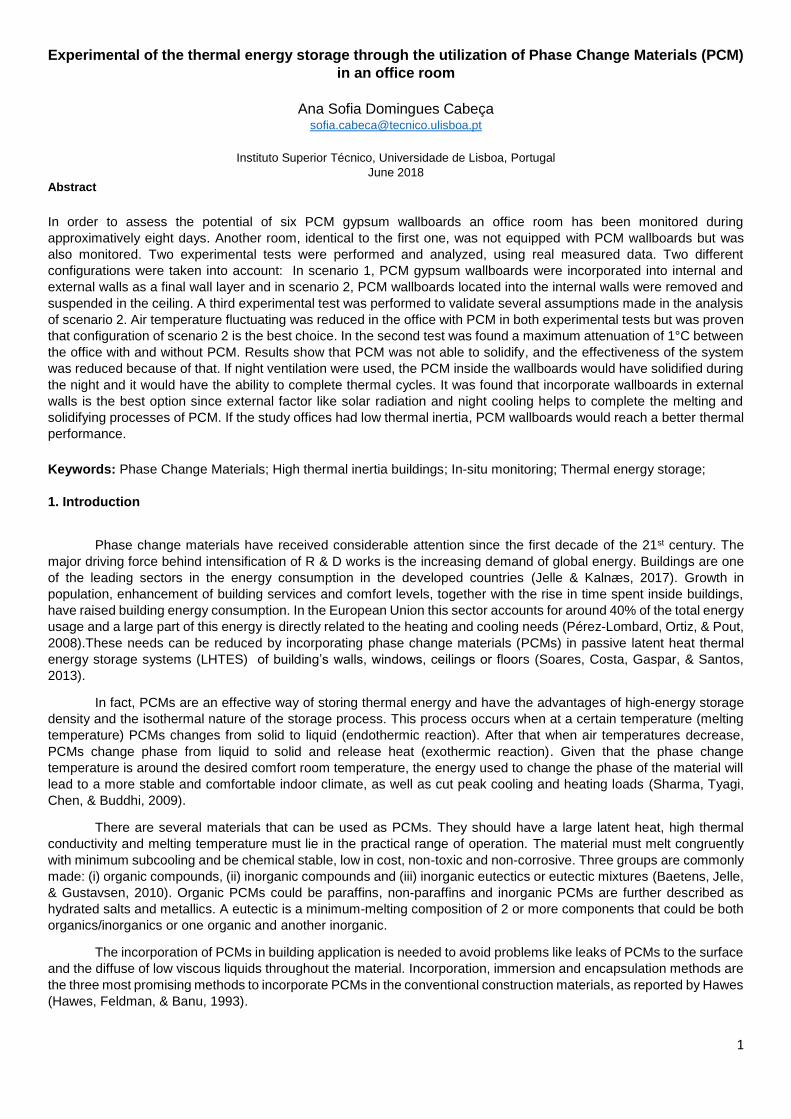
The office rooms studied in this paper are located in a university building, named IST-Taguspark, placed in
Oeiras. The geometry of two offices is the same. They present an area of 13,14 m2 and height between 3,01m and
3,26m. The rooms are bordered by two other rooms and a corridor.
This building has a heavy weight construction, looking to the global heat transfer coefficient (U) (Table 1) is
possible to see that it assumes low values for the roof and external walls, meaning that the building is well insulated.
Thermal inertia is high, ceiling and floor can store up to 4,5 kWh and 3,8 KWh, respectively with a temperature variation
of 1°C. In order to calculate the air change rate, the CO2 concentration decay method was used. It was found an air
change for the office of 0,172 h-1.
Figure 1- a) Offices with and without PCM, top perspective; b) Offices 3D geometry
Office
with
PCM
Office
without
PCM
a) b)
3
2.2 PCM characterization and methodology of analysis
The product tested, Knauf Comfortboard 23 is constituted by 18% of microencapsulated paraffin (Micronal®)
within a copolymer. The final form of the composite PCM is a gypsum wallboard (2x1,25m) of 12,5 mm thickness which
density is about 880 kg/m3. The thermal conductivity is 0,23 (W/m.K) in liquid/solid phase and has a specific heat of
1170 J/kg.K. The melting and solidifying temperatures of Micronal® PCM are 23°C (𝑇𝑚) and 22 °C (𝑇𝑠) respectively.
However, melting process of a real PCM does not entirely occur at a given temperature, it is completed over a certain
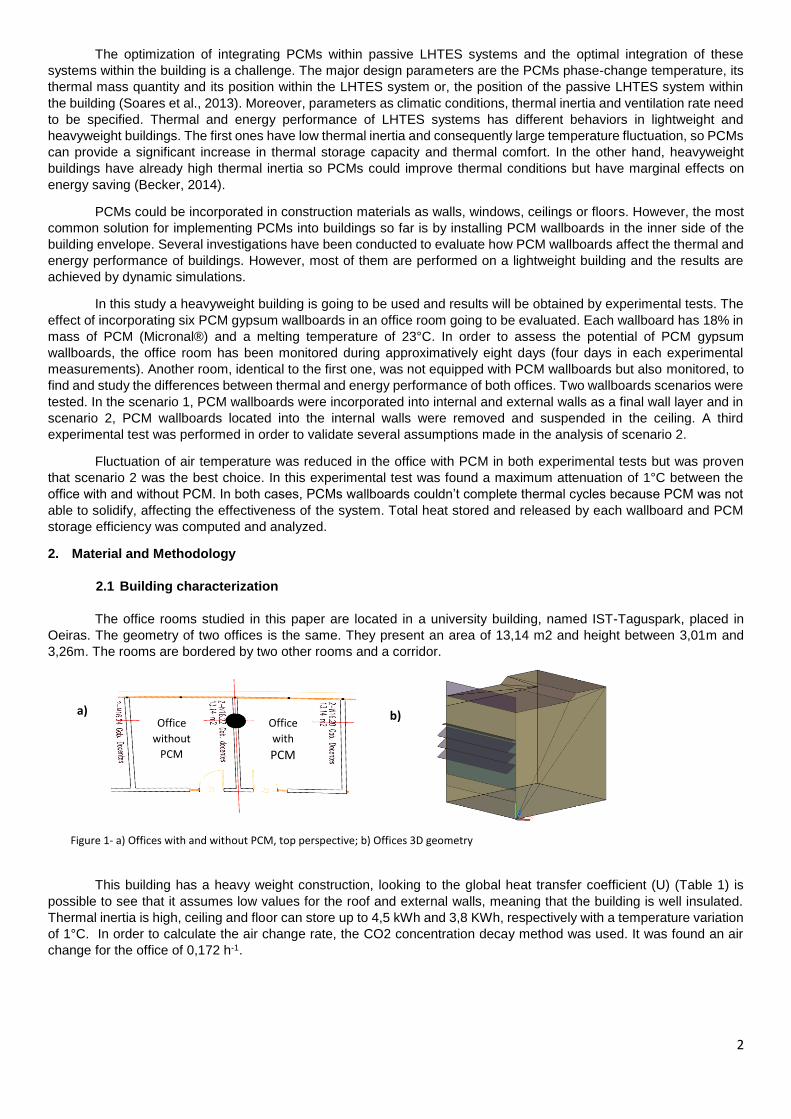
temperature range. The equivalent specific heat capacity (Ceq) is used to quantify total energy storage during phase
change range. The evaluation of this parameter is performed through laboratory tests, by imposing a periodic
temperature variation to a PCM and then measuring its enthalpy variation (Δℎ). Ceq represents the amount of thermal
energy needed to produce a unit temperature variation in the unit mass of PCM at constant pressure (Evola & Marletta,
2014).
𝐶𝑒𝑞(𝑇) =Δℎ(𝑇)
Δ𝑇 [kJ/kg] (1)
The equivalent heat capacity normally has a behavior of a Gaussian curve, with a maximum value occurring at
the peak melting temperature, 23°C. In this case, PCM has a different behavior in melting and solidifying process, so
there are two curves of Ceq (Figure 2).
Table 1- Construction materials properties and heat transfer coefficient of building constructions
Construction Materials Thickness
(m) Conductivity
[W/m.°C] Density [kg/m3]
Specific heat [J/kg.°C]
Heat transfer coefficient (U) [W/m2.°C]
Interior Walls
Gypsum plastering
0,005 0,3 600 920
1,13 Brickwork 0,25 0,39 1200 920
Gypsum plastering
0,005 0,3 600 920
Upper external wall
Cement board 0,01 0,48 1500 1800
0,55
Extruded polystyrene
0,05 0,037 30 1550
Concrete 0,08 2,2 2300 900
Air gap 0,015 ~0,025 - -
Gypsum plastering
0,005 0,3 600 920
Bottom external wall
Cement board 0,01 0,48 1500 1800
0,58
Extruded polystyrene
0,05 0,037 30 1550
Mortar 0,02 1,3 1900 1046
Screed 0,2 1,65 2000 900
Gypsum plastering
0,005 0,3 600 920
Roof
Concrete slab 0,06 1,13 2000 1000
0,50/0,51/0,53
Extruded polystyrene
0,05 0,037 30 1550
Waterproofing cloth
0,002 0,14 1200 1000
Screed 0,03 1,13 2000 1000
Clay concrete 0,2 1,3 1460 880
Concrete 0,35/0,22/
0,47 2,2 2300 900
Gypsum plastering
0,005 0,3 600 920
Floor
Gypsum plastering
0,05 0,3 600 920
1,77 Concrete 0,47 2,2 2300 900
Timber flooring 0,02 1,3 2300 1000
4
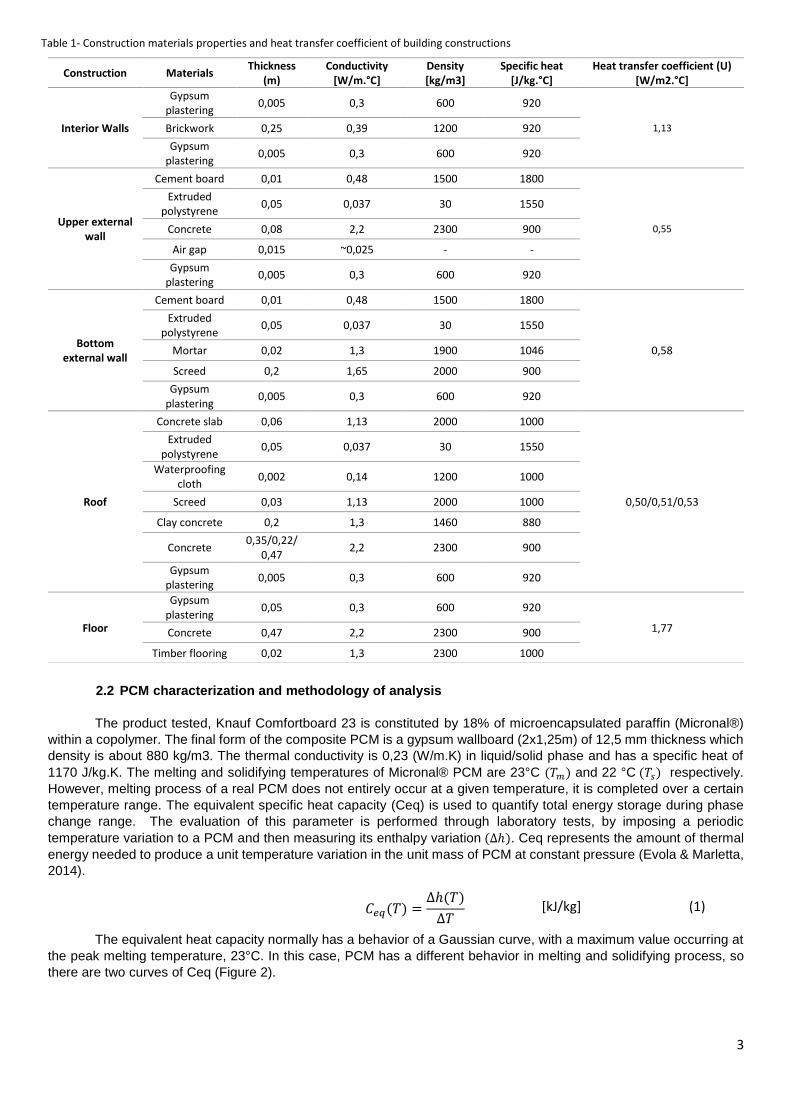
Melting and solidifying enthalpy curves are different due to material hysteresis (Figure 3). To quantify the total
energy stored and released by the wallboards in the two experimental tests, the following equation was used:
𝑄𝑇 = 𝑄𝑠 + 𝑄𝐿 = ∫ 𝑚 𝐶𝑝 𝑑𝑇 + 𝑚 𝑓𝑚
𝑇2
𝑇1
Δh [kJ] (2)
Where, 𝑄𝑇 is the total heat stored/released (kJ), 𝑄𝑠 is the sensible heat, 𝑄𝐿 is the latent heat, 𝑚 the mass (kg) ,
𝐶𝑝 the specific heat (kJ/kg), 𝑇2 and 𝑇1, final and initial temperature, 𝑓𝑚 the material fraction ongoing phase change and
Δ𝐻 the enthalpy variation. In order to achieve better accuracy, the last parameter is based on the average between both
enthalpy curves.
It’s important to consider that not all the conditions inside the melting temperature range have the same
importance from an energy point of view. Temperatures close to 23°C (melting temperature) have a thermal energy
capacity much higher than phase change onset temperature, so in order to evaluate the performance of PCM in real
conditions, PCM storage efficiency was computed. This parameter is the ratio of the thermal energy actually stored 𝐸𝑠𝑡
by the PCM to its maximum storage capacity (𝐿), i.e the latent heat (equation 3). Due to daily temperature cycles, actual
energy storage must be evaluated over a period of 24hours (P). The maximum storage capacity was given by the
manufacturer and has a value of 200 kJ/m2 of wallboard. Thermal energy actually stored was calculated by equation
(2).
𝜂𝑃𝐶𝑀 =𝐸𝑠𝑡
𝐿=
∫ 𝑃 (𝐶𝑒𝑞 .𝑑𝑇𝑃𝐶𝑀
𝑑𝑡) 𝑑𝑡
∫ 𝐶𝑒𝑞(𝑇)𝑇𝑠
𝑇𝑚𝑑𝑡
(3)
0,00
10,00
20,00
30,00
40,00
50,00
5 7 9 11 13 15 17 19 21 23 25 27
Enth
alp
y (k
J/kg
)
°C
Melting Enthalpy Curve Solidifying Enthalpy Curve
Average Enthalpy Curve
Figure 3- Melting, solidifying and average enthalpy curves
1,00
2,00
3,00
4,00
5,00
6,00
7,00
8,00
0 5 10 15 20 25 30
SPEC
IFIC
HEA
T [K
J/K
G]
TEMPERATURE [°C]
Ceq of melting process (KJ/kg)
Ceq of solidifying process(KJ/kg)
Figure 2-Equivalent specific heat capacity of the Knauf Comfortboard 23
5
2.3 Materials and experimental procedures
The air temperatures of two offices were measured using two data loggers HOBO U12-011 Temp/RH with an accuracy of ±0,35°C and ±2,5% for relative humidity. Another data logger was used (Data logger Omega®) in order to measure air temperature at different height and the surface temperature of walls/PCM wallboards. The thermocouples used were of the K type with an accuracy of about ±0,5 ºC. A meteorological station (Davis Vantage Pro2) was also installed on this site to measure the solar radiation on the facade of the office rooms and the outside air temperature. A thermographic camera Milwaukee®, model M12™ 160 X 120 Thermal Imager Kit was used to take thermographic images of PCM wallboards.
Several procedures were applied in the two experimental tests:
-Two days before the beginning of experimental tests, HVAC system was turn on in order to remove the storage heat from PCM wallboards, building constructions and to homogenize the air temperature between offices. The temperature of flux was set at 15°C and the system was turn off seconds before the beginning of experimental measurements; - During experimental tests there was no one at the offices, HVAC system was off, and doors and windows were permanently closed; - All data was recorded with a time step of 15 min;
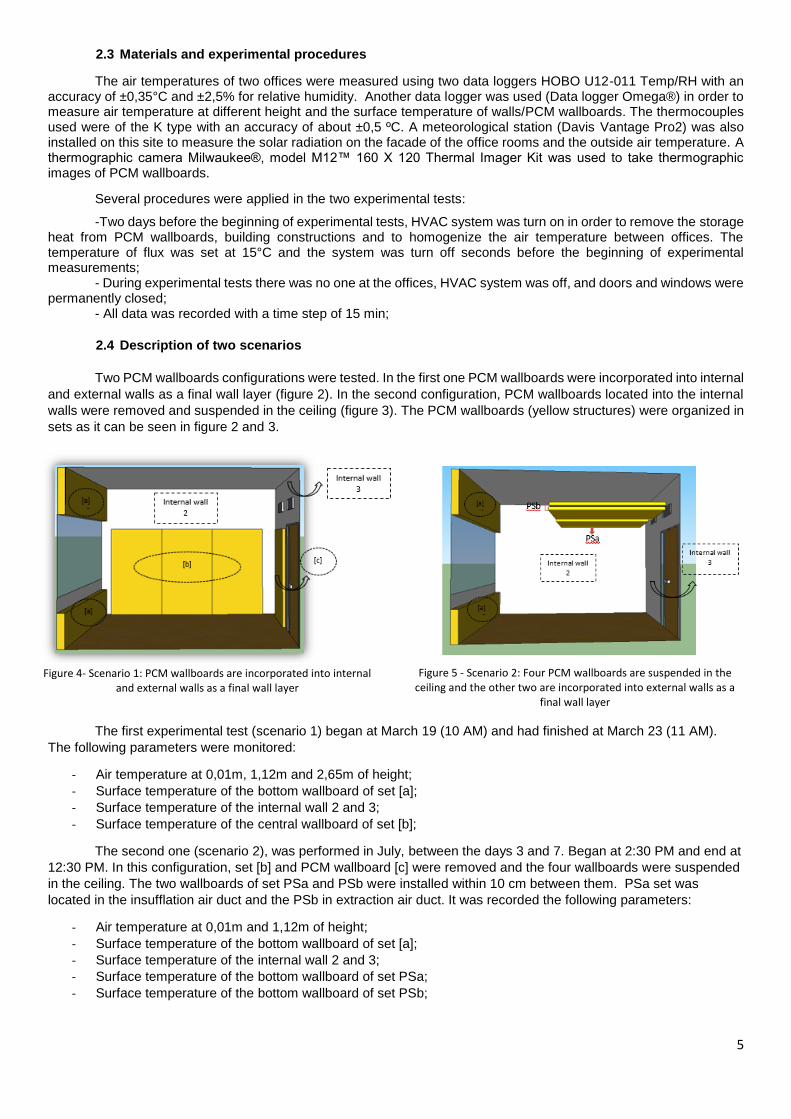
2.4 Description of two scenarios
Two PCM wallboards configurations were tested. In the first one PCM wallboards were incorporated into internal
and external walls as a final wall layer (figure 2). In the second configuration, PCM wallboards located into the internal
walls were removed and suspended in the ceiling (figure 3). The PCM wallboards (yellow structures) were organized in
sets as it can be seen in figure 2 and 3.
The first experimental test (scenario 1) began at March 19 (10 AM) and had finished at March 23 (11 AM).
The following parameters were monitored:
- Air temperature at 0,01m, 1,12m and 2,65m of height;
- Surface temperature of the bottom wallboard of set [a];
- Surface temperature of the internal wall 2 and 3;
- Surface temperature of the central wallboard of set [b];
The second one (scenario 2), was performed in July, between the days 3 and 7. Began at 2:30 PM and end at
12:30 PM. In this configuration, set [b] and PCM wallboard [c] were removed and the four wallboards were suspended
in the ceiling. The two wallboards of set PSa and PSb were installed within 10 cm between them. PSa set was
located in the insufflation air duct and the PSb in extraction air duct. It was recorded the following parameters:
- Air temperature at 0,01m and 1,12m of height;
- Surface temperature of the bottom wallboard of set [a];
- Surface temperature of the internal wall 2 and 3;
- Surface temperature of the bottom wallboard of set PSa;
- Surface temperature of the bottom wallboard of set PSb;
Figure 5 - Scenario 2: Four PCM wallboards are suspended in the ceiling and the other two are incorporated into external walls as a
final wall layer
Figure 4- Scenario 1: PCM wallboards are incorporated into internal and external walls as a final wall layer
6
A third experimental test was performed at July 17 between 11:50 am and 7:15 pm. HVAC system was turn
on at 10:00 am and turn off at 4:00 pm. The location of wallboards was the same of scenario 2 and thermographic
images were taken with a time step of 1 hour.
In all experimental tests, outside air temperature and solar radiation were monitored.
3. Results and discussion
This section is devoted to experimental data analysis of both scenarios. Real data of the offices air temperature, walls
temperature and PCM wallboards temperature going to be expose and discussed. The real heat storage capacity of
PCM wallboard’s going to be quantify and PCM storage efficiency will be assessed.
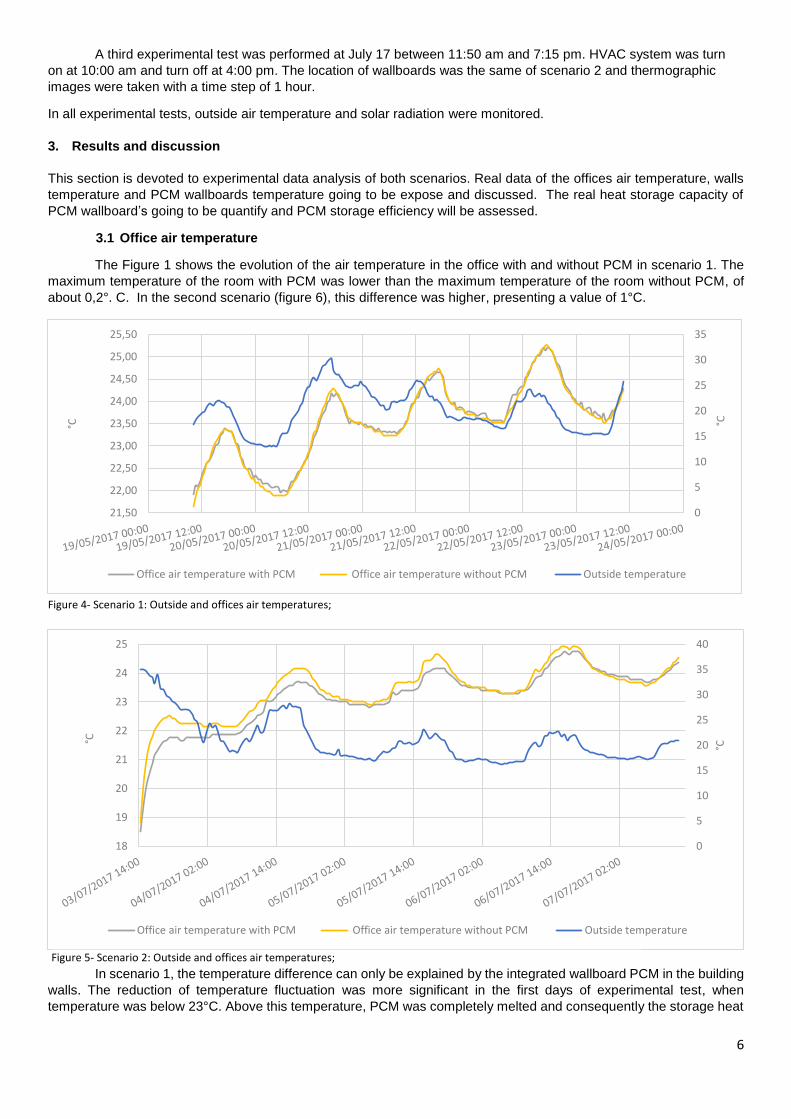
3.1 Office air temperature
The Figure 1 shows the evolution of the air temperature in the office with and without PCM in scenario 1. The
maximum temperature of the room with PCM was lower than the maximum temperature of the room without PCM, of
about 0,2°. C. In the second scenario (figure 6), this difference was higher, presenting a value of 1°C.
In scenario 1, the temperature difference can only be explained by the integrated wallboard PCM in the building
walls. The reduction of temperature fluctuation was more significant in the first days of experimental test, when
temperature was below 23°C. Above this temperature, PCM was completely melted and consequently the storage heat
0
5
10
15
20
25
30
35
21,50
22,00
22,50
23,00
23,50
24,00
24,50
25,00
25,50
°C°C
Office air temperature with PCM Office air temperature without PCM Outside temperature
Figure 4- Scenario 1: Outside and offices air temperatures;
0
5
10
15
20
25
30
35
40
18
19
20
21
22
23
24
25
°C
°C
Office air temperature with PCM Office air temperature without PCM Outside temperature
Figure 5- Scenario 2: Outside and offices air temperatures;
7
capacity was much lower. In the last days, temperature fluctuation was very similar in both offices since the effect of the
PCM was almost null.
In the first day of second experimental test (July 3) after HVAC system was turned off, air temperature increased in both offices. However, it is possible to see that the rise of air temperature in office with PCM was slightly lower than in the office without PCM. This fact can be explained by the presence of PCM wallboards. When the air temperature reached the melting temperature range, PCM started to melt and heat was removed from air. If PCM wallboards had not been incorporated in the office, air temperature would reach a temperature of 22,5°C instead of 21,8°C. During this experimental test, temperature difference between the two offices decreased as it happened in the first one.
In the both experimental tests, PCM was not able to solidify and the effectiveness of the system was reduced. Since the discharge didn´t happen naturally, cool air should be supplied during the nighttime to reset the PCM.
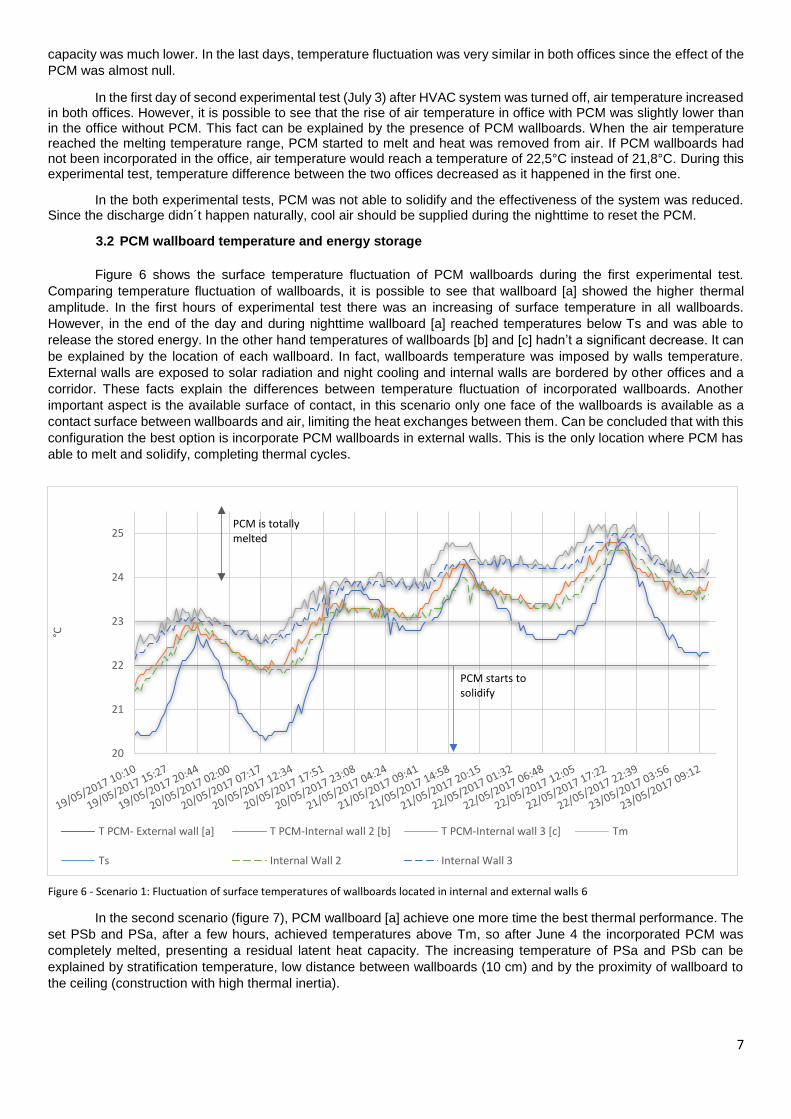
3.2 PCM wallboard temperature and energy storage
Figure 6 shows the surface temperature fluctuation of PCM wallboards during the first experimental test.
Comparing temperature fluctuation of wallboards, it is possible to see that wallboard [a] showed the higher thermal
amplitude. In the first hours of experimental test there was an increasing of surface temperature in all wallboards.
However, in the end of the day and during nighttime wallboard [a] reached temperatures below Ts and was able to
release the stored energy. In the other hand temperatures of wallboards [b] and [c] hadn’t a significant decrease. It can
be explained by the location of each wallboard. In fact, wallboards temperature was imposed by walls temperature.
External walls are exposed to solar radiation and night cooling and internal walls are bordered by other offices and a
corridor. These facts explain the differences between temperature fluctuation of incorporated wallboards. Another
important aspect is the available surface of contact, in this scenario only one face of the wallboards is available as a
contact surface between wallboards and air, limiting the heat exchanges between them. Can be concluded that with this
configuration the best option is incorporate PCM wallboards in external walls. This is the only location where PCM has
able to melt and solidify, completing thermal cycles.
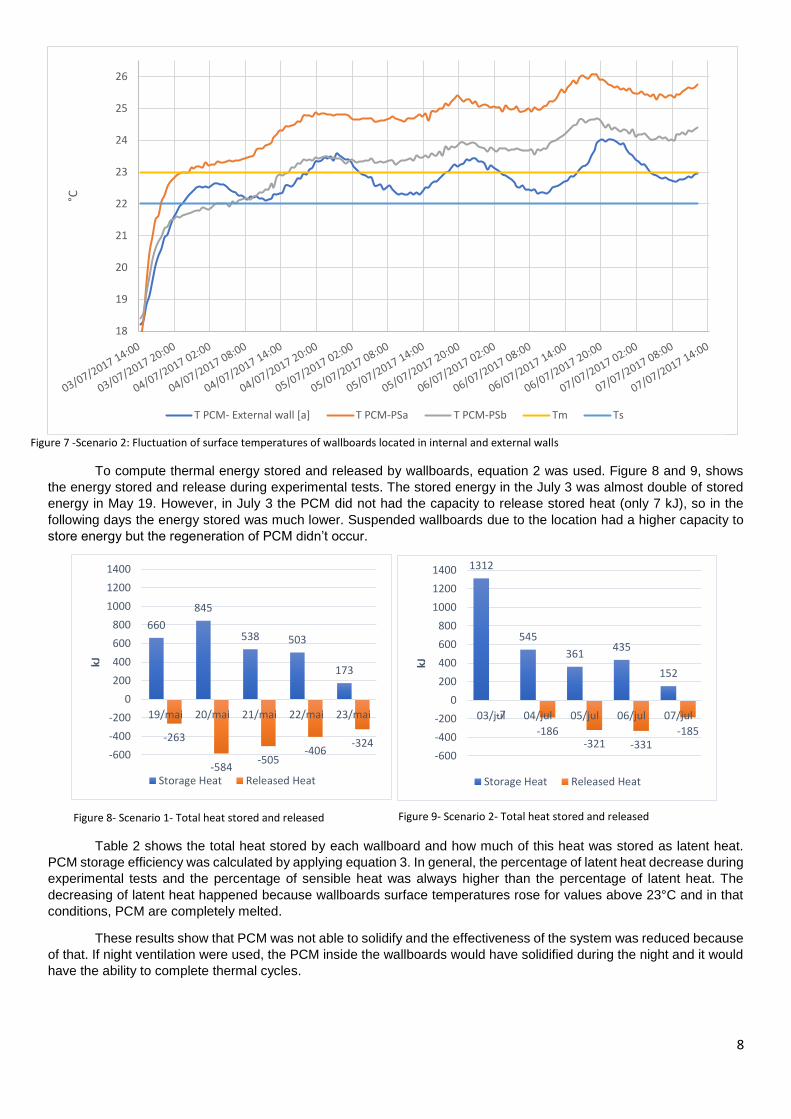
In the second scenario (figure 7), PCM wallboard [a] achieve one more time the best thermal performance. The
set PSb and PSa, after a few hours, achieved temperatures above Tm, so after June 4 the incorporated PCM was
completely melted, presenting a residual latent heat capacity. The increasing temperature of PSa and PSb can be
explained by stratification temperature, low distance between wallboards (10 cm) and by the proximity of wallboard to
the ceiling (construction with high thermal inertia).
20
21
22
23
24
25
°C
T PCM- External wall [a] T PCM-Internal wall 2 [b] T PCM-Internal wall 3 [c] Tm
Ts Internal Wall 2 Internal Wall 3
PCM starts to solidify
PCM is totally melted
Figure 6 - Scenario 1: Fluctuation of surface temperatures of wallboards located in internal and external walls 6
8
To compute thermal energy stored and released by wallboards, equation 2 was used. Figure 8 and 9, shows
the energy stored and release during experimental tests. The stored energy in the July 3 was almost double of stored
energy in May 19. However, in July 3 the PCM did not had the capacity to release stored heat (only 7 kJ), so in the
following days the energy stored was much lower. Suspended wallboards due to the location had a higher capacity to
store energy but the regeneration of PCM didn’t occur.
Table 2 shows the total heat stored by each wallboard and how much of this heat was stored as latent heat.
PCM storage efficiency was calculated by applying equation 3. In general, the percentage of latent heat decrease during
experimental tests and the percentage of sensible heat was always higher than the percentage of latent heat. The
decreasing of latent heat happened because wallboards surface temperatures rose for values above 23°C and in that
conditions, PCM are completely melted.
These results show that PCM was not able to solidify and the effectiveness of the system was reduced because
of that. If night ventilation were used, the PCM inside the wallboards would have solidified during the night and it would
have the ability to complete thermal cycles.
18
19
20
21
22
23
24
25
26°C
T PCM- External wall [a] T PCM-PSa T PCM-PSb Tm Ts
660
845
538 503
173
-263
-584-505
-406-324
-600
-400
-200
0
200
400
600
800
1000
1200
1400
19/mai 20/mai 21/mai 22/mai 23/mai
kJ
Storage Heat Released Heat
Figure 7 -Scenario 2: Fluctuation of surface temperatures of wallboards located in internal and external walls
Figure 8- Scenario 1- Total heat stored and released
1312
545
361435
152
-7
-186-321 -331
-185
-600
-400
-200
0
200
400
600
800
1000
1200
1400
03/jul 04/jul 05/jul 06/jul 07/jul
kJ
Storage Heat Released Heat
Figure 9- Scenario 2- Total heat stored and released
9
Table 2- Values of total heat stored(Qt), latent heat stored (QL) and PCM storage efficiency ( )
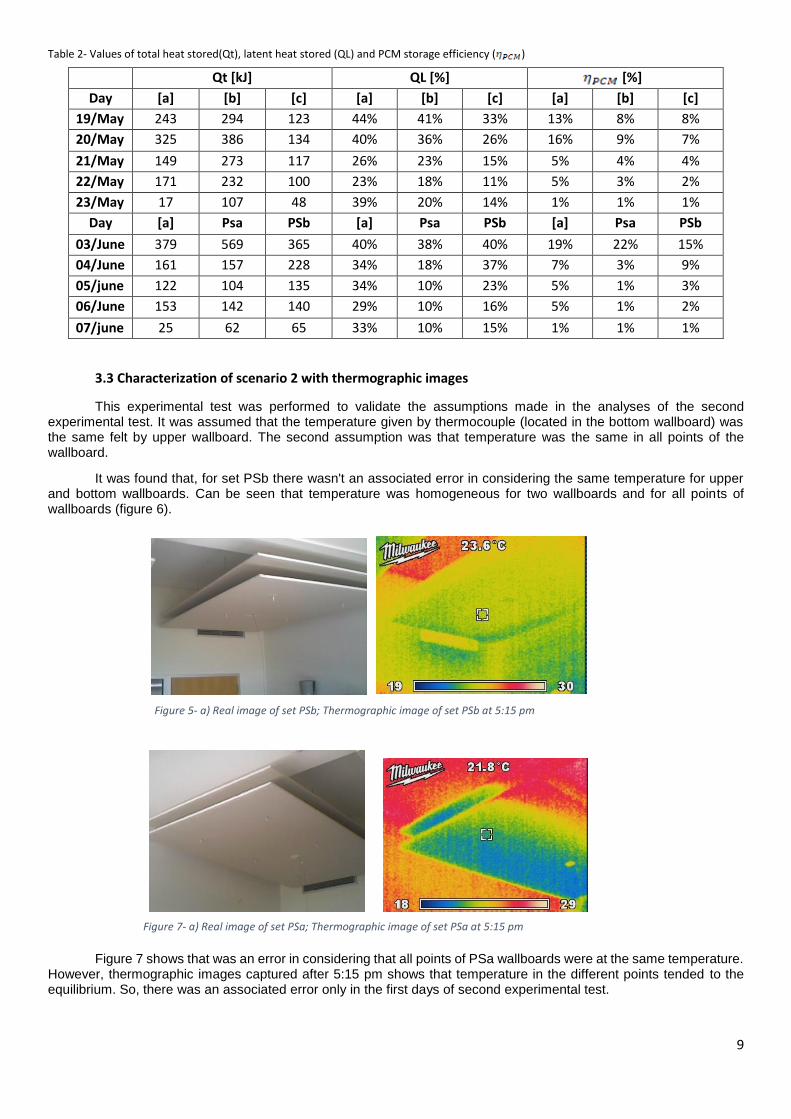
3.3 Characterization of scenario 2 with thermographic images
This experimental test was performed to validate the assumptions made in the analyses of the second experimental test. It was assumed that the temperature given by thermocouple (located in the bottom wallboard) was the same felt by upper wallboard. The second assumption was that temperature was the same in all points of the wallboard.
It was found that, for set PSb there wasn't an associated error in considering the same temperature for upper and bottom wallboards. Can be seen that temperature was homogeneous for two wallboards and for all points of wallboards (figure 6).
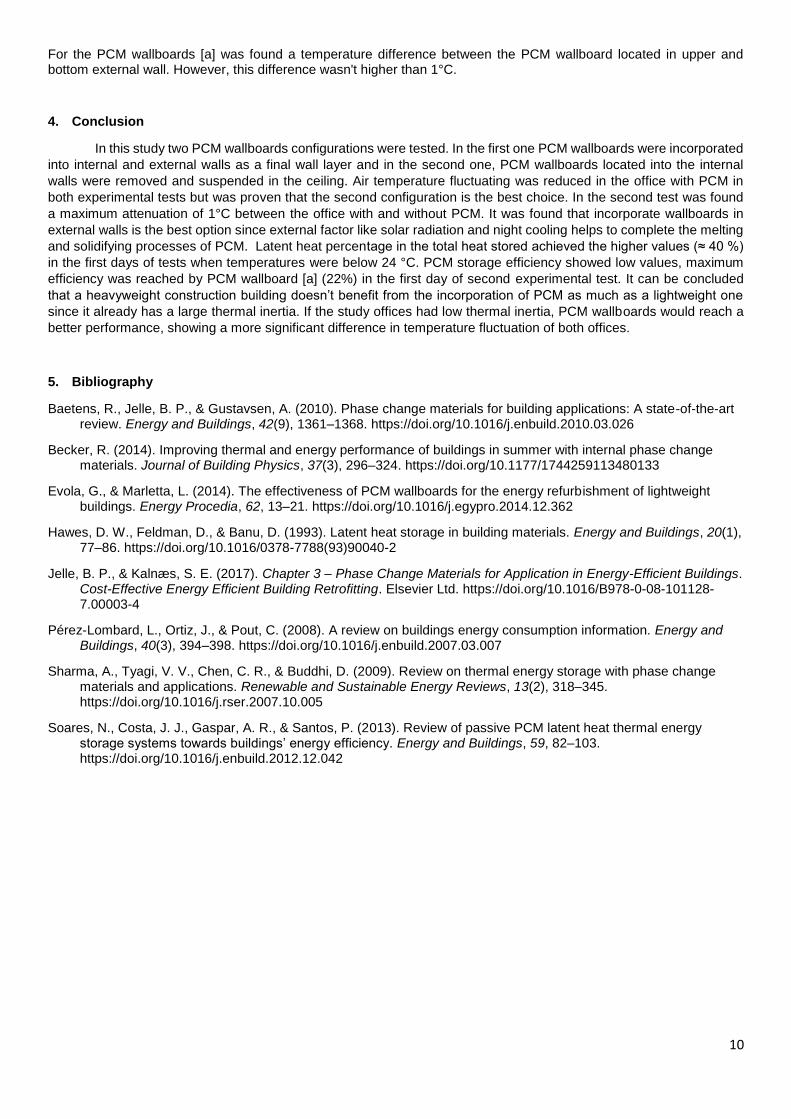
Figure 7 shows that was an error in considering that all points of PSa wallboards were at the same temperature. However, thermographic images captured after 5:15 pm shows that temperature in the different points tended to the equilibrium. So, there was an associated error only in the first days of second experimental test.
Qt [kJ] QL [%] [%]
Day [a] [b] [c] [a] [b] [c] [a] [b] [c]
19/May 243 294 123 44% 41% 33% 13% 8% 8%
20/May 325 386 134 40% 36% 26% 16% 9% 7%
21/May 149 273 117 26% 23% 15% 5% 4% 4%
22/May 171 232 100 23% 18% 11% 5% 3% 2%
23/May 17 107 48 39% 20% 14% 1% 1% 1%
Day [a] Psa PSb [a] Psa PSb [a] Psa PSb
03/June 379 569 365 40% 38% 40% 19% 22% 15%
04/June 161 157 228 34% 18% 37% 7% 3% 9%
05/june 122 104 135 34% 10% 23% 5% 1% 3%
06/June 153 142 140 29% 10% 16% 5% 1% 2%
07/june 25 62 65 33% 10% 15% 1% 1% 1%
Figure 5- a) Real image of set PSb; Thermographic image of set PSb at 5:15 pm
Figure 7- a) Real image of set PSa; Thermographic image of set PSa at 5:15 pm
10
For the PCM wallboards [a] was found a temperature difference between the PCM wallboard located in upper and bottom external wall. However, this difference wasn't higher than 1°C.
4. Conclusion
In this study two PCM wallboards configurations were tested. In the first one PCM wallboards were incorporated
into internal and external walls as a final wall layer and in the second one, PCM wallboards located into the internal
walls were removed and suspended in the ceiling. Air temperature fluctuating was reduced in the office with PCM in
both experimental tests but was proven that the second configuration is the best choice. In the second test was found
a maximum attenuation of 1°C between the office with and without PCM. It was found that incorporate wallboards in
external walls is the best option since external factor like solar radiation and night cooling helps to complete the melting
and solidifying processes of PCM. Latent heat percentage in the total heat stored achieved the higher values (≈ 40 %)
in the first days of tests when temperatures were below 24 °C. PCM storage efficiency showed low values, maximum
efficiency was reached by PCM wallboard [a] (22%) in the first day of second experimental test. It can be concluded
that a heavyweight construction building doesn’t benefit from the incorporation of PCM as much as a lightweight one
since it already has a large thermal inertia. If the study offices had low thermal inertia, PCM wallboards would reach a
better performance, showing a more significant difference in temperature fluctuation of both offices.
5. Bibliography
Baetens, R., Jelle, B. P., & Gustavsen, A. (2010). Phase change materials for building applications: A state-of-the-art review. Energy and Buildings, 42(9), 1361–1368. https://doi.org/10.1016/j.enbuild.2010.03.026
Becker, R. (2014). Improving thermal and energy performance of buildings in summer with internal phase change materials. Journal of Building Physics, 37(3), 296–324. https://doi.org/10.1177/1744259113480133
Evola, G., & Marletta, L. (2014). The effectiveness of PCM wallboards for the energy refurbishment of lightweight buildings. Energy Procedia, 62, 13–21. https://doi.org/10.1016/j.egypro.2014.12.362
Hawes, D. W., Feldman, D., & Banu, D. (1993). Latent heat storage in building materials. Energy and Buildings, 20(1), 77–86. https://doi.org/10.1016/0378-7788(93)90040-2
Jelle, B. P., & Kalnæs, S. E. (2017). Chapter 3 – Phase Change Materials for Application in Energy-Efficient Buildings. Cost-Effective Energy Efficient Building Retrofitting. Elsevier Ltd. https://doi.org/10.1016/B978-0-08-101128-7.00003-4
Pérez-Lombard, L., Ortiz, J., & Pout, C. (2008). A review on buildings energy consumption information. Energy and Buildings, 40(3), 394–398. https://doi.org/10.1016/j.enbuild.2007.03.007
Sharma, A., Tyagi, V. V., Chen, C. R., & Buddhi, D. (2009). Review on thermal energy storage with phase change materials and applications. Renewable and Sustainable Energy Reviews, 13(2), 318–345. https://doi.org/10.1016/j.rser.2007.10.005
Soares, N., Costa, J. J., Gaspar, A. R., & Santos, P. (2013). Review of passive PCM latent heat thermal energy storage systems towards buildings’ energy efficiency. Energy and Buildings, 59, 82–103. https://doi.org/10.1016/j.enbuild.2012.12.042


![Hygino Domingues-Fundamentos de Aritmetica[001-013]](https://img.pdfslide.us/doc/110x75/5571fc2c497959916996a8e0/hygino-domingues-fundamentos-de-aritmetica001-013-559bf82c756cd.jpg)
