Embed Size (px)
Citation preview

AN OVERVIEW OVER THE NATIONAL FREIGHT MODEL FOR NORWAY
Conference on National and International Freight Transport Models
Inger Beate Hovi and Arild Vold Institute of Transport Economics (TOI)
ABSTRACT
The objective of this paper is to describe the historical development of the National freight model system for Norway, to present the current version and the ongoing and proposed further development of the model system. Presentation of the current version start out by a brief description of the main components NEMO and PINGO that comprise the real network model for road, train and waterborne freight transport within Norway and between Norway and other countries (NEMO) and the SCGE model for Norway (PINGO) for prediction of regional and interregional freight transport. The interactions between the models are also described. This is followed by a closer look at NEMO, where the major modules: Cost functions, basic OD matrices, network and assignment are described. Ongoing and proposed future development is described and recent applications are briefly summarized. Together NEMO and PINGO comprise a real network freight model with elastic demand. There are no capacity constraints in NEMO, thus there is no need for iterative interaction between PINGO and NEMO to achieve equilibrium between transport costs calculated by NEMO and demand for transport calculated by PINGO. Model evaluation has demonstrated plausible results at aggregated levels, and although further developments are needed to improve reliability at finer levels of aggregation, recent model applications have demonstrated rich opportunities for analysis of transport related effects and effects on the rest of the economy with the current version.

2 Book title (do not insert)
2
1 BACKGROUND
The first attempt to establish a national model for freight transport in Norway was a general equilibrium model for Norway (GODMOD) with focus on freight transport, a submodel for passenger transport was also included in the latest version (Jensen and Eriksen, 1997). GODMOD was consistent with the Norwegian macro economic planning models, and was used for national forecasts for freight transport but didn’t represent the spatial differentiation of where transport activity takes place. For analysis of transport activity, it is essential for purposes, however, to represent the spatial dimension of where transport activity takes place.
Tree years later therefore a first attempt to establish a national model for freight transport with a geographic dimension started. The work was carried out by the Institute of Transport Economics (TOI) in cooperation with SINTEF/MARINTEK (Ingebrigtsen et al, 1997). The model was operative in 1997 and included basic origin-destination (OD) matrices for freight flow between Norwegian municipalities for four commodity groups and a real network freight model with representation of transport infrastructure for tree modes (road, rail and sea-borne transport) corresponding costs functions, which was sufficient to apply assignment algorithms of the STAN software package (INRO) to calculate mode choice and route choice for transport of the four commodity groups between the municipalities.
In 1997 started the development of a sub model for Norwegian import and export (Madslien et. al, 2000). This work was based on the network from the STEMM model (xxxx) that also was implemented in STAN, but for Norway a more detailed network was used. The zonal size in this model was at municipality level for Norway, country level was used for European countries, while other continents were represented by one to tree zones each. This model included six commodity groups and six different modes (road, rail, ferry and tree sea-borne modes). During the period 2001 to 2002, the network model was updated and further developed by representing freight flows by 11 commodity groups, the methodological basis for construction of basic OD matrices was improved and the cost functions were refined (Vold et. al, 2002). The network model was supplemented by a spatial forecasting model for freight flows in Norway (PINGO), developed as a SCGE model (Spatial Computable General Equilibrium model). This paper gives a brief overview of the complete national freight model for Norway (NEMO/PINGO), with focus on the network model (NEMO). An other paper presented at this conference gives a more detailed description of the SCGE model PINGO (Ivanova et al, 2003). Chapter 2 contains a short overview of the freight model system in Norway. A closer look at the network model is presented in chapter 3. Some examples of applications are given in chapter 4 and finally in chapter 5 we have made a short summary of further development of the network model.

The national freight model for Norway 3
3
2 A SHORT OVERVIEW OVER THE FREIGHT MODEL SYSTEM IN NORWAY
The Norwegian models for national and international freight transport consists of the real network model for road, train and waterborne freight transport within Norway and between Norway and other countries (NEMO) and the SCGE model for Norway (PINGO) for prediction of regional and interregional freight transport.
2.1 NEMO
NEMO is used to calculate transport costs and transport outputs like mode specific transport works (in tonne km) per transported commodity group, and are suitable in analyzing short term transport effects of changes in operative transport costs (NOK/tonnekm) and infrastructure. NEMO is basically a model for transport chain and route choice. It includes 11 commodity groups. For each commodity group it calculate the cheapest transport chains between zones consisting of one or a combination of the modes truck, train and boat. NEMO is calibrated for a base year situation (1999) on the basis of basic data of production, input factors to production, commodity trade, and foreign trade statistics, whereas traffic counts are applied for evaluation. There are no capacity constraints in NEMO, which means that it makes no sense to differentiate by time of day. NEMO assesses operative and quality related costs of the transport based on calculation of transport chains and route choice between suppliers and demanders (i.e., between all OD pairs). NEMO also calculate mode specific tonne km for each commodity group based on respective OD matrices.
2.2 PINGO
PINGO (Ivanova, Vold and Jean-Hansen, 2002 and 2003) is used to forecast demand for freight transport between and within all pair of counties in Norway and between Norway and other countries for a future year of base case situation, and is also capable of assessing the future effects on demand of changes in for instance transport costs relative to the base case situation. PINGO forecasts the total OD matrices for each of the NEMO commodities in terms of growth rates for the commodity demand and flows between all pair of counties. PINGO is more aggregated than NEMO and includes zones that represent the 19 counties in Norway and one zone representing foreign countries. Thus interchange of data between the two models must be aggregated and disaggregated accordingly.

4 Book title (do not insert)
4
PINGO is based on the traditional SCGE models. Representative household in each county is represented by utility functions. Households use labor endowments and possibly other sources of income (e.g., social security, profit of investments, redistributed revenues and public funds) to demand and consume commodities. PINGO includes commodity agents and service agents representing regional market equilibrium for regional commodities and services, respectively. In each county of the model there is one agent per commodity and service that handle the commodity. Each commodity agent uses freight services to transport the commodities from producers in all counties and foreign countries to the region where he operates and merges them into a regional pool.
Nine different production sectors, producing 10 commodity groups1, are represented in each county in addition to sectors that use commodities from different counties as input for production of services and physical capital to produce that are fully consumed inside the county where they are produced. Export and import sectors at the national level of the model collect and distribute imports and exports to and from the counties. CES functions are used to describe production, consumption, investments and interregional trade.
PINGO is calibrated on the basis of data of national accounts by county and transport costs and OD matrices with total transport of every commodity group in the base year from NEMO. Additional input data are needed to construct do-min situations for future years, which can be obtained from national models like MODAG or MSG2.
Endowments of the consumers are the only exogenous variables in the model, but almost all other variables can optionally be set exogenously (e.g. prices on any good or labour), according to the aims of analysis.
PINGO derives equilibrium price levels as well as volumes of production and consumer surplus of each commodity group by county, import/export, volumes and geographic patterns of transportation flows within and between pairs of the 19 Norwegian counties and across the Norwegian border, with respect to exogenous variables. The projected OD matrices are used as input to NEMO.
PINGO is implemented in the GAMS/MPSGE programming package (Rutherford, 1995).
2.3 Interactions between the two models
1 The commodity groups represented in PINGO are similar to the NEMO commodity groups except that PINGO include NEMO commodity group 11 in commodity groups 2. 2 The Ministry of Finance operates the Multi Sectored Growth (MSG) model.
The national freight model for Norway 5
5
Together NEMO and PINGO comprise a real network freight model with elastic demand. There are no capacity constraints in NEMO, thus there is no need for iterative interaction between PINGO and NEMO to achieve equilibrium between transport costs calculated by NEMO and demand for transport calculated by PINGO.
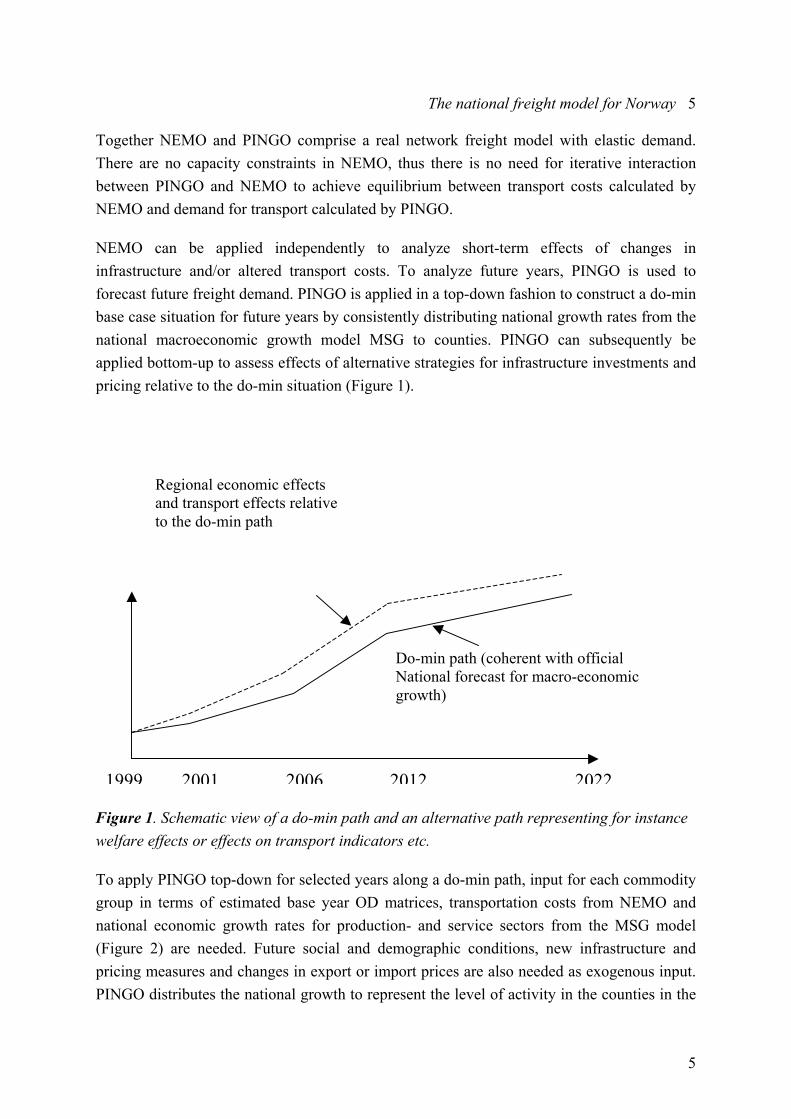
NEMO can be applied independently to analyze short-term effects of changes in infrastructure and/or altered transport costs. To analyze future years, PINGO is used to forecast future freight demand. PINGO is applied in a top-down fashion to construct a do-min base case situation for future years by consistently distributing national growth rates from the national macroeconomic growth model MSG to counties. PINGO can subsequently be applied bottom-up to assess effects of alternative strategies for infrastructure investments and pricing relative to the do-min situation (Figure 1).
Figure 1. Schematic view of a do-min path and an alternative path representing for instance welfare effects or effects on transport indicators etc.
To apply PINGO top-down for selected years along a do-min path, input for each commodity group in terms of estimated base year OD matrices, transportation costs from NEMO and national economic growth rates for production- and service sectors from the MSG model (Figure 2) are needed. Future social and demographic conditions, new infrastructure and pricing measures and changes in export or import prices are also needed as exogenous input. PINGO distributes the national growth to represent the level of activity in the counties in the
Regional economic effects and transport effects relative to the do-min path
Do-min path (coherent with official National forecast for macro-economic growth)
1999 2001 2006 2012 2022

6 Book title (do not insert)
6
selected future years by endogenously adjusting labour endowments to obtain an overall fit to the national growth. Growth rates for freight transport within and between counties and between counties in Norway and other countries from PINGO can be used to update the OD matrices in NEMO, whilst NEMO can be used to calculate corresponding tonne kilometres, environmental costs etc at different levels of aggregation.
PINGO
NEMO
Base year Future year
OD-matricesfor base year
Transport costs
Growth rates fortransport withinand between allpairs of counties
Long-termOD-matrices
NEMO
- Mode specific OD-matrices- Mode specific transport work- Transport costs- Etc
Figure 2 Schematic view of the interplay between NEMO and PINGO.
PINGO can also be applied bottom-up to analyse the effects of alternative strategies for infrastructure investments, pricing and technological changes relative to an already calculated do-min situation. We may for instance use NEMO to calculate alternative transport costs per tonne km and then analyze the effects with PINGO. With bottom-up application of PINGO/NEMO, labour endowments are always exogenous, which are exactly the labour endowments endogenously obtained for the corresponding year of the do-min path. Other variables and prices can optionally be fixed. Application of PINGO for assessment of effects of alternative strategies gives a new equilibrium with a changed freight transport pattern within and between counties for each commodity group, while accounting for changed population in the counties and economic development.
Results from PINGO include growth rates for transport within and between all pair of counties relative to the do-min situation. The growth rates can be multiplied by corresponding elements in the do-min OD matrices to obtain OD matrices for alternative strategies. NEMO

The national freight model for Norway 7
7
can subsequently be applied to calculate transport indicators like tonne km, transport share performed by different modes in rural and central areas. Tonne km and estimates for external costs per vehicle km in central and rural areas can be used to compute external costs at different levels of aggregation.
3 THE NETWORK MODEL (NEMO)
Network models combine different corridors for different modes in a unified network. The model simulates freight flows on modes and routes that minimize total costs in the system, given the OD matrices for total freight transport demand between zones in the network.
NEMO is implemented in the STAN software package, which is an interactive-graphic model frame for strategic analysis and planning of freight transport. NEMO is developed mainly for strategic analysis and planning in Norway.
The network model consists of the following four main parts, each would be more detailed
described in the following:
• OD matrices, representing the freight flows between Norwegian municipalities and
between Norwegian municipalities and countries outside Norway in thousand tons per
year
• Network, representing the infrastructure for the different modes and connecting points
such as terminals and ports
• Cost functions, representing the operating costs related to the forwarding and quality
costs (commodity owners non-paid costs related to the forwarding that are of
relevanse for mode choice)
• Optimalisation procedures (cost minimising)
• The reference year in NEMO is 1999, but it is possible together with PINGO to
forecast freight flows in any future year.

8 Book title (do not insert)
8
Figure 3. Schematic view of the main components in NEMO
3.1 OD matrices
The OD matrices are representing freight flows between municipalities in Norway and between municipalities in Norway and zones abroad, representing the trade pattern to and from Norway. There are 11 commodity groups included in the model. These are as follow:
1. Food
2. Fresh fish
3. Thermo products
4. Vehicles /machinery
5. General cargo
6. Timber and wood ware
7. Minerals and stone products
8. Chemical products
9. Metals and ore
10. Petroleum products
11. Frozen fish
NEMO
Cost functions for: - truck, rail and boat
- 11 commodity groups
OD-matrices for: 11 commodity groups
Transport network for: road, rail and seaborne transport
Algorithms for: optimisation of multi modal transport routes (cost minimazing)

The national freight model for Norway 9
9
Fresh fish, thermo products (food that require cooling or freezing while transported), chemicals and liquid bulk are all commodities with special requirements for transport quality. Chemicals and petroleum products are both commodities that are classified as dangerous goods.
Each matrix quantifies the flows in tons of a particular commodity between municipalities in Norway and between municipalities in Norway and foreign countries. The model has 42 zones abroad. The majority of these zones correspond to countries in Europe and 6 zones only (labelled Africa, Middle East, Far East, North America, South America and Oceania) represent overseas destinations. All in all, the network contains approximate 480 zones.
OD matrices in NEMO are based on gravity models, using data for total freight flows to (∑
iiA ) and from (∑
iiB ) each municipality, where Ai and Bi are total deliveries of one
commodity to and from municipality i. This includes both deliveries from producer to wholesalers and from wholesalers to retailers and deliveries from producers and wholesaler directly to consumption in households and business sectors.
The gravity model requires equality between (for every commodity group) the sum of transport into a business link and the sum of transport out of the business links in the municipalities (tonnes per year). With the orginal data, the only information about the trade sector (retailers and wholesalers) is netto sales from retailers and wholesalers (i.e., sales from wholesalers to retailers and retailers purchase from wholesalers are not included). To represent all transport flows it is necessary also to represent the missing flows (i.e. internal sales and purchase within the trade sector). We represented “sales from wholesalers to retailers” by “buying to wholesaler minus direct sales from wholesalers to industry or households”. Retailers purchase from wholesalers to retailers can be approximated by “sales from retailers”. Now a complete representation of the transport flows should be in balance in order for the data to be applicable in a gravity model:
∑∑
∑∑
++
+++=
=
++++++
=
i
i
ii
iii
ii
iii
ii
B
A
i
ii
ii
abroad)zonesfrom(deliveryfisheries)andforestrye,agriculturfrom(delivery retailers) tors wholesalefrom (sales)wholesalerfromsale(directindustry)from(sale)productionindustrial(
)residual(purchase)direct (retailers)abroadzonestodelivery()swholesalerfrompurchaseretailers()purchaseswholesaler()purchaseindustrial()inputindustrial(
Adjusting the residual component, which represents consumption in the production and service sectors and private consumption not sold by retailers ensures the balance. The

10 Book title (do not insert)
10
residual component may include sale from wholesalers directly and all other components on the buying side. What remains are a method for distributes the residual to the municipality level.
We have applied a rough assumption, where the residuals are distributed according to the share that this component accounts for as part of the trade by wholesalers and retailers in each municipality. This method for distribution should be improved, but requires more empirical information about this component per municipality. We don’t have this information, but one approach could be to use information about employment by industry in different municipalities, related to our commodity groups. This is currently postponed for future research, however. Temporarily the distribution formula is represented by:
[ ]
i
iii
R)nconsumptiofor rs wholesalefrom purchase(direct
)lersby wholesa purchase ()retailerstoswholesalerfromsale(∑ +=
The marginals Ai and Bi and transport costs cij between all municipalities are used as input in a gravity model to generate OD matrices for each commodity group. The gravity model that was used to generate the OD matrices with element tij for all pairs of municipalities, ij solves the system of equations
jict ijjiij ,))(exp( ∀⋅⋅⋅= pγβα
∑=
∀=n
ijij jAt
1
∑=
∀=n
jiij iBt
1
which consist of n+n+n*n equations with the same number of unknowns, i.e., balancing parameters nii ,...,1, =α , and nii ,...,1, =β and elements in the OD matrix nijtij ,...,1, = ,
where n = 435 (the number of municipalities).
Transport costs between every pair of municipalities, cij are calculated by running STAN with an arbitrary OD matrix as input. The reason why this works is because there are no capacity limits and hence no delays in the real network representation and because STAN assign all transport of a commodity groups between two zones to the cheapest route. Consequently, the transport costs per ton for a commodity group is independent of which OD matrix that is used as input.
OD matrices for foreign transport (tons) between counties in Norway and other countries is obtained directly from the Foreign trade statistic for 1999 (Statistics Norway). The elements

The national freight model for Norway 11
11
in the OD matrices represents transport from the county where the producers are located in Norway to destinations in other countries and from origins in other countries to the first place of custom declaration in Norway. Subdivision from counties to municipalities had to be done. We established indicators from the production data (export) and input and wholesale statistics (import) to do the spreading from county to municipality level. The OD matrices are defined such that we avoid any double counting when the OD matrices for domestic and international trade are merged.
Domestic transport contains transport between all pairs of municipalities in Norway. This includes transport of imported commodities from the place where toll is paid and further into the Norwegian transport network. OD matrices for international transport contain export from the municipalities where the commodities are produced and import from other countries to the municipality in Norway where toll is paid. A schematic view of the OD matrices is given in figure 4.
Municipality of destination Destination
abroad Out marginal
Municipality of origin
101 102 …. 2030 (zonal numbers)
Country zones SUM Out
101 102 . . . 2030
Domestic (freight flows between Norwegian municipalities)
Export
Freight flows from
Norwegian municipalities
Country zones Import Transit Import SUM IN (IN marginal)
Freight flows into Norwegian municipalities Export Freight in sum
Figure 4. A schematic table illustrating the composition of the OD matrices in the NEMO model
Data needed to determine Ai and Bi for use in the gravity model to generate domestic OD matrices were based on basic data from Agricultural, Mining, Timber and Fishery statistics, Manufacturing statistics and Trade industry statistics (subdivided on wholesale and retailers) (all statistics are delivered from Statistics Norway), for 1999. The statistics contain data for production and trade of commodities. Most of the data are given in terms of production values for the 11 NEMO commodities. The values are transformed to tons in a way that gives an unambiguous picture of the freight flows for each commodity group out of and in to each of the 435 municipalities in Norway. The Manufacturing statistics, includes data used to determine a conversion factor from value to tons, and contains:
• Production value for industrial products
12 Book title (do not insert)
12
• Sales value of industrial products
• The cost of inputs that are used in industrial production
• Sales value of traded commodities that the industries sell
• Purchase value of traded products that the industries sell
• Volumes (tons) of each commodity group that are produced by company with single establishments (used in combination with values of production to determine prices).
where the units are NOK (VAT not included) for 1999 and classified according to NSTR/2.
The Statistics on the trade industry contain data for the sales value from establishments in the trade industry in different sectors in 1999. The establishments in the trade industry are mainly subdivided in wholesale, agency and retailers, where we have merged agency trade with retailers.
The prices we have determined with the conversion factors are used as a starting point also for wholesale and retailers.
3.2 Cost functions
NEMO calculates the system optimal multi modal transport routes between pairs of municipalities or municipalities and zones in other countries on the basis of the generalised cost functions. These are composed of two main components:
Operative costs (the transport operators time- and distance dependent costs related to the mode and costs of load, unload and reload).
Qualitative costs (commodity owners non-operative qualitative costs realted to expected delays, transport time, waiting time, degradation for fresh food and costs that represents how suitable the transport modes are for the different commodity groups).
The software package STAN requires separates cost functions for each combination of mode and commodity group on each link and transfer in the network. When assigning the freight flow matrices, these functions permit calculation of costs of each commodity on alternative transport modes and paths, and this information is used to determine the modal split following a principle of cost minimisation (system optimum). Hence, the cost functions include different variables and parameters that influence the transport solutions. In an

The national freight model for Norway 13
13
adequately specified model, the form of these functions permits the reproduction of the situation observed today (distribution of freight volumes on modes and routes, level of total costs, etc) and allows for predictions of the distribution under changing transport supply (prices, quality, infrastructure). Publicly available transport statistics and information from various transport companies have been used to estimate the different parameters. The STAN package have one strictly restriction, namely every component in the cost functions (costs per tons and km or time) have to be linear expressed.
There are tree main modes in the model, but seaborne transport is represented by five sub modes. Air freight and pipelines will be implemented in the model during the autumn. The modes represented in NEMO are then:
• Road
• Rail
• Seaborne transport (coastal transport, ferry (both inland and out of Norway), bulk and line shipping
• Air freight (would be implemented during the autumn)
• Pipelines (would be implemented during the autumn)
Intermodality is possible in the model in order of modal chains. In the optimalization procedure cost minimizing is reached, and on each relation only one transport solution is chosen (for each commodity); the one which minimize general costs (‘all or nothing’ solution. When assigning the freight flow matrices, the cost functions should reproduce the observed distribution of freight volumes on modes and routes where the total costs represented by the cost functions are explicitly represented as the sum of reload costs, quality costs and operative costs.
The structure of the cost functions in NEMO is similar to the structure that is used in the Swedish model (Lundin, 1998 and 1999), but some changes are done in order to adapt the functions to Norwegian conditions. All cost functions in NEMO represent average cost per tonne. There are no capacity constraints, and the costs are independent on the transported volumes. The operative link cost is on the form
( ) θβα ++= traveltimelengthC linkoper ** (1)
where α represents distance-related costs, β represents time-related costs andθ represents other costs (toll roads etc). Length is length of the actual link, whereas travel time typically is

14 Book title (do not insert)
14
represented by link length divided by speed. A mode- and commodity specific calibration factor was added to the costs on the first and last links of the transport chains to, representing elements that affects mode choice, but is not represented within other elements in the cost functions (e.g. appropriateness).
Reload costs Operative costs for reload are based on a terminal cost survey accomplished by Lervåg et al (2001).
Calculations of the operator’s time dependent costs for vehicles in the terminal are based on assumption that loading and unloading are equal in time.
Quality cost (non-operative costs) Quality costs describe characteristics of a transport service that may affect mode choice, which includes information about risk of delay (on links, at the border and in terminals), obtained from the Swedish model, and estimates on transport frequencies (per week) for available transport modes.
Quality costs also includes capital costs for commodities related to transport time, where commodity value per tonne where obtained from the Foreign Trade Statistics 1999. We have also added depreciation costs for ‘fresh fish’, ‘thermo products’ and ‘vehicles and machinery’ that represent the value loss with respect to time for these commodities.
Operative costs, truck Distance dependent cost for truck is based on estimates on energy use by lorry type (Rypdal et al, 1997). Time depended costs are based on the Estimated lorry cost index and Survey of lorry transport in Norway from 1998-2000 (Statistics Norway).
Operative costs, boat Distance dependent cost for coastal transport is also based on estimates on energy use by ship type (Rypdal et. al, 1997). In order to calculate commodity specific distance- and time dependent costs for domestic transport by boat, we used maritime statistics for 1993 (Statistics Norway) to determine the shares (in tonne km) of each commodity group, transported with different types of ships. We assumed that the shares have not changed from 1993 until 1999 (in lack of data).
Time dependent cost for coastal transport is based on yearly accounts for domestic hired transport in Norway (published yearly in Maritime statistics until 1996, Statistics Norway. After 1996 we only have information about the cost components from National accounts).

The national freight model for Norway 15
15
Data for international transport by boat were scarce. Construction of cost functions for international ferries was based on transport prices for 1999 from official time and route tables. For liner trade (regular transport by boat between harbours in Norway and other countries) there was neither access to transport costs or prices or average load per trip. To deal with this, we have used costparameters from the first international part of NEMO (Madslien et al. 2000), but costs are adapted to the new commodity groups.
Operative costs, rail Distance dependent costs for rail are calculated on the basis of total energy- and diesel consumption for freight rail in 1999 from the energy accounts of Norwegian Railway Company (NSB). There is no available data, however, for capacity utility related to different commodities3. To circumvent this problem, we used data from Survey of lorry transport in Norway from 1998-2000 (Statistics Norway) for capacity utility by commodities for transports longer than 300, and adjusted the cost components accordingly. An infrastructure charge comes in addition.
Time dependent cost for rail is calculated on basis of transport prices by subtracting the distance dependent cost from the transport prices minus the largest discount. This is not a very satisfactory method, since the profit in this case becomes part of the time dependent cost component. However, according to company accounts for NSB Freight it is not unreasonable to assume zero profit.
3.3 Network
The network in NEMO is representing the physical infrastructure for different modes and connecting points such as terminals and ports. The network is based upon a zonal system consisting of Norway’s 435 municipalities and the administrative centres of the municipalities were assigned as centroïdes (centre of gravity were production and trade are located). There was two important reasons for choosing municipalities as zonal level: First, it makes it possible to apply the model to studies of a relatively local character and second, the model may be combined with the national passenger transport model (NTM) developed by TOI. The NTM model has later been further developed and the zones in this model are now approximately four times the zone levels in the freight model. Intra zonal traffic work is not included in the model, implying that the of transport work not accounted for decreases with smaller zonal size. Those two reasons seems like it is time to increase the zonal size in the
3 The capacity is measured as commodity weight per trip as the share of the vehicles carrying capacity

16 Book title (do not insert)
16
NEMO model too, hence adding an item to the list of tasks for further development of the model system.
The road and rail networks were based on the EMME/2-network applied in an earlier version of the national passenger transport model. In cooperation with the Norwegian State Railways we decided upon approximate 40 railway stations where transfers between modes are possible. The sea network was developed by SINTEF/MARINTEK and includes altogether 169 ports.
When it comes to connecting the networks for the three modes and connecting the networks to the centroïds, generally we have assumed that all freight transported on rail and sea is part of a chain involving truck transport in the beginning and the end of the chain. Since this is an oversimplification the picture are corrected by collecting information on how the freight really is handled in each port and on each railway station. More specifically, we have identified the municipalities where most of the freight is transported directly to and from the company either on a branch railway-line or over a private industry port. This information was incorporated in the model.
Network outside Norway is based on the STEMM network, covering main roads, rail and sea-borne corridors in Europe. This network is rather simply and could be further developed. Linear trade and air freight to and from Norway is implemented in the model as directly lines between two ports. A network for pipelines is implemented in the model during this summer.
3.4 Calibration data
NEMO is calibrated for a base year situation on the basis of basic data traffic counts are applied for evaluation. Modal split is so far only calibrated at national level, but for specific places in the network were we have validation data, validation is done (ports, road crossing border and some railway relations).
The data used for calibration includes OD matrices based on sum of different mode specific statistics: The Survey of vessels in coastal trade in Norway, the Survey of lorry transport in Norway (both from Statistics Norway), and information about freight flows between railway stations from the only railway operator in Norway (NSB Freight).
The Survey of lorry transport contains trips for a sample of trucks. These samples are scaled to represent total truck transport between municipalities in Norway. The counts have been continuity done since 1993, and we have used information from the period 1993–2000, but scaled to match the total level in 1999 (the model base year).

The national freight model for Norway 17
17
The Survey of vessels in coastal trade in Norway do only contain data for spot trade on the coast, and is used together with the counts for loads in the regular service that were collected by MARINTEK (1995). These two surveys are from the year 1993 and 1995, but we have scaled the volume to represent 1999.
NSB Freight provided data, based on accounts for 2001 for transported units (i.e., not subdivided by commodity group). NSB Freight has the experience that there has only been a marginal change in structure and volume from 1999 to 2001. We used data from the transport operator Linjegods to obtain some knowledge of the commodity shares. The data are not grouped according to the NEMO commodity groups, but were transformed to match NEMO commodity groups. Linjegods send approximately 20% of all the containers and is probably the most representative customer.
Foreign trade statistic from 1999 (from the Statistics of Norway) was used at aggregate level to get information about the modal split at the boarder for Norwegian foreign trade.
Transport prices for truck were obtained from the Survey of lorry transport in Norway (Statistics Norway), includes information about paid price per trip, where prices include operative costs, time dependent costs, and terminal costs.
3.6 Evaluation
The NEMO model was evaluated in a project in 2002 (Andersen et. al, 2002). Modelling results was compared with port statistics, statistics on tonnage for lorries when crossing boarders and rail volumes (in tonnes on spesific links) , elasticities for mode split related to cost changes in the model were computed and result from projects where the model already has been used was evaluated.
The main results from the evaluation was:
• OD matrices based on marginals shows differences from those based on transport specific statistics. It is not easy to say which of them are right (if any). Transport specific surveys are not either too realistic because surveys give problems when volumes are calculated from a selection to represent national level. We have tried to corrigate OD-matrices where the differences seems to be squewness in the OD matrices.

18 Book title (do not insert)
18
• Comparison of the average prices with the sum of time and km dependent operative costs from the cost functions (minus reload and tolls) demonstrated that cost level in the cost functions and the transport prices co-varied quite well.
• The model is not (yet) reasonable at local level
• The model is quite elastic for rail transports (seems to be a general problem for network models for modes with a marginal marginal market share due to tonnes
The purpose of these analyses has been to give recommendations on which level of detail the model can be used. These analyses indicate that the model is well suited for national analyses, and it gives quite certain results for regional analyses as well. Analyses at the level of municipalities are, however, not recommended with the existing model version.
4 SOME SELECTED APPLICATIONS
A network model for freight transport can be applied to a variety of different issues concerning transport and infrastructure. Typical problems analysed by network models are questions concerning modal split and link volumes under varying assumptions of infrastructure quality and investment in infrastructure, freight rates and taxation policies. Other problems that can be analysed by NEMO are related to implications for mode and route choice of changes in the OD pattern. The results are presented as freight volumes and costs on links and transfers.
In relation with PINGO, NEMO can be used to analyze long term effects in transport pattern and mode choice, with respect to (examples): (1) Demographic changes, (2) alternative national economic growth, (3) Changes in trade portfolio with other countries (4) Changes in the transport network on one or more links (5) altered taxes on produced goods, services and/or transport, (6) altered work force endowments in the counties, (7) Changes in technology and/or location of special types of production and (8) Subsidies and transfers to consumers.
Hereby we give some examples of recent model applications.
4.1 National forecasts
The model system (NEMO and PINGO) was used to work out national forecasts for freight transport by mode in Norway for the period 2002 to 2022 (Hovi et al, 2002). This is an

The national freight model for Norway 19
19
example of top-down application of PINGO/NEMO, where PINGO/NEMO was used to forecast base scenarios towards 2022 for freight transport demand in Norway.
Mode specific forecasts are used in National Transport Planning (NTP) at county level. There was a problem (special for the Norwegian Road Administration) that growth rates were given in measures of tons and transport work (tonne km), and not traffic work (vehicle km). Growth rates for transport and traffic work can vary a lot, related to the framework of service related transports (these are small in tonne km but greater in vehicle km).
4.2 Implementing marginal cost prising
TOI has recently contributed to the the EU consortium MC-ICAM (Implementation of Marginal Transport Cost Pricing in– Integrated Conceptual and Applied Model Analysis) by applying PINGO/NEMO bottom-up (Henstra et al., 2003) on the basis of the top-down run by Hovi et al. (2002), to assess the effects of a gradual introduction of marginal social cost pricing (MSCP) of freight transport.
The total effects of MSCP upon performance of the country include not only its effects upon households’ utility but also upon the environment. The results show that MSCP reduces the external costs of transport.
Despite the negative influence upon households’ utilities, the total welfare effects of MSCP implementation are quite significant conditioned that MSCP pricing is implemented for all modes.
In conclusion we were able to present a quite complete picture of the MSCP effects both on production, consumption, transportation and environment. The applied approach also included the effects of redistribution endogenously determined by the model. With PINGO we manage to quantify the effects, which are not trivial, neither intuitively nor by theory. Though subsequent discussion have verified their plausibility.
4.3 Analysis related to the NTP
In a framework related to the National Transport Planning, the Transport Departements have used the NEMO model themselves to try out specific policy runs for a selection of infrastructure investments. The main conclusion from the runs was that the model give reasonable results for road and sea transport, but the short-term effects on railway was maybe too high.

20 Book title (do not insert)
20
5 FURTHER WORK
Earlier in this paper we have indicated some areas were the model needs furter developments. The aim is that there should be a continous activity on both use and development of the model, to maintain and increase competence. We have some projects under duration for increasing the user’s benefits. In the next two chapters we have made a short summary of further development of the NEMO model, under duration (5.1) and proposed developments but depending on further financing (5.2).
5.1 Under duration
• Implementation of the inland and abroad sub models into one model system
• Implementation of an air freight module for abroad transport
• Implementation of transit and offshore transport (introduction of a new mode, pipelines) in the model system
• Implementation of a module in NEMO for convertation from transport work to traffic work for seaborne transport
5.2 Not started (depends on financing)
• A more disaggregated level is needed because in a network model transport work are only computed for transportation between zones. Intra zonal transport is not included in a network model. Since many bottlenecks and congestion problems are related specially to urban areas this is a problem. We would also search for implementing a more disaggregated zonal level for zones outside Norway
• Traffic work (vehicle kilometres) is a demanded output in addition to transport work (tonne kilometres), especially from the Norwegian Road Administration
• Service related transports, have to be better developed in the model (but is only relevant if a more disaggregated zonal level is introduced
• Implementation of transportation choice based on logit models, and not on the ‘all or nothing’ solution in STAN

The national freight model for Norway 21
21
• A common model system for freight and passenger transport where congestion could be implemented and analysed
• Get a better representation of the transport chains by use information about volumes by wholesalers and retailers, and use a two step method in the gravity models
• Development of PINGO, where deriving more significant estimates of elasticities, including a more detailed representation of public sector, and developments in coherence with developments in NEMO are considered among the most important.
REFERENCES
Andersen J and Hovi IB (2002): Evaluation and verification of NEMO (in Norwegian with summary in English). Institute of Transport Economics, Oslo. TØI report 625/2003. ISBN 82-480-0319-1.
Heimdal, Sverre Inge og Remman, Tom (1995): Innenriks godstransport med rutegående skip 1994. Trondheim, MARINTEK, 1997 (Rapport SF 630310.00.01).
Hovi I B, Jean-Hansen V, Andersen J and Ivanova O (2002): Basic forecasts for freight transport in Norway 2002 – 2022 (in Norwegian with summary in English). Institute of Transport Economics, Oslo. TØI report 583/2002. ISBN 82-480-0271-3.
Ingebrigtsen, S, Madslien, A and Sætermo, I A (1997): The national network model for freight transportation (NEMO) - Version 1 (in Norwegian with summary in English). Institute of Transport Economics, Oslo. TØI report 348/1997. ISBN 82-7133-999-0.
INRO (2000): STAN User’s Manual Software Release 6, INRO Consultants INC. (Montreal)
Ivanova O, Vold A and Jean-Hansen V (2003): A SCGE Approach to Forecasting Interurban Transport Flows in Norway. Paper presented at the Conference on National and International Freight Transport Models.
Ivanova I, Vold A and Jean-Hansen V (2002): PINGO A model for prediction of regional and interregional freight transport, Version 1. Institute of Transport Economics, Oslo. TØI report 578/2002. ISBN 82-480-0266-7.
Jensen T and Eriksen K S (1997): GODMOD-3 A General Equilibrium Model for Transport Analyses. Institute of Transport Economics, Oslo. TØI report 345/1997. ISBN 82-7133-996-6.

22 Book title (do not insert)
22
Lundin M (1998): SIKAs och Trafikverkens godsmodell. Kostnadsfunktioner i STAN, strukturell uppbyggnad. Stockholm, Temaplan AB.
Lundin M (1999): STAN 99. Kostnadsfunktioner, Operativa kostnader, Kvalitet, Frekvens.. Stockholm, Temaplan AB.
Madslien, A, Lillehammer, G C and Skyberg, TE (2000): Model for transports in Norwegian foreign trade (in Norwegian with summary in English). Institute of Transport Economics, Oslo. TØI report 480/2000. ISBN 82-480-0153-9.
Rutherford, T. F. (1995): Applied General Equilibrium modelling with MPSGE as a GAMS subsystem: an overview of modelling framework and syntax. [email protected]
Rypdal K et al (1997): Energy use and emission to air from transport in Norway. from Statistics Norway report 97/7. Oslo Norway. (In Norwegian language)
Vold A, Andersen J, Hovi IB, Ivanova O, Jean-Hansen V, Lervåg LE, Meland S and Wahl R (2002): NEMO Network Model for freight transport within Norway and between Norway and other countries- Version 2 (in Norwegian with summary in English). Institute of Transport Economics, Oslo. TØI report 581/2002. ISBN 82-480-0269-1.
Wahl R., Meland S., Lundin M., (1998): Nordic/North Sea Case Study. Trondheim, SINTEF Samferdsel, 1998. Annex L i rapportserie fra EU-prosjektet STEMM (Strategic European Multi-Modal Modelling).