Embed Size (px)
Citation preview
An Overview of Canadian
Food Loss and Waste Estimates
Presented at the Webinars and Speaker Series, Rural Development
Institute, Brandon University
Ottawa, ON
June 4th, 2015

Outline
• An introduction
– Why bother?
– the reasons for food loss and waste creation in the food chain
• AAFC’s technical work
– reducing food losses in the early stages of the food system
– quantifying Canadian food losses in food waste data and comparing it with the U.S. data
• The impacts of food loss and waste
– economic
– environmental
• What do we do (policy)

Where are the food loss and waste created?
Farm level: over-production, weather damage, pests/diseases, market conditions, deterioration, post-harvest handling and storage
Processing: input quality, machines, works, cold chain, market
Packaging, marketing and distribution
Retail: over-ordering, cold chain, price promotion, produce display design, differentiation
Households: preferences, labelling, buying too much, demographics

Causes of food waste
• Behavior of supply chain actors
– producing/purchasing more to account for shrinkage and other risks of loss
• Market failures and imperfect information
– breakdown of supply chain coordination
• Cultural or behavioral practices
• Policy
– farmers
– processors
• Developed vs. developing countries
– where food waste created
– expenditure on food
5
Food losses in the early stages of the
food system
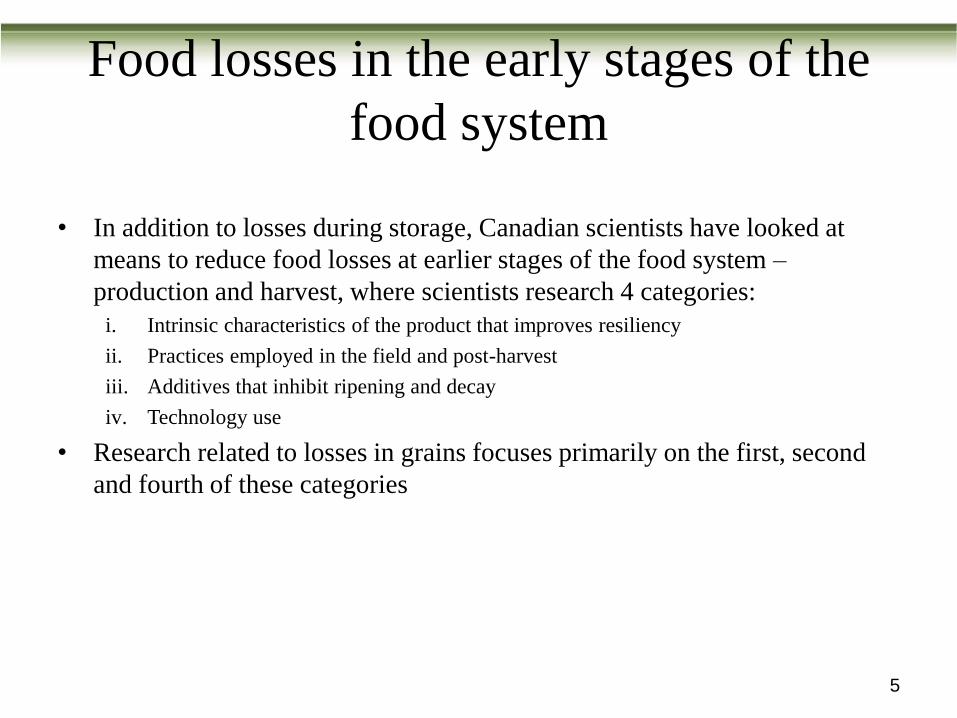
• In addition to losses during storage, Canadian scientists have looked at
means to reduce food losses at earlier stages of the food system –
production and harvest, where scientists research 4 categories:
i. Intrinsic characteristics of the product that improves resiliency
ii. Practices employed in the field and post-harvest
iii. Additives that inhibit ripening and decay
iv. Technology use
• Research related to losses in grains focuses primarily on the first, second
and fourth of these categories

Use of Cost-Effective Technology to reduce Food losses
in the early stages of the food system
• Some technologies can dramatically reduce food losses and
waste and can be quite cost-effective
– Use of instruments to detect insects, moulds and mycotoxins (traps, odour detection)
– Weather-tight bins to keep grain dry
– Aeration after harvest to dry and cool grains
– Use of “sensor arrays” to identify specific sources of spoilage (Temperature and moisture
sensors will soon be developed as well as nanosensors for odours)
6

AAFC and food losses in the early stages of
the food system
• At Agriculture and Agri-Food Canada (AAFC), funding programs are
available to support collaborations between AAFC scientists, other public
agencies and the private sector
• For example, industry-based organizations, like the Canola Council and
Western Grains Research Foundation can partner with universities and
AAFC to research topics that will lend to reduction of losses and waste
• This approach can be effective in meeting industry goals by capitalizing on
the strengths within each sector
7

Defining FLW is difficult due to the different activities that lead to it and the various ways that it can be measured and reported
• Generally speaking food losses happen at earlier stages of the FSC, as most of the reduction in supply is due to loss or spoilage that reduces marketable volume or is unfit for consumption.
• At later stages in the FSC, mainly retail and consumer stages, behavioral issues are more often the cause of food waste.
• In order to take action on food waste it is first necessary to identify how much and where wastage occurs. However, the numerous definitions for and causes of food wastage can be barriers to collecting meaningful statistics
Food waste is associated with a wide array of definitions
Post-harvest loss occurs between harvest/storage and marketing; this includes
any resulting drop in quantity or quality rendering a portion of that food unfit for
human consumption (Grolleaud, 2002). Food loss – “food once usable, then discarded” (Gallo, 1980); “a subset of
post-harvest losses that represents the part of the edible share of food that is
available for consumption at either the retail of consumer levels but is not
consumed” (Hodges et al, 2011); or “a subset of post-harvest loss, it is the
amount of edible food available for consumption but not consumed” (Buzby et
al, 2012); “a decrease in edible food mass throughout the part of the supply
chain that specifically leads to edible food for human consumption”
(FAO,2011). Food waste –“wholesome edible material intended for human consumption,
arising at any point in the FSC, that is instead discarded, lost, degraded or
consumed by pests” and/or that which is “intentionally fed to animals or is a
byproduct of food processing diverted away from human food”, (Parfitt, et al
2010). “A subset of food loss, is when edible food is not consumed due to
human action or inaction and can arise from decisions made by business,
government or consumers in the farm to fork chain” (Buzby et al 2012); “exists
if food intended for human consumption is not used for human consumption”
(Waarts, 2011). Food wastage – includes both food loss and food waste (FAO, 2014). Some
organizations include food directed to non-food uses - animal feed and
bioenergy. Some definitions consider over overconsumption of calories as food
waste (OECD, 2014; Parfitt et al, 2010).

Quantifying FLW in Canada can be done at the retail and consumer levels using data from Statistics Canada
• The basic data needed to estimate consumer food waste, food balance sheets, have been published by Statistics Canada for decades – The program has evolved from basic per capita food availability estimates
published in the 1950`s to complete supply-disposition tables dating back to 1960
• Up until the mid 1990`s the Agency was publishing per capita food consumption for over 100 commodities. However, user interest lead to several important improvements to the data – In the early 2000`s this was expanded to include published data on nutrient
content as well as loss adjusted per capita food availability
• In 2009, the program was restructured, but publishing the core data including loss adjusted food availability continued due to demand from stakeholders
9

• The first step is to derive the
amount (per capita) of food
available estimates, using supply-
disposition methodology
• Canadian data are compiled based
on the FAO’s food balance sheets
• Supply components are summed
for each commodity, then all
known uses other than
consumption are subtracted
• This leaves food disappearance as
a residual – or what is also called
food consumption or food
available for consumption
Estimate the Food Supply
Estimate Food Uses
Per Capita Food Available for consumption
(Also called food disappearance or per
capita food consumption)
10
This is a two step process that begins with deriving food available for consumption
Food balance sheets generally draw
upon three main sources of
administrative and survey data

A significant volume of administrative data is needed before food loss and waste can be estimated
• Per capita food available is first estimated using a set of detailed calculations for each food commodity:
• While this method includes a series on waste, in this context waste reflects losses in storage or transportation.
• In contrast, the U.S. food supply disposition calculations measure losses by applying the factors between the primary and retail levels
•Production
•Stocks
•Imports
Supply
•Exports
•Stocks •Manufacturing
•Waste
Use Population Disappearance =
Net supply of food available
Per Capita Food
Available
11

• The application of loss factors is the second step, which involves making adjustments to estimate “food consumed” more accurately
• These adjustments, obtained from data developed by the USDA, account for losses at the retail and consumer levels, including institutions, restaurants and households. The factors account for losses and waste from storage, in the preparation of food and from the plate.
12
Per capita food available for consumption
U.S.D.A. food loss adjustment factors
•Quantity of food loss or wasted
Per capita food available for
consumption, adjusted for losses
Adjustment factors are incorporated
to improve the derived food disappearance
estimates by accounting for losses and waste
Canada then incorporates data from the USDA to adjust food availability for losses and waste…

• The original intent of using waste factors was to better estimate “food consumed”
– In the early 2000’s STC and AAFC worked with the ERS-USDA to adopt estimates for waste adjusted food availability data
• In an effort to arrive at a more accurate estimate of food consumption, the food loss and waste estimates themselves are now an additional set of data that can be used to evaluate trends in the food supply
Per capita food
available
US factors on food
loss
Quantity of food loss or
wasted
Per capita food
available, adjusted for
losses
13
In addition to the traditional food supply balance sheets, these efforts have generated additional datasets on FLW for the consumer and retail levels

• Eggs are one example of how net supply of food available already reflects primary to
retail losses. The Canadian estimate of 1.5% represents data on leaker and reject
eggs, available from administrative sources and included in the S&D for eggs. The US
factor in this case would be 2.2%.
Estimating FLW in the upstream parts of the food value
chain using Canadian commodity balance sheets and
U.S. food loss adjustment factors
Per Capita disappearance
Eggs: 11.4 Kg/person
Primary – retail loss factor is from STC’s own data – 2.2%.
(USDA factor is 1.5%)
Retail food available
11.2 Kg/person
Retail loss
1.00 Kg/person
Consumer food available
10.2 Kg/person
Consumer loss*
2.33 Kg/person
Food
Available adjusted for losses
7.82
Kg/person
Retail and consumer food loss
3.33 Kg/person *Excludes the non-
edible share
14

Nearly One-Third of Canada's Total Food Disappearance was Lost
or Wasted at the Retail and Household Levels in 2010
Food loss generally refers to unintended spills or spoilage that reduce production before it reaches a buyer or consumer. Food waste is
generally associated with human behavior such as negligence or conscious decisions to discard food.
In Canada, 6 billion kilograms of food was lost or wasted at the household and retail levels, accounting for 31.0% of food disappearance.
Household food loss and waste accounted for 21.0% of the total food disappearance with retail accounting for the other 10.0%.
By commodity, food loss and waste as a proportion of the food disappearance in Canada was highest for added sugars and syrups at 41.0% and
fish at 40.0% respectively, with the household level accounting for the greatest share.
0.0 5.0 10.0 15.0 20.0 25.0 30.0 35.0 40.0 45.0
Red Meat
Poultry
Eggs
Fish
Dairy
Grains
Nuts & Legumes
Sugar & Syrups
Oils & Fats
Fruit
Vegetables
Juices
Percent of Commodity Food Disappearance Source: AAFC calculations using Statistics Canada and USDA data. These calculations are based on the share of retail and household waste relative to the total disappearance of each commodity.
Retail and Household Food Loss and Waste as a Proportion of the Commodity Food Disappearance, Canada, 2010
Retail
Household
31% Share of the Total Food Disappearance Lost or Wasted in 2010

In Canada, about 6 billion kilograms of food was
lost or wasted in homes and at retail level in 2010
Meat, Poultry, Eggs,
Fish, 12%
Dairy, 21%
Grains, 13%
Nuts & Legumes, 1%
Added Sugar & Syrups, 7%
Oils & Fats, 6%
Fruit, 17%
Vegetables, 23%
Juices, 1%
Canadian consumer and retail level food losses by commodity group, percent, 2010
Meat, Poultry, Eggs,
Fish, 740
Dairy, 1,271
Grains, 795
Nuts & Legumes, 44
Added Sugar & Syrups,
425
Oils & Fats, 346
Fruit, 1,032
Vegetables, 1,388
Juices, 85
Canadian consumer and retail level food losses by commodity group, million kgs,
2010
Source: AAFC calculations using Statistics Canada and USDA data. Statistics Canada source is food available for consumption by commodity and USDA source is Economic Research Service, Loss-Adjusted Food Availability (LAFA) data series .
16

The Distribution of Total Food Loss and Waste from the
Household and Retail Levels in Canada and the U.S. Varies by
Commodity
Of all food lost and wasted, 22% is attributable to fresh vegetables and this accounted for the highest share in Canada. In the U.S., fresh
vegetables accounted for the third highest share at 14.5% in 2010.
Dairy products accounted for the highest share of all food lost and wasted in the U.S. at 21% in 2010. In Canada, it accounted for second-
highest share of all food lost and wasted at 19.5% in 2010.
Fresh fruits, fresh vegetables and processed fruits are the only three products where the share of food loss and waste to total food loss and
waste is higher in Canada than in the U.S. This may be partly explained by the significantly larger presence of fruits and vegetables in the
Canadian food basket, compared to with the U.S. food basket.
0%
20%
40%
60%
80%
100%
Canada U.S.
Retail and Household Food Loss and Waste by Commodity as a Proportion of Total Food Loss and Waste, 2010
Fresh Vegetables
Dairy
Fresh Fruit
Grains
Sugar & Syrups
Red Meat
Oils & Fats
Processed Vegetables
Poultry
Juices
Source: AAFC calculations using Statistics Canada and USDA data
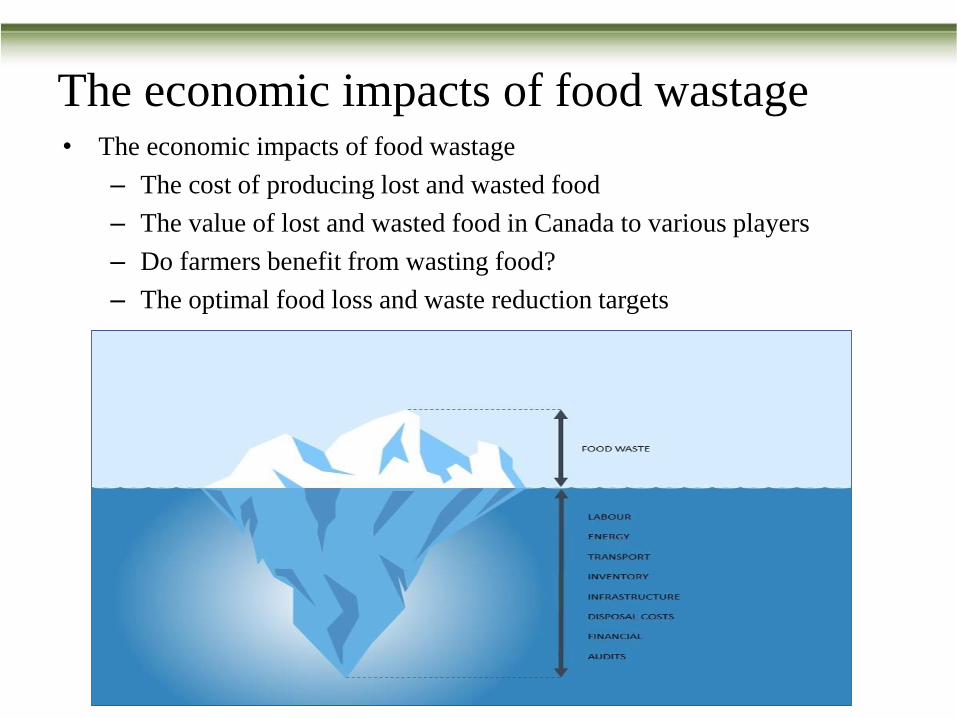
The economic impacts of food wastage • The economic impacts of food wastage
– The cost of producing lost and wasted food
– The value of lost and wasted food in Canada to various players
– Do farmers benefit from wasting food?
– The optimal food loss and waste reduction targets

The Value of Canada’s Annual Food Loss and Waste was
Estimated at $31 Billion in 2014.
The estimated total value of food loss and waste is $31 billion in 2014.
The value of food loss and waste happening at the household level is estimated at $14.5 billion and accounts for the highest share (47%) of the
estimated value of food loss and waste in 2014. The value of food loss and waste at the processing stage is estimated at $6.2 billion, and
accounts for 20% of the estimated value of food loss and waste in 2014. The most recent estimate of the value of food loss and waste at the
retail level was $3 billion in 2010.
Measuring the amounts of food loss and waste as a proportion of the sale value of their industries’ outputs, average food loss and waste is
estimated at 5% on the farm, 10% during processing and/or packaging, 2% during transportation and distribution, and 10% at restaurants. Food
loss and waste at these stages account for more than 50% ($16.5 billion) of the estimated total value of food loss and waste.
10%
20%
4%
9%
10%
47%
<1%
Distribution of the Value of Food Lost or Wasted Throughout Canada’s Food Value Chain
On farm
Processing
Transport and distribution
Restaurants and hotels
Retail
Consumers
International catering waste*
Source: ““$27 Billion” Revisited the Cost of Canada’s Annual Food Waste”, Value Chain Management Centre International, December 2014 *The food waste produced by airlines, cruise ships, merchant ships, yachts, cross-border trains, and the military


Natural resources and FLW
• The FAO report
– Carbon footprint
– Water footprint
– Land use
– Biodiversity
• Impact of food wastage varies along the food supply chain
• Geographical differences
• Different food products have different impact (beef production)
• Natural resources savings from reduction of food wastage

At AAFC: what do we do?
• Research and analysis
– FLW included in “An Overview of the Canadian Agriculture and Agri-Food System” – to
evaluate the economic, environmental and social costs – and try to assess the
effectiveness of polices – need good data first; where are the data where are the gaps etc
– Research in Science and Tech Branch
– The food processing industry roundtable
• Supporting private sector –
– The Value Chain Management Centre
• International collaborations
– The United States Department of Agriculture
– The Organisation for Economic Co-operation and Development
– The World Resources Institute

Abdel Felfel
Research & Analysis Directorate
Agriculture & Agri-Food Canada
613-773-0446
Any views expressed here, whether explicitly stated, inferred or interpreted are those of the
author and should not be attributed to Agriculture and Agri-Food Canada, Statistics
Canada or the Government of Canada.
Tabitha Rich
Macroeconomic Accounts Branch
Statistics Canada
613-790-2965