Embed Size (px)
Citation preview
ISSN 0317-0144
NEW ESTIMATES OF THE
CANADIAN MONEY STOCK:
1871 - 1967
by
Cherie MetcalfAngela RedishRonald Shearer
July, 1996
Discussion Paper No.: 96-17
DEPARTMENT OF ECONOMICS
THE UNIVERSITY OF BRITISH COLUMBIA
VANCOUVER, CANADA V6T 1Z1
web.arts.ubc.ca/~econ/
Abstract:
This paper constructs and documents historical data series beginning in 1871 forCanadian M1, M2, and monetary base. The new series are at a monthly frequency andcan be adjoined to those published by the Bank of Canada. The basic data for theaggregates come from the balance sheets of the chartered banks published monthly inthe Canada Gazette, as required by legislation. We adopt the Bank of Canada’sdefinition of the monetary aggregates, however, institutional and reporting changesmake perfect backwards extrapolation of the Bank’s series impossible: we use end ofmonth data rather than average weekly (since January 1994, daily) data, and we cannotprecisely match the savings accounts (at chartered banks and trust companies) that areincluded in the monetary aggregates. The paper discusses the effect of thesedifferences on the M1 and M2 aggregates respectively.
Keywords: Money supply; Canada; historical
JEL Classification numbers: E50, N11, N12
The authors would like to thank Shirley Haun for research assistance, the SSHRCCand UBC-HSS grant programmes for funding, and Mike Bordo for comments on anearlier draft. Please send comments to the authors at: Department of Economics,University of British Columbia, #997-1873 East Mall, Vancouver, B.C. V6T 1Z1 or [email protected].
I. Introduction.
This paper constructs and documents historical data series for Canadian M1, M2,
and monetary base at a monthly frequency, which can be adjoined to those published
by the Bank of Canada. Long spans of high frequency data have myriad uses in both
Canadian and international monetary history. The data will facilitate the historical
study of Canadian business cycles, long-run neutrality of money, changes in velocity,
and the effects of changing monetary regimes. On the international front, the data will
enhance studies of the international transmission of business cycles, and comparisons
of the effects of alternative banking systems.1 Some historical monetary data have
been compiled for Canada; however, relative to the series we present here, the
available series are either shorter or at an annual frequency, are inconsistent with each
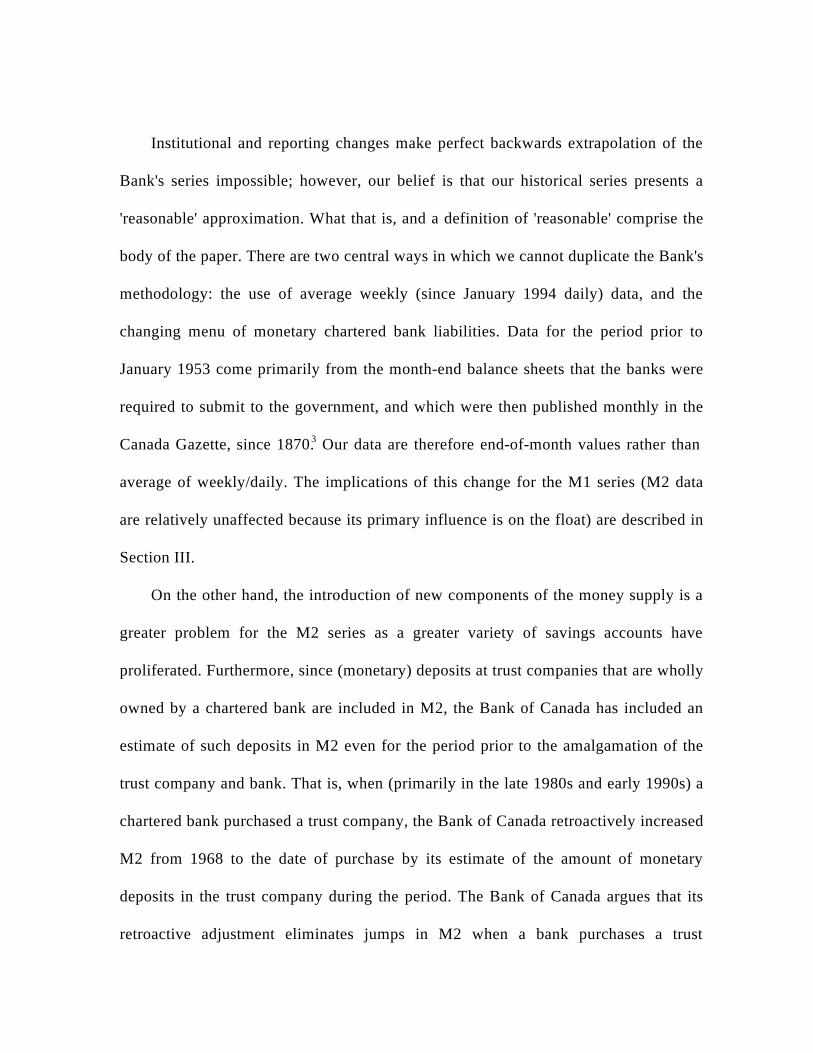
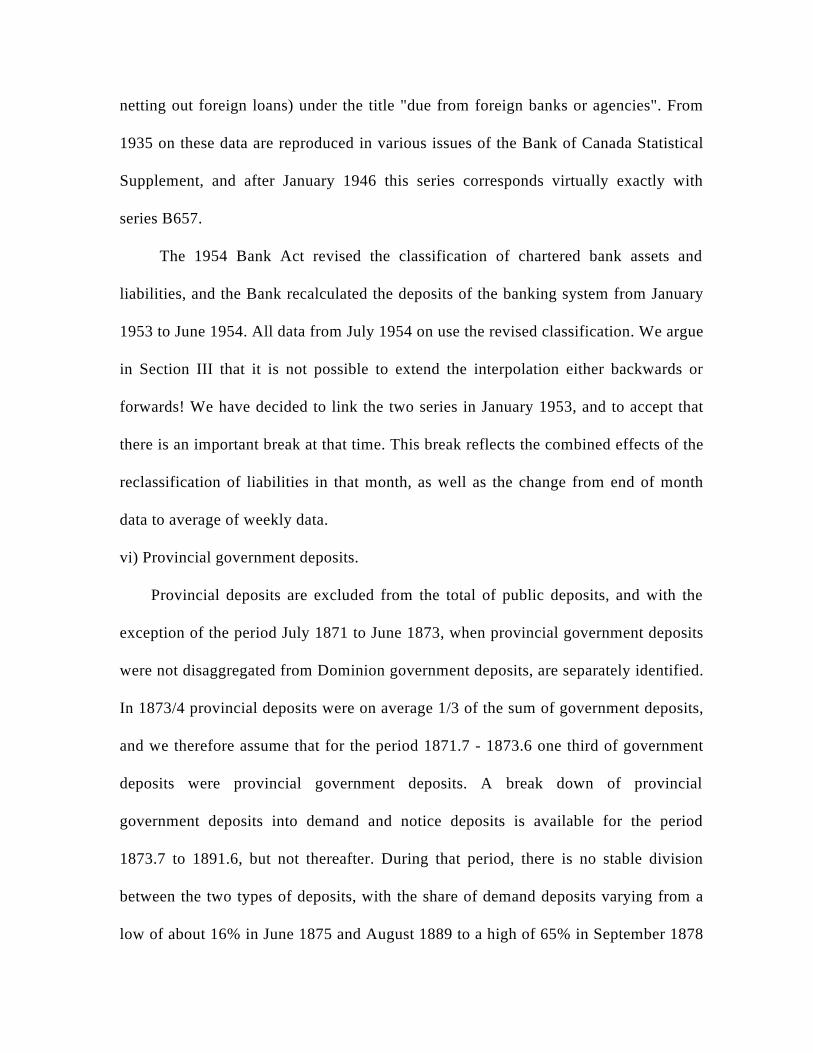
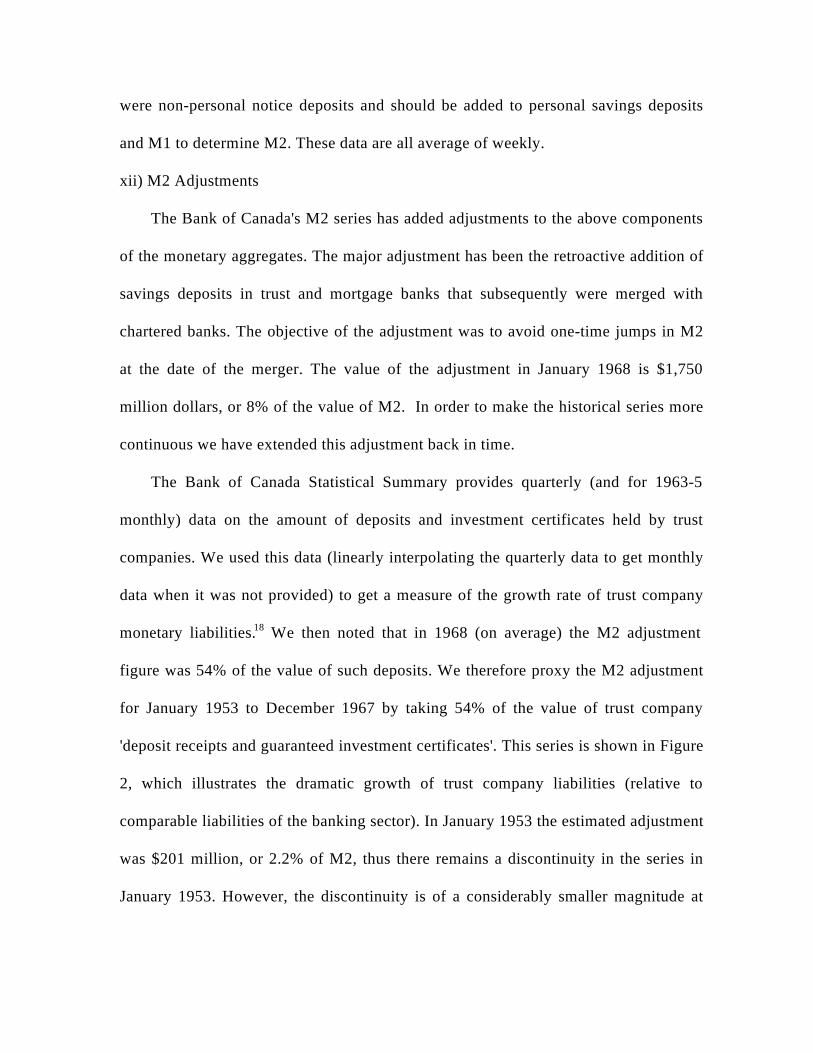
other, and do not link with the Bank of Canada data. Figure 1 presents the data, and
the aggregate monthly data for the period July 1871 to December 1967 are presented
in the Appendix.
The basic data for our aggregates come from the balance sheets of the chartered banks
published monthly in the Canada Gazette, henceforth CG, as required by legislation.
The small number of banks and the single layer of government with jurisdiction over
banking, make the collection of such data relatively straightforward. Furthermore
Curtis (1929) published the monthly totals for all banks for all balance sheet categories
for the period 1870-1929. Annual (December) totals are also reproduced in the
Historical Statistics of Canada - henceforth HSC - (Buckley and Urquhart (1965))
and have been used by Bordo and Jonung (1987) to create their annual money supply
series, in turn used by Siklos (1993) and Rolnick and Weber (1995).2
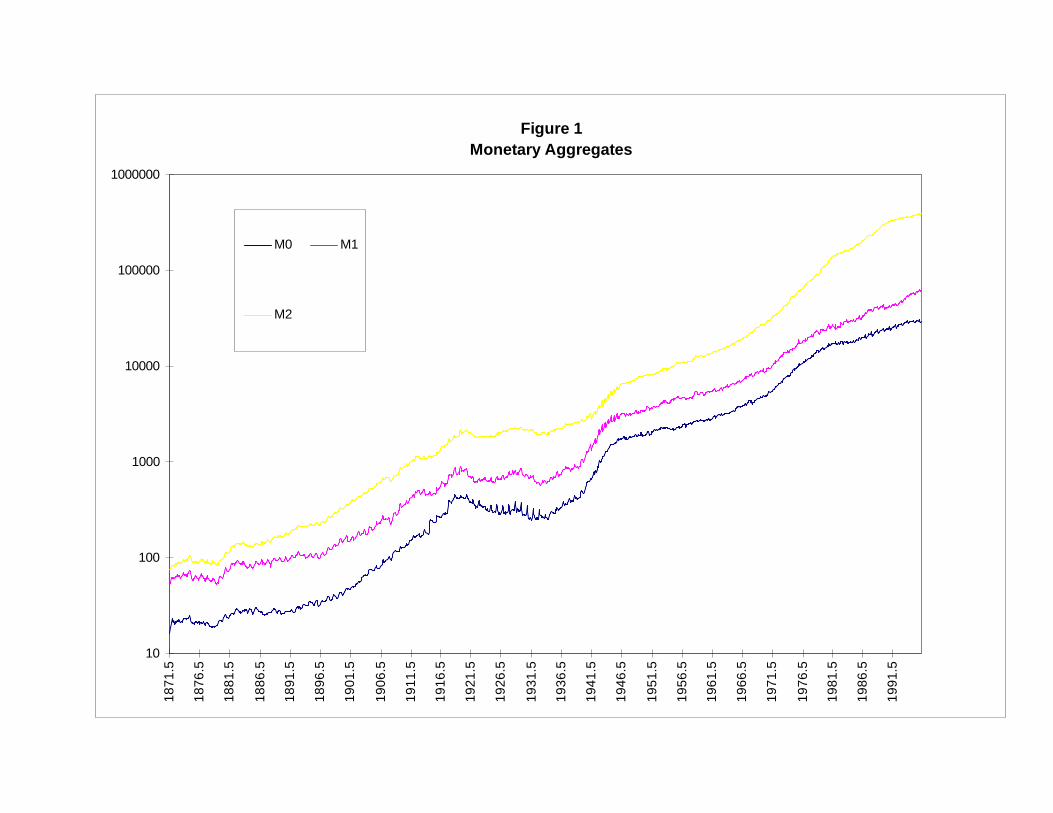
Figure 1Monetary Aggregates
10
100
1000
10000
100000
100000018
71.5
1876
.5
1881
.5
1886
.5
1891
.5
1896
.5
1901
.5
1906
.5
1911
.5
1916
.5
1921
.5
1926
.5
1931
.5
1936
.5
1941
.5
1946
.5
1951
.5
1956
.5
1961
.5
1966
.5
1971
.5
1976
.5
1981
.5
1986
.5
1991
.5
M0 M1
M2
Institutional and reporting changes make perfect backwards extrapolation of the
Bank's series impossible; however, our belief is that our historical series presents a
'reasonable' approximation. What that is, and a definition of 'reasonable' comprise the
body of the paper. There are two central ways in which we cannot duplicate the Bank's
methodology: the use of average weekly (since January 1994 daily) data, and the
changing menu of monetary chartered bank liabilities. Data for the period prior to
January 1953 come primarily from the month-end balance sheets that the banks were
required to submit to the government, and which were then published monthly in the
Canada Gazette, since 1870.3 Our data are therefore end-of-month values rather than
average of weekly/daily. The implications of this change for the M1 series (M2 data
are relatively unaffected because its primary influence is on the float) are described in
Section III.
On the other hand, the introduction of new components of the money supply is a
greater problem for the M2 series as a greater variety of savings accounts have
proliferated. Furthermore, since (monetary) deposits at trust companies that are wholly
owned by a chartered bank are included in M2, the Bank of Canada has included an
estimate of such deposits in M2 even for the period prior to the amalgamation of the
trust company and bank. That is, when (primarily in the late 1980s and early 1990s) a
chartered bank purchased a trust company, the Bank of Canada retroactively increased
M2 from 1968 to the date of purchase by its estimate of the amount of monetary
deposits in the trust company during the period. The Bank of Canada argues that its
retroactive adjustment eliminates jumps in M2 when a bank purchases a trust
company, however, the adjustments create the anomaly of large revisions in the entire
M2 series when purchases occur. (Trust company deposits are largely savings deposits
rather than demand deposits, so the effect on M1 is considerably less.) While we
question the appropriateness of this adjustment we have attempted to extrapolate it
back to 1953 in order that our series link in reasonable fashion with the official series.
Since the trust companies prior to amalgamation were not required to publish their
monthly balance sheets, and did not use the same categories for deposits in the balance
sheets that they did publish, such extrapolation is at best an estimate.
The paper is organized as follows: the next section documents our definition of
the money stock and data sources for the individual components of the series;4
Sections III and IV examine how closely these series 'link' to the Bank's M1 and M2
series respectively. Section V contains our definition of monetary base and discusses
additional component series used to construct M0. Finally, Section VI presents a brief
discussion of the data themselves, contrasts them with the Bordo and Jonung data, and
discusses avenues of research they suggest for Canadian monetary history.
II. Data sources and Components
The definitions of M1 and M2 are historical applications of the Bank of Canada’s
current definition.5 M1 comprises currency in the hands of the public (which included
at various times coin, chartered bank notes, Dominion notes, and Bank of Canada
notes) and demand deposits held by the public and provincial governments, net of
float. Today, M2 includes M1 net plus personal savings deposits and non-personal
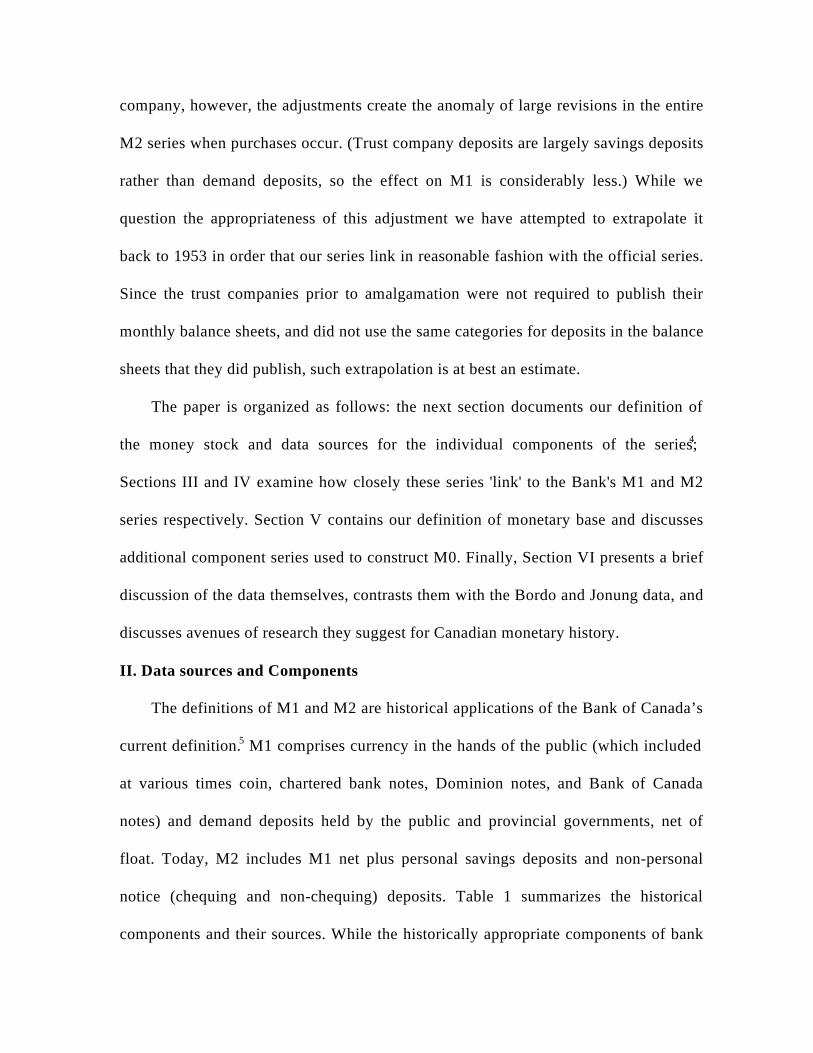
notice (chequing and non-chequing) deposits. Table 1 summarizes the historical
components and their sources. While the historically appropriate components of bank
liabilities for M1 are reasonably clear, it is not so obvious what to include in the
historical M2 series. As shown in Table 1 we have proceeded, given the data
constraints, by assuming that all notice deposits in the period before January 1953
should be included in M2. For the period from 1953.1 to 1967.12 we have proxied the
non-M1 components of M2 by combining personal savings deposits and a share of
"Other notice" deposits as described below.
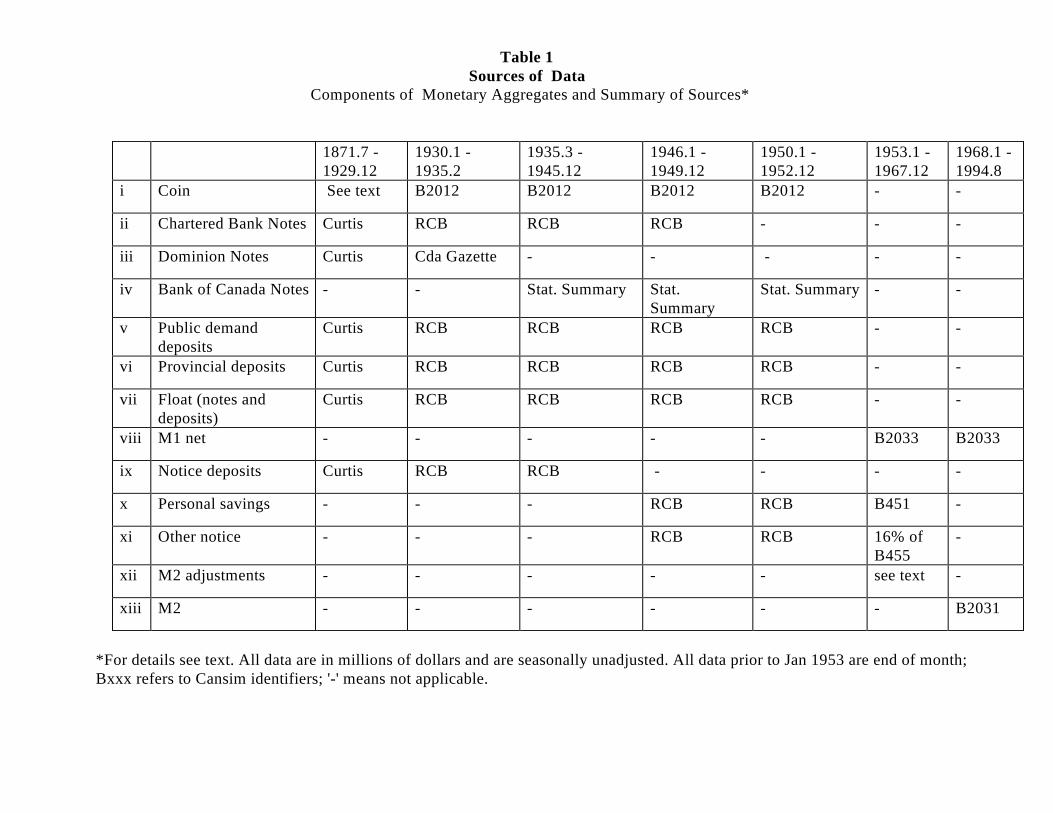
Table 1Sources of Data
Components of Monetary Aggregates and Summary of Sources*
1871.7 -1929.12
1930.1 -1935.2
1935.3 -1945.12
1946.1 -1949.12
1950.1 -1952.12
1953.1 -1967.12
1968.1 -1994.8
i Coin See text B2012 B2012 B2012 B2012 - -
ii Chartered Bank Notes Curtis RCB RCB RCB - - -
iii Dominion Notes Curtis Cda Gazette - - - - -
iv Bank of Canada Notes - - Stat. Summary Stat.Summary
Stat. Summary - -
v Public demanddeposits
Curtis RCB RCB RCB RCB - -
vi Provincial deposits Curtis RCB RCB RCB RCB - -
vii Float (notes anddeposits)
Curtis RCB RCB RCB RCB - -
viii M1 net - - - - - B2033 B2033
ix Notice deposits Curtis RCB RCB - - - -
x Personal savings - - - RCB RCB B451 -
xi Other notice - - - RCB RCB 16% ofB455
-
xii M2 adjustments - - - - - see text -
xiii M2 - - - - - - B2031
*For details see text. All data are in millions of dollars and are seasonally unadjusted. All data prior to Jan 1953 are end of month;Bxxx refers to Cansim identifiers; '-' means not applicable.
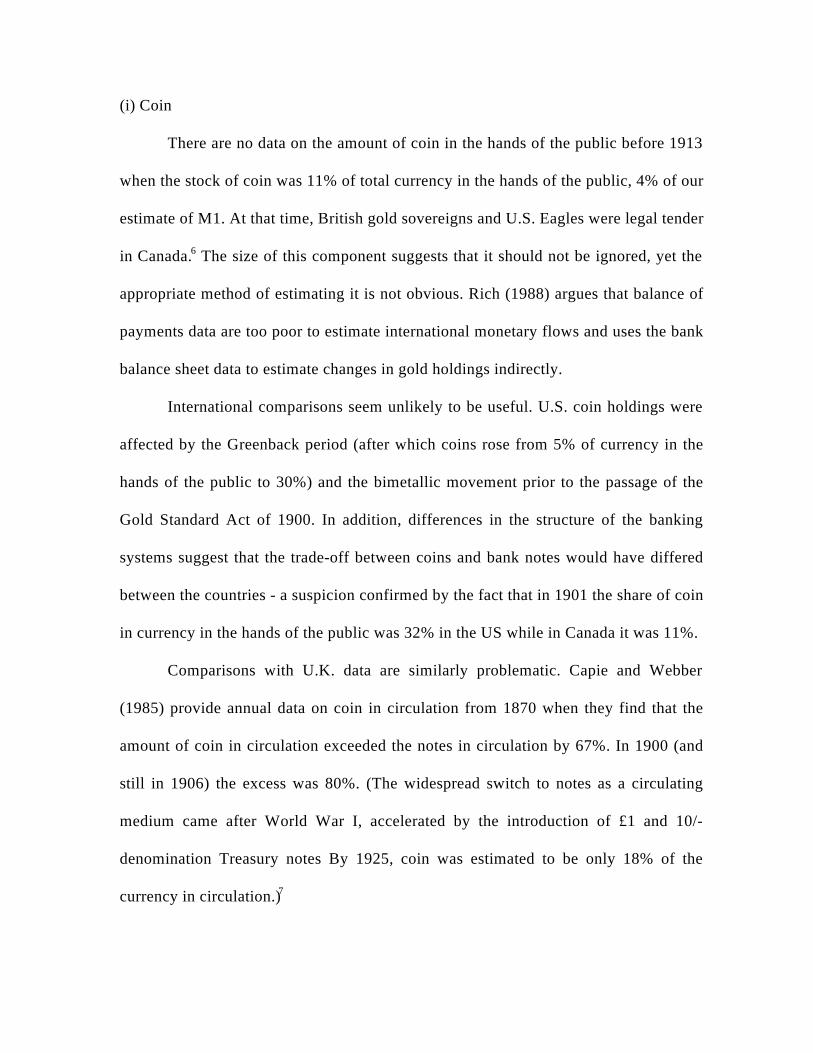
(i) Coin
There are no data on the amount of coin in the hands of the public before 1913
when the stock of coin was 11% of total currency in the hands of the public, 4% of our
estimate of M1. At that time, British gold sovereigns and U.S. Eagles were legal tender
in Canada.6 The size of this component suggests that it should not be ignored, yet the
appropriate method of estimating it is not obvious. Rich (1988) argues that balance of
payments data are too poor to estimate international monetary flows and uses the bank
balance sheet data to estimate changes in gold holdings indirectly.
International comparisons seem unlikely to be useful. U.S. coin holdings were
affected by the Greenback period (after which coins rose from 5% of currency in the
hands of the public to 30%) and the bimetallic movement prior to the passage of the
Gold Standard Act of 1900. In addition, differences in the structure of the banking
systems suggest that the trade-off between coins and bank notes would have differed
between the countries - a suspicion confirmed by the fact that in 1901 the share of coin
in currency in the hands of the public was 32% in the US while in Canada it was 11%.
Comparisons with U.K. data are similarly problematic. Capie and Webber
(1985) provide annual data on coin in circulation from 1870 when they find that the
amount of coin in circulation exceeded the notes in circulation by 67%. In 1900 (and
still in 1906) the excess was 80%. (The widespread switch to notes as a circulating
medium came after World War I, accelerated by the introduction of £1 and 10/-
denomination Treasury notes By 1925, coin was estimated to be only 18% of the
currency in circulation.)7
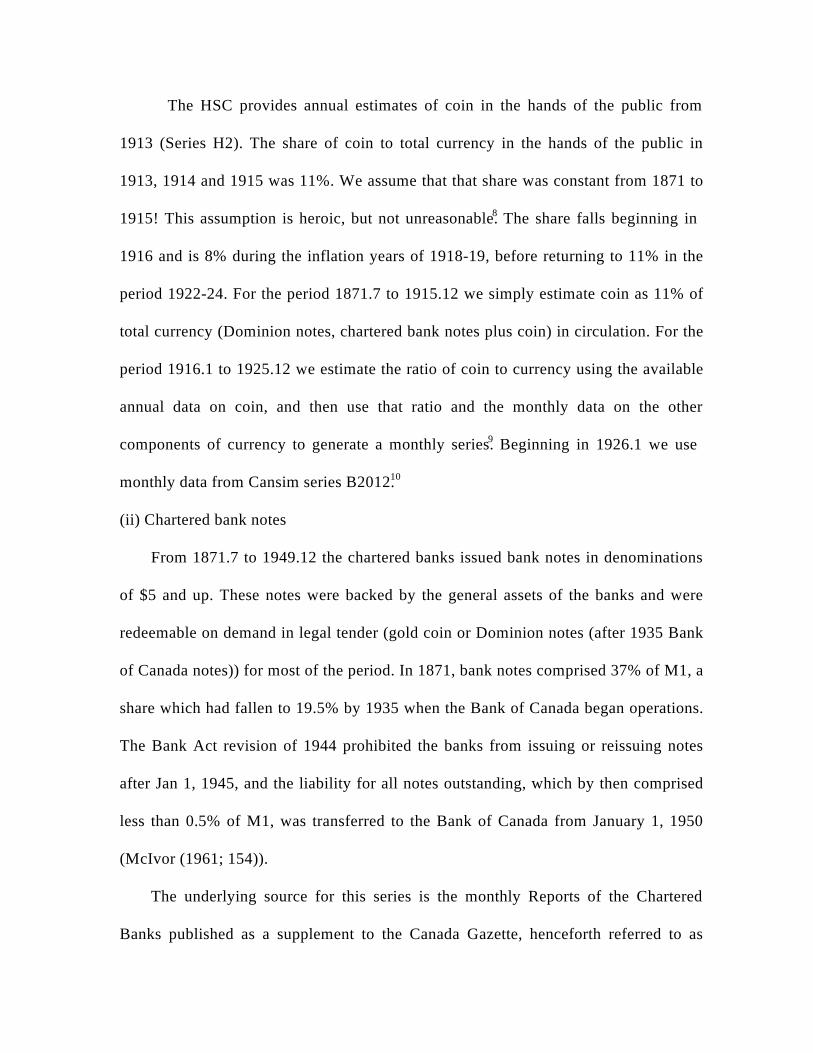
The HSC provides annual estimates of coin in the hands of the public from
1913 (Series H2). The share of coin to total currency in the hands of the public in
1913, 1914 and 1915 was 11%. We assume that that share was constant from 1871 to
1915! This assumption is heroic, but not unreasonable.8 The share falls beginning in
1916 and is 8% during the inflation years of 1918-19, before returning to 11% in the
period 1922-24. For the period 1871.7 to 1915.12 we simply estimate coin as 11% of
total currency (Dominion notes, chartered bank notes plus coin) in circulation. For the
period 1916.1 to 1925.12 we estimate the ratio of coin to currency using the available
annual data on coin, and then use that ratio and the monthly data on the other
components of currency to generate a monthly series.9 Beginning in 1926.1 we use
monthly data from Cansim series B2012.10
(ii) Chartered bank notes
From 1871.7 to 1949.12 the chartered banks issued bank notes in denominations
of $5 and up. These notes were backed by the general assets of the banks and were
redeemable on demand in legal tender (gold coin or Dominion notes (after 1935 Bank
of Canada notes)) for most of the period. In 1871, bank notes comprised 37% of M1, a
share which had fallen to 19.5% by 1935 when the Bank of Canada began operations.
The Bank Act revision of 1944 prohibited the banks from issuing or reissuing notes
after Jan 1, 1945, and the liability for all notes outstanding, which by then comprised
less than 0.5% of M1, was transferred to the Bank of Canada from January 1, 1950
(McIvor (1961; 154)).
The underlying source for this series is the monthly Reports of the Chartered
Banks published as a supplement to the Canada Gazette, henceforth referred to as
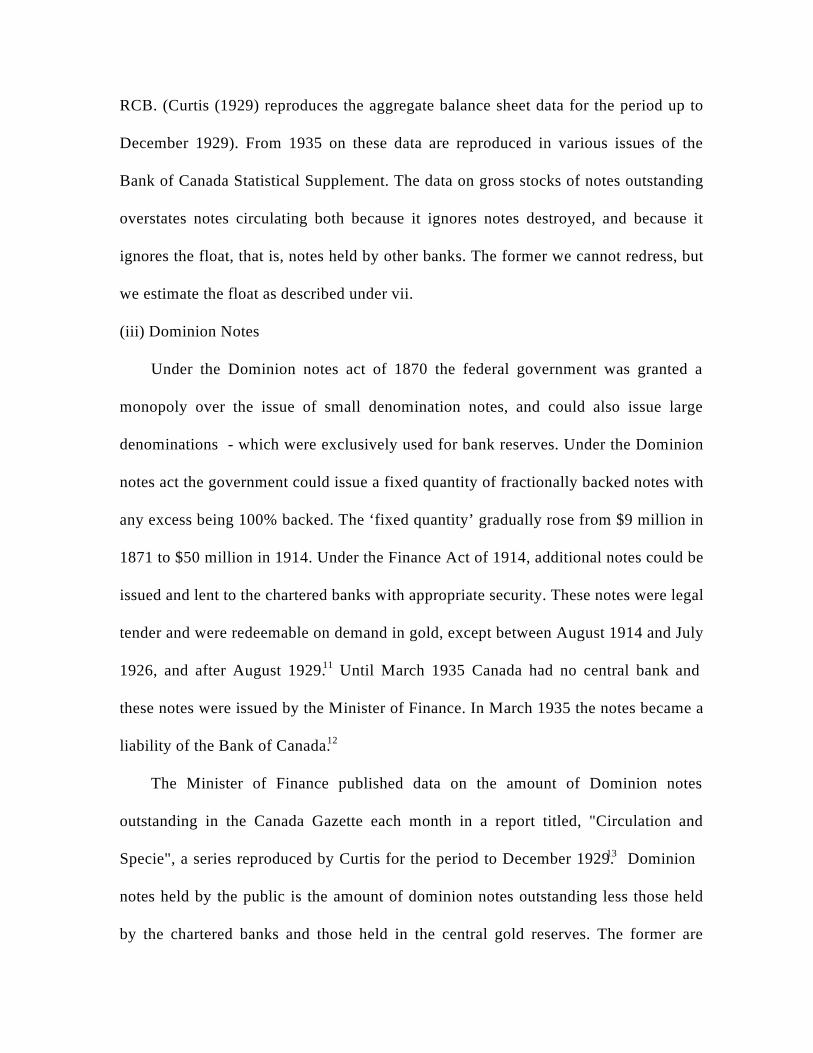
RCB. (Curtis (1929) reproduces the aggregate balance sheet data for the period up to
December 1929). From 1935 on these data are reproduced in various issues of the
Bank of Canada Statistical Supplement. The data on gross stocks of notes outstanding
overstates notes circulating both because it ignores notes destroyed, and because it
ignores the float, that is, notes held by other banks. The former we cannot redress, but
we estimate the float as described under vii.
(iii) Dominion Notes
Under the Dominion notes act of 1870 the federal government was granted a
monopoly over the issue of small denomination notes, and could also issue large
denominations - which were exclusively used for bank reserves. Under the Dominion
notes act the government could issue a fixed quantity of fractionally backed notes with
any excess being 100% backed. The ‘fixed quantity’ gradually rose from $9 million in
1871 to $50 million in 1914. Under the Finance Act of 1914, additional notes could be
issued and lent to the chartered banks with appropriate security. These notes were legal
tender and were redeemable on demand in gold, except between August 1914 and July
1926, and after August 1929.11 Until March 1935 Canada had no central bank and
these notes were issued by the Minister of Finance. In March 1935 the notes became a
liability of the Bank of Canada.12
The Minister of Finance published data on the amount of Dominion notes
outstanding in the Canada Gazette each month in a report titled, "Circulation and
Specie", a series reproduced by Curtis for the period to December 1929.13 Dominion
notes held by the public is the amount of dominion notes outstanding less those held
by the chartered banks and those held in the central gold reserves. The former are
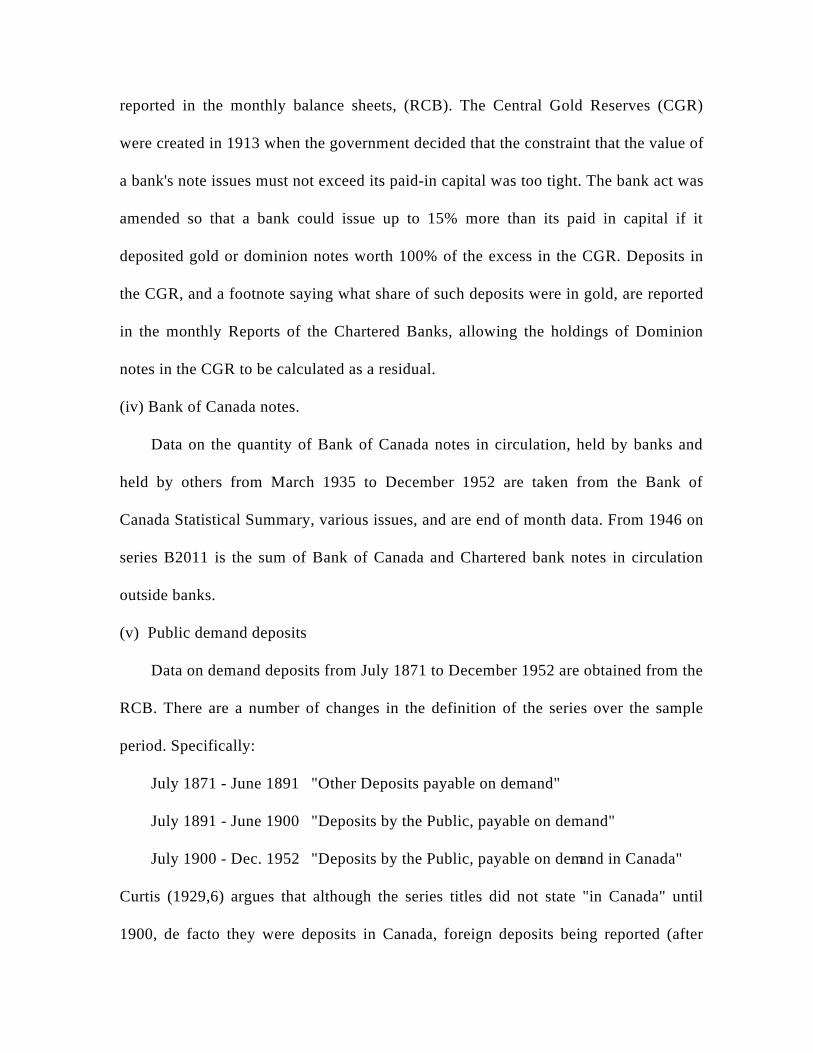
reported in the monthly balance sheets, (RCB). The Central Gold Reserves (CGR)
were created in 1913 when the government decided that the constraint that the value of
a bank's note issues must not exceed its paid-in capital was too tight. The bank act was
amended so that a bank could issue up to 15% more than its paid in capital if it
deposited gold or dominion notes worth 100% of the excess in the CGR. Deposits in
the CGR, and a footnote saying what share of such deposits were in gold, are reported
in the monthly Reports of the Chartered Banks, allowing the holdings of Dominion
notes in the CGR to be calculated as a residual.
(iv) Bank of Canada notes.
Data on the quantity of Bank of Canada notes in circulation, held by banks and
held by others from March 1935 to December 1952 are taken from the Bank of
Canada Statistical Summary, various issues, and are end of month data. From 1946 on
series B2011 is the sum of Bank of Canada and Chartered bank notes in circulation
outside banks.
(v) Public demand deposits
Data on demand deposits from July 1871 to December 1952 are obtained from the
RCB. There are a number of changes in the definition of the series over the sample
period. Specifically:
July 1871 - June 1891 "Other Deposits payable on demand"
July 1891 - June 1900 "Deposits by the Public, payable on demand"
July 1900 - Dec. 1952 "Deposits by the Public, payable on demand in Canada"
Curtis (1929,6) argues that although the series titles did not state "in Canada" until
1900, de facto they were deposits in Canada, foreign deposits being reported (after
netting out foreign loans) under the title "due from foreign banks or agencies". From
1935 on these data are reproduced in various issues of the Bank of Canada Statistical
Supplement, and after January 1946 this series corresponds virtually exactly with
series B657.
The 1954 Bank Act revised the classification of chartered bank assets and
liabilities, and the Bank recalculated the deposits of the banking system from January
1953 to June 1954. All data from July 1954 on use the revised classification. We argue
in Section III that it is not possible to extend the interpolation either backwards or
forwards! We have decided to link the two series in January 1953, and to accept that
there is an important break at that time. This break reflects the combined effects of the
reclassification of liabilities in that month, as well as the change from end of month
data to average of weekly data.
vi) Provincial government deposits.
Provincial deposits are excluded from the total of public deposits, and with the
exception of the period July 1871 to June 1873, when provincial government deposits
were not disaggregated from Dominion government deposits, are separately identified.
In 1873/4 provincial deposits were on average 1/3 of the sum of government deposits,
and we therefore assume that for the period 1871.7 - 1873.6 one third of government
deposits were provincial government deposits. A break down of provincial
government deposits into demand and notice deposits is available for the period
1873.7 to 1891.6, but not thereafter. During that period, there is no stable division
between the two types of deposits, with the share of demand deposits varying from a
low of about 16% in June 1875 and August 1889 to a high of 65% in September 1878
and December 1881. We have decided to treat all provincial government deposits as
demand deposits, although this results in a small overstatement of M1 (provincial
deposits are less than 5% of M1 throughout the period).
Our data are from Curtis for 1871.7 to 1929.12, RCB for 1930.1 to 1935.1, and
various issues of the Bank of Canada Statistical Supplement for 1935-52. From
January 1946 this series corresponds virtually exactly with B653.
vii) Float
The float consists of cheques of other banks in transit plus, for the period when
the chartered banks issued notes, notes of other banks, and is subtracted from the sum
of monetary liabilities to avoid double counting. For example, the cheque float
comprises cheques that are counted as deposits in the receiving bank, but since they
have not yet cleared the amount has not been deducted from the deposits of the paying
bank. Thus if the float were not deducted the amount of such cheques would be double
counted.14
The data available to adjust for the float are as follows (all from RCB):
(a) July 1871-June 1913 - 'Cheques and notes held by other banks,including foreign currency';
(b) July 1913 - September 1923 - 'Notes held by other banks, includingforeign currency' and ‘Cheques on other banks’;
(c) October 1923 - December 1952 - 'Notes held by other banks, excludingforeign currency' and ‘Cheques on other banks’;
For the monetary aggregate series it is not necessary to disaggregate the cheque and
note float (since both are subtracted out of the aggregates), however, it is necessary to
separate out the holdings of foreign currency.15 We do this quite crudely by noting that
from 1923-29, on average, bank holdings of foreign currency were 60% of the sum of
domestic plus foreign banks notes held. Therefore for the period July 1913 to
September 1923 we assume that the float of domestic notes was 40% of the value of
"Notes of other banks including foreign currency" and subtract this from the "Notes
outstanding" series. Similarly for the period July 1871 to June 1913 we assume that
87% of the series for "Cheques and Notes of other banks, including foreign currency"
represents the float of domestic currency and subtract it from the "Notes
outstanding".16 After October 1923 we simply subtract the ‘Notes of other banks’ and
‘Cheques of other banks’ from the series. From 1935 on these data are reproduced in
various issues of the Bank of Canada Statistical Supplement and from 1946 on this
series corresponds almost exactly to B628.
viii) M1 net
This is the sum of average weekly (since January 1994 average daily) data on
coin and Bank of Canada notes in the hands of the public (B2001), plus demand
deposits (personal chequing and current accounts) held by the public and provincial
governments (B486+B487), less the cheque float (B478).17 It is the series B2033.
ix) Notice deposits
Data on this component are found in the RCB and are reproduced for the period
1871.7-1929.12 in Curtis (1929). Again series definitions change slightly over the
period:
July 1871- June 1891 "Other deposits payable after notice or on a fixed day"
July 1891- June 1900 "Deposits by the public, payable after notice or on afixed day"
July 1900- Dec. 1945 "Deposits by the public, payable after notice or on afixed day, in Canada"
Data for the period 1930-35 are from RCB while from 1935 to 1945 we use data from
various issues of the Bank of Canada Statistical Supplement.
x) Personal savings deposits
Beginning in 1946 the Bank of Canada (and the RCB) decompose the data on the
notice deposits of banks into personal savings (B451) and other non-personal term and
notice deposits (B455). We have chosen to break the series in January 1953, to
coincide with the break in the M1 series and the switch to average weekly (from end
of month) data. Therefore, data for the period from January 1946 to December 1952
are the sum of end of month data on personal savings and other notice deposits from
various issues of the Bank of Canada Statistical Summary. (These series correspond
almost exactly with B654 and B655 respectively).
xi) Non-personal notice deposits
For the period 1946-1952 we include all 'other notice and term deposits'. Since
today's M2 definition excludes non-personal term deposits we overstate the level of
M2 for this period. We argue below that the amount of non-personal term deposits
held by banks, and therefore the level of overstatement, was not large in this period.
For the period 1953-67 we construct an estimate of non-personal notice deposits. The
estimate is derived by noting that in 1968, on average, 16% of the sum of non-personal
notice + non-personal term deposits were notice deposits, so we somewhat arbitrarily
assume that from 1953.1 to 1967.12, 16% of 'other term and notice' deposits (B455)
were non-personal notice deposits and should be added to personal savings deposits
and M1 to determine M2. These data are all average of weekly.
xii) M2 Adjustments
The Bank of Canada's M2 series has added adjustments to the above components
of the monetary aggregates. The major adjustment has been the retroactive addition of
savings deposits in trust and mortgage banks that subsequently were merged with
chartered banks. The objective of the adjustment was to avoid one-time jumps in M2
at the date of the merger. The value of the adjustment in January 1968 is $1,750
million dollars, or 8% of the value of M2. In order to make the historical series more
continuous we have extended this adjustment back in time.
The Bank of Canada Statistical Summary provides quarterly (and for 1963-5
monthly) data on the amount of deposits and investment certificates held by trust
companies. We used this data (linearly interpolating the quarterly data to get monthly
data when it was not provided) to get a measure of the growth rate of trust company
monetary liabilities.18 We then noted that in 1968 (on average) the M2 adjustment
figure was 54% of the value of such deposits. We therefore proxy the M2 adjustment
for January 1953 to December 1967 by taking 54% of the value of trust company
'deposit receipts and guaranteed investment certificates'. This series is shown in Figure
2, which illustrates the dramatic growth of trust company liabilities (relative to
comparable liabilities of the banking sector). In January 1953 the estimated adjustment
was $201 million, or 2.2% of M2, thus there remains a discontinuity in the series in
January 1953. However, the discontinuity is of a considerably smaller magnitude at
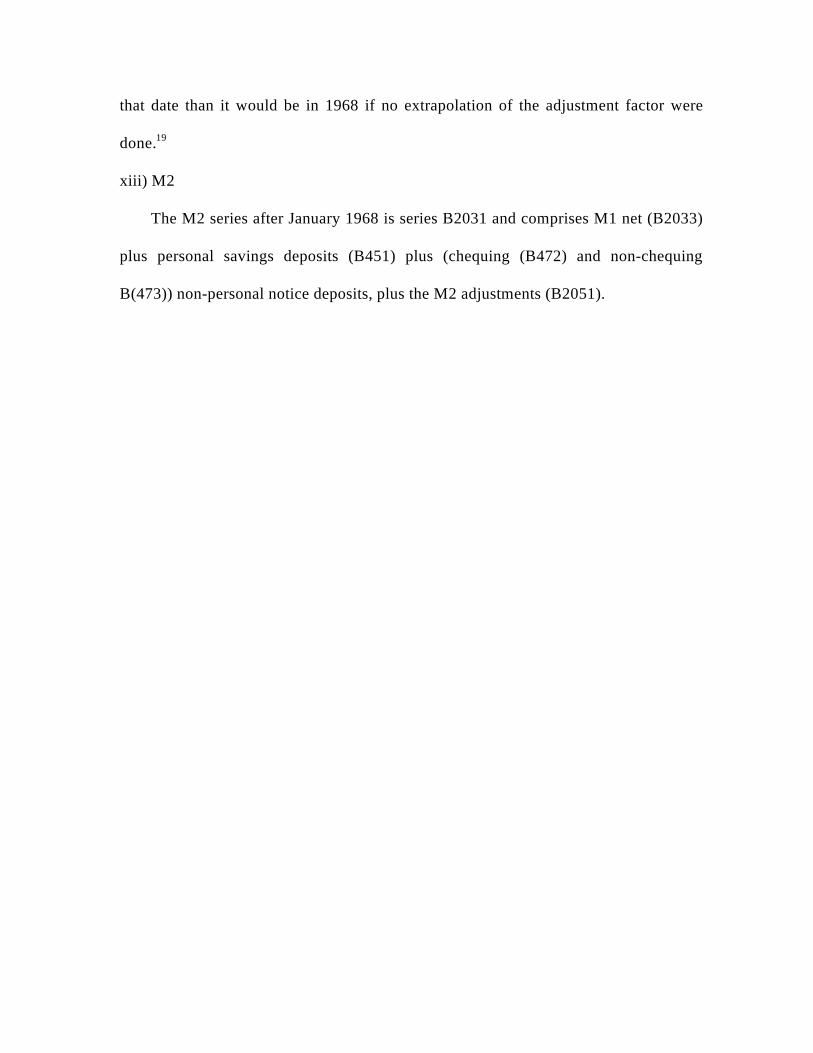
that date than it would be in 1968 if no extrapolation of the adjustment factor were
done.19
xiii) M2
The M2 series after January 1968 is series B2031 and comprises M1 net (B2033)
plus personal savings deposits (B451) plus (chequing (B472) and non-chequing
B(473)) non-personal notice deposits, plus the M2 adjustments (B2051).
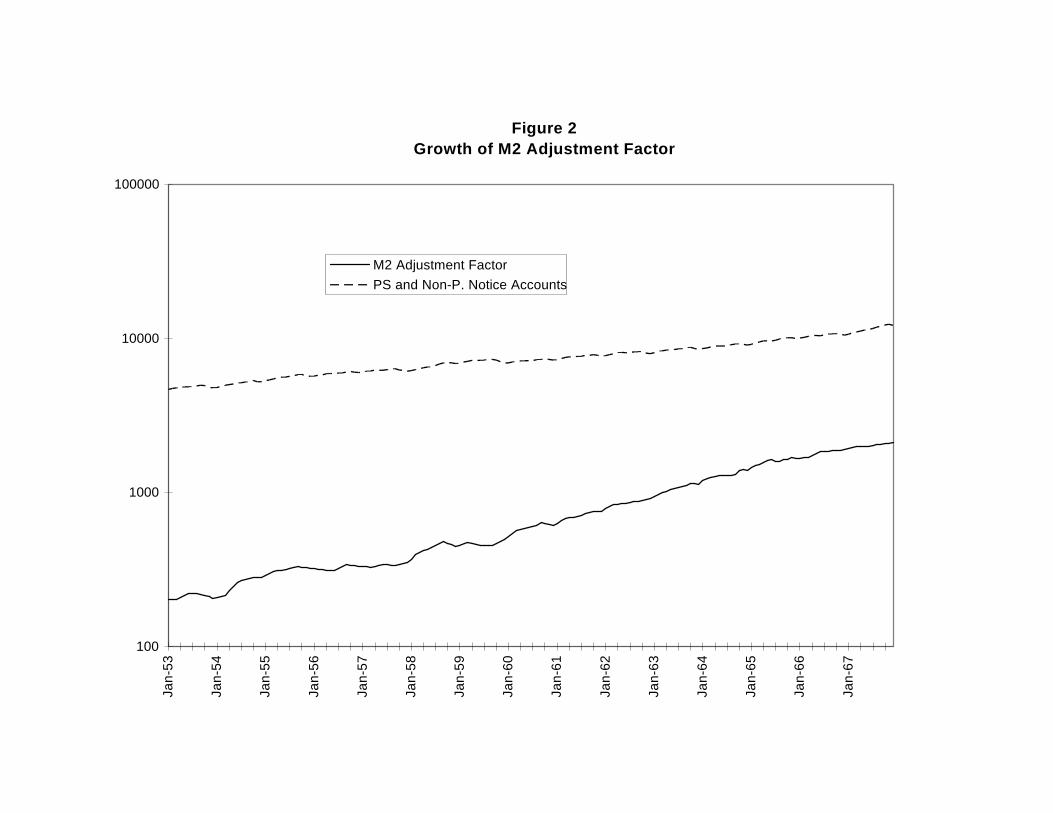
Figure 2Growth of M2 Adjustment Factor
100
1000
10000
100000Ja
n-53
Jan-
54
Jan-
55
Jan-
56
Jan-
57
Jan-
58
Jan-
59
Jan-
60
Jan-
61
Jan-
62
Jan-
63
Jan-
64
Jan-
65
Jan-
66
Jan-
67
M2 Adjustment FactorPS and Non-P. Notice Accounts
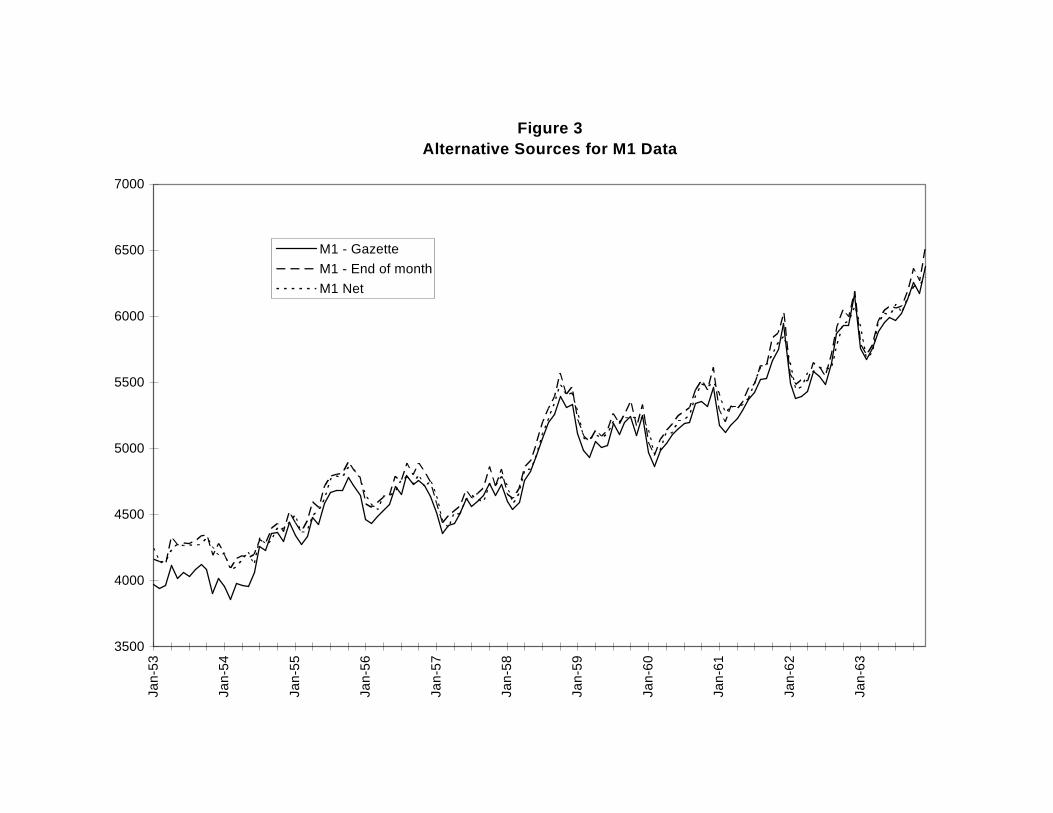
Figure 3Alternative Sources for M1 Data
3500
4000
4500
5000
5500
6000
6500
7000
Jan-
53
Jan-
54
Jan-
55
Jan-
56
Jan-
57
Jan-
58
Jan-
59
Jan-
60
Jan-
61
Jan-
62
Jan-
63
M1 - GazetteM1 - End of monthM1 Net
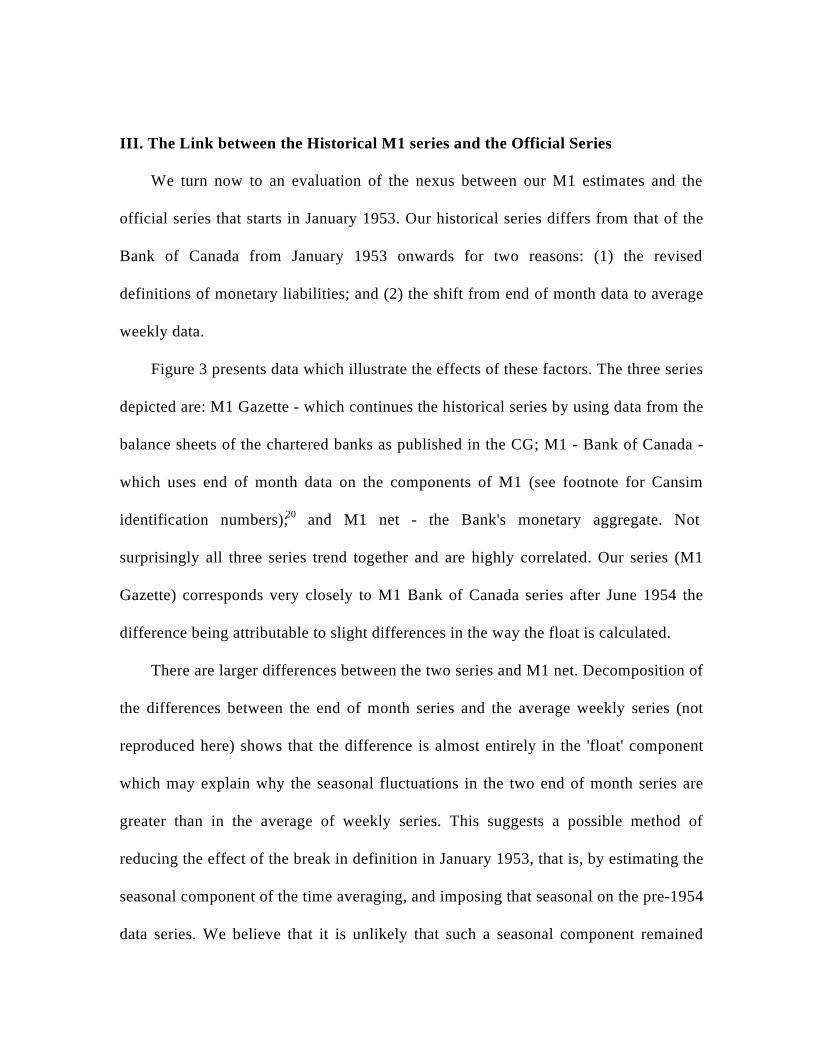
III. The Link between the Historical M1 series and the Official Series
We turn now to an evaluation of the nexus between our M1 estimates and the
official series that starts in January 1953. Our historical series differs from that of the
Bank of Canada from January 1953 onwards for two reasons: (1) the revised
definitions of monetary liabilities; and (2) the shift from end of month data to average
weekly data.
Figure 3 presents data which illustrate the effects of these factors. The three series
depicted are: M1 Gazette - which continues the historical series by using data from the
balance sheets of the chartered banks as published in the CG; M1 - Bank of Canada -
which uses end of month data on the components of M1 (see footnote for Cansim
identification numbers);20 and M1 net - the Bank's monetary aggregate. Not
surprisingly all three series trend together and are highly correlated. Our series (M1
Gazette) corresponds very closely to M1 Bank of Canada series after June 1954 the
difference being attributable to slight differences in the way the float is calculated.
There are larger differences between the two series and M1 net. Decomposition of
the differences between the end of month series and the average weekly series (not
reproduced here) shows that the difference is almost entirely in the 'float' component
which may explain why the seasonal fluctuations in the two end of month series are
greater than in the average of weekly series. This suggests a possible method of
reducing the effect of the break in definition in January 1953, that is, by estimating the
seasonal component of the time averaging, and imposing that seasonal on the pre-1954
data series. We believe that it is unlikely that such a seasonal component remained
stable over the period 1871-1954, and that the interpolation would give a false sense of
confidence, and therefore do not make such an adjustment.21
The difference between M1 - Bank of Canada and M1 net is the difference in
timing which permits us to isolate the effect of moving from end of month data to
average of weekly data.22 The difference between M1 - Gazette and M1 - Bank of
Canada (after July 1954) is due to slight differences in the way that the Bank of
Canada calculates the float.
The large gap between M1 Gazette and M1 - Bank of Canada (and M1 net) in the
period January 1953 to June 1954 reflects the reclassification of chartered bank
liabilities following the 1954 Bank Act. Following the Bank Act, the reporting
categories for liabilities were redefined, and the Bank reclassified the data retroactively
for the period January 1953 to June 1954. In January 1953 according to the old
classification, and the data reported in the Canada Gazette, net demand deposits (i.e.
demand deposits + provincial deposits - float) were $2,618 million, while according to
the Bank of Canada’s revised definitions the value was $2,739 million, a 5%
difference. This discontinuity remains approximately the same across the overlap
period. We cannot determine the algorithm that was used to do the reclassification, nor
do the revised category titles clarify the rule.23 Thus, we leave a significant change in
definition of M1 in January 1953.
In sum, while our definition of M1 is similar to that which the Bank of Canada
uses, data limitations make a seamless join between the historical series and the
Bank’s official series impossible. In December 1952, M1 was $4100 million while in
January 1953 it was $4245. Part of this 3.5% increase should be attributed to the
redefinition of demand deposits. Furthermore, changes in the frequency of sampling,
mean that there are changes in the seasonal properties of the data.
IV. The Link between the historical M2 series and the Official Series.
The backward extrapolation of the M2 series, involves two problems: the
extrapolation of the M2 adjustment series, and the use of a proxy for the deposit series
that are included in M2 after 1968.
The Bank of Canada's M2 aggregate includes series B2051, the M2
adjustments. This series largely represents an attempt to smooth out the effect of recent
mergers of mortgage companies with chartered banks. In the absence of these
adjustments, the value of personal savings and notice deposits would jump
discontinuously at the date of a merger. The Bank has smoothed the M2 series by
retroactively adding the value of such deposits at the mergee institutions to M2. These
adjustments have the feature that historic (1968-96) values of M2 are changing over
time as more institutions merge! In Figure 4 we depict the value of the M2 adjustment
series (B2051) as of April 1996, May 1995, and also short spans of data on the series
taken from the Bank of Canada Review in Summer 1993 and Spring 1994. The impact
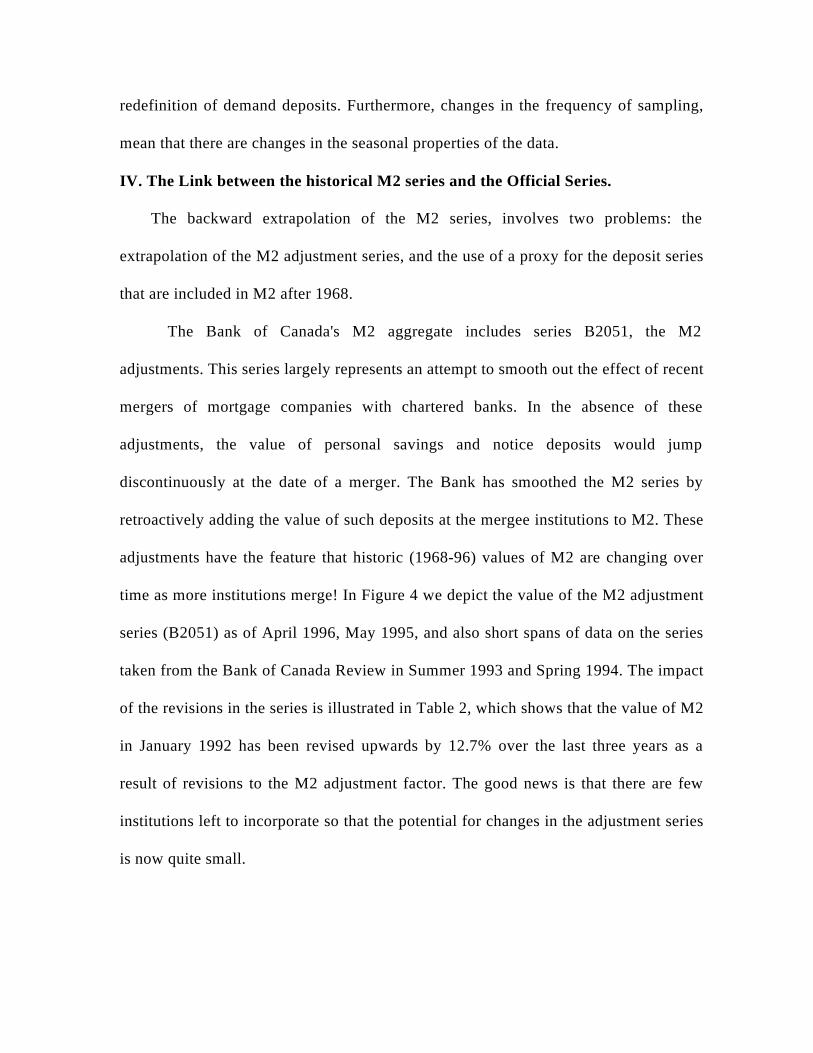
of the revisions in the series is illustrated in Table 2, which shows that the value of M2
in January 1992 has been revised upwards by 12.7% over the last three years as a
result of revisions to the M2 adjustment factor. The good news is that there are few
institutions left to incorporate so that the potential for changes in the adjustment series
is now quite small.
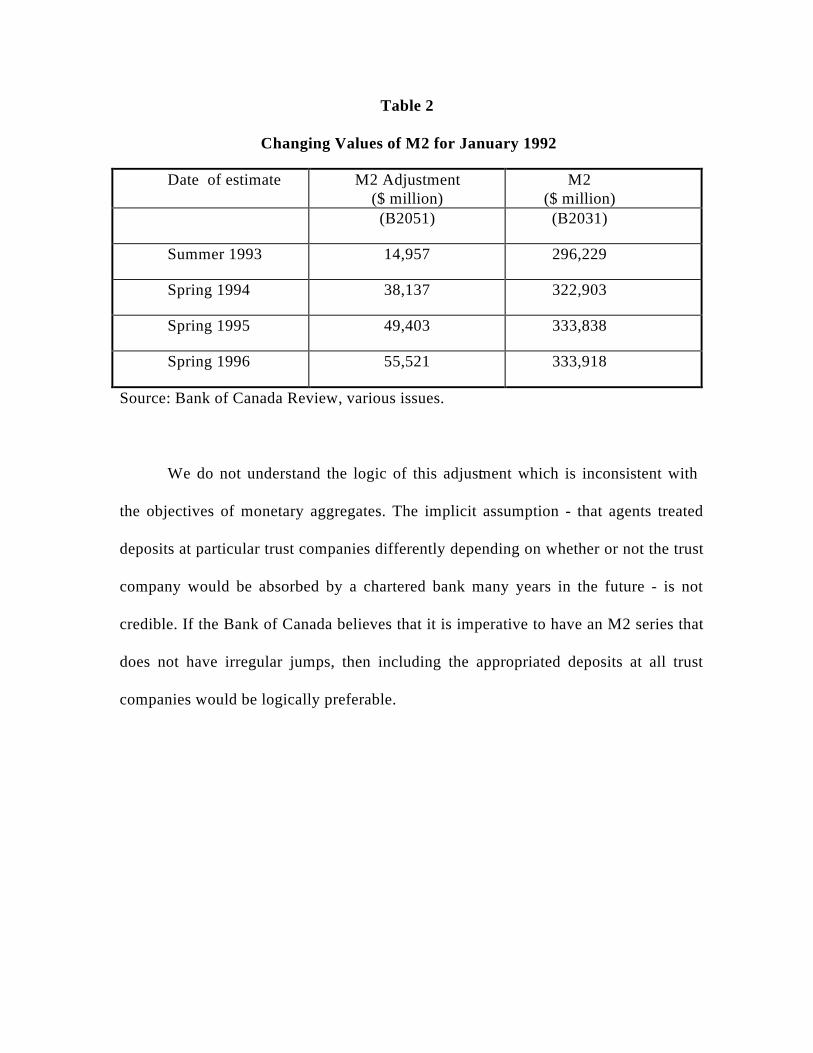
Table 2
Changing Values of M2 for January 1992
Date of estimate M2 Adjustment($ million)
M2($ million)
(B2051) (B2031)
Summer 1993 14,957 296,229
Spring 1994 38,137 322,903
Spring 1995 49,403 333,838
Spring 1996 55,521 333,918
Source: Bank of Canada Review, various issues.
We do not understand the logic of this adjustment which is inconsistent with
the objectives of monetary aggregates. The implicit assumption - that agents treated
deposits at particular trust companies differently depending on whether or not the trust
company would be absorbed by a chartered bank many years in the future - is not
credible. If the Bank of Canada believes that it is imperative to have an M2 series that
does not have irregular jumps, then including the appropriated deposits at all trust
companies would be logically preferable.
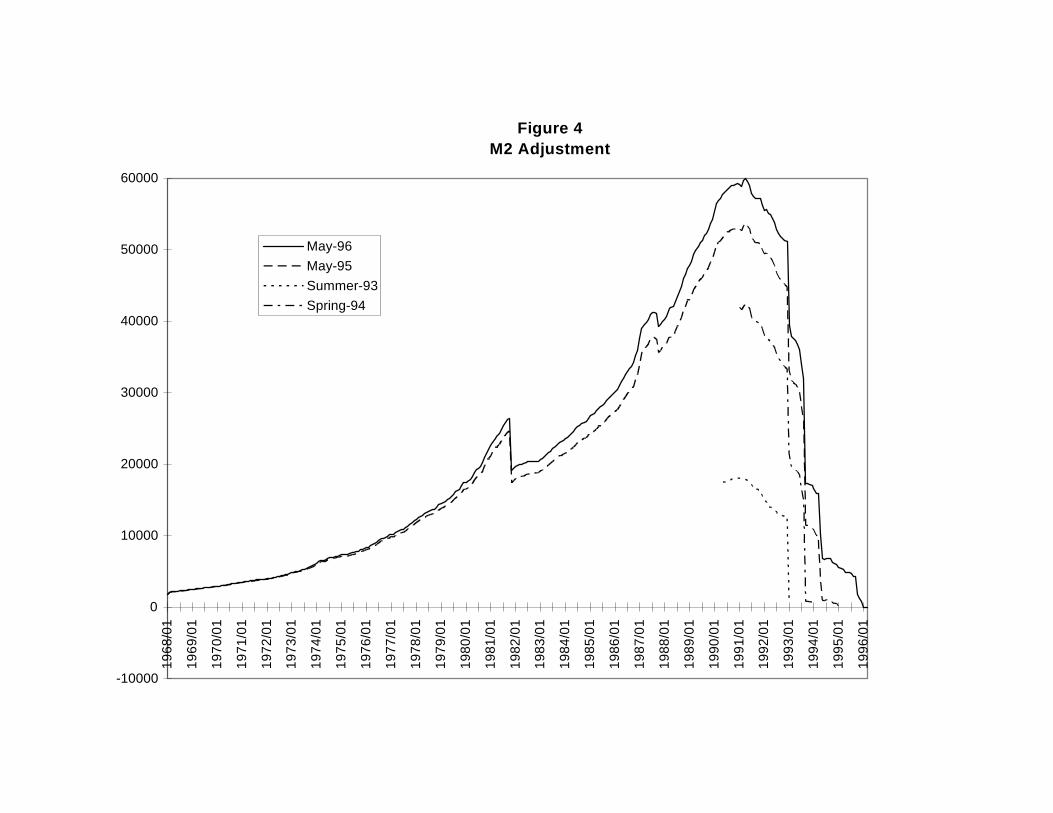
Figure 4M2 Adjustment
-10000
0
10000
20000
30000
40000
50000
60000 1
968/
01
196
9/01
197
0/01
197
1/01
197
2/01
197
3/01
197
4/01
197
5/01
197
6/01
197
7/01
197
8/01
197
9/01
198
0/01
198
1/01
198
2/01
198
3/01
198
4/01
198
5/01
198
6/01
198
7/01
198
8/01
198
9/01
199
0/01
199
1/01
199
2/01
199
3/01
199
4/01
199
5/01
199
6/01
May-96May-95Summer-93Spring-94
The major declines in the series correspond to the absorption of particular trust
and mortgage companies into the banking - and more relevantly - into the M2 series.
For example, the large declines in January 1993, September 1993 and April 1994
represent the absorption of Central Guarantee Trust by the Toronto-Dominion Bank,
the Royal Trust Company by the Royal Bank, and the Montreal Trust by the Bank of
Nova Scotia, respectively.24
The adjustments are of an order of magnitude that make them non-trivial, being
8% of M2 in January 1968 and peaking at 18.7% of M2 in July 1990. The value is
currently virtually zero. If no adjustment is made, then the link between the historical
series and the official series will be very poor, so we have constructed a proxy for the
M2 adjustment between 1953 and 1967.
The Bank of Canada was able to do the retroactive adjustments because it knew
precisely which institutions were involved, and could find reasonable monthly
estimates of the (M2 component) deposits. In the absence of such precise knowledge,
and of the ability to find quarterly (or monthly) data even if the relevant companies
were known, we have chosen to create a proxy series (as described in Section II) using
the available data on trust company growth over the period 1953-67. This however,
just shifts the poor link to an earlier date. In 1953, the M2 adjustment is about 2% of
M2, and since we do not extrapolate it backwards any further there is still a break in
the data at that time. The advantage is that it is a much smaller break, and the M2
series is reasonably continuous for the period from 1953. We include the data on our
M2 adjustment proxy series in the appendix, so that the user can subtract it out if s/he
wishes.
Today, M2 is M1 plus personal savings deposits (chequable and non-chequable
and fixed term) plus non-personal (chequable and non-chequable) notice deposits.
That is, it includes all deposits held by the general public except non-personal term
(bearer plus other fixed) deposits.25 Our M2 series includes all notice deposits from
1870 to 1952, and all personal savings deposits plus 16% of 'other notice' deposits
between 1953 and 1967 - the latter component being our best guess at the share of
non-personal term deposits in 'other notice' deposits.
The decisions we made were firstly, not to try to adjust the M2 series before 1953,
even though the breakdown into personal saving and other notice deposits begins in
1946. This decision was predicated on the desire to have a continuous series for as
long as possible, and a belief that the maximum overstatement was small. We will
necessarily have a series break in January 1953, (because of the shift from end of
month to average of weekly data, and the redefinition of all deposits at that time).
'Other notice' deposits averaged 4% of all dollar deposits between 1946 and 1952, and
if we should have excluded 84% of them (as an estimate of the share that were non-
personal term deposits) the maximum overstatement would be 3% of M2. However, it
seems unlikely that the share would have remained constant over time, so that any ad
hoc adjustment would be worse than the admitted overstatement.
The second decision was to estimate the share of non-personal notice deposits in
'other notice' deposits. We chose to make such an adjustment so that there was a
smaller break in the series in 1968. We opted for the simple ratio of non-personal
notice to total notice for the first year such data exists - 1968. This means that the 'fit'
is good in 1968, however, if the ratio was not constant, as it probably wasn't then the
adjustment is less good as we go back further in time. That said, the data to 'undo' this
adjustment are readily available on Cansim if it is especially inappropriate for a
particular purpose.
V. Monetary Base
As with M1 and M2, our definition of the monetary base is simply the
historical application of the contemporary concept. M0 consists of currency in the
hands of the public, and reserves held by the Chartered Banks. Table 3 summarizes the
historical components of reserves, as the data for currency have been presented
earlier.26 The rest of this section describes the components in Table 3 in some detail,
then discusses the currency component of the base, and finally examines the link with
the Bank of Canada's data. All data are seasonally unadjusted, and before January
1953 are end of month. Once again, we adopt the convention that '-' means
inapplicable, and Bxxx refers to Cansim identifiers.
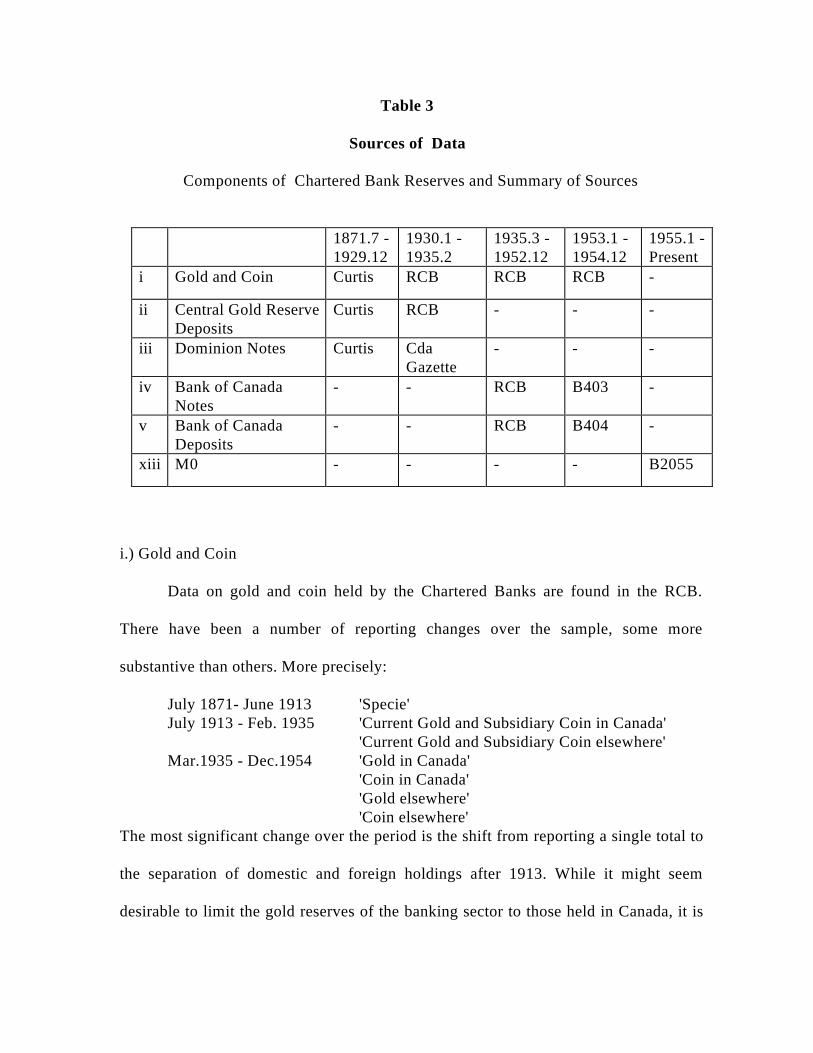
i.) Gold and Coin
Data on gold and coin held by the Chartered Banks are found in the RCB.
There have been a number of reporting changes over the sample, some more
substantive than others. More precisely:
July 1871- June 1913 'Specie'July 1913 - Feb. 1935 'Current Gold and Subsidiary Coin in Canada'
'Current Gold and Subsidiary Coin elsewhere'Mar.1935 - Dec.1954 'Gold in Canada'
'Coin in Canada''Gold elsewhere''Coin elsewhere'
The most significant change over the period is the shift from reporting a single total to
the separation of domestic and foreign holdings after 1913. While it might seem
desirable to limit the gold reserves of the banking sector to those held in Canada, it is
Table 3
Sources of Data
Components of Chartered Bank Reserves and Summary of Sources
1871.7 -1929.12
1930.1 -1935.2
1935.3 -1952.12
1953.1 -1954.12
1955.1 -Present
i Gold and Coin Curtis RCB RCB RCB -
ii Central Gold ReserveDeposits
Curtis RCB - - -
iii Dominion Notes Curtis CdaGazette
- - -
iv Bank of CanadaNotes
- - RCB B403 -
v Bank of CanadaDeposits
- - RCB B404 -
xiii M0 - - - - B2055
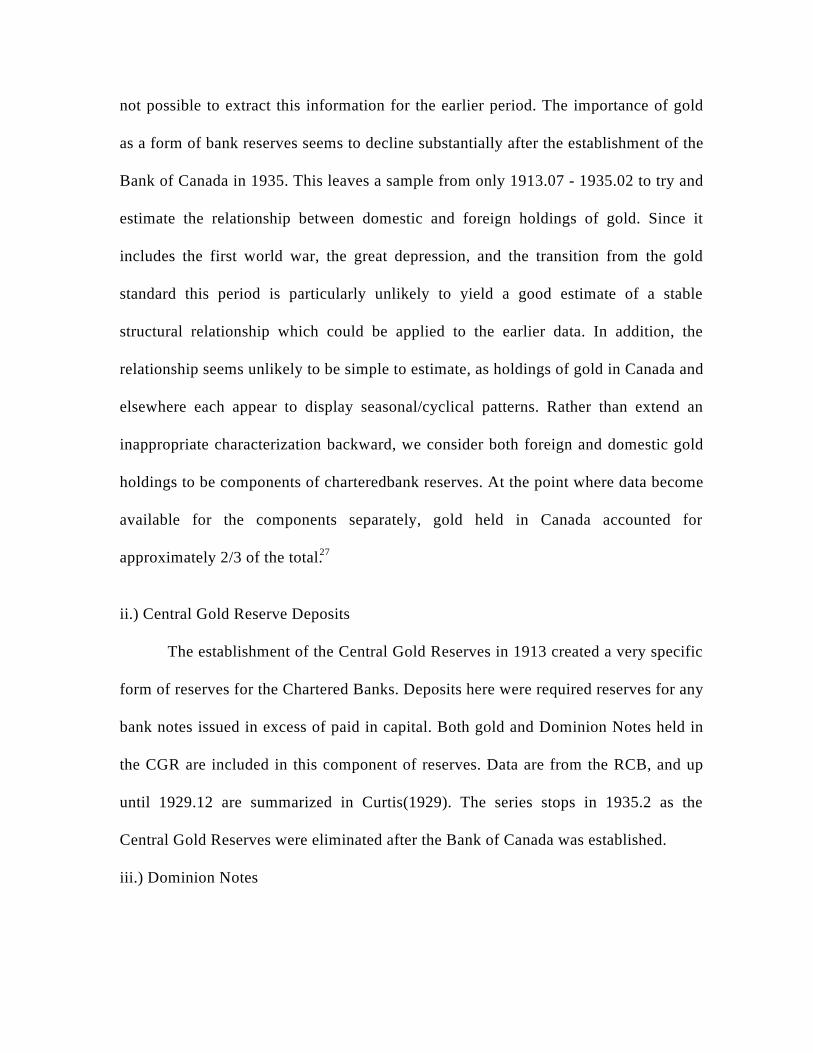
not possible to extract this information for the earlier period. The importance of gold
as a form of bank reserves seems to decline substantially after the establishment of the
Bank of Canada in 1935. This leaves a sample from only 1913.07 - 1935.02 to try and
estimate the relationship between domestic and foreign holdings of gold. Since it
includes the first world war, the great depression, and the transition from the gold
standard this period is particularly unlikely to yield a good estimate of a stable
structural relationship which could be applied to the earlier data. In addition, the
relationship seems unlikely to be simple to estimate, as holdings of gold in Canada and
elsewhere each appear to display seasonal/cyclical patterns. Rather than extend an
inappropriate characterization backward, we consider both foreign and domestic gold
holdings to be components of charteredbank reserves. At the point where data become
available for the components separately, gold held in Canada accounted for
approximately 2/3 of the total.27
ii.) Central Gold Reserve Deposits
The establishment of the Central Gold Reserves in 1913 created a very specific
form of reserves for the Chartered Banks. Deposits here were required reserves for any
bank notes issued in excess of paid in capital. Both gold and Dominion Notes held in
the CGR are included in this component of reserves. Data are from the RCB, and up
until 1929.12 are summarized in Curtis(1929). The series stops in 1935.2 as the
Central Gold Reserves were eliminated after the Bank of Canada was established.
iii.) Dominion Notes

Before the establishment of the Bank of Canada, Dominion Notes were the
main form of reserves for the Chartered Banks. Data for this series come from the
asset side of the balance sheets in the RCB. Data for the period 1871.7 - 1929.12 are
summarized in Curtis(1929).
iv.) Bank of Canada Notes
Bank of Canada notes replaced Dominion notes after the Bank's establishment
in March 1935. Chartered bank holdings of Bank of Canada notes are found in the
RCB. After 1952.12 the data we use are found in Cansim series B403. This creates a
break due to a reporting change from end of month to average of Wednesdays.
v.) Bank of Canada Deposits
Data for this series are found in the RCB up until 1952.12 after which they are
taken from series B404. Again data from the RCB are end of month observations,
while series B404 gives average of Wednesdays data.
These are the data needed to calculate the reserves of the Chartered Banks. All
that is required to complete the calculation of M0 is data for currency in the hands of
the public. The data for this series have largely been presented and discussed in earlier
sections, as publicly held currency also forms a component of M1 and M2. However,
unlike today, in the late nineteenth and early twentieth century currency in the hands
of the public was not all outside money. That is, currency in the hands of the public
included coin, Dominion notes and notes issued by chartered banks. Our currency
series excludes the latter since they are not outside money, and consists only of
Dominion / Bank of Canada notes and coin. After 1952.12 we use the series B2001,
'Currency Outside Banks, Total'.
The Bank of Canada's series for M0 is available from 1955.01, and our
monetary base series runs from 1871.7-1954.12. In looking at the link between our
series and the Bank's data, however, it is most accurate to look at the 1952.12-1953.01
gap since our M0 series for 1953-1954 is based on component data available from the
Bank and which is reported as a monthly average of Wednesdays. As nearly as we can
determine, these are the same series the Bank uses to construct its own M0 series. The
real break in M0 is located at the same point in time as for M1 and its component
series, 1952.12-1953.01. Fortunately, there are no changes in the definitions of
components of the M0 series, so we can interpret the difference between our series
and the 'Bank's' series as almost entirely due to the change in the reporting method.
This difference is very small, only 1% of the value of M0. This may be because base
money is inherently more stable over the month than the other aggregates. Since the
sampling frequency has changed, a break in the series remains which may affect
seasonal or cyclical properties.
VI. Conclusions
The long run trends in monetary aggregates have been well-known for a long
time, e.g. Bordo and Jonung (1987), yet they show up particularly starkly in Figure 1:
the boom in the early 1880s with the construction of the CPR; the basically flat
behaviour of M1 in the subsequent decade, consistent with the international Great
Deflation of the late nineteenth century; the expansion associated with the wheat boom
(1900-13) interrupted by the crisis of 1907; rapid monetary expansions during both
World Wars and the monetary contraction in between;28 the dramatic monetary
expansion of early 1958 and again in the early 1970s; the shift to M2 during the mid-
70s when M1 growth rates were targeted; and the continuing rapid growth of M2 in
the late 20th century.
Of greater significance, the monthly data provide new evidence on the behaviour
of the money supply at the cyclical and seasonal frequency. Note, for example, the
pronounced seasonal fluctuations shown in Figure 1, and the saw-tooth fluctuations
generated by the financing of World War II.29
Our data series differ from existing series in part because we produce monthly
estimates and in part because of our definition of the monetary aggregates. Bordo and
Jonung (1987) produce annual estimates for the period 1871-1986, which exclude coin
in circulation, provincial deposits and do not adjust the float for foreign currency.
However, their estimates are very close to our December estimates until 1972. The
recent Bank of Canada revisions to the M2 series not surprisingly have led to large
differences (20%) between the Bordo and Jonung series, and the official series. Rich
(1994) produced quarterly M2 estimates for 1900-13, which again are close to our
estimates, although he does not include an estimate of coin in the hands of the public.
We end with some caveats. Anyone using these data are reminded that collection
methods changed in December 1952 / January 1953. The change included a
redefinition of the term 'demand deposit'; a change in the sampling frequency; and the
exclusion of estimated non-personal term deposits from M2. Furthermore, the M2
series has an additional break in December 1967 / January 1968 reflecting changing
components of the aggregate.
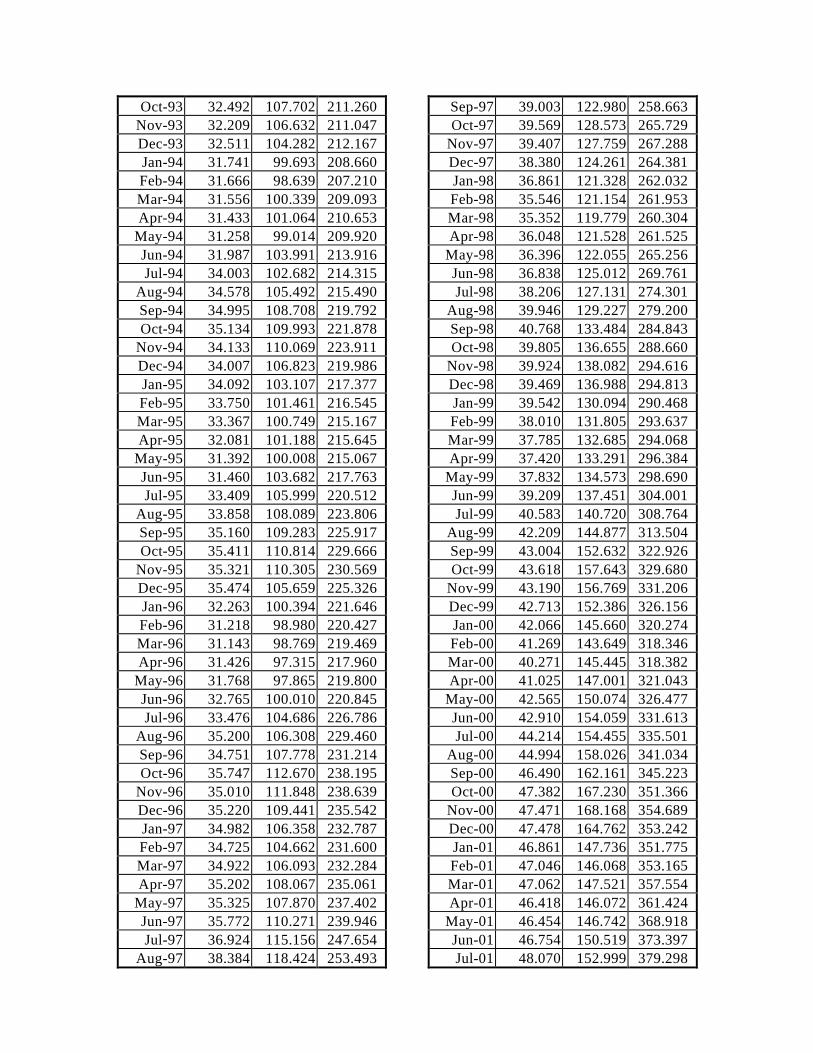
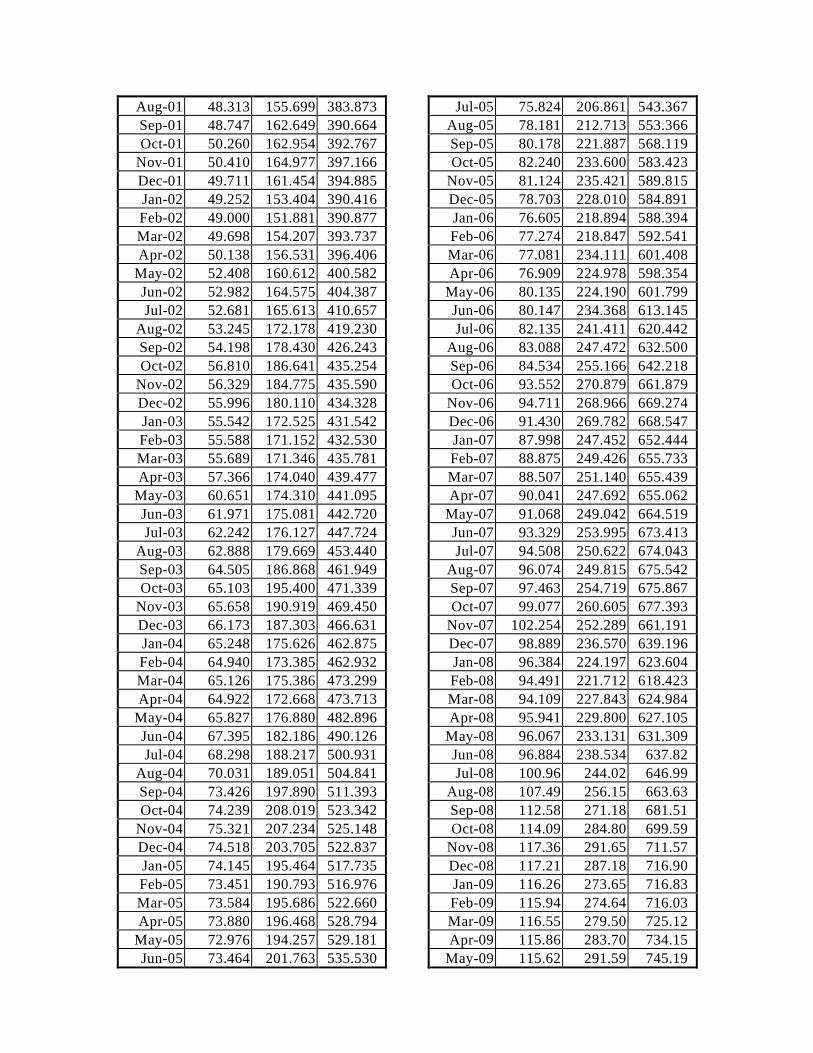
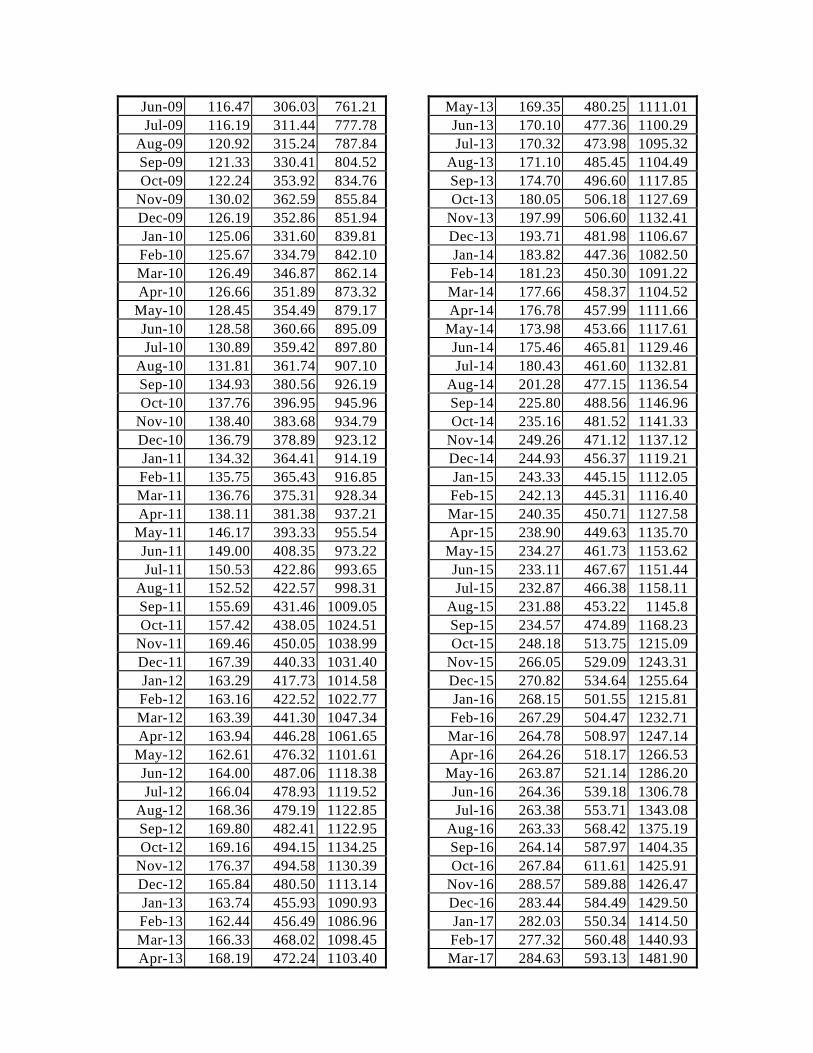
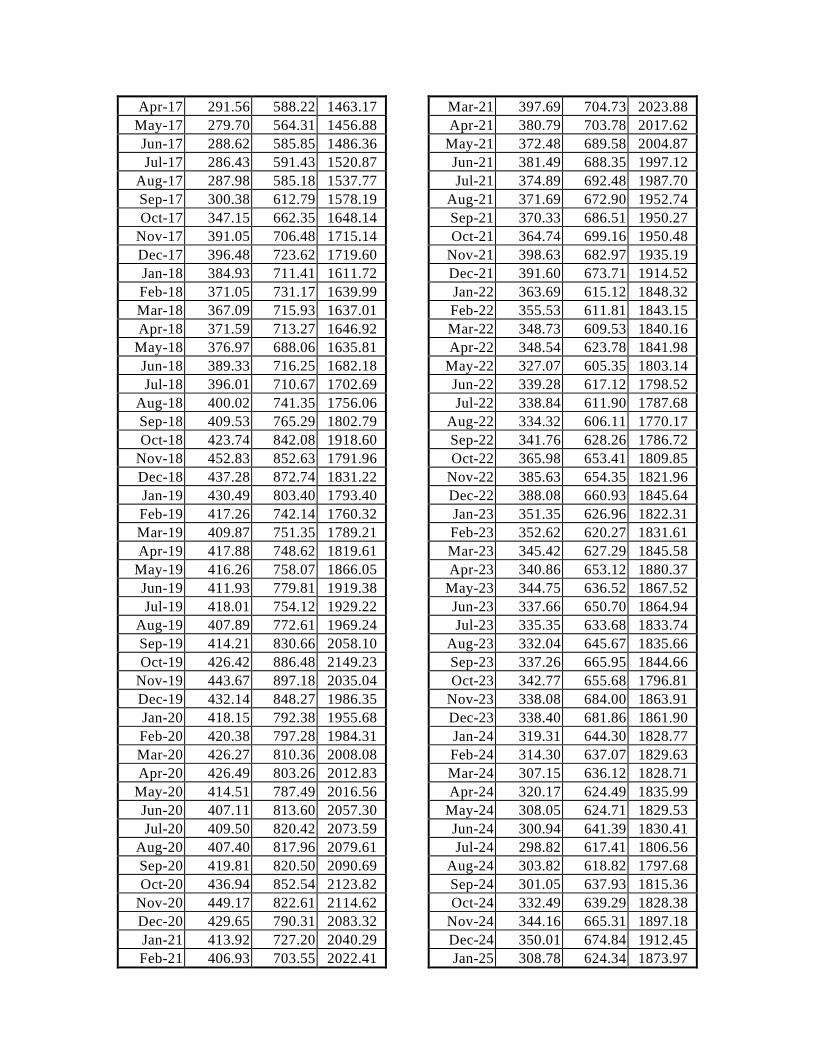
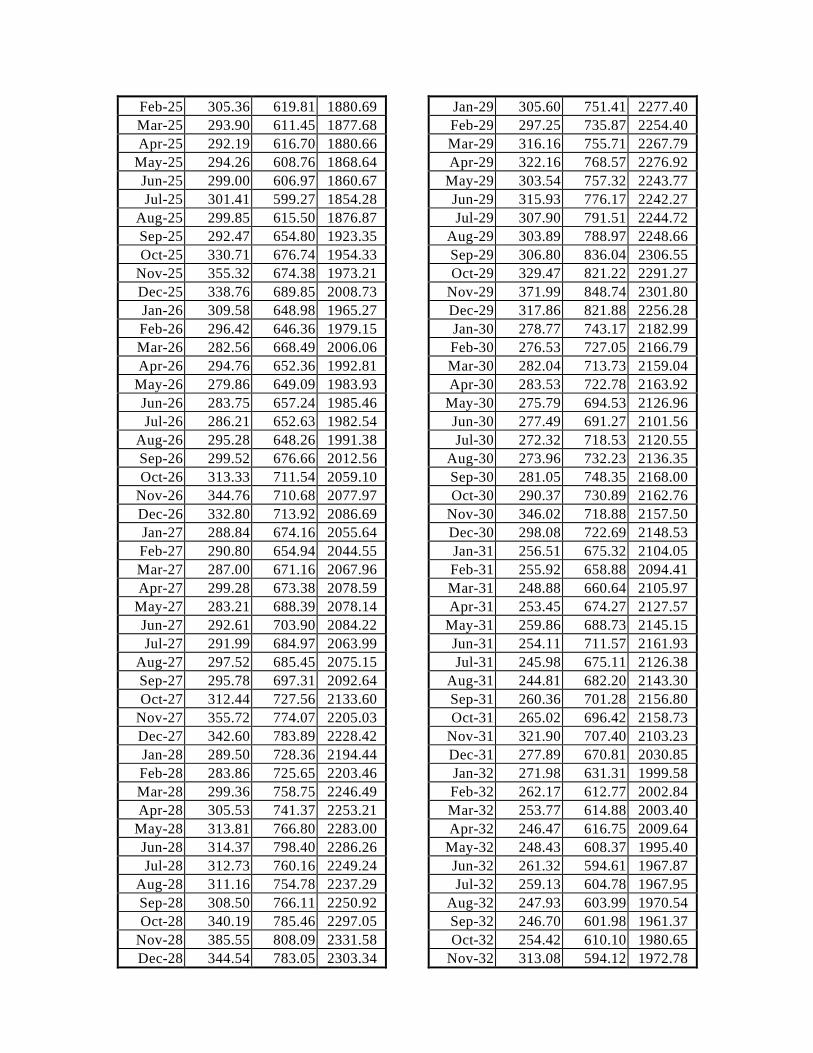
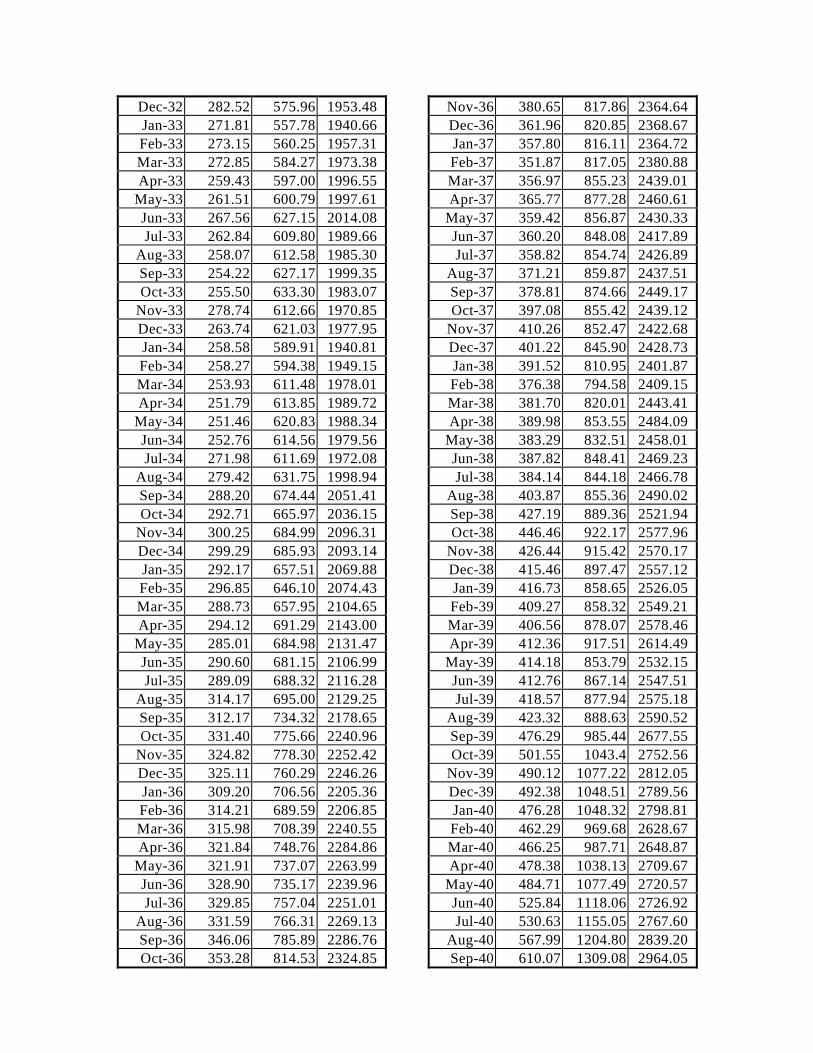
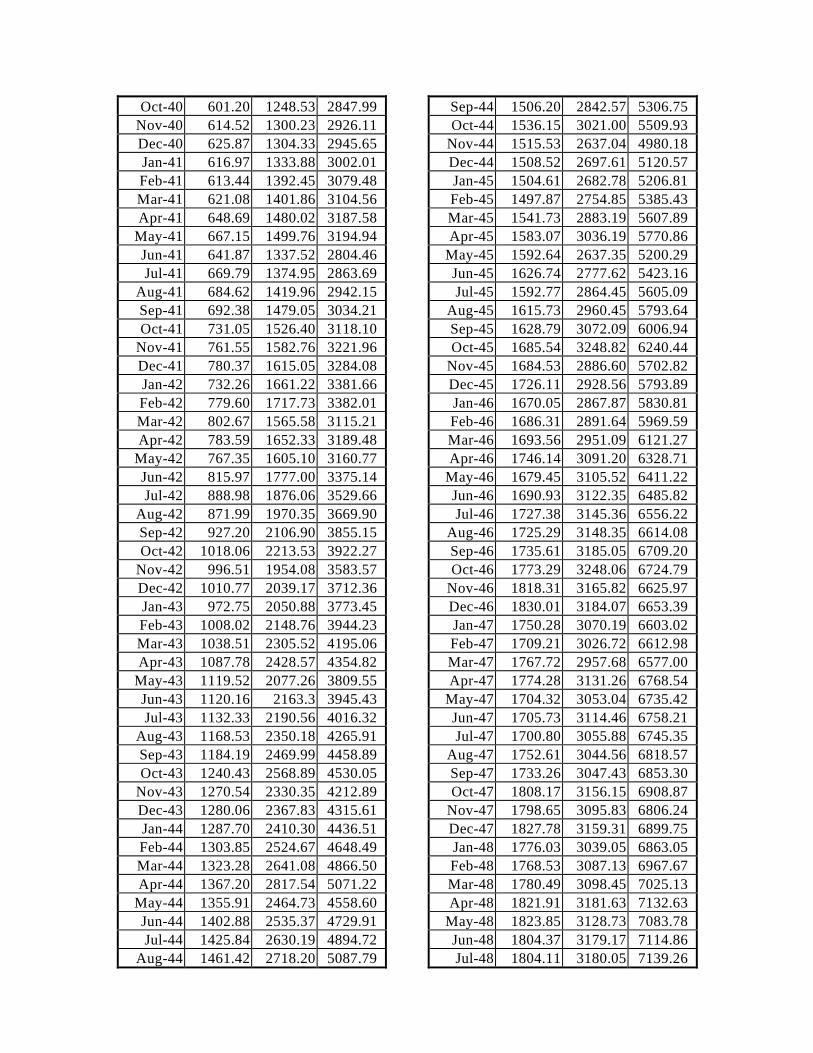
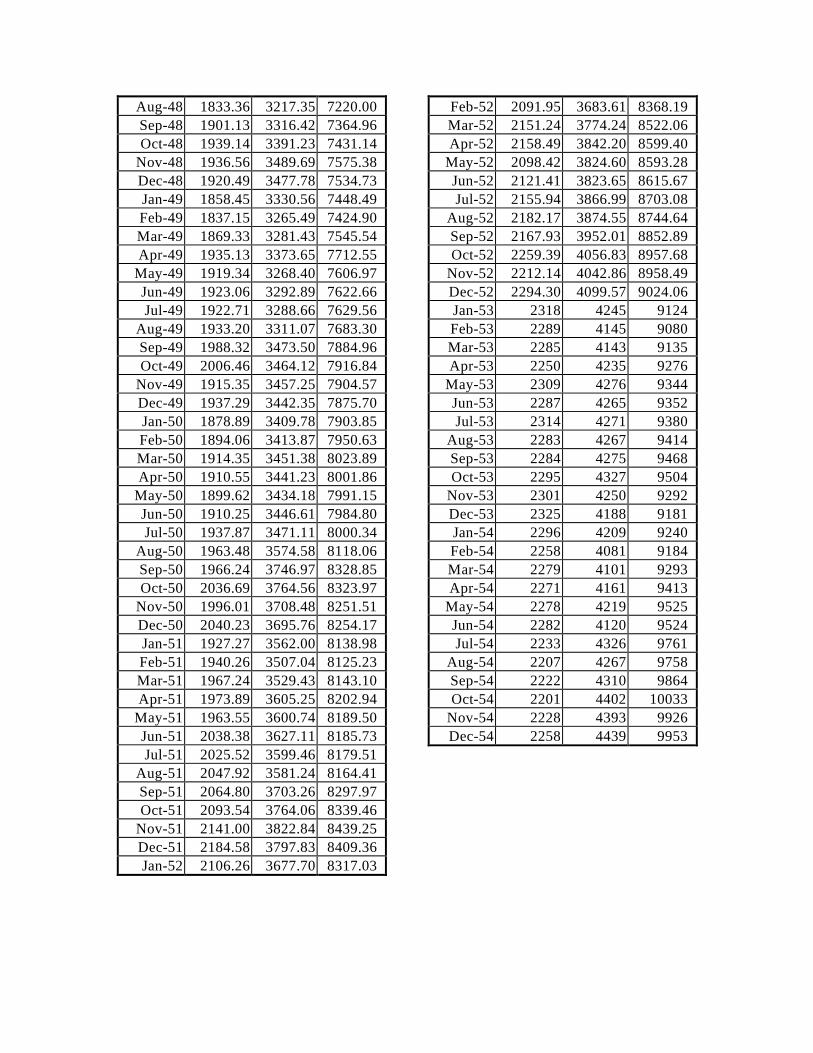
Appendix
The data series for M0, M1 and M2 and the following components will be available onthe Canadian economic history home page:
http://www.arts.ubc.ca/arts/cliocan/clionet.html
Monetary Aggregates:
Column 1 Year (1871.7-1996.4)Column 2 M0 (1871.7-1996.4)Column 3 M1 (1871.7-1996.4)Column 4 M2 (1871.7-1996.4)
Components of monetary aggregates:
Column 1 Year (1871.7 - 1967.12)Column 2 Coin in hands of the public (1871.7 - 1952.12)Column 3 Chartered bank notes in the hands of the public - gross (1871.7 - 1949.12)Column 4 Dominion notes (1871.7 -1935.2) and Bank of Canada notes in the hands ofthe public (1935.3 - 1952.12)Column 5 Demand deposits - gross (1871.7 - 1952.12)Column 6 Provincial deposits (1871.7 - 1952.12)Column 7 Float (1871.7-1952.12)Column 8 Notice deposits (1871.7 - 1945.12)Column 9 Personal savings (1946.1 - 1967.12)Column 10 Other notice deposits (1946.1-1952.12); 16% of ‘other term and notice
deposits’ (1953.1 - 1967.12)Column 11 M2 adjustment factor estimate - (1953.1 - 1967.12)Column 12 Note float (1871.7 - 1944.12)Column 13 Deposit float (1871.7 - 1952.12)Column 14 Chartered Bank holdings of gold and coin in Canada (1871.7-1954.12) /
including elsewhere before 1913.07.Column 15 Chartered Bank holdings of gold and coin elsewhere (1913.07-1954.12)Column 16 Chartered Bank deposits in the Central Gold Reserves (1913.11-1935.2) /
Bank of Canada deposits (1935.3-1952.12)Column 17 Chartered Bank holdings of Dominion Notes (1871.7-1935.2) / Bank of Canada notes (1935.3-1952.12)
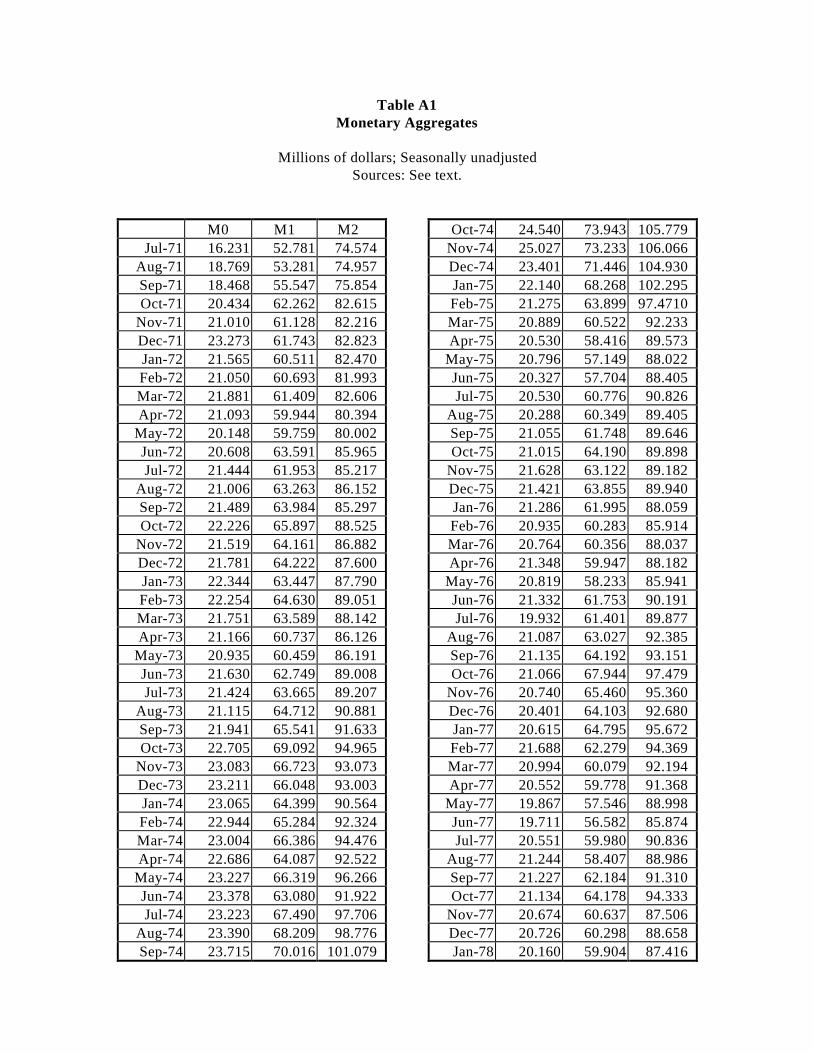
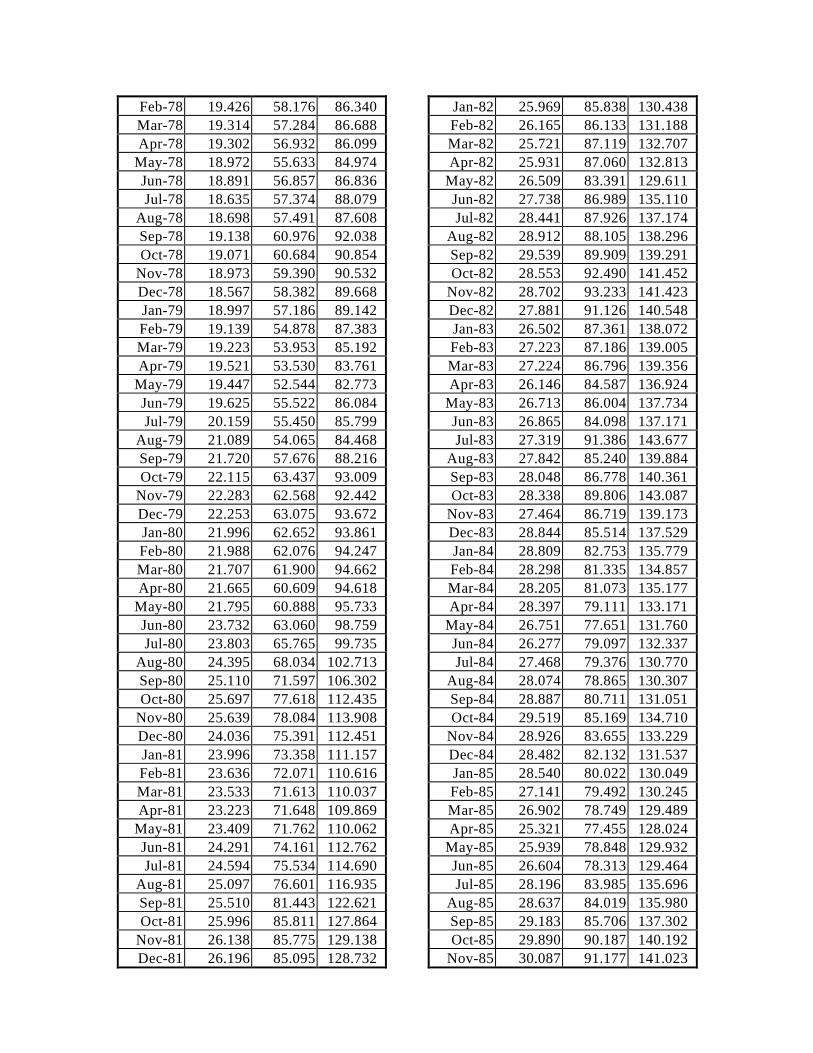
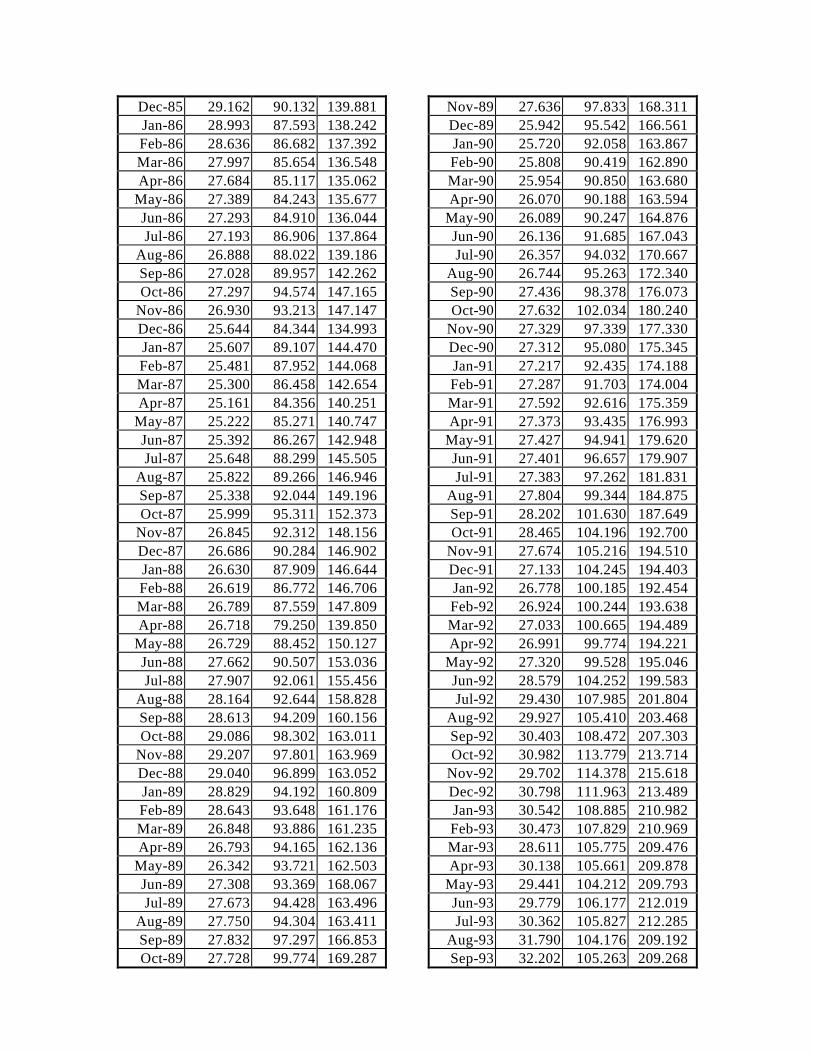
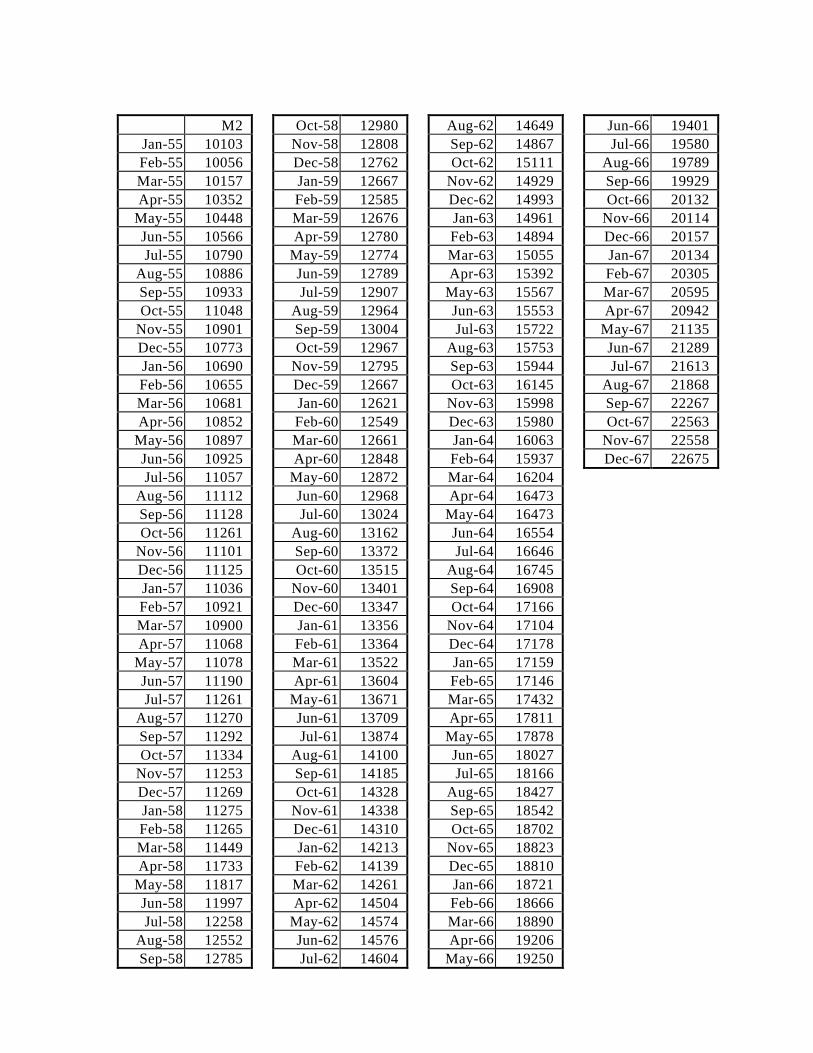
Table A1Monetary Aggregates
Millions of dollars; Seasonally unadjustedSources: See text.
M0 M1 M2Jul-71 16.231 52.781 74.574
Aug-71 18.769 53.281 74.957Sep-71 18.468 55.547 75.854Oct-71 20.434 62.262 82.615
Nov-71 21.010 61.128 82.216Dec-71 23.273 61.743 82.823Jan-72 21.565 60.511 82.470Feb-72 21.050 60.693 81.993Mar-72 21.881 61.409 82.606Apr-72 21.093 59.944 80.394
May-72 20.148 59.759 80.002Jun-72 20.608 63.591 85.965Jul-72 21.444 61.953 85.217
Aug-72 21.006 63.263 86.152Sep-72 21.489 63.984 85.297Oct-72 22.226 65.897 88.525
Nov-72 21.519 64.161 86.882Dec-72 21.781 64.222 87.600Jan-73 22.344 63.447 87.790Feb-73 22.254 64.630 89.051Mar-73 21.751 63.589 88.142Apr-73 21.166 60.737 86.126
May-73 20.935 60.459 86.191Jun-73 21.630 62.749 89.008Jul-73 21.424 63.665 89.207
Aug-73 21.115 64.712 90.881Sep-73 21.941 65.541 91.633Oct-73 22.705 69.092 94.965
Nov-73 23.083 66.723 93.073Dec-73 23.211 66.048 93.003Jan-74 23.065 64.399 90.564Feb-74 22.944 65.284 92.324Mar-74 23.004 66.386 94.476Apr-74 22.686 64.087 92.522
May-74 23.227 66.319 96.266Jun-74 23.378 63.080 91.922Jul-74 23.223 67.490 97.706
Aug-74 23.390 68.209 98.776Sep-74 23.715 70.016 101.079
Oct-74 24.540 73.943 105.779Nov-74 25.027 73.233 106.066Dec-74 23.401 71.446 104.930Jan-75 22.140 68.268 102.295Feb-75 21.275 63.899 97.4710Mar-75 20.889 60.522 92.233Apr-75 20.530 58.416 89.573
May-75 20.796 57.149 88.022Jun-75 20.327 57.704 88.405Jul-75 20.530 60.776 90.826
Aug-75 20.288 60.349 89.405Sep-75 21.055 61.748 89.646Oct-75 21.015 64.190 89.898
Nov-75 21.628 63.122 89.182Dec-75 21.421 63.855 89.940Jan-76 21.286 61.995 88.059Feb-76 20.935 60.283 85.914Mar-76 20.764 60.356 88.037Apr-76 21.348 59.947 88.182
May-76 20.819 58.233 85.941Jun-76 21.332 61.753 90.191Jul-76 19.932 61.401 89.877
Aug-76 21.087 63.027 92.385Sep-76 21.135 64.192 93.151Oct-76 21.066 67.944 97.479
Nov-76 20.740 65.460 95.360Dec-76 20.401 64.103 92.680Jan-77 20.615 64.795 95.672Feb-77 21.688 62.279 94.369Mar-77 20.994 60.079 92.194Apr-77 20.552 59.778 91.368
May-77 19.867 57.546 88.998Jun-77 19.711 56.582 85.874Jul-77 20.551 59.980 90.836
Aug-77 21.244 58.407 88.986Sep-77 21.227 62.184 91.310Oct-77 21.134 64.178 94.333
Nov-77 20.674 60.637 87.506Dec-77 20.726 60.298 88.658Jan-78 20.160 59.904 87.416
Feb-78 19.426 58.176 86.340Mar-78 19.314 57.284 86.688Apr-78 19.302 56.932 86.099
May-78 18.972 55.633 84.974Jun-78 18.891 56.857 86.836Jul-78 18.635 57.374 88.079
Aug-78 18.698 57.491 87.608Sep-78 19.138 60.976 92.038Oct-78 19.071 60.684 90.854
Nov-78 18.973 59.390 90.532Dec-78 18.567 58.382 89.668Jan-79 18.997 57.186 89.142Feb-79 19.139 54.878 87.383Mar-79 19.223 53.953 85.192Apr-79 19.521 53.530 83.761
May-79 19.447 52.544 82.773Jun-79 19.625 55.522 86.084Jul-79 20.159 55.450 85.799
Aug-79 21.089 54.065 84.468Sep-79 21.720 57.676 88.216Oct-79 22.115 63.437 93.009
Nov-79 22.283 62.568 92.442Dec-79 22.253 63.075 93.672Jan-80 21.996 62.652 93.861Feb-80 21.988 62.076 94.247Mar-80 21.707 61.900 94.662Apr-80 21.665 60.609 94.618
May-80 21.795 60.888 95.733Jun-80 23.732 63.060 98.759Jul-80 23.803 65.765 99.735
Aug-80 24.395 68.034 102.713Sep-80 25.110 71.597 106.302Oct-80 25.697 77.618 112.435
Nov-80 25.639 78.084 113.908Dec-80 24.036 75.391 112.451Jan-81 23.996 73.358 111.157Feb-81 23.636 72.071 110.616Mar-81 23.533 71.613 110.037Apr-81 23.223 71.648 109.869
May-81 23.409 71.762 110.062Jun-81 24.291 74.161 112.762Jul-81 24.594 75.534 114.690
Aug-81 25.097 76.601 116.935Sep-81 25.510 81.443 122.621Oct-81 25.996 85.811 127.864
Nov-81 26.138 85.775 129.138Dec-81 26.196 85.095 128.732
Jan-82 25.969 85.838 130.438Feb-82 26.165 86.133 131.188Mar-82 25.721 87.119 132.707Apr-82 25.931 87.060 132.813
May-82 26.509 83.391 129.611Jun-82 27.738 86.989 135.110Jul-82 28.441 87.926 137.174
Aug-82 28.912 88.105 138.296Sep-82 29.539 89.909 139.291Oct-82 28.553 92.490 141.452
Nov-82 28.702 93.233 141.423Dec-82 27.881 91.126 140.548Jan-83 26.502 87.361 138.072Feb-83 27.223 87.186 139.005Mar-83 27.224 86.796 139.356Apr-83 26.146 84.587 136.924
May-83 26.713 86.004 137.734Jun-83 26.865 84.098 137.171Jul-83 27.319 91.386 143.677
Aug-83 27.842 85.240 139.884Sep-83 28.048 86.778 140.361Oct-83 28.338 89.806 143.087
Nov-83 27.464 86.719 139.173Dec-83 28.844 85.514 137.529Jan-84 28.809 82.753 135.779Feb-84 28.298 81.335 134.857Mar-84 28.205 81.073 135.177Apr-84 28.397 79.111 133.171
May-84 26.751 77.651 131.760Jun-84 26.277 79.097 132.337Jul-84 27.468 79.376 130.770
Aug-84 28.074 78.865 130.307Sep-84 28.887 80.711 131.051Oct-84 29.519 85.169 134.710
Nov-84 28.926 83.655 133.229Dec-84 28.482 82.132 131.537Jan-85 28.540 80.022 130.049Feb-85 27.141 79.492 130.245Mar-85 26.902 78.749 129.489Apr-85 25.321 77.455 128.024
May-85 25.939 78.848 129.932Jun-85 26.604 78.313 129.464Jul-85 28.196 83.985 135.696
Aug-85 28.637 84.019 135.980Sep-85 29.183 85.706 137.302Oct-85 29.890 90.187 140.192
Nov-85 30.087 91.177 141.023
Dec-85 29.162 90.132 139.881Jan-86 28.993 87.593 138.242Feb-86 28.636 86.682 137.392Mar-86 27.997 85.654 136.548Apr-86 27.684 85.117 135.062
May-86 27.389 84.243 135.677Jun-86 27.293 84.910 136.044Jul-86 27.193 86.906 137.864
Aug-86 26.888 88.022 139.186Sep-86 27.028 89.957 142.262Oct-86 27.297 94.574 147.165
Nov-86 26.930 93.213 147.147Dec-86 25.644 84.344 134.993Jan-87 25.607 89.107 144.470Feb-87 25.481 87.952 144.068Mar-87 25.300 86.458 142.654Apr-87 25.161 84.356 140.251
May-87 25.222 85.271 140.747Jun-87 25.392 86.267 142.948Jul-87 25.648 88.299 145.505
Aug-87 25.822 89.266 146.946Sep-87 25.338 92.044 149.196Oct-87 25.999 95.311 152.373
Nov-87 26.845 92.312 148.156Dec-87 26.686 90.284 146.902Jan-88 26.630 87.909 146.644Feb-88 26.619 86.772 146.706Mar-88 26.789 87.559 147.809Apr-88 26.718 79.250 139.850
May-88 26.729 88.452 150.127Jun-88 27.662 90.507 153.036Jul-88 27.907 92.061 155.456
Aug-88 28.164 92.644 158.828Sep-88 28.613 94.209 160.156Oct-88 29.086 98.302 163.011
Nov-88 29.207 97.801 163.969Dec-88 29.040 96.899 163.052Jan-89 28.829 94.192 160.809Feb-89 28.643 93.648 161.176Mar-89 26.848 93.886 161.235Apr-89 26.793 94.165 162.136
May-89 26.342 93.721 162.503Jun-89 27.308 93.369 168.067Jul-89 27.673 94.428 163.496
Aug-89 27.750 94.304 163.411Sep-89 27.832 97.297 166.853Oct-89 27.728 99.774 169.287
Nov-89 27.636 97.833 168.311Dec-89 25.942 95.542 166.561Jan-90 25.720 92.058 163.867Feb-90 25.808 90.419 162.890Mar-90 25.954 90.850 163.680Apr-90 26.070 90.188 163.594
May-90 26.089 90.247 164.876Jun-90 26.136 91.685 167.043Jul-90 26.357 94.032 170.667
Aug-90 26.744 95.263 172.340Sep-90 27.436 98.378 176.073Oct-90 27.632 102.034 180.240
Nov-90 27.329 97.339 177.330Dec-90 27.312 95.080 175.345Jan-91 27.217 92.435 174.188Feb-91 27.287 91.703 174.004Mar-91 27.592 92.616 175.359Apr-91 27.373 93.435 176.993
May-91 27.427 94.941 179.620Jun-91 27.401 96.657 179.907Jul-91 27.383 97.262 181.831
Aug-91 27.804 99.344 184.875Sep-91 28.202 101.630 187.649Oct-91 28.465 104.196 192.700
Nov-91 27.674 105.216 194.510Dec-91 27.133 104.245 194.403Jan-92 26.778 100.185 192.454Feb-92 26.924 100.244 193.638Mar-92 27.033 100.665 194.489Apr-92 26.991 99.774 194.221
May-92 27.320 99.528 195.046Jun-92 28.579 104.252 199.583Jul-92 29.430 107.985 201.804
Aug-92 29.927 105.410 203.468Sep-92 30.403 108.472 207.303Oct-92 30.982 113.779 213.714
Nov-92 29.702 114.378 215.618Dec-92 30.798 111.963 213.489Jan-93 30.542 108.885 210.982Feb-93 30.473 107.829 210.969Mar-93 28.611 105.775 209.476Apr-93 30.138 105.661 209.878
May-93 29.441 104.212 209.793Jun-93 29.779 106.177 212.019Jul-93 30.362 105.827 212.285
Aug-93 31.790 104.176 209.192Sep-93 32.202 105.263 209.268
Oct-93 32.492 107.702 211.260Nov-93 32.209 106.632 211.047Dec-93 32.511 104.282 212.167Jan-94 31.741 99.693 208.660Feb-94 31.666 98.639 207.210Mar-94 31.556 100.339 209.093Apr-94 31.433 101.064 210.653
May-94 31.258 99.014 209.920Jun-94 31.987 103.991 213.916Jul-94 34.003 102.682 214.315
Aug-94 34.578 105.492 215.490Sep-94 34.995 108.708 219.792Oct-94 35.134 109.993 221.878
Nov-94 34.133 110.069 223.911Dec-94 34.007 106.823 219.986Jan-95 34.092 103.107 217.377Feb-95 33.750 101.461 216.545Mar-95 33.367 100.749 215.167Apr-95 32.081 101.188 215.645
May-95 31.392 100.008 215.067Jun-95 31.460 103.682 217.763Jul-95 33.409 105.999 220.512
Aug-95 33.858 108.089 223.806Sep-95 35.160 109.283 225.917Oct-95 35.411 110.814 229.666
Nov-95 35.321 110.305 230.569Dec-95 35.474 105.659 225.326Jan-96 32.263 100.394 221.646Feb-96 31.218 98.980 220.427Mar-96 31.143 98.769 219.469Apr-96 31.426 97.315 217.960
May-96 31.768 97.865 219.800Jun-96 32.765 100.010 220.845Jul-96 33.476 104.686 226.786
Aug-96 35.200 106.308 229.460Sep-96 34.751 107.778 231.214Oct-96 35.747 112.670 238.195
Nov-96 35.010 111.848 238.639Dec-96 35.220 109.441 235.542Jan-97 34.982 106.358 232.787Feb-97 34.725 104.662 231.600Mar-97 34.922 106.093 232.284Apr-97 35.202 108.067 235.061
May-97 35.325 107.870 237.402Jun-97 35.772 110.271 239.946Jul-97 36.924 115.156 247.654
Aug-97 38.384 118.424 253.493
Sep-97 39.003 122.980 258.663Oct-97 39.569 128.573 265.729
Nov-97 39.407 127.759 267.288Dec-97 38.380 124.261 264.381Jan-98 36.861 121.328 262.032Feb-98 35.546 121.154 261.953Mar-98 35.352 119.779 260.304Apr-98 36.048 121.528 261.525
May-98 36.396 122.055 265.256Jun-98 36.838 125.012 269.761Jul-98 38.206 127.131 274.301
Aug-98 39.946 129.227 279.200Sep-98 40.768 133.484 284.843Oct-98 39.805 136.655 288.660
Nov-98 39.924 138.082 294.616Dec-98 39.469 136.988 294.813Jan-99 39.542 130.094 290.468Feb-99 38.010 131.805 293.637Mar-99 37.785 132.685 294.068Apr-99 37.420 133.291 296.384
May-99 37.832 134.573 298.690Jun-99 39.209 137.451 304.001Jul-99 40.583 140.720 308.764
Aug-99 42.209 144.877 313.504Sep-99 43.004 152.632 322.926Oct-99 43.618 157.643 329.680
Nov-99 43.190 156.769 331.206Dec-99 42.713 152.386 326.156Jan-00 42.066 145.660 320.274Feb-00 41.269 143.649 318.346Mar-00 40.271 145.445 318.382Apr-00 41.025 147.001 321.043
May-00 42.565 150.074 326.477Jun-00 42.910 154.059 331.613Jul-00 44.214 154.455 335.501
Aug-00 44.994 158.026 341.034Sep-00 46.490 162.161 345.223Oct-00 47.382 167.230 351.366
Nov-00 47.471 168.168 354.689Dec-00 47.478 164.762 353.242Jan-01 46.861 147.736 351.775Feb-01 47.046 146.068 353.165Mar-01 47.062 147.521 357.554Apr-01 46.418 146.072 361.424
May-01 46.454 146.742 368.918Jun-01 46.754 150.519 373.397Jul-01 48.070 152.999 379.298
Aug-01 48.313 155.699 383.873Sep-01 48.747 162.649 390.664Oct-01 50.260 162.954 392.767
Nov-01 50.410 164.977 397.166Dec-01 49.711 161.454 394.885Jan-02 49.252 153.404 390.416Feb-02 49.000 151.881 390.877Mar-02 49.698 154.207 393.737Apr-02 50.138 156.531 396.406
May-02 52.408 160.612 400.582Jun-02 52.982 164.575 404.387Jul-02 52.681 165.613 410.657
Aug-02 53.245 172.178 419.230Sep-02 54.198 178.430 426.243Oct-02 56.810 186.641 435.254
Nov-02 56.329 184.775 435.590Dec-02 55.996 180.110 434.328Jan-03 55.542 172.525 431.542Feb-03 55.588 171.152 432.530Mar-03 55.689 171.346 435.781Apr-03 57.366 174.040 439.477
May-03 60.651 174.310 441.095Jun-03 61.971 175.081 442.720Jul-03 62.242 176.127 447.724
Aug-03 62.888 179.669 453.440Sep-03 64.505 186.868 461.949Oct-03 65.103 195.400 471.339
Nov-03 65.658 190.919 469.450Dec-03 66.173 187.303 466.631Jan-04 65.248 175.626 462.875Feb-04 64.940 173.385 462.932Mar-04 65.126 175.386 473.299Apr-04 64.922 172.668 473.713
May-04 65.827 176.880 482.896Jun-04 67.395 182.186 490.126Jul-04 68.298 188.217 500.931
Aug-04 70.031 189.051 504.841Sep-04 73.426 197.890 511.393Oct-04 74.239 208.019 523.342
Nov-04 75.321 207.234 525.148Dec-04 74.518 203.705 522.837Jan-05 74.145 195.464 517.735Feb-05 73.451 190.793 516.976Mar-05 73.584 195.686 522.660Apr-05 73.880 196.468 528.794
May-05 72.976 194.257 529.181Jun-05 73.464 201.763 535.530
Jul-05 75.824 206.861 543.367Aug-05 78.181 212.713 553.366Sep-05 80.178 221.887 568.119Oct-05 82.240 233.600 583.423
Nov-05 81.124 235.421 589.815Dec-05 78.703 228.010 584.891Jan-06 76.605 218.894 588.394Feb-06 77.274 218.847 592.541Mar-06 77.081 234.111 601.408Apr-06 76.909 224.978 598.354
May-06 80.135 224.190 601.799Jun-06 80.147 234.368 613.145Jul-06 82.135 241.411 620.442
Aug-06 83.088 247.472 632.500Sep-06 84.534 255.166 642.218Oct-06 93.552 270.879 661.879
Nov-06 94.711 268.966 669.274Dec-06 91.430 269.782 668.547Jan-07 87.998 247.452 652.444Feb-07 88.875 249.426 655.733Mar-07 88.507 251.140 655.439Apr-07 90.041 247.692 655.062
May-07 91.068 249.042 664.519Jun-07 93.329 253.995 673.413Jul-07 94.508 250.622 674.043
Aug-07 96.074 249.815 675.542Sep-07 97.463 254.719 675.867Oct-07 99.077 260.605 677.393
Nov-07 102.254 252.289 661.191Dec-07 98.889 236.570 639.196Jan-08 96.384 224.197 623.604Feb-08 94.491 221.712 618.423Mar-08 94.109 227.843 624.984Apr-08 95.941 229.800 627.105
May-08 96.067 233.131 631.309Jun-08 96.884 238.534 637.82Jul-08 100.96 244.02 646.99
Aug-08 107.49 256.15 663.63Sep-08 112.58 271.18 681.51Oct-08 114.09 284.80 699.59
Nov-08 117.36 291.65 711.57Dec-08 117.21 287.18 716.90Jan-09 116.26 273.65 716.83Feb-09 115.94 274.64 716.03Mar-09 116.55 279.50 725.12Apr-09 115.86 283.70 734.15
May-09 115.62 291.59 745.19
Jun-09 116.47 306.03 761.21Jul-09 116.19 311.44 777.78
Aug-09 120.92 315.24 787.84Sep-09 121.33 330.41 804.52Oct-09 122.24 353.92 834.76
Nov-09 130.02 362.59 855.84Dec-09 126.19 352.86 851.94Jan-10 125.06 331.60 839.81Feb-10 125.67 334.79 842.10Mar-10 126.49 346.87 862.14Apr-10 126.66 351.89 873.32
May-10 128.45 354.49 879.17Jun-10 128.58 360.66 895.09Jul-10 130.89 359.42 897.80
Aug-10 131.81 361.74 907.10Sep-10 134.93 380.56 926.19Oct-10 137.76 396.95 945.96
Nov-10 138.40 383.68 934.79Dec-10 136.79 378.89 923.12Jan-11 134.32 364.41 914.19Feb-11 135.75 365.43 916.85Mar-11 136.76 375.31 928.34Apr-11 138.11 381.38 937.21
May-11 146.17 393.33 955.54Jun-11 149.00 408.35 973.22Jul-11 150.53 422.86 993.65
Aug-11 152.52 422.57 998.31Sep-11 155.69 431.46 1009.05Oct-11 157.42 438.05 1024.51
Nov-11 169.46 450.05 1038.99Dec-11 167.39 440.33 1031.40Jan-12 163.29 417.73 1014.58Feb-12 163.16 422.52 1022.77Mar-12 163.39 441.30 1047.34Apr-12 163.94 446.28 1061.65
May-12 162.61 476.32 1101.61Jun-12 164.00 487.06 1118.38Jul-12 166.04 478.93 1119.52
Aug-12 168.36 479.19 1122.85Sep-12 169.80 482.41 1122.95Oct-12 169.16 494.15 1134.25
Nov-12 176.37 494.58 1130.39Dec-12 165.84 480.50 1113.14Jan-13 163.74 455.93 1090.93Feb-13 162.44 456.49 1086.96Mar-13 166.33 468.02 1098.45Apr-13 168.19 472.24 1103.40
May-13 169.35 480.25 1111.01Jun-13 170.10 477.36 1100.29Jul-13 170.32 473.98 1095.32
Aug-13 171.10 485.45 1104.49Sep-13 174.70 496.60 1117.85Oct-13 180.05 506.18 1127.69
Nov-13 197.99 506.60 1132.41Dec-13 193.71 481.98 1106.67Jan-14 183.82 447.36 1082.50Feb-14 181.23 450.30 1091.22Mar-14 177.66 458.37 1104.52Apr-14 176.78 457.99 1111.66
May-14 173.98 453.66 1117.61Jun-14 175.46 465.81 1129.46Jul-14 180.43 461.60 1132.81
Aug-14 201.28 477.15 1136.54Sep-14 225.80 488.56 1146.96Oct-14 235.16 481.52 1141.33
Nov-14 249.26 471.12 1137.12Dec-14 244.93 456.37 1119.21Jan-15 243.33 445.15 1112.05Feb-15 242.13 445.31 1116.40Mar-15 240.35 450.71 1127.58Apr-15 238.90 449.63 1135.70
May-15 234.27 461.73 1153.62Jun-15 233.11 467.67 1151.44Jul-15 232.87 466.38 1158.11
Aug-15 231.88 453.22 1145.8Sep-15 234.57 474.89 1168.23Oct-15 248.18 513.75 1215.09
Nov-15 266.05 529.09 1243.31Dec-15 270.82 534.64 1255.64Jan-16 268.15 501.55 1215.81Feb-16 267.29 504.47 1232.71Mar-16 264.78 508.97 1247.14Apr-16 264.26 518.17 1266.53
May-16 263.87 521.14 1286.20Jun-16 264.36 539.18 1306.78Jul-16 263.38 553.71 1343.08
Aug-16 263.33 568.42 1375.19Sep-16 264.14 587.97 1404.35Oct-16 267.84 611.61 1425.91
Nov-16 288.57 589.88 1426.47Dec-16 283.44 584.49 1429.50Jan-17 282.03 550.34 1414.50Feb-17 277.32 560.48 1440.93Mar-17 284.63 593.13 1481.90
Apr-17 291.56 588.22 1463.17May-17 279.70 564.31 1456.88Jun-17 288.62 585.85 1486.36Jul-17 286.43 591.43 1520.87
Aug-17 287.98 585.18 1537.77Sep-17 300.38 612.79 1578.19Oct-17 347.15 662.35 1648.14
Nov-17 391.05 706.48 1715.14Dec-17 396.48 723.62 1719.60Jan-18 384.93 711.41 1611.72Feb-18 371.05 731.17 1639.99Mar-18 367.09 715.93 1637.01Apr-18 371.59 713.27 1646.92
May-18 376.97 688.06 1635.81Jun-18 389.33 716.25 1682.18Jul-18 396.01 710.67 1702.69
Aug-18 400.02 741.35 1756.06Sep-18 409.53 765.29 1802.79Oct-18 423.74 842.08 1918.60
Nov-18 452.83 852.63 1791.96Dec-18 437.28 872.74 1831.22Jan-19 430.49 803.40 1793.40Feb-19 417.26 742.14 1760.32Mar-19 409.87 751.35 1789.21Apr-19 417.88 748.62 1819.61
May-19 416.26 758.07 1866.05Jun-19 411.93 779.81 1919.38Jul-19 418.01 754.12 1929.22
Aug-19 407.89 772.61 1969.24Sep-19 414.21 830.66 2058.10Oct-19 426.42 886.48 2149.23
Nov-19 443.67 897.18 2035.04Dec-19 432.14 848.27 1986.35Jan-20 418.15 792.38 1955.68Feb-20 420.38 797.28 1984.31Mar-20 426.27 810.36 2008.08Apr-20 426.49 803.26 2012.83
May-20 414.51 787.49 2016.56Jun-20 407.11 813.60 2057.30Jul-20 409.50 820.42 2073.59
Aug-20 407.40 817.96 2079.61Sep-20 419.81 820.50 2090.69Oct-20 436.94 852.54 2123.82
Nov-20 449.17 822.61 2114.62Dec-20 429.65 790.31 2083.32Jan-21 413.92 727.20 2040.29Feb-21 406.93 703.55 2022.41
Mar-21 397.69 704.73 2023.88Apr-21 380.79 703.78 2017.62
May-21 372.48 689.58 2004.87Jun-21 381.49 688.35 1997.12Jul-21 374.89 692.48 1987.70
Aug-21 371.69 672.90 1952.74Sep-21 370.33 686.51 1950.27Oct-21 364.74 699.16 1950.48
Nov-21 398.63 682.97 1935.19Dec-21 391.60 673.71 1914.52Jan-22 363.69 615.12 1848.32Feb-22 355.53 611.81 1843.15Mar-22 348.73 609.53 1840.16Apr-22 348.54 623.78 1841.98
May-22 327.07 605.35 1803.14Jun-22 339.28 617.12 1798.52Jul-22 338.84 611.90 1787.68
Aug-22 334.32 606.11 1770.17Sep-22 341.76 628.26 1786.72Oct-22 365.98 653.41 1809.85
Nov-22 385.63 654.35 1821.96Dec-22 388.08 660.93 1845.64Jan-23 351.35 626.96 1822.31Feb-23 352.62 620.27 1831.61Mar-23 345.42 627.29 1845.58Apr-23 340.86 653.12 1880.37
May-23 344.75 636.52 1867.52Jun-23 337.66 650.70 1864.94Jul-23 335.35 633.68 1833.74
Aug-23 332.04 645.67 1835.66Sep-23 337.26 665.95 1844.66Oct-23 342.77 655.68 1796.81
Nov-23 338.08 684.00 1863.91Dec-23 338.40 681.86 1861.90Jan-24 319.31 644.30 1828.77Feb-24 314.30 637.07 1829.63Mar-24 307.15 636.12 1828.71Apr-24 320.17 624.49 1835.99
May-24 308.05 624.71 1829.53Jun-24 300.94 641.39 1830.41Jul-24 298.82 617.41 1806.56
Aug-24 303.82 618.82 1797.68Sep-24 301.05 637.93 1815.36Oct-24 332.49 639.29 1828.38
Nov-24 344.16 665.31 1897.18Dec-24 350.01 674.84 1912.45Jan-25 308.78 624.34 1873.97
Feb-25 305.36 619.81 1880.69Mar-25 293.90 611.45 1877.68Apr-25 292.19 616.70 1880.66
May-25 294.26 608.76 1868.64Jun-25 299.00 606.97 1860.67Jul-25 301.41 599.27 1854.28
Aug-25 299.85 615.50 1876.87Sep-25 292.47 654.80 1923.35Oct-25 330.71 676.74 1954.33
Nov-25 355.32 674.38 1973.21Dec-25 338.76 689.85 2008.73Jan-26 309.58 648.98 1965.27Feb-26 296.42 646.36 1979.15Mar-26 282.56 668.49 2006.06Apr-26 294.76 652.36 1992.81
May-26 279.86 649.09 1983.93Jun-26 283.75 657.24 1985.46Jul-26 286.21 652.63 1982.54
Aug-26 295.28 648.26 1991.38Sep-26 299.52 676.66 2012.56Oct-26 313.33 711.54 2059.10
Nov-26 344.76 710.68 2077.97Dec-26 332.80 713.92 2086.69Jan-27 288.84 674.16 2055.64Feb-27 290.80 654.94 2044.55Mar-27 287.00 671.16 2067.96Apr-27 299.28 673.38 2078.59
May-27 283.21 688.39 2078.14Jun-27 292.61 703.90 2084.22Jul-27 291.99 684.97 2063.99
Aug-27 297.52 685.45 2075.15Sep-27 295.78 697.31 2092.64Oct-27 312.44 727.56 2133.60
Nov-27 355.72 774.07 2205.03Dec-27 342.60 783.89 2228.42Jan-28 289.50 728.36 2194.44Feb-28 283.86 725.65 2203.46Mar-28 299.36 758.75 2246.49Apr-28 305.53 741.37 2253.21
May-28 313.81 766.80 2283.00Jun-28 314.37 798.40 2286.26Jul-28 312.73 760.16 2249.24
Aug-28 311.16 754.78 2237.29Sep-28 308.50 766.11 2250.92Oct-28 340.19 785.46 2297.05
Nov-28 385.55 808.09 2331.58Dec-28 344.54 783.05 2303.34
Jan-29 305.60 751.41 2277.40Feb-29 297.25 735.87 2254.40Mar-29 316.16 755.71 2267.79Apr-29 322.16 768.57 2276.92
May-29 303.54 757.32 2243.77Jun-29 315.93 776.17 2242.27Jul-29 307.90 791.51 2244.72
Aug-29 303.89 788.97 2248.66Sep-29 306.80 836.04 2306.55Oct-29 329.47 821.22 2291.27
Nov-29 371.99 848.74 2301.80Dec-29 317.86 821.88 2256.28Jan-30 278.77 743.17 2182.99Feb-30 276.53 727.05 2166.79Mar-30 282.04 713.73 2159.04Apr-30 283.53 722.78 2163.92
May-30 275.79 694.53 2126.96Jun-30 277.49 691.27 2101.56Jul-30 272.32 718.53 2120.55
Aug-30 273.96 732.23 2136.35Sep-30 281.05 748.35 2168.00Oct-30 290.37 730.89 2162.76
Nov-30 346.02 718.88 2157.50Dec-30 298.08 722.69 2148.53Jan-31 256.51 675.32 2104.05Feb-31 255.92 658.88 2094.41Mar-31 248.88 660.64 2105.97Apr-31 253.45 674.27 2127.57
May-31 259.86 688.73 2145.15Jun-31 254.11 711.57 2161.93Jul-31 245.98 675.11 2126.38
Aug-31 244.81 682.20 2143.30Sep-31 260.36 701.28 2156.80Oct-31 265.02 696.42 2158.73
Nov-31 321.90 707.40 2103.23Dec-31 277.89 670.81 2030.85Jan-32 271.98 631.31 1999.58Feb-32 262.17 612.77 2002.84Mar-32 253.77 614.88 2003.40Apr-32 246.47 616.75 2009.64
May-32 248.43 608.37 1995.40Jun-32 261.32 594.61 1967.87Jul-32 259.13 604.78 1967.95
Aug-32 247.93 603.99 1970.54Sep-32 246.70 601.98 1961.37Oct-32 254.42 610.10 1980.65
Nov-32 313.08 594.12 1972.78
Dec-32 282.52 575.96 1953.48Jan-33 271.81 557.78 1940.66Feb-33 273.15 560.25 1957.31Mar-33 272.85 584.27 1973.38Apr-33 259.43 597.00 1996.55
May-33 261.51 600.79 1997.61Jun-33 267.56 627.15 2014.08Jul-33 262.84 609.80 1989.66
Aug-33 258.07 612.58 1985.30Sep-33 254.22 627.17 1999.35Oct-33 255.50 633.30 1983.07
Nov-33 278.74 612.66 1970.85Dec-33 263.74 621.03 1977.95Jan-34 258.58 589.91 1940.81Feb-34 258.27 594.38 1949.15Mar-34 253.93 611.48 1978.01Apr-34 251.79 613.85 1989.72
May-34 251.46 620.83 1988.34Jun-34 252.76 614.56 1979.56Jul-34 271.98 611.69 1972.08
Aug-34 279.42 631.75 1998.94Sep-34 288.20 674.44 2051.41Oct-34 292.71 665.97 2036.15
Nov-34 300.25 684.99 2096.31Dec-34 299.29 685.93 2093.14Jan-35 292.17 657.51 2069.88Feb-35 296.85 646.10 2074.43Mar-35 288.73 657.95 2104.65Apr-35 294.12 691.29 2143.00
May-35 285.01 684.98 2131.47Jun-35 290.60 681.15 2106.99Jul-35 289.09 688.32 2116.28
Aug-35 314.17 695.00 2129.25Sep-35 312.17 734.32 2178.65Oct-35 331.40 775.66 2240.96
Nov-35 324.82 778.30 2252.42Dec-35 325.11 760.29 2246.26Jan-36 309.20 706.56 2205.36Feb-36 314.21 689.59 2206.85Mar-36 315.98 708.39 2240.55Apr-36 321.84 748.76 2284.86
May-36 321.91 737.07 2263.99Jun-36 328.90 735.17 2239.96Jul-36 329.85 757.04 2251.01
Aug-36 331.59 766.31 2269.13Sep-36 346.06 785.89 2286.76Oct-36 353.28 814.53 2324.85
Nov-36 380.65 817.86 2364.64Dec-36 361.96 820.85 2368.67Jan-37 357.80 816.11 2364.72Feb-37 351.87 817.05 2380.88Mar-37 356.97 855.23 2439.01Apr-37 365.77 877.28 2460.61
May-37 359.42 856.87 2430.33Jun-37 360.20 848.08 2417.89Jul-37 358.82 854.74 2426.89
Aug-37 371.21 859.87 2437.51Sep-37 378.81 874.66 2449.17Oct-37 397.08 855.42 2439.12
Nov-37 410.26 852.47 2422.68Dec-37 401.22 845.90 2428.73Jan-38 391.52 810.95 2401.87Feb-38 376.38 794.58 2409.15Mar-38 381.70 820.01 2443.41Apr-38 389.98 853.55 2484.09
May-38 383.29 832.51 2458.01Jun-38 387.82 848.41 2469.23Jul-38 384.14 844.18 2466.78
Aug-38 403.87 855.36 2490.02Sep-38 427.19 889.36 2521.94Oct-38 446.46 922.17 2577.96
Nov-38 426.44 915.42 2570.17Dec-38 415.46 897.47 2557.12Jan-39 416.73 858.65 2526.05Feb-39 409.27 858.32 2549.21Mar-39 406.56 878.07 2578.46Apr-39 412.36 917.51 2614.49
May-39 414.18 853.79 2532.15Jun-39 412.76 867.14 2547.51Jul-39 418.57 877.94 2575.18
Aug-39 423.32 888.63 2590.52Sep-39 476.29 985.44 2677.55Oct-39 501.55 1043.4 2752.56
Nov-39 490.12 1077.22 2812.05Dec-39 492.38 1048.51 2789.56Jan-40 476.28 1048.32 2798.81Feb-40 462.29 969.68 2628.67Mar-40 466.25 987.71 2648.87Apr-40 478.38 1038.13 2709.67
May-40 484.71 1077.49 2720.57Jun-40 525.84 1118.06 2726.92Jul-40 530.63 1155.05 2767.60
Aug-40 567.99 1204.80 2839.20Sep-40 610.07 1309.08 2964.05
Oct-40 601.20 1248.53 2847.99Nov-40 614.52 1300.23 2926.11Dec-40 625.87 1304.33 2945.65Jan-41 616.97 1333.88 3002.01Feb-41 613.44 1392.45 3079.48Mar-41 621.08 1401.86 3104.56Apr-41 648.69 1480.02 3187.58
May-41 667.15 1499.76 3194.94Jun-41 641.87 1337.52 2804.46Jul-41 669.79 1374.95 2863.69
Aug-41 684.62 1419.96 2942.15Sep-41 692.38 1479.05 3034.21Oct-41 731.05 1526.40 3118.10
Nov-41 761.55 1582.76 3221.96Dec-41 780.37 1615.05 3284.08Jan-42 732.26 1661.22 3381.66Feb-42 779.60 1717.73 3382.01Mar-42 802.67 1565.58 3115.21Apr-42 783.59 1652.33 3189.48
May-42 767.35 1605.10 3160.77Jun-42 815.97 1777.00 3375.14Jul-42 888.98 1876.06 3529.66
Aug-42 871.99 1970.35 3669.90Sep-42 927.20 2106.90 3855.15Oct-42 1018.06 2213.53 3922.27
Nov-42 996.51 1954.08 3583.57Dec-42 1010.77 2039.17 3712.36Jan-43 972.75 2050.88 3773.45Feb-43 1008.02 2148.76 3944.23Mar-43 1038.51 2305.52 4195.06Apr-43 1087.78 2428.57 4354.82
May-43 1119.52 2077.26 3809.55Jun-43 1120.16 2163.3 3945.43Jul-43 1132.33 2190.56 4016.32
Aug-43 1168.53 2350.18 4265.91Sep-43 1184.19 2469.99 4458.89Oct-43 1240.43 2568.89 4530.05
Nov-43 1270.54 2330.35 4212.89Dec-43 1280.06 2367.83 4315.61Jan-44 1287.70 2410.30 4436.51Feb-44 1303.85 2524.67 4648.49Mar-44 1323.28 2641.08 4866.50Apr-44 1367.20 2817.54 5071.22
May-44 1355.91 2464.73 4558.60Jun-44 1402.88 2535.37 4729.91Jul-44 1425.84 2630.19 4894.72
Aug-44 1461.42 2718.20 5087.79
Sep-44 1506.20 2842.57 5306.75Oct-44 1536.15 3021.00 5509.93
Nov-44 1515.53 2637.04 4980.18Dec-44 1508.52 2697.61 5120.57Jan-45 1504.61 2682.78 5206.81Feb-45 1497.87 2754.85 5385.43Mar-45 1541.73 2883.19 5607.89Apr-45 1583.07 3036.19 5770.86
May-45 1592.64 2637.35 5200.29Jun-45 1626.74 2777.62 5423.16Jul-45 1592.77 2864.45 5605.09
Aug-45 1615.73 2960.45 5793.64Sep-45 1628.79 3072.09 6006.94Oct-45 1685.54 3248.82 6240.44
Nov-45 1684.53 2886.60 5702.82Dec-45 1726.11 2928.56 5793.89Jan-46 1670.05 2867.87 5830.81Feb-46 1686.31 2891.64 5969.59Mar-46 1693.56 2951.09 6121.27Apr-46 1746.14 3091.20 6328.71
May-46 1679.45 3105.52 6411.22Jun-46 1690.93 3122.35 6485.82Jul-46 1727.38 3145.36 6556.22
Aug-46 1725.29 3148.35 6614.08Sep-46 1735.61 3185.05 6709.20Oct-46 1773.29 3248.06 6724.79
Nov-46 1818.31 3165.82 6625.97Dec-46 1830.01 3184.07 6653.39Jan-47 1750.28 3070.19 6603.02Feb-47 1709.21 3026.72 6612.98Mar-47 1767.72 2957.68 6577.00Apr-47 1774.28 3131.26 6768.54
May-47 1704.32 3053.04 6735.42Jun-47 1705.73 3114.46 6758.21Jul-47 1700.80 3055.88 6745.35
Aug-47 1752.61 3044.56 6818.57Sep-47 1733.26 3047.43 6853.30Oct-47 1808.17 3156.15 6908.87
Nov-47 1798.65 3095.83 6806.24Dec-47 1827.78 3159.31 6899.75Jan-48 1776.03 3039.05 6863.05Feb-48 1768.53 3087.13 6967.67Mar-48 1780.49 3098.45 7025.13Apr-48 1821.91 3181.63 7132.63
May-48 1823.85 3128.73 7083.78Jun-48 1804.37 3179.17 7114.86Jul-48 1804.11 3180.05 7139.26
Aug-48 1833.36 3217.35 7220.00Sep-48 1901.13 3316.42 7364.96Oct-48 1939.14 3391.23 7431.14
Nov-48 1936.56 3489.69 7575.38Dec-48 1920.49 3477.78 7534.73Jan-49 1858.45 3330.56 7448.49Feb-49 1837.15 3265.49 7424.90Mar-49 1869.33 3281.43 7545.54Apr-49 1935.13 3373.65 7712.55
May-49 1919.34 3268.40 7606.97Jun-49 1923.06 3292.89 7622.66Jul-49 1922.71 3288.66 7629.56
Aug-49 1933.20 3311.07 7683.30Sep-49 1988.32 3473.50 7884.96Oct-49 2006.46 3464.12 7916.84
Nov-49 1915.35 3457.25 7904.57Dec-49 1937.29 3442.35 7875.70Jan-50 1878.89 3409.78 7903.85Feb-50 1894.06 3413.87 7950.63Mar-50 1914.35 3451.38 8023.89Apr-50 1910.55 3441.23 8001.86
May-50 1899.62 3434.18 7991.15Jun-50 1910.25 3446.61 7984.80Jul-50 1937.87 3471.11 8000.34
Aug-50 1963.48 3574.58 8118.06Sep-50 1966.24 3746.97 8328.85Oct-50 2036.69 3764.56 8323.97
Nov-50 1996.01 3708.48 8251.51Dec-50 2040.23 3695.76 8254.17Jan-51 1927.27 3562.00 8138.98Feb-51 1940.26 3507.04 8125.23Mar-51 1967.24 3529.43 8143.10Apr-51 1973.89 3605.25 8202.94
May-51 1963.55 3600.74 8189.50Jun-51 2038.38 3627.11 8185.73Jul-51 2025.52 3599.46 8179.51
Aug-51 2047.92 3581.24 8164.41Sep-51 2064.80 3703.26 8297.97Oct-51 2093.54 3764.06 8339.46
Nov-51 2141.00 3822.84 8439.25Dec-51 2184.58 3797.83 8409.36Jan-52 2106.26 3677.70 8317.03
Feb-52 2091.95 3683.61 8368.19Mar-52 2151.24 3774.24 8522.06Apr-52 2158.49 3842.20 8599.40
May-52 2098.42 3824.60 8593.28Jun-52 2121.41 3823.65 8615.67Jul-52 2155.94 3866.99 8703.08
Aug-52 2182.17 3874.55 8744.64Sep-52 2167.93 3952.01 8852.89Oct-52 2259.39 4056.83 8957.68
Nov-52 2212.14 4042.86 8958.49Dec-52 2294.30 4099.57 9024.06Jan-53 2318 4245 9124Feb-53 2289 4145 9080Mar-53 2285 4143 9135Apr-53 2250 4235 9276
May-53 2309 4276 9344Jun-53 2287 4265 9352Jul-53 2314 4271 9380
Aug-53 2283 4267 9414Sep-53 2284 4275 9468Oct-53 2295 4327 9504
Nov-53 2301 4250 9292Dec-53 2325 4188 9181Jan-54 2296 4209 9240Feb-54 2258 4081 9184Mar-54 2279 4101 9293Apr-54 2271 4161 9413
May-54 2278 4219 9525Jun-54 2282 4120 9524Jul-54 2233 4326 9761
Aug-54 2207 4267 9758Sep-54 2222 4310 9864Oct-54 2201 4402 10033
Nov-54 2228 4393 9926Dec-54 2258 4439 9953
M2Jan-55 10103Feb-55 10056Mar-55 10157Apr-55 10352
May-55 10448Jun-55 10566Jul-55 10790
Aug-55 10886Sep-55 10933Oct-55 11048
Nov-55 10901Dec-55 10773Jan-56 10690Feb-56 10655Mar-56 10681Apr-56 10852
May-56 10897Jun-56 10925Jul-56 11057
Aug-56 11112Sep-56 11128Oct-56 11261
Nov-56 11101Dec-56 11125Jan-57 11036Feb-57 10921Mar-57 10900Apr-57 11068
May-57 11078Jun-57 11190Jul-57 11261
Aug-57 11270Sep-57 11292Oct-57 11334
Nov-57 11253Dec-57 11269Jan-58 11275Feb-58 11265Mar-58 11449Apr-58 11733
May-58 11817Jun-58 11997Jul-58 12258
Aug-58 12552Sep-58 12785
Oct-58 12980Nov-58 12808Dec-58 12762Jan-59 12667Feb-59 12585Mar-59 12676Apr-59 12780
May-59 12774Jun-59 12789Jul-59 12907
Aug-59 12964Sep-59 13004Oct-59 12967
Nov-59 12795Dec-59 12667Jan-60 12621Feb-60 12549Mar-60 12661Apr-60 12848
May-60 12872Jun-60 12968Jul-60 13024
Aug-60 13162Sep-60 13372Oct-60 13515
Nov-60 13401Dec-60 13347Jan-61 13356Feb-61 13364Mar-61 13522Apr-61 13604
May-61 13671Jun-61 13709Jul-61 13874
Aug-61 14100Sep-61 14185Oct-61 14328
Nov-61 14338Dec-61 14310Jan-62 14213Feb-62 14139Mar-62 14261Apr-62 14504
May-62 14574Jun-62 14576Jul-62 14604
Aug-62 14649Sep-62 14867Oct-62 15111
Nov-62 14929Dec-62 14993Jan-63 14961Feb-63 14894Mar-63 15055Apr-63 15392
May-63 15567Jun-63 15553Jul-63 15722
Aug-63 15753Sep-63 15944Oct-63 16145
Nov-63 15998Dec-63 15980Jan-64 16063Feb-64 15937Mar-64 16204Apr-64 16473
May-64 16473Jun-64 16554Jul-64 16646
Aug-64 16745Sep-64 16908Oct-64 17166
Nov-64 17104Dec-64 17178Jan-65 17159Feb-65 17146Mar-65 17432Apr-65 17811
May-65 17878Jun-65 18027Jul-65 18166
Aug-65 18427Sep-65 18542Oct-65 18702
Nov-65 18823Dec-65 18810Jan-66 18721Feb-66 18666Mar-66 18890Apr-66 19206
May-66 19250
Jun-66 19401Jul-66 19580
Aug-66 19789Sep-66 19929Oct-66 20132
Nov-66 20114Dec-66 20157Jan-67 20134Feb-67 20305Mar-67 20595Apr-67 20942
May-67 21135Jun-67 21289Jul-67 21613
Aug-67 21868Sep-67 22267Oct-67 22563
Nov-67 22558Dec-67 22675
0
References
Bank of Canada (various years) Statistical Summary
Bank of Canada (various years) Bank of Canada Review
Bank of Canada (1983) "Technical Note" Bank of Canada Review (March 1983).
Betts, C., M. Bordo and A. Redish (1996) "A small open economy in Depression: Lessonsfrom Canada in the 1930s" Canadian Journal of Economics (forthcoming).
Bordo, M. and L. Jonung (1987) The Long Run Behaviour of the Velocity of CirculationCambridge: Cambridge University Press.
Buckley and M. Urquhart, (1965) Historical Statistics of Canada Toronto: Macmillan, 1stedn.
Canada (various years) The Canada Gazette "Supplement to the Canada Gazette, Statement ofthe Assets and Liabilities of the Chartered Banks" Ottawa: Queen's Printer
Canada, Statistics Canada. (1996) CANSIM data base: Canadian socio-economic informationmanagement system. Ottawa: Ontario.
Champ, B., Smith, B. and S. Williamson (1991) “Currency Elasticity and Banking Panics:Theory and Evidence” Rochester Center for Economic Research Working Paper No. 292.
Curtis, C.A. (1929) Statistical Contributions to Canadian Economic History Vol. I., Toronto:Macmillan.
Dick, T. and J. Floyd (1992) Canada and the Gold Standard Cambridge: CambridgeUniversity Press.
McIvor, R. C. (1961) Canadian Monetary Banking and Fiscal Development Toronto:Macmillan.
Paterson, D. G. and R. Shearer (1986) “The supply of Canadian money, 1842-71: Estimatesand implications” UBC Discussion Paper, 86-17.
Rich, G. (1988) The Cross of Gold Ottawa: Carleton University Press.
Rolnick, A. and W. Weber (1995)
Siklos, P. (1993) “Income velocity and institutional change: Some new time series evidence,1870-1986” Journal of Money Credit and Banking 25(3), 377-92.
1
Endnotes
1See Betts, Bordo and Redish (1996) for an example of the use of these data to study
interwar business cycles, and Champ, Smith and Williamson (1991) to motivate a
comparative study of seasonality. International comparisons must take into account
differences in the definitions of monetary aggregates across countries. For example
money market mutual funds are included in M2 in the U.S. but not in Canada; only
small ($100,000) time deposits are included in M2 in the U.S. while all time deposits
other than non-personal term deposits are included in Canadian M2.
2 Rich (1994) and Dick and Floyd (1994) also create money stock estimates, quarterly
and annual respectively, for the period 1970-1913.
3We have chosen to begin in July 1871 as much of the data for 1870 are missing and
the form of the monthly returns of the chartered banks (see below) was expanded
considerably at that time. Those interested in data for the period 1841-1871 should see
Paterson and Shearer (1986).
4Data on the individual components are available from the authors on request or from
the clio can home page, see Appendix.
5 We do not understand the logic of this adjustment which is inconsistent with the
objectives of monetary aggregates. The implicit assumption - that agents treated
deposits at particular trust companies differently depending on whether or not the trust
company would be absorbed by a chartered bank many years in the future - is not
credible. If the Bank of Canada believes that it is imperative to have an M2 series that
does not have irregular jumps, then including the appropriated deposits at all trust
companies would be logically preferable.
6The U.S. Mint estimated that 70% of Canadian banks' coin holdings were in U.S. gold
coins.
2
7Perhaps the leading rationale for the small role of notes in the U.K. was the high
minimum denomination £5 ($25) where in Canada and the U.S. $1 notes were
common.
8There is a slight positive time trend in the share over the period 1926-38, such that a
backward extrapolation of the trend would generate negative coin holdings in 1871.
9The main reason for generating a monthly series is to maintain the seasonality that we
imposed for 1871 to 1915. In fact the seasonal is very small - using the available
monthly data from 1926 to 1938, suggests that the share of coin fell slightly in the fall,
- that is, our estimates overstate the amount of coin in the fall by perhaps 5%.
10 CANSIM is the electronic database maintained by Statistics Canada. Bxxx refers to
the identification number in the CANSIM database.
11 More precisely, the large denomination notes, or large legals as they were known,
were only legal tender amongst banks.
12See McIvor (1961) for a general history of Canadian monetary legislation.
13Data on the quantity of Dominion Notes outstanding are not published from July
1871. We estimate the quantity outstanding to have been $8.25 million, and that
therefore Dominion Notes in the hands of the public amounted to $2.976 million.
14 We adopt this standard practice, although we note that it incorporates the (dubious)
assumption that agents do not exploit the float period.
15In our data on components of the monetary aggregates we do provide separate series
for the cheque and note float so that researchers can compile a series on ‘currency in
the hands of the public’ if they wish. We caution however that these chartered bank
notes are ‘inside’ money, and therefore are not high-powered money.
16In July 1913 the float was 79% cheques and 21% notes of foreign and domestic
banks. We assume that 60% of the note float is foreign currency.
3
17Since 1968 another component has been added to the series - M1 adjustments
(B2050).
18The available monthly data displayed virtually no seasonal pattern suggesting that
linear interpolation was appropriate.
19Those using these data are warned that the Bank’s policy of retroactively changing
the adjustment factor implies that potentially the adjustment estimate for 1953-67 may
have to be reworked after revisions of the Bank’s M2 series. However, revisions to the
M2 adjustment factor may have their primary influence in the value of the factor in the
1980s and have little impact on the value in the 1960s as shown in Figure 4.
20 M1 Bank of Canada is the sum of B657 (demand deposits), B653 (provincial
deposits); B2012 (Coin outside banks), B2011 (notes in the hands of the public) less
B628 (the float). All these series are seasonally unadjusted, end of month data. The
M1 net series is B2033 which is average of weekly data again not seasonally adjusted.
21Figure 2 makes clear that only a small part of the seasonal in the 'M1 us' series is
attributable to the (lack of) time aggregation. We present only raw (i.e. seasonally
unadjusted) data in our tables, leaving researchers to adopt methods of seasonal
adjustment consistent with the purpose for which they are using the data.
22In addition, the Bank excludes provincial deposits that are not demand deposits from
the M1 series. The division between demand and other provincial deposits is not
published.
23For example, the series on demand deposits is titled ‘Deposits by the Public payable
on demand in Canada’ prior to July 1954 and ‘Other deposits payable on demand in
Canadian currency’ on and after July 1954.
24For more details on the underpinnings of these adjustments see Bank of Canada
Review (March 1983).
25M3 =M2 plus these non-personal term deposits plus foreign currency deposits of
residents booked in Canada.
4
26 Although note that our monetary base series only includes currency in the hands of
the public that is also high-powered or outside money.
27 Again, data on individual components for the period 1913-35 are available in the
data appendix.
28Surprising here is the much more rapid expansion of M1 than M2 during World War
II.
29This pattern was generated by the 6 monthly issue of Victory Bonds, for which the
chartered banks provided installment credit.