Embed Size (px)
Citation preview
An Assessment of Interstate Safety Investment Priorities in Washington State
Morgan State University The Pennsylvania State University
University of Maryland University of Virginia
Virginia Polytechnic Institute & State University West Virginia University
The Pennsylvania State University The Thomas D. Larson Pennsylvania Transportation Institute
Transportation Research Building University Park, PA 16802-4710 Phone: 814-865-1891 Fax: 814-863-3707
www.mautc.psu.edu
Technical Report Documentation Page
Form DOT F 1700.7 (8-72) Reproduction of completed page authorized
1. Report No.
2. Government Accession No.
3. Recipient’s Catalog No.
4. Title and Subtitle
Assessment of Interstate Safety Investment Priorities in Washington State
5. Report Date
December 1, 2014 6. Performing Organization Code
7. Author(s) Venky Shankar, Minho Park, Junseok Oh, Sudhakar Sathyanarayanan, and Vikas Sharma
8. Performing Organization Report No. LTI 2015-11 MAUTC Report No. PSU-2011-02/ PSU-2012-03
9. Performing Organization Name and Address The Thomas D. Larson Pennsylvania Transportation Institute The Pennsylvania State University 201 Transportation Research Building University Park, PA 16802
10. Work Unit No. (TRAIS) 11. Contract or Grant No. DTRT-07-6-0003
12. Sponsoring Agency Name and Address The Pennsylvania Department of Transportation Bureau of Planning and Research Commonwealth Keystone Building 400 North Street, 6th Floor Harrisburg, PA 17120-0064
13. Type of Report and Period Covered Final Report 11/7/2011 – 12/31/2012 14. Sponsoring Agency Code
15. Supplementary Notes 16. Abstract The Washington State Department of Transportation (WSDOT) commissioned the current study, targeting the entire interstate mainline network in Washington State, to provide strategic direction to multi-biennial investment interstate locations that offer the greatest return in terms of cumulative and annualized safety benefits. The objectives of this study were to prioritize interstate locations strategically in terms of risk of high social cost, while targeting locations that repeat in nature. As such, the methodological questions that arise relate to the following: what measurements are required to comprehensively address the “strategic risk evaluation” aspect, and what measurements are required to adequately address the “repeat location identification” aspect. Using a step-wise procedure to systematically assess mainline interstate accident risk, a multi-objective approach was employed in order to factor in multiple criteria for ranking of segments, while accounting for multiple accident types as inputs in the ranking process. The planned scope of this study produced a target priority list of 202 locations with a total length of 154.5 miles. This list should be evaluated in detail for scoping improvements, associated costs and benefits prior to evaluating locations in the “tracking list.” The next step in ensuring implementation and successful deployment of this procedure will be to carefully evaluate cost improvement strategies and estimate associated benefits. Once costs and benefits are computed, one can systematically proceed to evaluate various measures of cost efficiency and effectiveness using lifecycle and annualized benefits and costs. 17. Key Words Interstate mainline network, accident risk, investment, safety benefits, strategic risk evaluation, repeat location identification
18. Distribution Statement No restrictions. This document is available from the National Technical Information Service, Springfield, VA 22161
19. Security Classif. (of this report) Unclassified
20. Security Classif. (of this page) Unclassified
21. No. of Pages 18
22. Price
The contents of this report reflect the views of the authors, who are responsible for the facts and the accuracy of the information presented herein. This document is disseminated under the sponsorship of the U.S. Department of Transportation’s University Transportation Centers Program, in the interest of information exchange. The U.S. Government assumes no liability for the contents or use thereof.

AN ASSESSMENT OF INTERSTATE SAFETY INVESTMENT PRIORITIES IN WASHINGTON STATE
REPORT PREPARED BY
Dr. Venky Shankar, PE Principal Investigator and Associate Professor
The Thomas D. Larson Pennsylvania Transportation Institute Department of Civil and Environmental Engineering
226C Sackett Building The Pennsylvania State University
University Park, PA 16802 Tel: (814) 865-9434
E-mail: [email protected]
Minho Park Doctoral Candidate in Civil Engineering
Department of Civil and Environmental Engineering The Pennsylvania State University
Junseok Oh Doctoral Candidate in Civil Engineering
Department of Civil and Environmental Engineering The Pennsylvania State University
Sudhakar Sathyanarayanan Transportation Engineer
DKS Associates, Inc. Seattle, WA 98104
And
Vikas Sharma Transportation Engineer Olsson Associates, Inc.
Phoenix, AZ 85020

TABLE OF CONTENTS
INTRODUCTION ...........................................................................................................................1 GOALS AND OBJECTIVES ..........................................................................................................3 SCOPE OF THE STUDY ................................................................................................................4 STUDY METHODOLOGY ............................................................................................................7 Safety priority evaluation process step one: screening and segmenting the network .................8 Safety priority evaluation process step two: defining accident-based prioritization criteria ......9 Safety priority evaluation process step three: computing segment-specific inputs ...................10 Safety priority evaluation process step four: prioritizing and estimating accident reduction targets ...................................................................................................................11 Safety priority evaluation process step five: determining improvement strategies ..................13 CONCLUSIONS AND RECOMMENDATIONS ........................................................................14 REFERENCES ..............................................................................................................................17
LIST OF FIGURES
Figure 1 Accident Distribution Across the Seven Interstates in Washington State in 2002-2006 ...................................................................................................................7
Figure 2 Process Flowchart .....................................................................................................15
iii

Introduction
The Washington State Department of Transportation (WSDOT) embarked on a statewide traffic safety
initiative in the early 1990s to enable the systematic assessment and treatment of accident risk on state
highways. The initial effort was targeted at roadway segments on a sample of the entire state highway
system for which risk models were developed and tested (Milton and Mannering 1998). The models
were statistical in nature and provided a framework for estimates of overall accident risk. The structure
of the models was similar to that employed in early accident modeling work by Shankar et al. (1995) in
the analysis of safety risk on Interstate 90 near Snoqualmie Pass. In the 1995 study, Shankar laid out the
foundation for modeling both frequency- and severity-oriented risks. The 1998 models from the Milton
study applied the frequency framework to segment accident risk. These models were supplemented
with a roadside accident risk framework that enabled the estimation of run-off-the-road accidents.
Around 1997, about five years since the inception of the statewide safety assessment initiative, a
targeted effort involving the refinement of statistical models for roadway segments was conducted
(Shankar et al. 1997). Complementing this advanced effort was an attempt undertaken by the WSDOT
Design Policy and Standards branch to quantify the risk of median crossovers on state highways
(Shankar et al. 1998; Albin et al. 2001; Glad et al. 2002; Chayanan et al. 2004). At the turn of the
century, efforts continued in the area of severity modeling, which WSDOT viewed as an important step
in the development of a systematic process. Initial testing of severity-oriented models was based on
early work by Shankar et al. (1996) that analyzed severity risk under inclement conditions on Interstate
90 near Snoqualmie Pass. Other studies conducted by WSDOT safety researchers targeted non-
motorized modes such as pedestrian travel. In a study published in 2003, Shankar et al. provided a
statistical framework for the analysis of mid-block pedestrian accident risk, and complemented this
effort by examining the risk of pedestrian severity in a subsequent study published in 2006. Milton et al.
1
(2008) concurrently applied a state-of-the-art statistical framework to assess the risk of frequency and
severity simultaneously. In a paper published in 2008, Milton et al. laid out the foundation for the
analysis of segment and intersection accident severity proportions. This study was meant to provide a
methodological completeness to the study of high accident locations and corridors (HAL, HAC) and
pedestrian accident locations (PAL), long established in WSDOT practice as the three basic modalities of
network safety analysis.
The above-described studies provided utility in the forecasting of accident risk – they employed
historical data related to accident frequency, severity, roadway geometrics, and weather data and
estimated, for example, the mean number of accidents expected for a given segment, intersection, or
corridor. As such, prioritizing locations was entirely pro-active in the sense that “locations of interest”
were ranked in terms of expected frequency and severity risk. This in itself was a process subject to
some uncertainty, as forecasting accuracy is a function of uncertainty in input values, missing data, and
uncertainty in the models themselves. In addition, forecasting accuracy in great part depended on the
length of accident history, roadway geometry, and weather-related information. It should be noted
here that around the year 2005, a systematic effort was undertaken by WSDOT to gather roadside
inventories. The factors mentioned above imply significant testing and refinement of models over a
length of time as more precisely measured roadside data became available. In the meantime, the need
remains to prioritize locations in terms of some measure of “safety need.” To this end, WSDOT’s well-
established accident database (MARS and its current variants run by the Transportation Data Office)
proved to be of great utility. While this database is entirely historical in nature and subject to reporting
biases (missing accident reports due to low severity), the vast amount of accident-specific information
for over 50,000 accidents reported annually served as a prime resource for longitudinal analysis of
safety. The TDO also maintains digitally compiled alignment data and traffic volume data for the entire
2

state highway network. Given this rich informational base, a methodology that provided for the ability
to target repeat locations resulting in high societal cost seemed possible. Shankar et al. (2005) tested a
data envelopment analysis based method to a sample of high accident locations and used the prioritized
list to forecast accident risk for future biennia. The study reported that the data envelopment approach
is reasonably robust for repeat locations (locations with non-zero accident histories at least standard
deviation above the accident mean). In addition, forecasting accuracy was substantial for the HAL
sample tested. Nearly three quarters of the sampled locations were forecasted at accident levels within
10 percent of the observed historical count.
Goals and Objectives
Given the promise of this method, the WSDOT commissioned the current study targeting the interstate
network in the state. The motivation was to provide strategic direction to multi-biennial investment in
interstate locations that offer the greatest return in terms of cumulative and annualized safety benefits.
The specific goals and objectives of this study were to prioritize interstate locations strategically in terms
of risk of high social cost, while targeting locations that repeat in nature. As such, the methodological
questions that arose related to the following: what measurements are required to comprehensively
address the “strategic risk evaluation” aspect, and what measurements are required to adequately
address the “repeat location identification” aspect? Measurements here relate to the accident severity
and frequency, as well as geometric and weather information. The 2005 Shankar report suggested that
reasonable forecasting accuracy can be achieved with commonly available geometric information such
as number of lanes, number of horizontal and vertical curves in a segment, shoulder widths, number of
interchanges and overpasses, presence of medians, and average daily traffic volumes. In addition, the
report suggested that several factors relating to accident outcomes be used for comprehensive safety
3
coverage. For example, assessing safety risk in terms of total societal cost, per-accident societal cost,
total severity index, per-accident severity index, total frequency, frequency of fatalities, and frequency
of disabling injuries would provide for a multi-objective approach. Such an approach also has significant
potential for a robust identification of priority locations, since it is based on total and unit-level, that is,
segment-level and per-accident measurements.
Scope of the Study
The entire interstate mainline network is examined in this report. No ramp segments are analyzed.
Comprised of 1,528 centerline miles, and covering all six regions, the study examines interstates 5, 405,
90, 205, 705, 82, and 182. Interstate 5 spans more than 276 centerline miles, with average daily traffic
volumes in excess of 290,000 in the Seattle area. Over 25,095 accidents were reported on the Interstate
5 mainline for the period 2002-2006, with 15,560 property damage accidents, 7,047 possible injury
accidents, 2,012 evident injury accidents, 358 disabling injury accidents, and 118 fatal accidents. Out of
the 25,095 accidents, 4,872 were single-vehicle, 15,105 were two-vehicle, 3,842 were three-vehicle, 968
were four-vehicle, and 308 were accidents involving five vehicles or more. In addition, it is noted that
14,259 accidents were of the rear-end type, 3,973 of the sideswipe type, 1,205 of the same direction
type, 3,807 of the fixed-object type, 590 of the overturn type, 33 of the head-on type, and 1,228
representing other types combined.
Interstate 405 spans roughly 30 centerline miles, with average daily traffic volumes in excess of 200,000
in the Bellevue area. Over 7,070 accidents were reported on the Interstate 405 mainline for the period
2002-2006, with 4,444 property damage accidents, 2,204 possible injury accidents, 350 evident injury
accidents, 62 disabling injury accidents, and 10 fatal accidents. Out of the 7,070 accidents, 860 were
4
single-vehicle, 4,697 two-vehicle, 1,177 were three-vehicle, 256 were four-vehicle, and 80 were
accidents involving five vehicles or more. In addition, it is noted that 4,828 accidents were of the rear-
end type, 984 of the sideswipe type, 268 of the same direction type, 765 of the fixed-object type, 72 of
the overturn type, 2 of the head-on type, and 151 representing other types combined.
Interstate 90 spans roughly 297 centerline miles, with average daily traffic volumes in excess of 150,000
in the Bellevue-Seattle area. Over 3,295 accidents were reported on the Interstate 90 mainline for the
period 2002-2006, with 1,762 property damage accidents, 496 possible injury accidents, 785 evident
injury accidents, 188 disabling injury accidents, and 64 fatal accidents. Out of the 3,295 accidents, 1,948
were single-vehicle, 1,132 were two-vehicle, 158 were three-vehicle, 34 were four-vehicle, and 23 were
accidents involving five vehicles or more. In addition, it is noted that 633 accidents were of the rear-end
type, 281 of the sideswipe type, 227 of the same direction type, 1,098 of the fixed object type, 618 of
the overturn type, 6 of the head-on type, and 432 representing other types combined.
Interstate 205 spans roughly 11 centerline miles, with average daily traffic volumes in excess of 135,000
in the Clark County area near the state border with Oregon. Over 377 accidents were reported on the
Interstate 205 mainline for the period 2002-2006, with 234 property damage accidents, 105 possible
injury accidents, 28 evident injury accidents, 4 disabling injury accidents, and 6 fatal accidents. Out of
the 377 accidents, 96 were single-vehicle, 233 were two-vehicle, 41 were three-vehicle, 7 were four-
vehicle, and 0 were accidents involving five vehicles or more. In addition, it is noted that 177 accidents
were of the rear-end type, 64 of the sideswipe type, 27 of the same direction type, 66 of the fixed-object
type, 23 of the overturn type, 0 of the head-on type, and 20 representing other types combined.
5
Interstate 705 spans roughly 1.5 centerline miles located in Pierce County, with average daily traffic
volumes in excess of 50,000. Over 88 accidents were reported on the Interstate 705 mainline for the
period 2002-2006, with 38 property damage accidents, 30 possible injury accidents, 18 evident injury
accidents, 2 disabling injury accidents, and 0 fatal accidents. Out of the 88 accidents, 35 were single-
vehicle, 36 were two-vehicle, 13 were three-vehicle, 4 were four-vehicle, and 0 were accidents involving
five vehicles or more. In addition, it is noted that 40 accidents were of the rear-end type, 9 of the
sideswipe type, 1 of the same direction type, 31 of the fixed-object type, 2 of the overturn type, 2 of the
head-on type, and 3 representing other types combined.
Interstate 82 spans roughly 133 centerline miles, with average daily traffic volumes in excess of 45,000
in the Yakima area. Over 620 accidents were reported on the Interstate 82 mainline for the period
2002-2006, with 202 property damage accidents, 39 possible injury accidents, 259 evident injury
accidents, 80 disabling injury accidents, and 40 fatal accidents. Out of the 620 accidents, 424 were
single-vehicle, 182 two-vehicle, 14 were three-vehicle, 0 were four-vehicle, and 0 were accidents
involving five vehicles or more. In addition, it is noted that 84 accidents were of the rear-end type, 42 of
the sideswipe type, 19 of the same direction type, 119 of the fixed-object type, 266 of the overturn type,
7 of the head-on type, and 83 representing other types combined.
Interstate 182 spans roughly 15 centerline miles, with average daily traffic volumes in excess of 40,000
in the Benton County area. Over 140 accidents were reported on the Interstate 182 mainline for the
period 2002-2006, with 80 property damage accidents, 12 possible injury accidents, 30 evident injury
accidents, 16 disabling injury accidents, and 2 fatal accidents. Out of the 140 accidents, 65 were single-
vehicle, 65 two-vehicle, 9 were three-vehicle, 1 was four-vehicle, and 0 were accidents involving five
vehicles or more. In addition, it is noted that 40 accidents were of the rear-end type, 14 of the
6
sideswipe type, 12 of the same direction type, 14 of the fixed-object type, 30 of the overturn type, 0 of
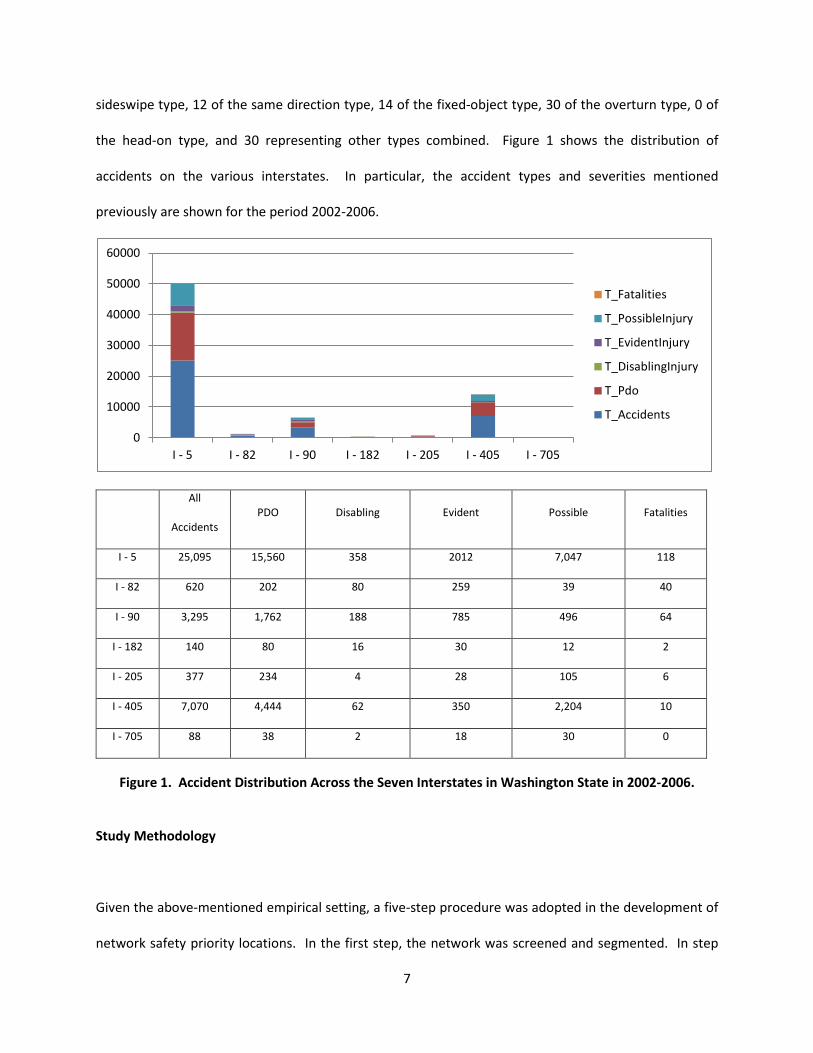
the head-on type, and 30 representing other types combined. Figure 1 shows the distribution of
accidents on the various interstates. In particular, the accident types and severities mentioned
previously are shown for the period 2002-2006.
All
Accidents PDO Disabling Evident Possible Fatalities
I - 5 25,095 15,560 358 2012 7,047 118
I - 82 620 202 80 259 39 40
I - 90 3,295 1,762 188 785 496 64
I - 182 140 80 16 30 12 2
I - 205 377 234 4 28 105 6
I - 405 7,070 4,444 62 350 2,204 10
I - 705 88 38 2 18 30 0
Figure 1. Accident Distribution Across the Seven Interstates in Washington State in 2002-2006.
Study Methodology
Given the above-mentioned empirical setting, a five-step procedure was adopted in the development of
network safety priority locations. In the first step, the network was screened and segmented. In step
0
10000
20000
30000
40000
50000
60000
I - 5 I - 82 I - 90 I - 182 I - 205 I - 405 I - 705
T_Fatalities
T_PossibleInjury
T_EvidentInjury
T_DisablingInjury
T_Pdo
T_Accidents
7

two, the segments were evaluated in terms of accident-related measurements such as total societal
cost, per-accident societal cost, total severity index, per-accident severity index, fatal and injury counts,
as well as total accident frequency. These measurements were made for the five year period 2002-2006
based on WSDOT-provided mainline accident reports. In step three, the calculated segment-specific
measurements were assessed in a multiobjective manner by relating them to various inputs such as
collision types and vehicle involvement. In all, 12 accident type inputs in the form of frequencies were
used – namely, rear-end, same direction, sideswipe, head-on, fixed object, overturn, other collision type,
single vehicle, two-vehicle, three-vehicle, four-vehicle, and five-vehicle counts. In step four, the inputs
were assessed using the data envelopment approach to determine the relative ranking of the segments
and associated priority within the interstate network as a whole. In step five, based on the
determination in step four, improvement needs were identified. The improvements were not costed,
however, nor were the estimated benefits from the targeted reductions determined in step four. Each
of the above-mentioned steps is described in some detail in the following discussion.
Safety priority evaluation process step one: screening and segmenting the network
Since a multiobjective foundation is required for the systematic assessment of safety risk, the network is
screened on the basis of spatial distribution of accident counts. Using the adjusted route milepost
locator, every reported milepost in the accident database for the period 2002-2006 was screened for
cumulative accident counts. Theoretically, if an accident is reported at every single milepost marker
(i.e., every one hundredth of a mile), the interstate network can be broken down into 152,800 0.01-mile
segments. While being a computationally burdensome task, this level of segmentation is prone to
aggregation biases in terms or risk extrapolation to longer segments. It was hence decided that network
segmentation would be conducted on the basis of accident count clusters. Using mathematically proven
8

techniques to identify robust spatial clusters, the entire interstate network was evaluated by direction.
This type of segmentation has the advantage in that it relies on the notion of grouping accident
locations using a clustering statistic applied uniformly to all locations. This statistic is usually defined in
terms of the Euclidean distance between accident locations and a cluster “mediod,” a physical object
located at the center of the cluster. This clustering procedure was conducted independently for each of
the interstates. The independent clustering approach was adopted for the primary reason that
accidents on roadway segments are essentially linearly represented. As a result of this clustering
procedure, 11,447 segments resulted. The distance between adjacent clusters was tagged as a zero-
accident segment. It should be noted here that the segments are not of uniform length. Out of the
11,447 segments, 7,070 were non-zero accident segments with a mean length of 0.17 miles (1,213.27
total), and 4,377 were zero-accident segments with a mean length of 0.07 (315.27 total) miles.
Safety priority evaluation process step two: defining accident-based prioritization criteria
Using the clustering-based segments as units of analysis, total societal cost, per-accident societal cost,
total severity index, per-accident severity index, total accident frequency, fatal and injury frequencies
were determined for each of the segments. The first four criteria were used to run a first-level filter on
above-average segments. For example, segment “I” was compared in terms of its computed values for
the cost and societal index criteria against the mean values for all segments for a particular interstate. If
segment “I” was at least one standard deviation in excess of the mean, it was flagged with respect to
that criterion. In this manner, theoretically, a segment can be tagged with four flags. The total accident
frequency and fatal/injury frequency were not used in the strictest sense as flagging criteria; rather,
they were used as lower bounds for ensuring that flagged segments had at least one non-zero
fatal/injury outcome. The total frequency criterion was used to break ties between segments if two
9

segments were ranked the same. The segment with the higher frequency total was given priority. Of
particular interest in this step is the assumption that segments were to be flagged on the basis of
interstate-specific criterion means. As opposed to comparing segments across interstates by using the
overall interstate mean, comparison is confined to the family of segments within a particular interstate
for the primary reason that interstates have substantial heterogeneity in spite of being in the same
functional class. It can also be argued that interstate 5 may have a different safety performance
function compared to interstate 405, or for that matter another interstate.
In the process of flagging segments, no particular segment was tagged with more than three flags. Out
of the 7,070 non-zero accident segments, 1,781 segments were tagged with at least one flag. However
no segment in the sub-population of 1,781 non-zero accident locations met all four criteria. In total, 411
segments were tagged with three flags, while 322 segments were tagged with two flags, and 1,048
segments with one flag. At the end of step two, the original network of 11,447 segments was trimmed
down to 1,781 segments. Various inputs relating to accident types were then computed for the
segments in order to apply the data envelopment analysis procedure. At this point it should be noted
that the 1,781 segments constitute what can be called a “starting priority list.”
Safety priority evaluation process step three: computing segment-specific inputs
Using geometric alignment, ADT, and accident-specific information provided by WSDOT, various inputs
were computed for each of the 11,447 segments. Although, only 1,781 segments were evaluated for
the purpose of ranking and prioritization, inputs were computed for all segments. Geometric inputs for
zero-accident segments can later be utilized for forecasting purposes if necessary. For zero-accident
segments, inputs were restricted to ADT and geometrics, whereas accident-specific information relating
10

to collision type and vehicle involvement was added as input for non-zero accident segments. As
mentioned previously, 12 accident related inputs were computed – rear-end, same direction, sideswipe,
head-on, fixed object, overturn, other collision type, single-vehicle, two-vehicle, three-vehicle, four-
vehicle, and five-vehicle counts. Geometric inputs were computed in terms of interchange and overpass
frequency, average, maximum, and minimum number of lanes in cross section, average, maximum, and
minimum shoulder widths, number of horizontal and vertical curves and average, maximum, and
minimum ADT.
Safety priority evaluation process step four: prioritizing and estimating accident reduction targets
The data envelopment analysis (DEA) procedure was applied in this step to identify segments as
candidates for improvements. The DEA approach relies on the notion that a set of inputs produces a set
of outputs with perfect efficiency. Any set of inputs that uses excesses can then be viewed as
unproductive; in the safety case, they can be viewed as segments that encounter more accidents than
they should. The underlying assumption in this approach is that accidents are unavoidable; however, if
one can identify the optimum for a given location, any “excess accident” occurrence can then be
evaluated appropriately in terms of improvement need by ranking the segments in descending order. In
the current study, since the 12 accident inputs are available from step four, they were evaluated to
determine segments where excess accident occurrence took place in the period 2002-2006. These
excesses are termed “slacks” in DEA terminology. Segments were then ranked in descending priority
based on a determination of slacks on a location-specific basis. The slacks also represent the desirable
reduction in the input. The advantage of this approach is that targets are now determined on a
location-specific basis, and not as a general system-level mean threshold alone. A system-level mean
threshold is useful if it is determined through aggregation of location-specific thresholds. However, any
11

number of location-specific threshold combinations can result in an arbitrarily chosen system level
threshold. This is a primary reason why the DEA procedure is appealing – not only does it allow for
segment-specific targets; the reduction targets can be multidimensional (as in all 12 accidents
theoretically decreasing), so that improvement strategies can be identified based on the types of
accidents that require reduction. A total of 1,213 segments were determined to have excess accidents,
with an average targeted reduction of 28.77 accidents per segment. This is a target estimate for a 5-
year period. Hence, on an annual basis, the mean targeted reduction in accident frequency is 5.76. Of
the 1,213 segments, 188 segments called for reductions in roadside-related accidents such as fixed
objects and overturns, while 506 segments called for reductions in rear-ends. Sideswipe reduction
segments numbered 411, while 1 segment required head-on targets, 302 segments required same
direction, and 225 segments required other collision type reductions. This list of targeted segments was
provided to WSDOT earlier and is not included in this report. What is useful from this prioritization
process is that rankings can be assigned on the basis of the types of reductions. A priority-one location
is defined as a location where head-on, fixed-object, and overturn accident targets are recommended.
A priority-two location is defined as a location where reduction targets are primarily for multi-vehicle
accident locations. A priority-three location is defined as a location primarily tagged as a “tracking
location of interest.” That is, these are locations where reduction targets are not recommended;
however, for the purpose of future tracking due to potentially greater-than-expected growth in accident
profiles, they are tagged to provide proactive guidance.
Based on the targeted reductions, a revised estimate of segment-specific costs and severity indexes can
be computed. This estimate can be viewed as the optimal cost-severity profile for the interstate system
when aggregated across all non-zero segments. This is a highly computationally intensive process due to
the large number of segments, and the fact that the objective function is multidimensional (total
12

societal cost, per-accident societal cost, total severity index, and per-accident severity index), run times
can exceed several hours, with no guarantee of convergence. Initial tests suggest a scenario where total
societal cost is likely to decrease system-wide, while there may be a marginal increase in per-accident
societal cost. This is to be expected, since targeted reductions substantially reduce the denominator in
per-accident cost computations.
Safety priority evaluation process step five: determining improvement strategies
Improvement strategies were independently identified based on the targeted accident type. For
example, if segment “I” was targeted for fixed-object reduction, then one possible countermeasure is to
reduce horizontal curvature if the fixed object on the roadside is not removable or outside the clear
zone. Some complexity remains in the identification of improvement strategies. For example, due to
reporting inaccuracies, segments with recommended reductions do not appear to have geometric
attributes suitable for treatment. For example, in certain point or near-point locations (less than 0.05
miles in length), a recommended reduction might focus on fixed-object accidents. The SRView log,
however, may show any fixed objects suitable for treatment within the milepost limits stated for the
segment. In such cases, improvement strategies have to be viewed in a longer window. As such, the
draft list of improvement strategies is premature; upon further examination and conferral with WSDOT
staff, it is hoped that a realistic set of strategies can be identified accounting for reporting errors and
most likely cause.
13

Conclusions and Recommendations
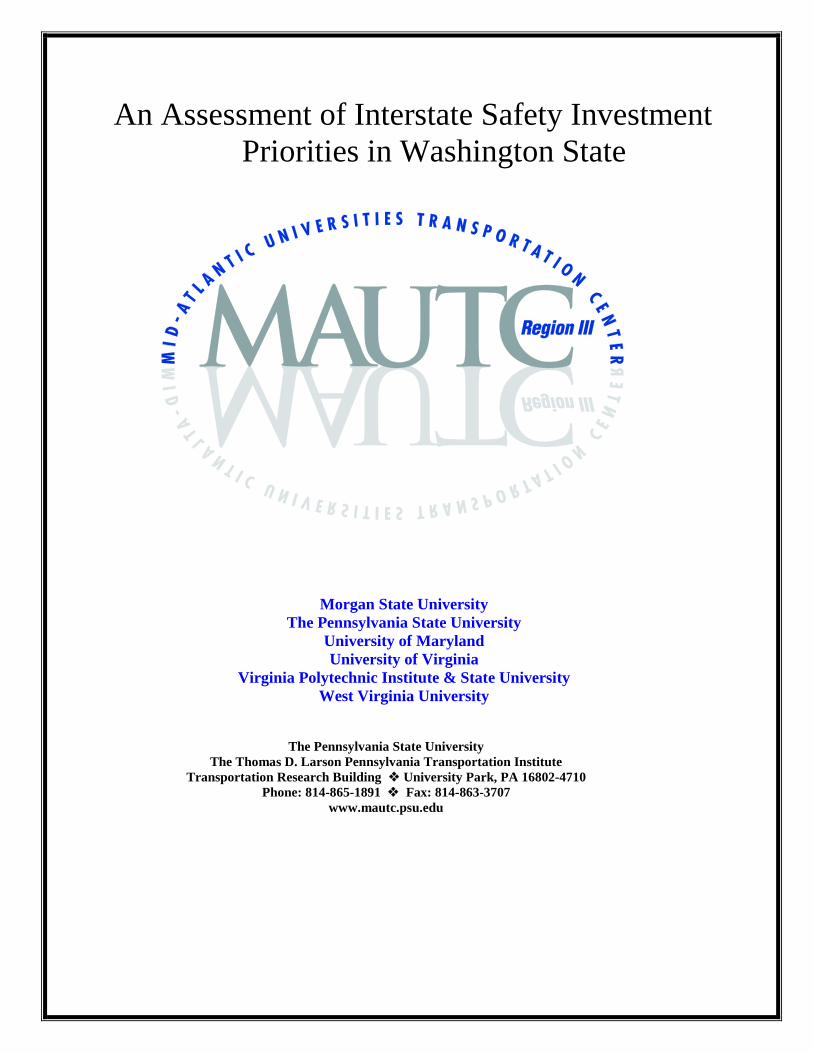
A step-wise procedure to systematically assess mainline interstate accident risk was presented in this
study. This procedure is summarized in Figure 2. A multi-objective approach was employed in order to
factor in multiple criteria for ranking of segments, while accounting for multiple accident types as inputs
in the ranking process. A data envelopment analysis procedure was used to rank segments on the basis
of excess accidents reported in the 5-year period 2002-2006. Segments were defined on the basis of
accident count clusters and flagged in importance of severity criteria based on interstate specific
averages. This maintained a consistent baseline within an interstate for comparing segments. However,
during the overall ranking process, all interstate segments with non-zero accident histories were
evaluated simultaneously to determine segment priorities. The data envelopment analysis procedure
was useful in the identification of reduction targets for specific accident types, segment by segment.
Using this reduction target as a desirable scenario, an estimate of overall safety improvement in terms
of societal cost and severity was computed. The reduction targets were also used in the identification of
improvement strategies for each candidate segment.
It was determined that out of a total of 1,528 bi-directional centerline miles of interstate network, a
total of 41 locations were rated priority one with a total length of 51.07 centerline directional miles and
a mean length of 1.25 miles. All of these locations required at least one recommended reduction in
head-on, fixed-object or overturn collisions. This targeted network length represents 3.34 percent of
the entire interstate mainline in Washington State.
14
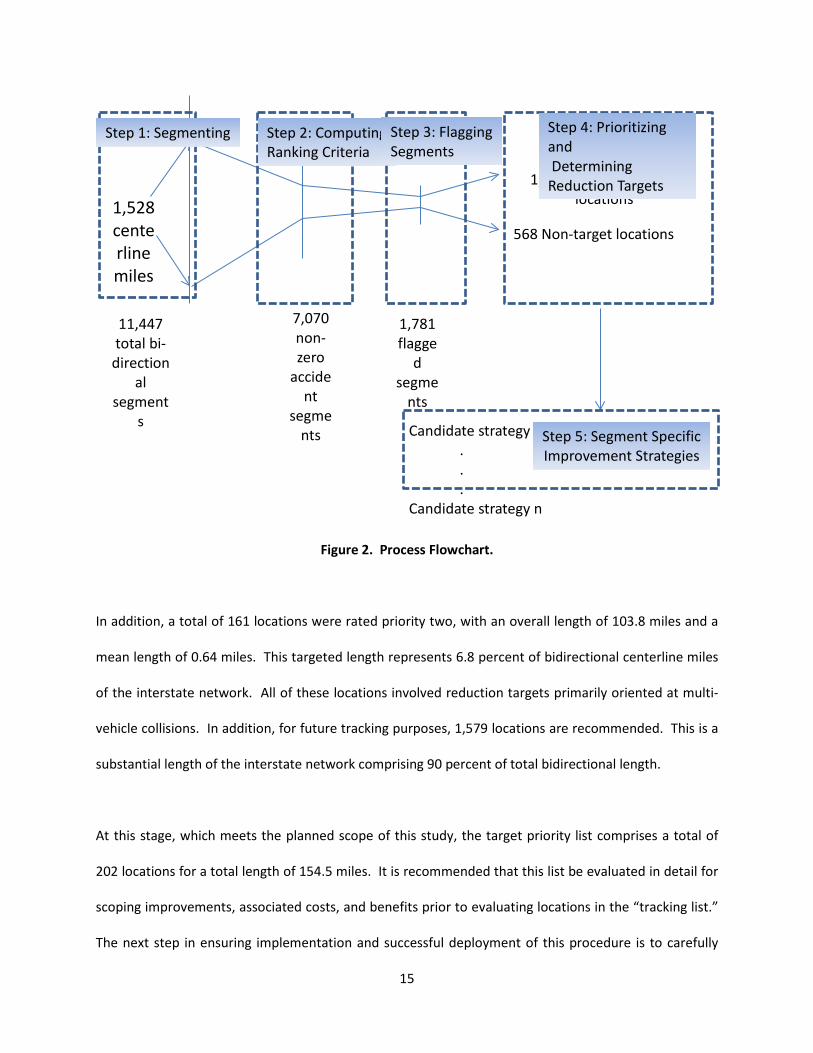
Figure 2. Process Flowchart.
In addition, a total of 161 locations were rated priority two, with an overall length of 103.8 miles and a
mean length of 0.64 miles. This targeted length represents 6.8 percent of bidirectional centerline miles
of the interstate network. All of these locations involved reduction targets primarily oriented at multi-
vehicle collisions. In addition, for future tracking purposes, 1,579 locations are recommended. This is a
substantial length of the interstate network comprising 90 percent of total bidirectional length.
At this stage, which meets the planned scope of this study, the target priority list comprises a total of
202 locations for a total length of 154.5 miles. It is recommended that this list be evaluated in detail for
scoping improvements, associated costs, and benefits prior to evaluating locations in the “tracking list.”
The next step in ensuring implementation and successful deployment of this procedure is to carefully
Candidate strategy 1 . . . Candidate strategy n
11,447 total bi-
directional
segments
7,070 non-zero
accident
segments
1,781 flagge
d segme
nts
1,213 Reduction target locations
568 Non-target locations 1,528 centerline miles
Step 1: Segmenting Step 2: Computing Ranking Criteria
Step 3: Flagging Segments
Step 4: Prioritizing and Determining Reduction Targets
Step 5: Segment Specific Improvement Strategies
15

evaluate cost improvement strategies and estimate associated benefits. Several procedures are
available here – to identify improvement scenarios using at least one low-cost and one high-cost
alternative, and then estimating the benefits for each alternative. Estimating benefits can be done using
accident reduction factors, if available. In the absence of accident reduction factors, statistical models
showing differences in geometric effects for Washington State interstates may be used. Once costs and
benefits are computed, one can systematically proceed to evaluate various measures of cost efficiency
and effectiveness using life-cycle and annualized benefits and costs.
16

References
1. Albin, R.B., Bullard, D.L., Jr., and Menges, W.L. (2001). “Washington State Cable Median Barrier,” Transportation Research Record, 1743:71-79.
2. Chayanan, S., Shankar, V.N., Sittikariya, S., Ulfarsson, G.F., Shyu, M.B., and Juvva, N. (2004). Median Crossover Crash Analysis and the Effectiveness of Median Barriers, Report No. WA-RD 580.1, Washington State Transportation Center.
3. Glad, R.W., Albin, R.B., McIntosh, D.M., and Olson, D.K. (2002). Median Treatment Study of Washington State Highways, Washington State Department of Transportation Report No. WA-RD 516.1, 24 pp.
4. Milton J., Shankar, V.N., and Mannering F.L. (2008). “Highway accident severities and the mixed logit model: An exploratory empirical analysis,” Accident Analysis and Prevention, 40(1):260-266.
5. Milton, J., and Mannering, F. (1998). “The relationship among highway geometrics, traffic-related elements and motor-vehicle accident frequencies,” Transportation, 25(4):395-413.
6. Shankar, V.N., Sittikariya, S., and Shyu, M.B. (2006). “Some Insights on Roadway Infrastructure Design for Safe Elderly Travel,” International Association of Traffic Safety Sciences, 30(1):21-26.
7. Shankar V.N., Ulfarsson, G.F., Pendyala, R.M., and Nebergall, M.B. (2003). “On the Modeling of Crashes Involving Pedestrians and Motorized Traffic,” Safety Science, 41(7):627-640.
8. Shankar, V.N., Albin, R.B., Milton, J.C., and Mannering, F.L. (1998). “Evaluating Median Cross-Over Likelihoods with Clustered Accident Counts: An Empirical Inquiry Using the Random Effects Negative Binomial Model.” Transportation Research Record, 1635:44-48.
9. Shankar V.N., Milton, J.C., and Mannering, F.L. (1997). “Modeling Accident Frequencies as Zero-Altered Probability Processes: An Empirical Inquiry,” Accident Analysis and Prevention, 29(6):829-837.
10. Shankar, V.N., Mannering, F.L., and Barfield, W. (1996). “Statistical Analysis of Rural Freeway Accident Severity.” Accident Analysis and Prevention, 28(3):391-401.
11. Shankar, V.N., Mannering, F.L., and Barfield, W. (1995). “Effect of Roadway Geometrics and Environmental Conditions on Rural Accident Frequencies.” Accident Analysis and Prevention, 27(3):371-389.
17