Embed Size (px)
Citation preview
Pratap S BirthalP K JoshiAnjani Kumar
Policy Paper 15
NATIONALCENTRE FORAGRICULTURAL ECONOMICS ANDPOLICY RESEARCH (ICAR)NEW DELHI, INDIA
Assessment of Research Prioritiesfor Livestock Sector in India
PublishedFebruary, 2002
Published byDr. MruthyunjayaDirector, NCAP
Printed atChandu PressD-97, ShakarpurDelhi - 110 092
Policy Paper 15
Assessment of Research Priorities for Livestock Sector in India
ii
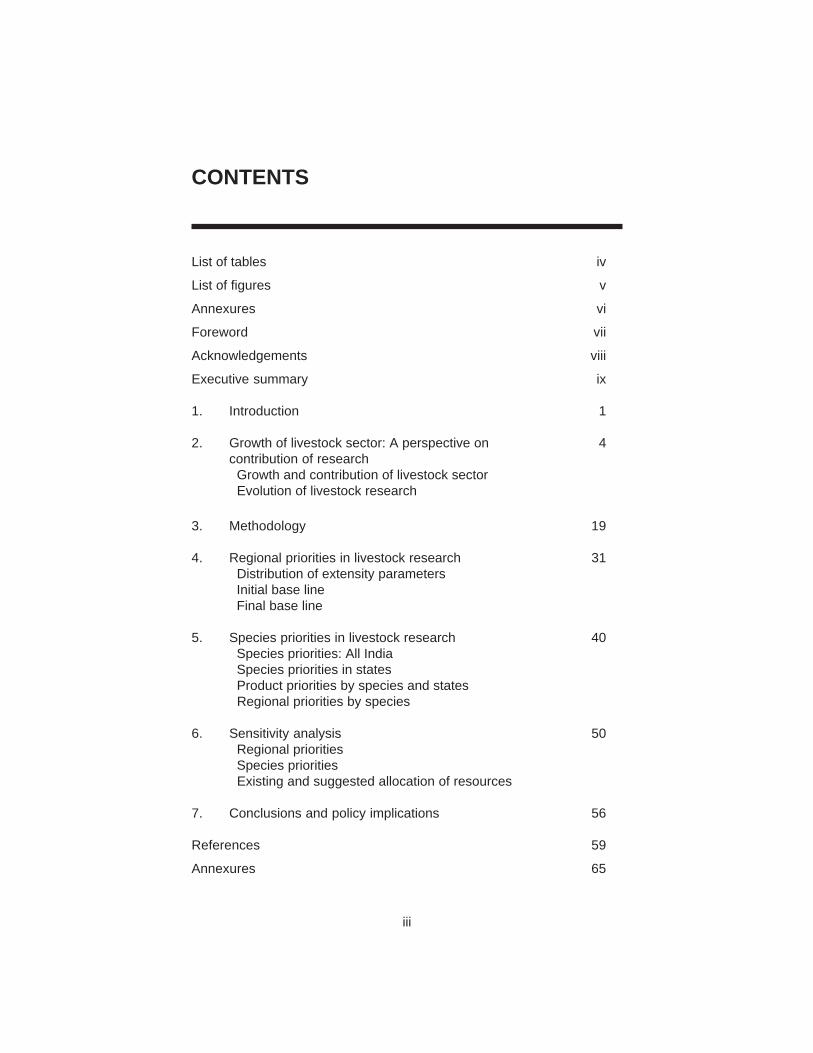
CONTENTS
List of tables iv
List of figures v
Annexures vi
Foreword vii
Acknowledgements viii
Executive summary ix
1. Introduction 1
2. Growth of livestock sector: A perspective on 4contribution of research Growth and contribution of livestock sector Evolution of livestock research
3. Methodology 19
4. Regional priorities in livestock research 31 Distribution of extensity parameters Initial base line Final base line
5. Species priorities in livestock research 40 Species priorities: All India Species priorities in states Product priorities by species and states Regional priorities by species
6. Sensitivity analysis 50 Regional priorities Species priorities Existing and suggested allocation of resources
7. Conclusions and policy implications 56
References 59
Annexures 65
iii
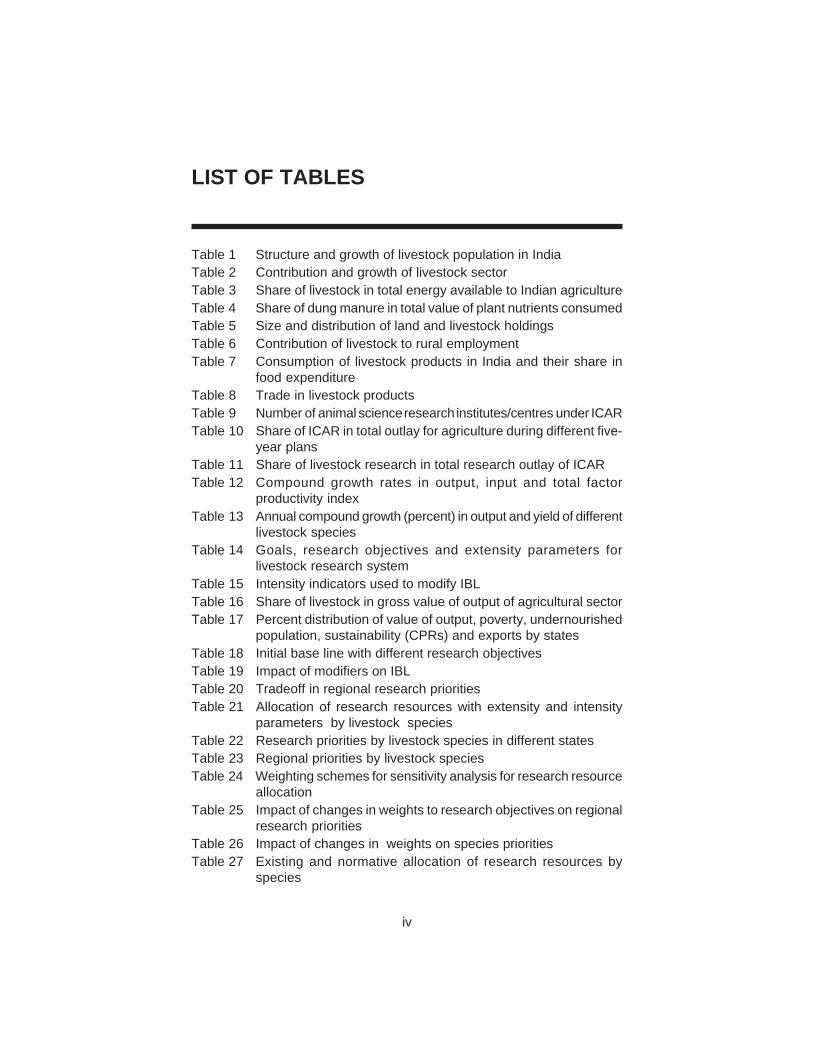
LIST OF TABLES
Table 1 Structure and growth of livestock population in IndiaTable 2 Contribution and growth of livestock sectorTable 3 Share of livestock in total energy available to Indian agricultureTable 4 Share of dung manure in total value of plant nutrients consumedTable 5 Size and distribution of land and livestock holdingsTable 6 Contribution of livestock to rural employmentTable 7 Consumption of livestock products in India and their share in
food expenditureTable 8 Trade in livestock productsTable 9 Number of animal science research institutes/centres under ICARTable 10 Share of ICAR in total outlay for agriculture during different five-
year plansTable 11 Share of livestock research in total research outlay of ICARTable 12 Compound growth rates in output, input and total factor
productivity indexTable 13 Annual compound growth (percent) in output and yield of different
livestock speciesTable 14 Goals, research objectives and extensity parameters for
livestock research systemTable 15 Intensity indicators used to modify IBLTable 16 Share of livestock in gross value of output of agricultural sectorTable 17 Percent distribution of value of output, poverty, undernourished
population, sustainability (CPRs) and exports by statesTable 18 Initial base line with different research objectivesTable 19 Impact of modifiers on IBLTable 20 Tradeoff in regional research prioritiesTable 21 Allocation of research resources with extensity and intensity
parameters by livestock speciesTable 22 Research priorities by livestock species in different statesTable 23 Regional priorities by livestock speciesTable 24 Weighting schemes for sensitivity analysis for research resource
allocationTable 25 Impact of changes in weights to research objectives on regional
research prioritiesTable 26 Impact of changes in weights on species prioritiesTable 27 Existing and normative allocation of research resources by
species
iv
LIST OF FIGURES
Figure 1 Regional priorities in livestock researchFigure 2 Existing allocation of research resources by speciesFigure 3 Suggested allocation of research resources by speciesFigure 4 Priorities in cattle researchFigure 5 Priorities in buffalo researchFigure 6 Priorities in goat researchFigure 7 Priorities in sheep researchFigure 8 Priorities in poultry researchFigure 9 Priorities in pig research
v
ANNEXURES
Annexure I Sources of information on extensity parameters andtheir modifiers
Annexure II Values of modifiers used for construction of FBLAnnexure III Research priority by individual commodity in different
statesAnnexure IV.1 Commodity priorities in cattle research in different statesAnnexure IV.2 Commodity priorities in buffalo research in different
statesAnnexure IV.3 Commodity priorities in goat research in different statesAnnexure IV.4 Commodity priorities in sheep research in different
statesAnnexure IV.5 Commodity priorities in poultry research in different
statesAnnexure IV.6 Commodity priorities in pig research in different statesAnnexure IV.7 Commodity priorities in camel research in different
states
vi
In its continuing efforts to provide inputs to research planning, NCAP hastaken up livestock sector for a detailed analysis. Livestock sector is a sunrisesector of Indian economy, and is expected to emerge as an engine ofgrowth of the agricultural sector in the decades to come. Growing humanpopulation, sustained economic growth, changing lifestyles of the upwardlymobile middle class, and increasing urban population are driving rapidgrowth in demand for food of animal origin. However at the same time,productivity growth of livestock remains constricted owing to a number offactors, such as huge livestock population, inadequate feed and foddersupply, and poor adoption of technologies. Thus, it is increasingly felt thatfuture growth has to be demand- and technology-driven. The importanceof livestock sector goes beyond its food production function. It suppliesdraught power, organic manure and domestic fuel. Livestock is the lifelineof millions of landless, marginal and small landholders who own a sizeableproportion of livestock wealth. Since resources available are becomingscarcer to meet the challenges, it is critical to objectively evaluate livestockresearch priorities. This study provides an objective assessment of macrolevel research priorities for the livestock sector, in terms of regions, speciesand commodities. It covers all states and union territories, eight livestockspecies and their products and services. The study also gives acomprehensive picture of growth and contribution of livestock sector in theIndian economy and also the evolution of livestock research in India.
The main findings of the study have been vetted by peers and also inmeetings with experts, policymakers and officials of the Government. It ishoped that the study will guide research resource allocation in the livestocksector for its accelerated growth.
MruthyunjayaDirector
FOREWORD
vii
ACKNOWLEDGEMENTS
The study is a part of NATP funded project on ‘Institutionalization of researchpriority setting, monitoring and evaluation, and networking of socialscientists’. It was taken up at the behest of the World Bank Review Missionfor National Agricultural Technology Project, and with the objective ofimproving efficiency of animal science research through better targeting ofresearch resources in terms of regions, species and commodities. Manypersons have contributed to this endeavor. Dr. James G. Ryan, Memberof the Mission, and the former Director-General, International CropsResearch Institute for the Semi-Arid Tropics, Patancheru (India) wasinstrumental in guiding the authors right from the initiation to the completionof this study. Dr. Mruthyunjaya, Director, and Dr. Dayanatha Jha, NationalProfessor, from the National Centre for Agricultural Economics and PolicyResearch, New Delhi have been a source of encouragement and guidanceto us. Dr. S.N. Mishra, former Director, Institute of Economic Growth, NewDelhi, Dr. S. S. Acharya, Director, Institute of Development Studies, Jaipur,Dr. C. Ramasamy, Director, Centre for Agriculture and Rural DevelopmentStudies, Coimbatore, Dr. M.P. Yadav, Director, Indian Veterinary ResearchInstitute, Izatnagar and Dr. S. Hirashima, Meiji-Gokui University, Tokyoprovided valuable suggestions on earlier drafts of the study. We are thankfulto all of them. The results of this study were earlier presented before theXth Five Year Plan Working Group on Animal Husbandry comprising Dr.P.N. Bhat, Dr. R.M. Acharya, Dr. Kiran Singh, former Deputy Director-Generals, Indian Council of Agricultural Research, New Delhi and othersenior professionals from the National Agricultural Research System. Thediscussion with the Group has been useful in bringing out the final product.We are grateful to all of them.
We are also grateful to our colleagues, Dr. Suresh Pal, Dr. Ramesh Chand,Dr. S. Selvarajan, Dr. B. C. Barah and Dr. P. Adhiguru for their valuablesuggestions and help. Mr. Jabir Ali and Ms Anamika Kaushik providedcomputational assistance. Ms Umeeta Ahuja helped in typesetting. Weare thankful to them.
Authors
viii
EXECUTIVE SUMMARY
Livestock is emerging as a driving force in the growth of agricultural sectorof India. Several factors underline this development. Contribution of livestockto agricultural gross domestic product (AgGDP) has been rising; it increasedfrom 14 percent in 1980-81 to 23 percent in 1997-98. While the share ofagricultural sector in gross domestic product (GDP) declined from about35 percent to 26 percent during this period. Demand for livestock productsis income-elastic, and sustained growth in per capita income, rising urbanpopulation, and changing food habits and lifestyles are fuelling further growthin it.
The importance of livestock goes beyond its food production function. Itprovides draught power and organic manure for agriculture and fuel fordomestic purposes. Livestock is an important source of income andemployment for millions of landless and small landholders particularly inthe less favored environments. In general, livestock wealth is more equitablydistributed than land. Growth in livestock sector is thus reckoned to reduceinterpersonal and interregional inequities, and alleviate poverty.
On the other hand, there are apprehensions that the current growthmomentum may not sustain long. A number of supply side factors such asburgeoning livestock population and its very low productivity, feed andfodder scarcity, deterioration in common grazing lands, inappropriatedisease management, lack of appropriate technologies, poor infrastructure,sociocultural and legal rigidities and unfavorable external market conditionsmay act as impediments on the growth process. The past growth in manylivestock outputs has largely been population-driven. Therefore, technologywill be a key factor in sustaining the growth momentum. While the researchresources are becoming scarcer to meet the emerging challenges. Theseforces thus underscore the need for a critical and objective evaluation oflivestock research priorities at the national and regional level. This studyprovides an objective assessment of macro level research priorities for thelivestock sector.
The study generates indices of research priorities for the livestock sectorin terms of regions, species and commodities keeping in view the nationaldevelopmental goals. It covers all states and union territories1 , eightlivestock species, and their products and services. Required information
1 The study reports results for 25 states only.
ix
was collected from numerous published and unpublished sources. Multi-criteria scoring model, which is flexible to accommodate multiple researchobjectives, was used to assess research priorities. Research objectiveshave been derived from the developmental goals mentioned in differentfive-year plans. The objectives are: growth (efficiency), equity, sustainabilityand trade participation. The analysis begins by assessing priorities withthe objective of improving efficiency, and then modifies these successivelyby superimposing other developmental goals to examine the tradeoffsbetween goals/objectives in the process of resource allocation. All goalshave been considered equally important and assigned equal weights inthe analysis.
Livestock research receives about 19 percent of the agricultural researchresources. This however has witnessed considerable variation over time.In 1970s, share of livestock research was 27 percent, higher than the relativecontribution of livestock sector to AgGDP. The emphasis during this periodwas to strengthen research infrastructure. The share of livestock researchfell drastically (14 %) in 1980s, but increased in 1990s. Yet, it is lowcompared to its contribution to AgGDP. At present, India has well-developedresearch infrastructure with species/commodity orientation.
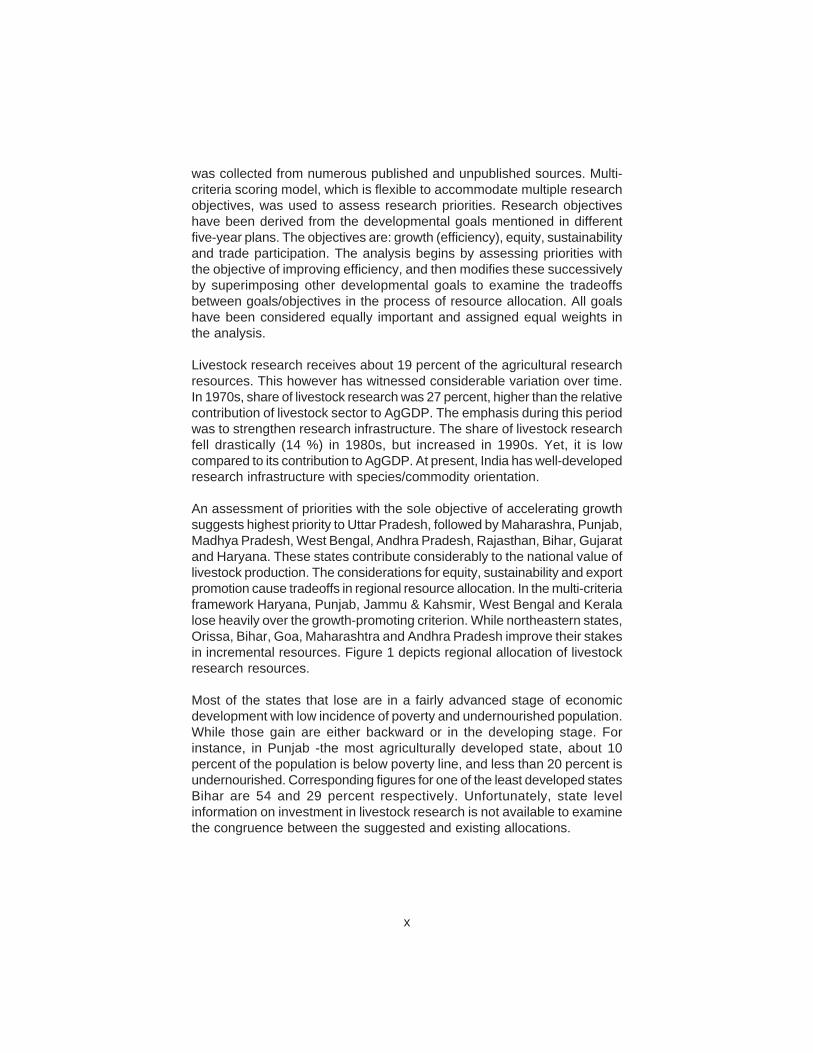
An assessment of priorities with the sole objective of accelerating growthsuggests highest priority to Uttar Pradesh, followed by Maharashra, Punjab,Madhya Pradesh, West Bengal, Andhra Pradesh, Rajasthan, Bihar, Gujaratand Haryana. These states contribute considerably to the national value oflivestock production. The considerations for equity, sustainability and exportpromotion cause tradeoffs in regional resource allocation. In the multi-criteriaframework Haryana, Punjab, Jammu & Kahsmir, West Bengal and Keralalose heavily over the growth-promoting criterion. While northeastern states,Orissa, Bihar, Goa, Maharashtra and Andhra Pradesh improve their stakesin incremental resources. Figure 1 depicts regional allocation of livestockresearch resources.
Most of the states that lose are in a fairly advanced stage of economicdevelopment with low incidence of poverty and undernourished population.While those gain are either backward or in the developing stage. Forinstance, in Punjab -the most agriculturally developed state, about 10percent of the population is below poverty line, and less than 20 percent isundernourished. Corresponding figures for one of the least developed statesBihar are 54 and 29 percent respectively. Unfortunately, state levelinformation on investment in livestock research is not available to examinethe congruence between the suggested and existing allocations.
x
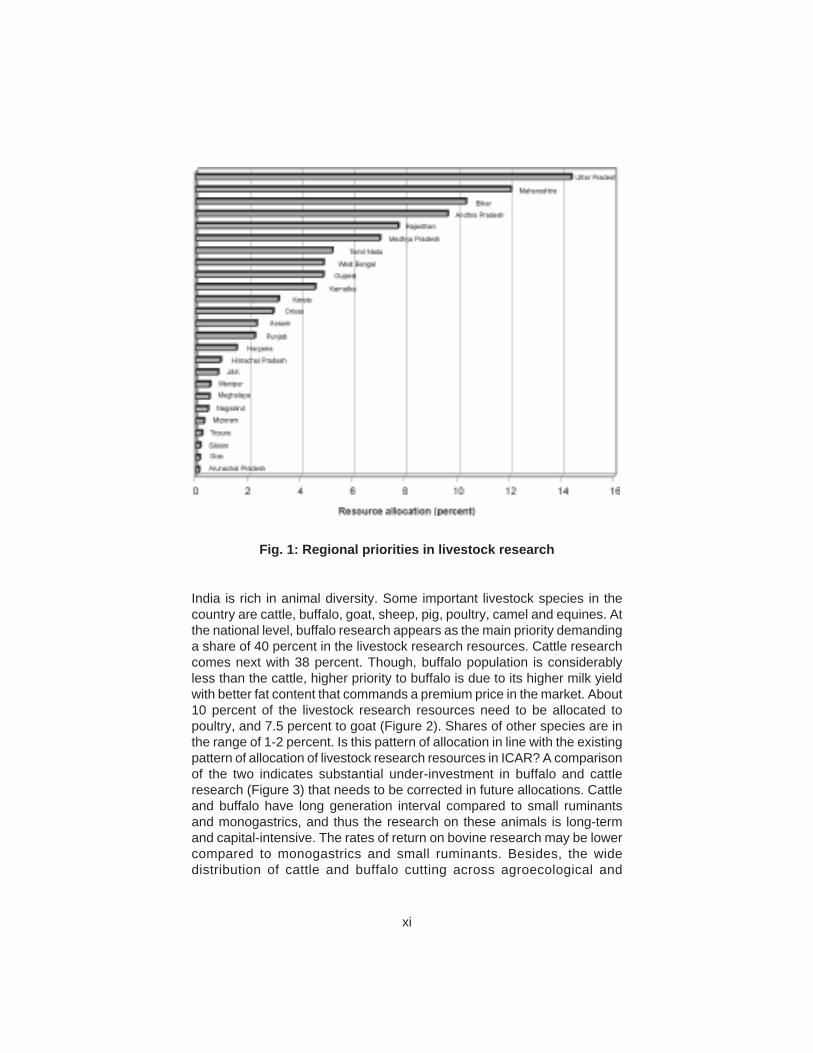
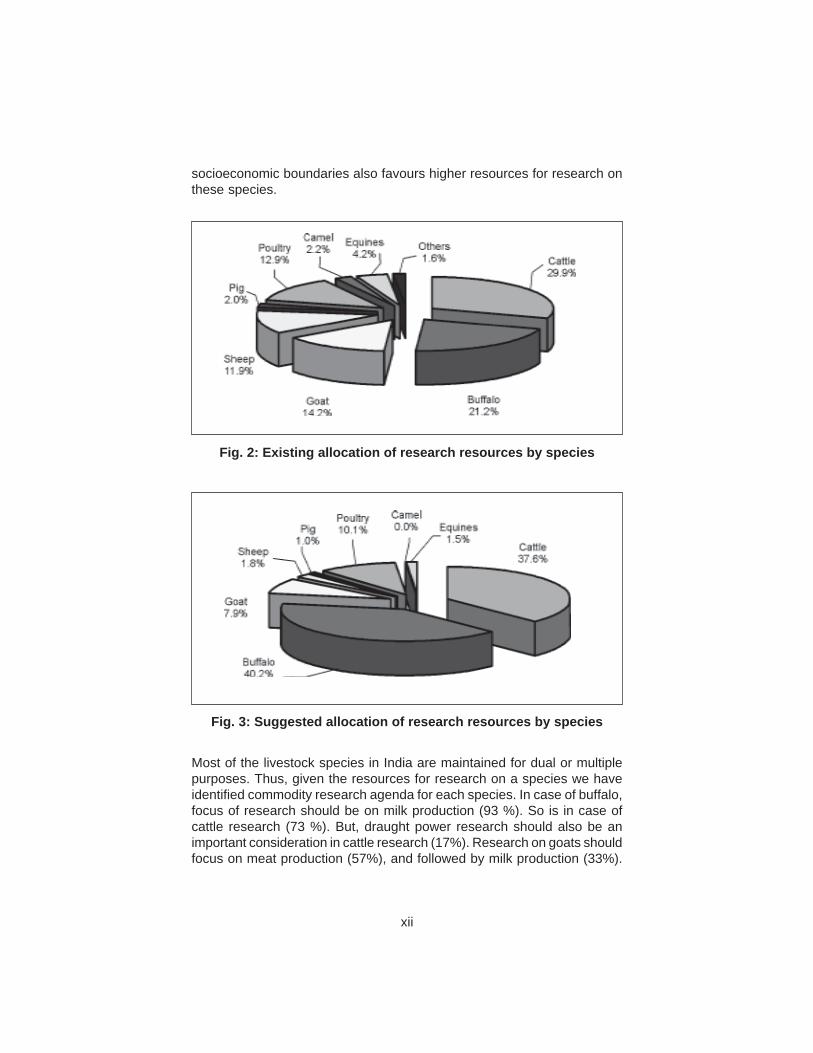
India is rich in animal diversity. Some important livestock species in thecountry are cattle, buffalo, goat, sheep, pig, poultry, camel and equines. Atthe national level, buffalo research appears as the main priority demandinga share of 40 percent in the livestock research resources. Cattle researchcomes next with 38 percent. Though, buffalo population is considerablyless than the cattle, higher priority to buffalo is due to its higher milk yieldwith better fat content that commands a premium price in the market. About10 percent of the livestock research resources need to be allocated topoultry, and 7.5 percent to goat (Figure 2). Shares of other species are inthe range of 1-2 percent. Is this pattern of allocation in line with the existingpattern of allocation of livestock research resources in ICAR? A comparisonof the two indicates substantial under-investment in buffalo and cattleresearch (Figure 3) that needs to be corrected in future allocations. Cattleand buffalo have long generation interval compared to small ruminantsand monogastrics, and thus the research on these animals is long-termand capital-intensive. The rates of return on bovine research may be lowercompared to monogastrics and small ruminants. Besides, the widedistribution of cattle and buffalo cutting across agroecological and
xi
Fig. 1: Regional priorities in livestock research
Most of the livestock species in India are maintained for dual or multiplepurposes. Thus, given the resources for research on a species we haveidentified commodity research agenda for each species. In case of buffalo,focus of research should be on milk production (93 %). So is in case ofcattle research (73 %). But, draught power research should also be animportant consideration in cattle research (17%). Research on goats shouldfocus on meat production (57%), and followed by milk production (33%).
xii
Fig. 2: Existing allocation of research resources by species
Fig. 3: Suggested allocation of research resources by species
socioeconomic boundaries also favours higher resources for research onthese species.
Investment in sheep research should be mainly for meat production (76%).Wool production shares only 11.4 percent. Poultry research resourcesshould be allocated to meat and eggs in the ratio of 2:1. Meat productionshould be the main concern of pig research. For camel and equine, researchshould focus on improving their draughtability. The relative emphasishowever varies greatly across states depending on the utility of productsand services provided by a species. The details are provided in this study.
Most of the species are widely distributed cutting across agroclimaticboundaries, but in varying density depending on their relative utility inprovision of food and other products and services. The species prioritiestherefore vary across regions. Cattle research should target mainly thewestern region (Madhya Pradesh, Rajasthan and Maharashtra). UttarPradesh, Bihar, West Bengal, Orissa, Tamilnadu, Assam and Gujarat areother target domains for cattle research. Most of these states are rainfedand have sizeable number of cattle for both milk and draught supplies.Buffalo research activities should concentrate in Uttar Pradesh in the north,Madhya Pradesh, Rajasthan and Maharashtra in the west, Andhra Pradeshin the south and Bihar in the east. Goat research should largely targeteastern states mainly Bihar and West Bengal that together put a claim forabout 43 percent of national goat research resources. Target domain forsheep research is southern region. Andhra Pradesh and Maharashtra arethe main candidates for incremental poultry research resources. Pigresearch should focus northeastern states, and Bihar and Uttar Pradesh.Target domain for camel research is Rajasthan. Uttar Pradesh ranks highestin priority for equine research. The regional distribution of species-wiseresearch resources thus indicates the necessity of taking into considerationthe regional distribution of different livestock species and their relative utilitiesin the process of allocation of research resources.
Assumption of equal weights to different research objectives is liable tocriticism, as the developmental goals themselves never receive equalemphasis. Thus, sensitivity of the regional and species priorities wasexamined by attaching varying importance to different developmental goals(research objectives). With higher importance to growth (efficiency) thereare no significant changes in priority ranking of states. However, the statesof Haryana, Punjab, Jammu & Kashmir, Madhya Pradesh and WestBengal are benefited considerably in terms of higher share in nationalresearch resources. While the shares of Andhra Pradesh, Maharashtra,Bihar and most of the northeastern states are reduced significantly. Otherstates either gain or lose at the margin. Higher emphasis on both efficiencyand equity also results in a similar pattern of distribution. Species prioritiestoo are not much sensitive to changes in weights to developmental goalsof research.
xiii
In conclusion, the study suggests target domains, species and commoditiesfor livestock research. It makes tradeoffs between efficiency and otherdevelopmental goals explicit. There are obvious limitations of dataparticularly the research investment data at state level. Reallocation andredeployment of resources has no operational significance in absence ofsuch information. The research administrators and managers may use theirwisdom and experience to moderate the results. Further, the study has notattempted the research agenda in terms of disciplinary research, whichconcerns the demand-side aspects of animal science research and requiresconsiderable amount of information at the micro level. Next phase of thisstudy targets this.
xiv
1
I INTRODUCTION
Background
Livestock is an important segment of agricultural sector in India. In 1998-99, it contributed about 23 percent to the agricultural gross domestic product(AgGDP). Livestock makes multi-faceted contributions to socioeconomicdevelopment. Its role in food and nutritional security has been wellrecognized since times immemorial. But, in the mixed crop-livestock systemsits importance goes beyond direct food production function. It suppliesdraught power and organic manure to crop sector, and hides, skins, bones,blood and fiber to the industries. Livestock in India is kept mainly by thesmall landholders and the landless that constitute bulk of the ruralpopulation. Thus, by being as an important means of income andemployment for these households livestock helps alleviate poverty andsmoothen income distribution. In addition, livestock asset can be easilyconverted into cash, and thus acts as a cushion against shocks of cropfailure particularly in the less favored environments.
Livestock makes substantial contributions towards conservation ofenvironment. By utilizing huge amounts of crop residues and byproductsas feed and fodder it contributes positively to the environment. In addition,utilization of crop residues and byproducts by the animals makes substantialland available for food production, which otherwise would have been neededfor fodder production. Direct contributions of livestock in terms of suppliesof draught power and dung (organic manure and domestic fuel) save non-renewable environmental polluting energy sources (chemical fertilizers,diesel, petrol, etc.). Thus, in view of such interactions between crop andlivestock it is increasingly realized that livestock production would be moresustainable and growth-promoting in the mixed cropping systems as inIndia (Sere and Steinfeld 1996, Hann et al. 1997).
Emerging economic forces are creating both challenges and opportunitiesfor the livestock sector. Perpetual growth in human population andsustained growth in per capita incomes are driving rapid growth in demandfor animal food. There are estimates that by 2020 demand for milk, meatand eggs under different income and population growth scenarios wouldbe in the range of 126-183, 6.3-12.1 and 9.5-18.5 million tons respectively(Kumar 1998). In the recent past, livestock outputs (milk, meat and egg)have grown at an annual rate of about 5 percent. If these trends were tocontinue future demand for various livestock products could be met from
2
domestic supplies. Serious doubts have however been expressed regardingsustainability of these trends because these have by and large beenpopulation-driven (Birthal 2000).
Productivity of Indian livestock is low. For instance, cattle milk yield is abouthalf of the world average of 2072 kg/animal/annum, and just 12-15 percentof the yield in the USA, Canada and Israel. Productivity of species otherthan dairy and poultry has been stagnating at an extremely low level. Thesefigures suggest considerable scope for improving livestock productivity inIndia.
There is realization that WTO regime will exert more pressure on livestockproduction to be efficient to meet the challenges of global competition. Atthe current level of productivity, export competitiveness of Indian livestockproducts is ambiguous. There is an anxiety that cheap imports of livestockproducts would threaten the Indian livestock industry (Sharma and Sharma2000). Further, there is increasing concern about the interaction betweeneconomic competitiveness and a number of social factors such as poverty,unemployment, food and nutritional security, and sustainability. Livestockis a means of livelihood for millions of landless, marginal and smalllandholders who are often poor and this group would be the most vulnerableto the forces of economic competition. To meet the challenges ofglobalization the key lies in continuous generation and dissemination oftechnologies that improve production efficiency of livestock. Well-targetedlivestock research and development programs can meet the multiplechallenges.
Evidences indicate very high payoffs to investment in livestock research(Kumar et al. 1977, Gaddi and Kunal 1996, Kumar and Birthal 2001), whichimply that there is enormous scope to invest in livestock research.Unfortunately, the resources for agricultural research are limited and arebecoming scarce. India spends only about 0.5 percent of AgGDP onagricultural research. This is below the average of the developed countries(2.5 %) as well as the developing countries (0.7 %). There is little optimismthat, despite high rates of returns, investment in agriculture and livestockresearch will increase substantially at least in the immediate future.Nonetheless, there is scope to improve the growth of livestock sector byaugmenting the productivity of different livestock species through bettertargeting of R&D efforts. That task necessitates objective articulation ofpriorities for research.
In recent years, priority setting has established itself an important tool inthe management of limited research resources. It aims to improve strategicplanning and accomplish efficient allocation of scarce research resources
3
to improve research efficiency within the framework of national policy goals(Contant 2001). Priority setting helps (i) review existing resource allocations,(ii) update research agenda, (iii) make resource allocations more transparentand unambiguous, and (iv) strengthen credibility of the institution in solicitingsupport for research.
Historically, the process of agricultural research resource allocation in Indiahas largely been based on informed scientific opinion concerning problemsand opportunities. This involves a lot of subjectivity. The new problemsand challenges are calling for more objective and transparent mechanismsto allocate research resources. The new challenges include expandingresearch system, chronic scarcity of resources for research and increasingseverity and complexity of research needs. These necessitate a systematicassessment of priorities for livestock research.
In a seminal work, Jha, et al. (1995) generated quantitative estimates forallocation of agricultural research resources across regions andcommodities. The study also provided useful insights for setting prioritiesfor the livestock sector. The thrust of the study was on livestock products.In practice however species is the focus of research. This study is an attemptto build on the earlier attempts to assess research priorities for livestocksector for regions, species and commodities.
Objectives
The specific objectives of this study are:
• To assess livestock research priorities to meet the economic andsocial objectives.
• To examine the tradeoffs between economic and social objectivesin allocation of livestock research resources.
Organization of the Study
The study is organized into seven chapters. The next chapterprovides an overview of the importance of livestock, and evolution oflivestock research, and its impact. Chapter III describes analytical frameworkemployed to assess research priorities. Regional priorities in livestockresearch are presented in Chapter IV. Species and commodity priorities atnational and regional level are discussed in Chapter V. Chapter VI teststhe robustness of the results by examining the sensitivity of priorities tochanges in policy emphasis. The last chapter presents major conclusionsand policy implications.
4
II GROWTH OF LIVESTOCK SECTOR: APERSPECTIVE ON THE CONTRIBUTIONOF RESEARCH
Predominance of mixed crop livestock systems is one of the most importantcharacteristics of Indian agrarian economy, wherein crops and livestockcontribute towards the growth and sustainability of each other through input-output linkages. For the last few decades, both the crop and livestock sectorshave been growing satisfactorily, the latter however has grown faster. Since1970, livestock sector output has been growing at an annual rate of about3.6 percent compared to pre-1970 growth rate of 1.3 percent. The highergrowth in later period was on account of market forces and technologicalchange, and facilitated by increased availability of feeds and fodder,investment in animal health, and development of marketing network forlivestock products. This chapter assesses the growth and contribution oflivestock sector in the light of expanding livestock research system in thecountry.
Growth and Contribution of Livestock Sector
Livestock population
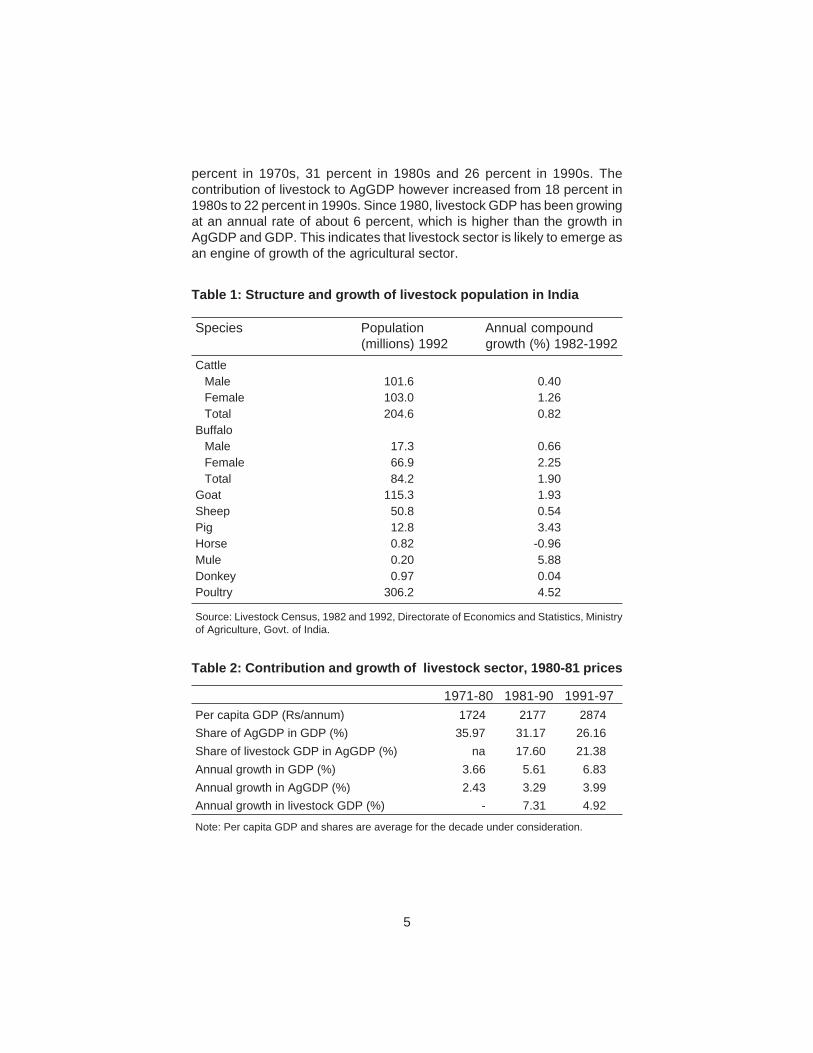
India possesses one of the largest livestock wealth in the world. In 1992, ithad 205 million cattle, 84 million buffaloes, 115 million goats, 51 millionsheep, 13 million pigs, 2 million equines and 306 million poultry birds (Table1). And, the population of almost all the species has been growing. Theobserved pattern of growth however indicates a shift towards economicallymore efficient species such as buffalo, pig, goat and poultry. Further, incase of bovines the incremental growth is less in population of malescompared to females mainly due to substitution of animal draught powerby mechanical power. This shows that livestock sector of India is bothexpanding and adapting to emerging socioeconomic, environmental andtechnological forces.
Contribution to AgGDP
Table 2 presents trends in contribution of livestock sector to gross domesticproduct (GDP) and agricultural gross domestic product (AgGDP).Agricultural sector (including crops, livestock, fisheries, forestry) contributedabout 40 percent to the GDP in 1960s. This gradually decreased to 36
5
Table 2: Contribution and growth of livestock sector, 1980-81 prices
1971-80 1981-90 1991-97Per capita GDP (Rs/annum) 1724 2177 2874Share of AgGDP in GDP (%) 35.97 31.17 26.16Share of livestock GDP in AgGDP (%) na 17.60 21.38Annual growth in GDP (%) 3.66 5.61 6.83Annual growth in AgGDP (%) 2.43 3.29 3.99Annual growth in livestock GDP (%) - 7.31 4.92
Note: Per capita GDP and shares are average for the decade under consideration.
Table 1: Structure and growth of livestock population in India
Species Population Annual compound(millions) 1992 growth (%) 1982-1992
CattleMale 101.6 0.40Female 103.0 1.26Total 204.6 0.82
BuffaloMale 17.3 0.66Female 66.9 2.25Total 84.2 1.90
Goat 115.3 1.93Sheep 50.8 0.54Pig 12.8 3.43Horse 0.82 -0.96Mule 0.20 5.88Donkey 0.97 0.04Poultry 306.2 4.52
Source: Livestock Census, 1982 and 1992, Directorate of Economics and Statistics, Ministryof Agriculture, Govt. of India.
percent in 1970s, 31 percent in 1980s and 26 percent in 1990s. Thecontribution of livestock to AgGDP however increased from 18 percent in1980s to 22 percent in 1990s. Since 1980, livestock GDP has been growingat an annual rate of about 6 percent, which is higher than the growth inAgGDP and GDP. This indicates that livestock sector is likely to emerge asan engine of growth of the agricultural sector.
6
Inputs to crop sector
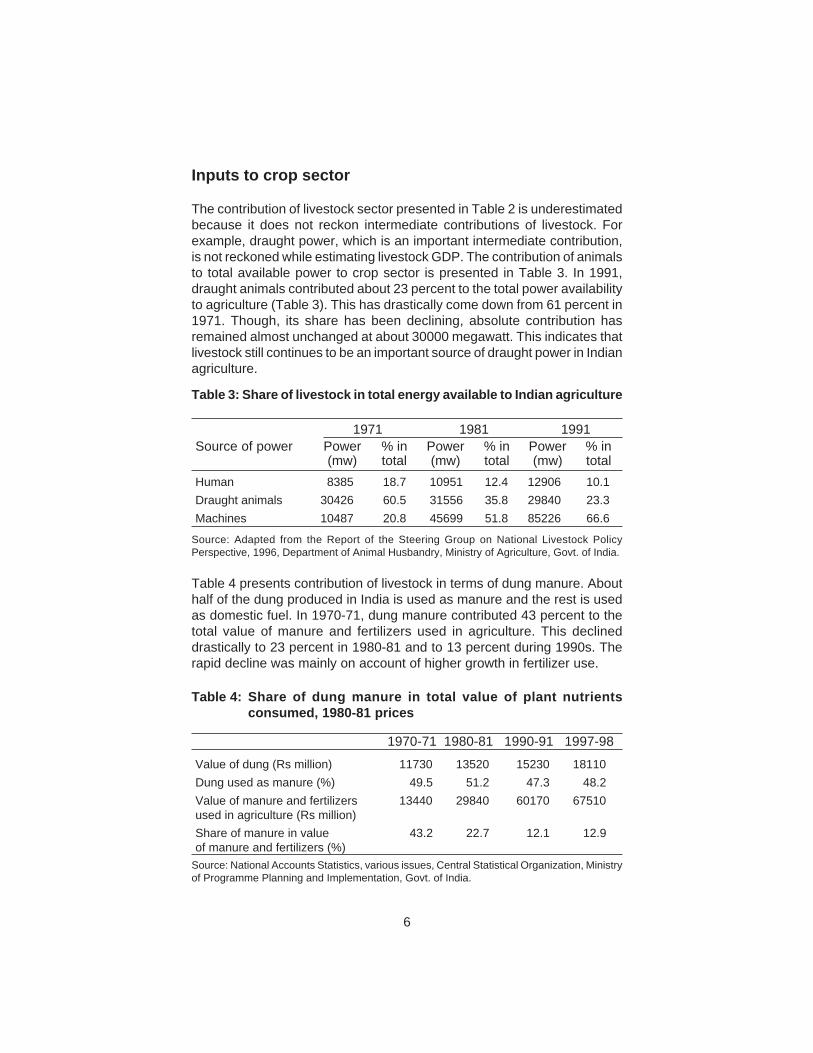
The contribution of livestock sector presented in Table 2 is underestimatedbecause it does not reckon intermediate contributions of livestock. Forexample, draught power, which is an important intermediate contribution,is not reckoned while estimating livestock GDP. The contribution of animalsto total available power to crop sector is presented in Table 3. In 1991,draught animals contributed about 23 percent to the total power availabilityto agriculture (Table 3). This has drastically come down from 61 percent in1971. Though, its share has been declining, absolute contribution hasremained almost unchanged at about 30000 megawatt. This indicates thatlivestock still continues to be an important source of draught power in Indianagriculture.
Table 4 presents contribution of livestock in terms of dung manure. Abouthalf of the dung produced in India is used as manure and the rest is usedas domestic fuel. In 1970-71, dung manure contributed 43 percent to thetotal value of manure and fertilizers used in agriculture. This declineddrastically to 23 percent in 1980-81 and to 13 percent during 1990s. Therapid decline was mainly on account of higher growth in fertilizer use.
Table 3: Share of livestock in total energy available to Indian agriculture
1971 1981 1991Source of power Power % in Power % in Power % in
(mw) total (mw) total (mw) totalHuman 8385 18.7 10951 12.4 12906 10.1Draught animals 30426 60.5 31556 35.8 29840 23.3Machines 10487 20.8 45699 51.8 85226 66.6
Source: Adapted from the Report of the Steering Group on National Livestock PolicyPerspective, 1996, Department of Animal Husbandry, Ministry of Agriculture, Govt. of India.
Table 4: Share of dung manure in total value of plant nutrientsconsumed, 1980-81 prices
1970-71 1980-81 1990-91 1997-98Value of dung (Rs million) 11730 13520 15230 18110Dung used as manure (%) 49.5 51.2 47.3 48.2Value of manure and fertilizers 13440 29840 60170 67510used in agriculture (Rs million)Share of manure in value 43.2 22.7 12.1 12.9of manure and fertilizers (%)
Source: National Accounts Statistics, various issues, Central Statistical Organization, Ministryof Programme Planning and Implementation, Govt. of India.
7
Employment and poverty
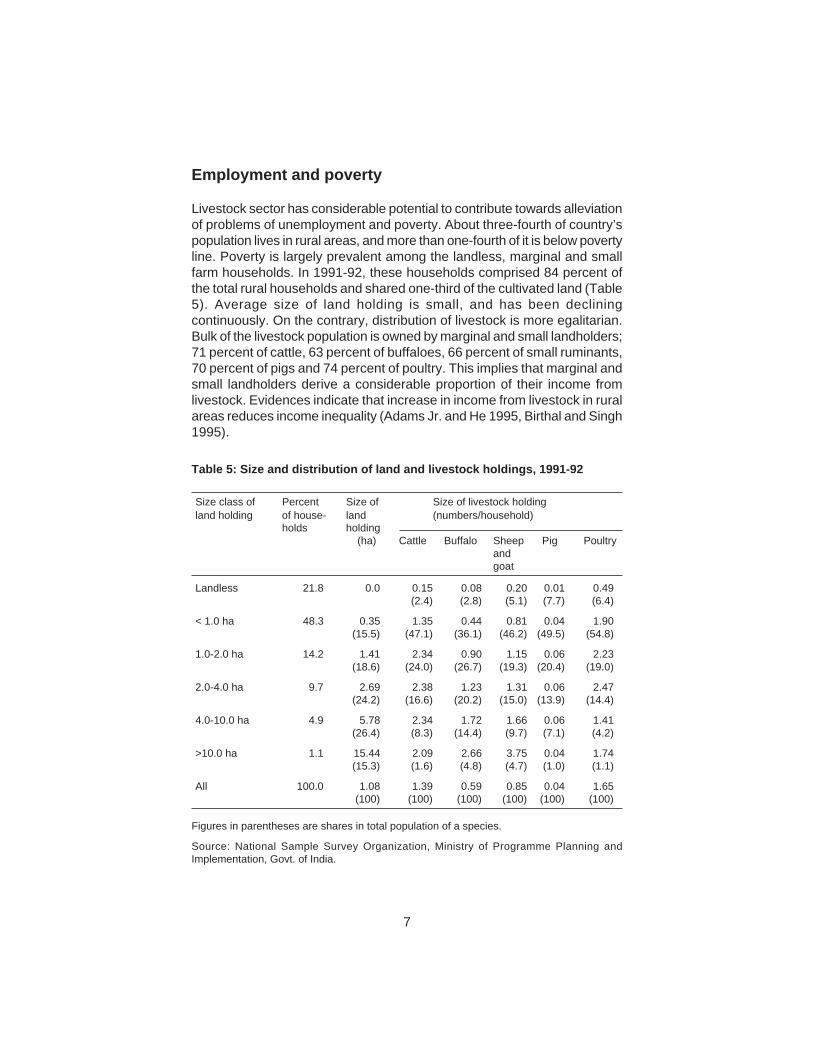
Livestock sector has considerable potential to contribute towards alleviationof problems of unemployment and poverty. About three-fourth of country’spopulation lives in rural areas, and more than one-fourth of it is below povertyline. Poverty is largely prevalent among the landless, marginal and smallfarm households. In 1991-92, these households comprised 84 percent ofthe total rural households and shared one-third of the cultivated land (Table5). Average size of land holding is small, and has been decliningcontinuously. On the contrary, distribution of livestock is more egalitarian.Bulk of the livestock population is owned by marginal and small landholders;71 percent of cattle, 63 percent of buffaloes, 66 percent of small ruminants,70 percent of pigs and 74 percent of poultry. This implies that marginal andsmall landholders derive a considerable proportion of their income fromlivestock. Evidences indicate that increase in income from livestock in ruralareas reduces income inequality (Adams Jr. and He 1995, Birthal and Singh1995).
Table 5: Size and distribution of land and livestock holdings, 1991-92
Size class of Percent Size of Size of livestock holdingland holding of house- land (numbers/household)
holds holding(ha) Cattle Buffalo Sheep Pig Poultry
andgoat
Landless 21.8 0.0 0.15 0.08 0.20 0.01 0.49(2.4) (2.8) (5.1) (7.7) (6.4)
< 1.0 ha 48.3 0.35 1.35 0.44 0.81 0.04 1.90(15.5) (47.1) (36.1) (46.2) (49.5) (54.8)
1.0-2.0 ha 14.2 1.41 2.34 0.90 1.15 0.06 2.23(18.6) (24.0) (26.7) (19.3) (20.4) (19.0)
2.0-4.0 ha 9.7 2.69 2.38 1.23 1.31 0.06 2.47(24.2) (16.6) (20.2) (15.0) (13.9) (14.4)
4.0-10.0 ha 4.9 5.78 2.34 1.72 1.66 0.06 1.41(26.4) (8.3) (14.4) (9.7) (7.1) (4.2)
>10.0 ha 1.1 15.44 2.09 2.66 3.75 0.04 1.74(15.3) (1.6) (4.8) (4.7) (1.0) (1.1)
All 100.0 1.08 1.39 0.59 0.85 0.04 1.65(100) (100) (100) (100) (100) (100)
Figures in parentheses are shares in total population of a species.
Source: National Sample Survey Organization, Ministry of Programme Planning andImplementation, Govt. of India.
8
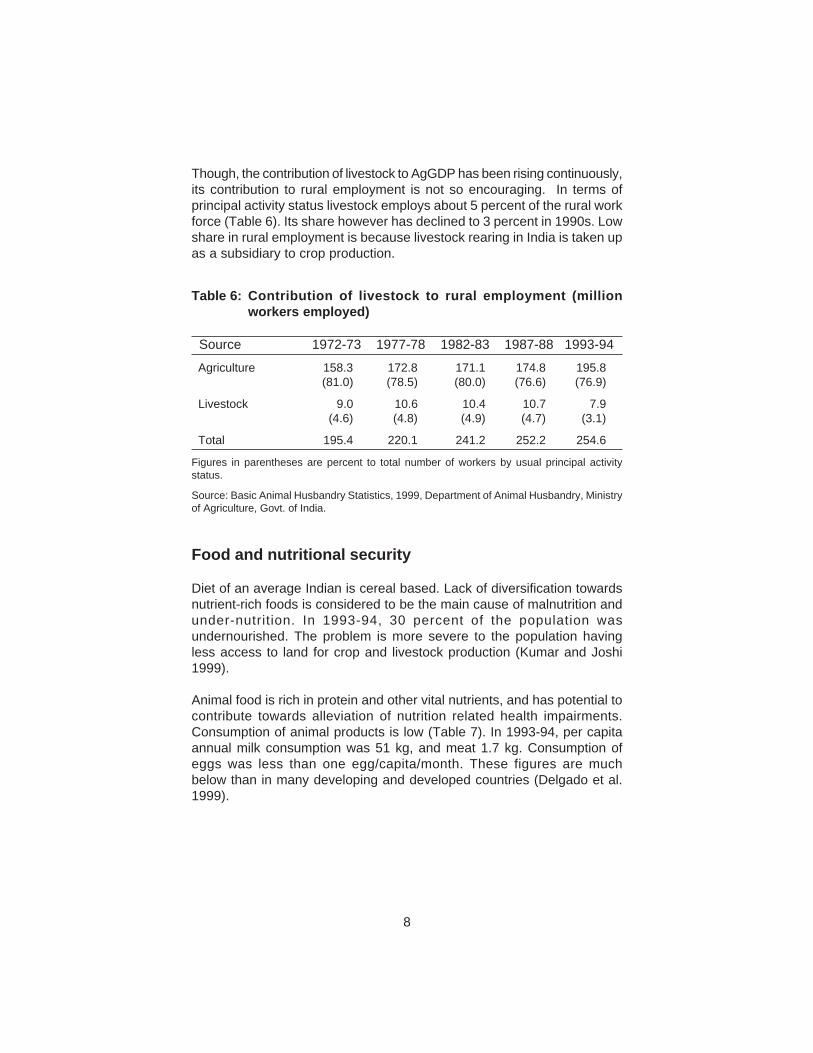
Though, the contribution of livestock to AgGDP has been rising continuously,its contribution to rural employment is not so encouraging. In terms ofprincipal activity status livestock employs about 5 percent of the rural workforce (Table 6). Its share however has declined to 3 percent in 1990s. Lowshare in rural employment is because livestock rearing in India is taken upas a subsidiary to crop production.
Food and nutritional security
Diet of an average Indian is cereal based. Lack of diversification towardsnutrient-rich foods is considered to be the main cause of malnutrition andunder-nutrition. In 1993-94, 30 percent of the population wasundernourished. The problem is more severe to the population havingless access to land for crop and livestock production (Kumar and Joshi1999).
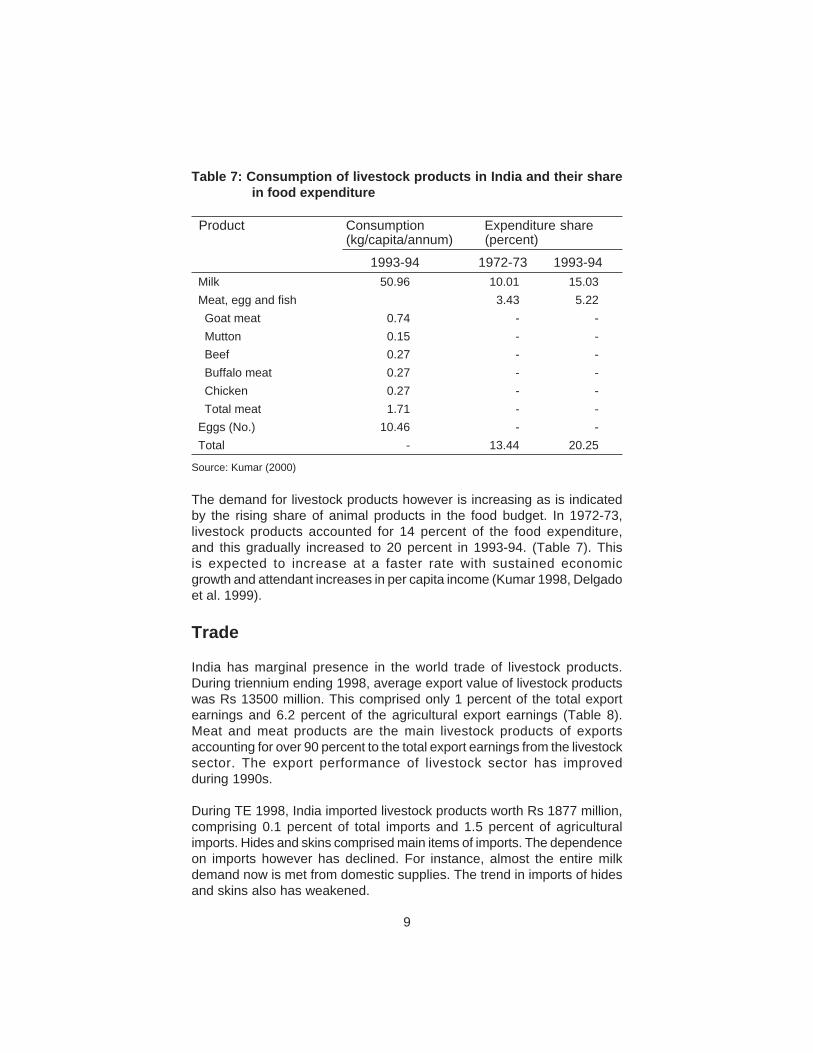
Animal food is rich in protein and other vital nutrients, and has potential tocontribute towards alleviation of nutrition related health impairments.Consumption of animal products is low (Table 7). In 1993-94, per capitaannual milk consumption was 51 kg, and meat 1.7 kg. Consumption ofeggs was less than one egg/capita/month. These figures are muchbelow than in many developing and developed countries (Delgado et al.1999).
Table 6: Contribution of livestock to rural employment (millionworkers employed)
Source 1972-73 1977-78 1982-83 1987-88 1993-94
Agriculture 158.3 172.8 171.1 174.8 195.8(81.0) (78.5) (80.0) (76.6) (76.9)
Livestock 9.0 10.6 10.4 10.7 7.9(4.6) (4.8) (4.9) (4.7) (3.1)
Total 195.4 220.1 241.2 252.2 254.6
Figures in parentheses are percent to total number of workers by usual principal activitystatus.
Source: Basic Animal Husbandry Statistics, 1999, Department of Animal Husbandry, Ministryof Agriculture, Govt. of India.
9
The demand for livestock products however is increasing as is indicatedby the rising share of animal products in the food budget. In 1972-73,livestock products accounted for 14 percent of the food expenditure,and this gradually increased to 20 percent in 1993-94. (Table 7). Thisis expected to increase at a faster rate with sustained economicgrowth and attendant increases in per capita income (Kumar 1998, Delgadoet al. 1999).
Trade
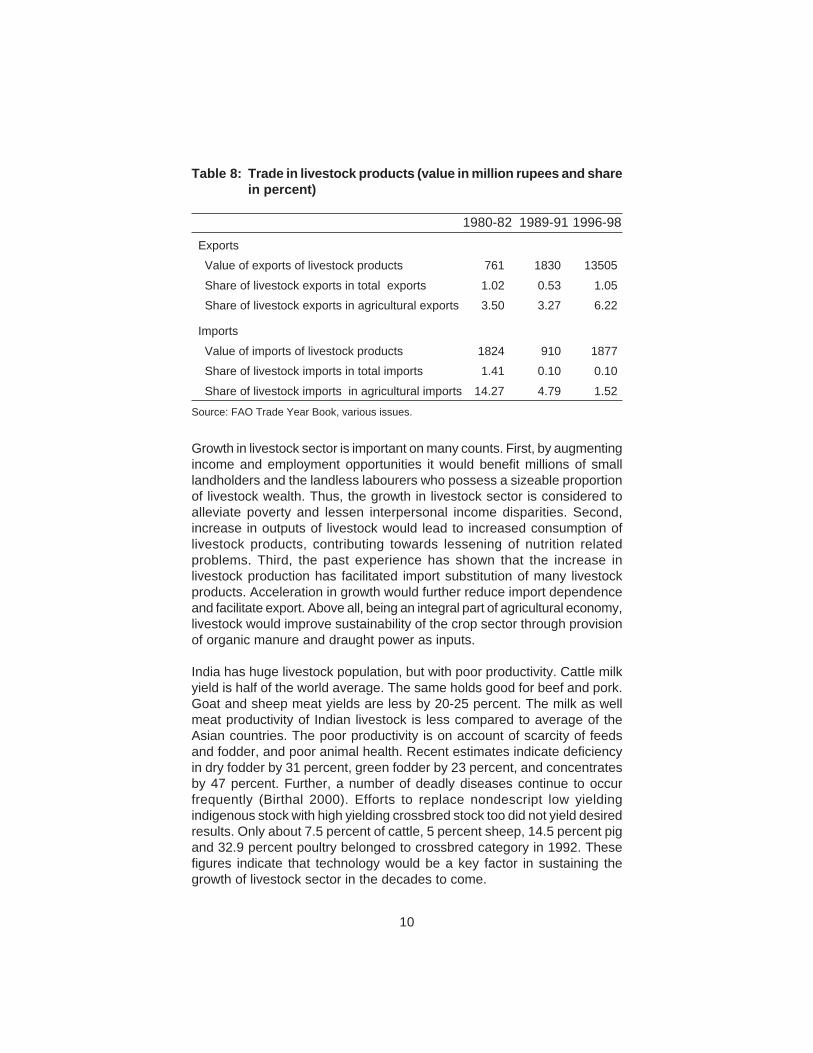
India has marginal presence in the world trade of livestock products.During triennium ending 1998, average export value of livestock productswas Rs 13500 million. This comprised only 1 percent of the total exportearnings and 6.2 percent of the agricultural export earnings (Table 8).Meat and meat products are the main livestock products of exportsaccounting for over 90 percent to the total export earnings from the livestocksector. The export performance of livestock sector has improvedduring 1990s.
During TE 1998, India imported livestock products worth Rs 1877 million,comprising 0.1 percent of total imports and 1.5 percent of agriculturalimports. Hides and skins comprised main items of imports. The dependenceon imports however has declined. For instance, almost the entire milkdemand now is met from domestic supplies. The trend in imports of hidesand skins also has weakened.
Table 7: Consumption of livestock products in India and their sharein food expenditure
Product Consumption Expenditure share(kg/capita/annum) (percent)
1993-94 1972-73 1993-94 Milk 50.96 10.01 15.03 Meat, egg and fish 3.43 5.22
Goat meat 0.74 - -Mutton 0.15 - -Beef 0.27 - -Buffalo meat 0.27 - -Chicken 0.27 - -Total meat 1.71 - -
Eggs (No.) 10.46 - - Total - 13.44 20.25
Source: Kumar (2000)
10
Table 8: Trade in livestock products (value in million rupees and sharein percent)
1980-82 1989-91 1996-98
ExportsValue of exports of livestock products 761 1830 13505Share of livestock exports in total exports 1.02 0.53 1.05Share of livestock exports in agricultural exports 3.50 3.27 6.22
ImportsValue of imports of livestock products 1824 910 1877Share of livestock imports in total imports 1.41 0.10 0.10Share of livestock imports in agricultural imports 14.27 4.79 1.52
Source: FAO Trade Year Book, various issues.
Growth in livestock sector is important on many counts. First, by augmentingincome and employment opportunities it would benefit millions of smalllandholders and the landless labourers who possess a sizeable proportionof livestock wealth. Thus, the growth in livestock sector is considered toalleviate poverty and lessen interpersonal income disparities. Second,increase in outputs of livestock would lead to increased consumption oflivestock products, contributing towards lessening of nutrition relatedproblems. Third, the past experience has shown that the increase inlivestock production has facilitated import substitution of many livestockproducts. Acceleration in growth would further reduce import dependenceand facilitate export. Above all, being an integral part of agricultural economy,livestock would improve sustainability of the crop sector through provisionof organic manure and draught power as inputs.
India has huge livestock population, but with poor productivity. Cattle milkyield is half of the world average. The same holds good for beef and pork.Goat and sheep meat yields are less by 20-25 percent. The milk as wellmeat productivity of Indian livestock is less compared to average of theAsian countries. The poor productivity is on account of scarcity of feedsand fodder, and poor animal health. Recent estimates indicate deficiencyin dry fodder by 31 percent, green fodder by 23 percent, and concentratesby 47 percent. Further, a number of deadly diseases continue to occurfrequently (Birthal 2000). Efforts to replace nondescript low yieldingindigenous stock with high yielding crossbred stock too did not yield desiredresults. Only about 7.5 percent of cattle, 5 percent sheep, 14.5 percent pigand 32.9 percent poultry belonged to crossbred category in 1992. Thesefigures indicate that technology would be a key factor in sustaining thegrowth of livestock sector in the decades to come.
11
Evolution of Livestock Research2
Historical background
Livestock research in India is more than a century old. During the latter halfof the nineteenth century, cattle plague (rinderpest) was all pervasive andcaused considerable loss to the livestock economy. The Government ofIndia appointed the Indian Cattle Plague Commission (ICPC) in 1868 toreport on the prevalence of rinderpest and other animal diseases, and tosuggest measures for their prevention and control. The recommendationof this and another Commission functioning during 1882-83 culminatedin establishment of Imperial Bacteriological Laboratory- the fore-runnerof the Indian Veterinary Research Institute in 1889 at Pune, Maharashtra.In 1893, the Laboratory was shifted to Mukteshwar in Kumaon Hills,Uttranchal, and subsequently in 1913 to its current location at Izatnagar,Uttar Pradesh. Another landmark decision on the recommendation ofthe ICPC was the establishment of a veterinary college in Mumbai in1883, and subsequently at Lahore (now in Pakistan), Kolkatta, Chennaiand Patna.
For over the next four decades or so, research efforts at ImperialBacteriological Laboratory remained concentrated to develop preventiveand curative methods to overcome the rinderpest menace. In 1927, theseefforts resulted into development of a highly efficacious vaccine forimmunization of cattle and buffalo against rinderpest. The research portfolioof the Laboratory diversified gradually to include other animal diseases.Among other successes, a major breakthrough was development of avaccine against Ranikhet disease of poultry in 1940.
The next important milestone towards strengthening livestock research wasthe establishment of Imperial Institute for Animal Husbandry and Dairying-the fore-runner of the Indian Dairy Research Institute at Banglore,Karnataka in 1923. The mandate of the Institute was to impart training inanimal husbandry and dairying for development of the dairy sector. In 1936,the Institute was renamed as Imperial Dairy Institute. After Independence,the Institute was relocated at Karnal, Haryana in 1955.
The establishment of the Indian (then Imperial) Council of AgriculturalResearch in 1929 on the recommendations of the Royal Commission onAgriculture (1928) was the most important landmark in the history of Indianagricultural research. The Council was mandated to promote, guide andcoordinate agricultural and veterinary research in the country. The mandate
2 The historical background of livestock research system is drawn heavily from the NationalCommission on Agriculture (1976) and ICAR (1989, 2000).
12
precluded the Council to maintain its own institutions, but to determine theresearch needs at regional and all India level and to support ad hoc projectsat research institutes and state departments.
The Royal Commission on Agriculture (RCA) had also made an in-depthanalysis of the problems plaguing the growth and development of animalhusbandry. The cattle were the main source of draught power for agricultureand milk for human consumption, but there was considerable imbalancebetween the two with a tilt in favor of the former. With due consideration tothis duality, the RCA recognized the need to improve milk yield of bovinesand recommended improving milk production traits of cattle as well asbuffalo through genetic enhancement of indigenous breeds by selection.The RCA also emphasized on the importance of improved feeding andmanagement practices. With these recommendations, the focus of researchof the Imperial Dairy Institute shifted towards improving milk yield. It maybe noted that the RCA did not favor crossbreeding research becauseof fear of non-acclimatization of crossbreeds to tropical climate of thecountry.
By late 1930s, artificial insemination (AI) technology has arrived in India.The isolated research efforts to try AI in cattle were started in 1939, butcomprehensive studies on AI were initiated in 1942 at IVRI. It was foundan effective tool to bring about genetic improvement in cattle and wasrecommended for extensive field application.
At the same time, the livestock research portfolio diversified to include otheranimal species, that is sheep and poultry. The focus was on improvingtheir genetic potential through crossbreeding. Efforts to improve indigenoussheep through crossbreeding with exotic fine wool breeds had earlier beenmade in the beginning of the nineteenth century. These however could notsustain in the absence of proper organizations. Systematic efforts startedin the late 1930s when ICAR initiated a number of pilot experiments forbreeding superior sheep. Findings of these experiments evolved into asheep breeding policy that emphasized improvement in indigenous breedsby selection in plains, and through crossbreeding in temperate Himalayanregion and sheep tracts of Deccan plateau.
The beginning of poultry research in India can be credited to few Christianmissionary organizations. Towards the end of nineteenth century, theseorganizations imported superior exotic breeds to improve the indigenousbreeds through crossing. The organized efforts started in 1938 with theestablishment of a Poultry Research Division in the Indian VeterinaryResearch Institute for undertaking research on poultry breeding, nutritionand health.
13
The animal science research in the pre-Independence era (pre-1947) wasallocated fairly a good amount of funds (Jha 2001). In 1930s and 1940s,share of animal science research was about 30 percent of the total researchfunds of the ICAR. This laid a strong foundation for animal science researchin the country. A review of research achievements by the ICAR towardsthe end of 1940s also revealed availability of a number of livestocktechnologies related to breeding, nutrition, dairy enterprise, sheep andwool, and poultry for field application. The research on many importantspecies such as buffalo, goat, camel and pig was still lacking adequateattention.
Growth in infrastructure
No major initiatives were taken to strengthen agricultural research in theearly post-Independence years. However, a number of committees wereconstituted to suggest ways and means to strengthen the agriculturalresearch system. On their recommendation, the first agricultural universitywas established at Pantnagar in 1960 with the help of ICAR and supportand grants from United States Agency for International Development. Thiswas followed quickly in other states. At present, there are 28 agriculturaluniversities, and most of these have faculty of animal sciences. There aretwo universities specifically meant for animal science research andeducation.
In 1950s, establishment of All India Coordinated Research Project (AICRP)on maize by ICAR was a major step towards strengthening agriculturalresearch. During 1960s, 17 AICRPs were established but emphasis wason crop husbandry. However, during this period establishment of CentralSheep and Wool Research Institute at Avikanagar (Rajasthan) was amajor step towards strengthening species specific research. Feed andfodder scarcity had repeatedly been pointed out to be the main limitingfactor to improving animal productivity in the pre-Independence period.The problem persisted in the post-Independence years also. This led tothe establishment of Indian Grassland and Fodder Research Institutein 1962 at Jhansi, Uttar Pradesh with the objective of identifyingfodder problems in different regions and research and managementsolutions thereof.
Until 1966, agricultural research institutes were under the administrativeand financial control of central Ministry of Food and Agriculture. ICAR wasreorganized in 1966 and its mandate was revised to include ‘undertakeresearch’ in the field of agriculture and animal husbandry. Thus, theresearch institutes under the Ministry of Food and Agriculture were broughtunder administrative, technical and financial control of ICAR.
14
Animal science research scenario changed drastically after mid-1960s.Milk production in the country had been stagnating around 20 million tonsduring the first two decades of post-Independence. By the end of 1960s,the Green Revolution technologies had resulted into tremendous success.Encouraged with this, a similar strategy was planned to increase milkproduction with emphasis on crossbreeding of indigenous cattle with exoticbreeds and with simultaneous development of marketing facilities in thecooperative sector. The strategy culminated into initiation of the program‘Operation Flood’ in early 1970s.
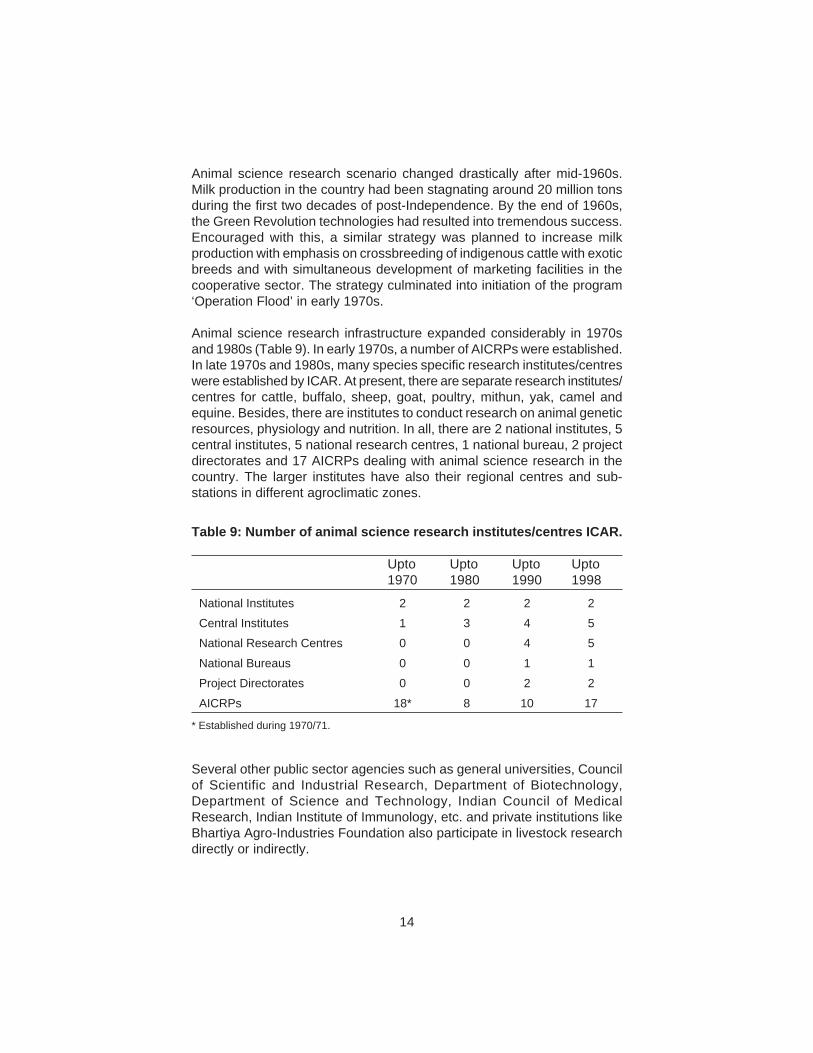
Animal science research infrastructure expanded considerably in 1970sand 1980s (Table 9). In early 1970s, a number of AICRPs were established.In late 1970s and 1980s, many species specific research institutes/centreswere established by ICAR. At present, there are separate research institutes/centres for cattle, buffalo, sheep, goat, poultry, mithun, yak, camel andequine. Besides, there are institutes to conduct research on animal geneticresources, physiology and nutrition. In all, there are 2 national institutes, 5central institutes, 5 national research centres, 1 national bureau, 2 projectdirectorates and 17 AICRPs dealing with animal science research in thecountry. The larger institutes have also their regional centres and sub-stations in different agroclimatic zones.
Several other public sector agencies such as general universities, Councilof Scientific and Industrial Research, Department of Biotechnology,Department of Science and Technology, Indian Council of MedicalResearch, Indian Institute of Immunology, etc. and private institutions likeBhartiya Agro-Industries Foundation also participate in livestock researchdirectly or indirectly.
Table 9: Number of animal science research institutes/centres ICAR.
Upto Upto Upto Upto1970 1980 1990 1998
National Institutes 2 2 2 2Central Institutes 1 3 4 5National Research Centres 0 0 4 5National Bureaus 0 0 1 1Project Directorates 0 0 2 2AICRPs 18* 8 10 17
* Established during 1970/71.
15
Financial resources
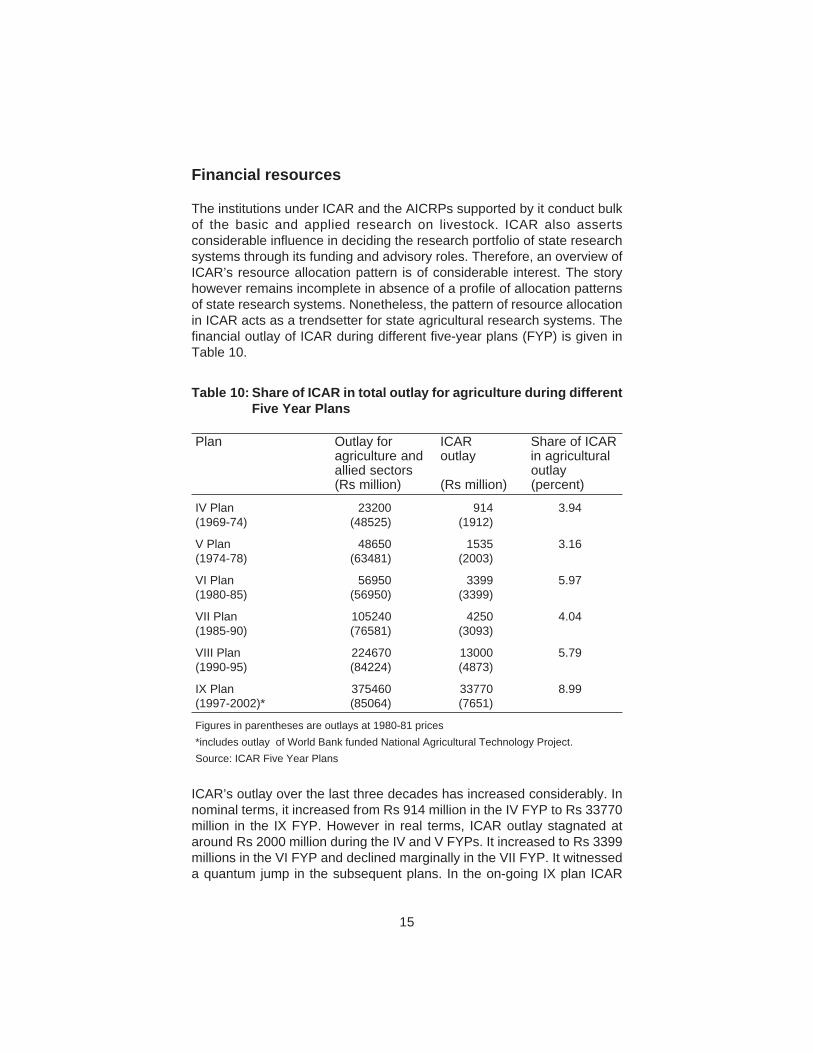
The institutions under ICAR and the AICRPs supported by it conduct bulkof the basic and applied research on livestock. ICAR also assertsconsiderable influence in deciding the research portfolio of state researchsystems through its funding and advisory roles. Therefore, an overview ofICAR’s resource allocation pattern is of considerable interest. The storyhowever remains incomplete in absence of a profile of allocation patternsof state research systems. Nonetheless, the pattern of resource allocationin ICAR acts as a trendsetter for state agricultural research systems. Thefinancial outlay of ICAR during different five-year plans (FYP) is given inTable 10.
Table 10: Share of ICAR in total outlay for agriculture during differentFive Year Plans
Plan Outlay for ICAR Share of ICARagriculture and outlay in agriculturalallied sectors outlay(Rs million) (Rs million) (percent)
IV Plan 23200 914 3.94(1969-74) (48525) (1912)
V Plan 48650 1535 3.16(1974-78) (63481) (2003)
VI Plan 56950 3399 5.97(1980-85) (56950) (3399)
VII Plan 105240 4250 4.04(1985-90) (76581) (3093)
VIII Plan 224670 13000 5.79(1990-95) (84224) (4873)
IX Plan 375460 33770 8.99(1997-2002)* (85064) (7651)
Figures in parentheses are outlays at 1980-81 prices*includes outlay of World Bank funded National Agricultural Technology Project.Source: ICAR Five Year Plans
ICAR’s outlay over the last three decades has increased considerably. Innominal terms, it increased from Rs 914 million in the IV FYP to Rs 33770million in the IX FYP. However in real terms, ICAR outlay stagnated ataround Rs 2000 million during the IV and V FYPs. It increased to Rs 3399millions in the VI FYP and declined marginally in the VII FYP. It witnesseda quantum jump in the subsequent plans. In the on-going IX plan ICAR
16
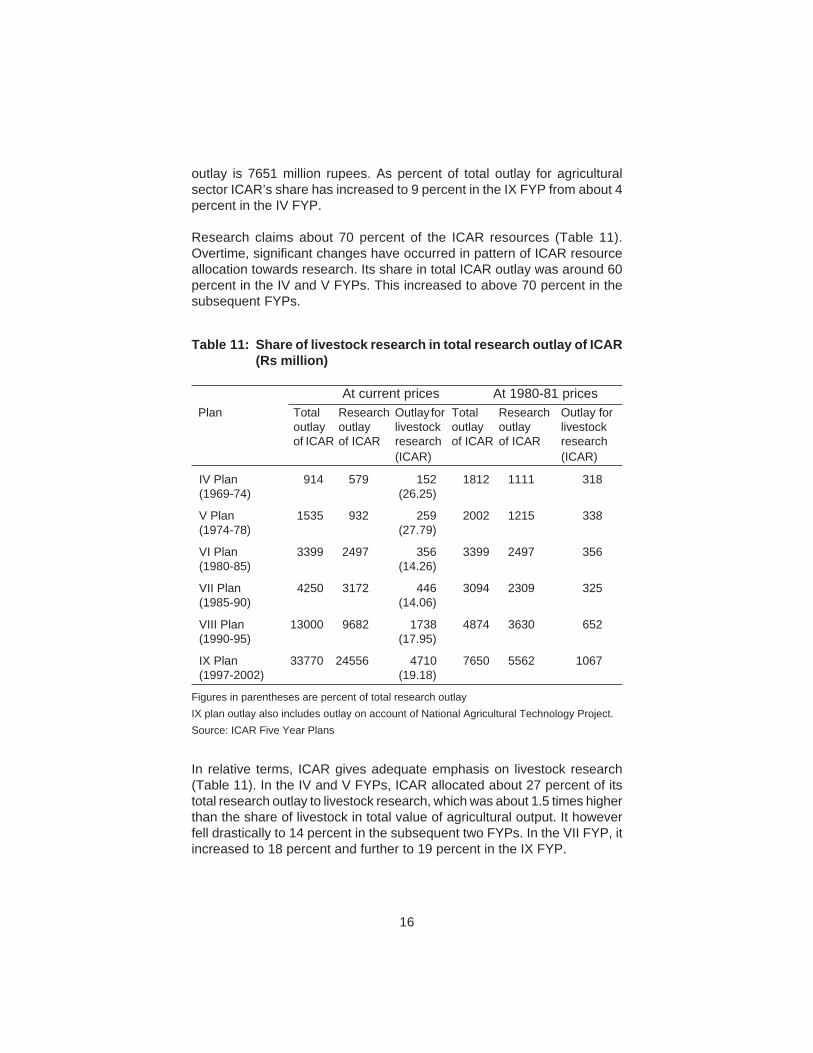
In relative terms, ICAR gives adequate emphasis on livestock research(Table 11). In the IV and V FYPs, ICAR allocated about 27 percent of itstotal research outlay to livestock research, which was about 1.5 times higherthan the share of livestock in total value of agricultural output. It howeverfell drastically to 14 percent in the subsequent two FYPs. In the VII FYP, itincreased to 18 percent and further to 19 percent in the IX FYP.
outlay is 7651 million rupees. As percent of total outlay for agriculturalsector ICAR’s share has increased to 9 percent in the IX FYP from about 4percent in the IV FYP.
Research claims about 70 percent of the ICAR resources (Table 11).Overtime, significant changes have occurred in pattern of ICAR resourceallocation towards research. Its share in total ICAR outlay was around 60percent in the IV and V FYPs. This increased to above 70 percent in thesubsequent FYPs.
Table 11: Share of livestock research in total research outlay of ICAR(Rs million)
At current prices At 1980-81 prices Plan Total Research Outlay for Total Research Outlay for
outlay outlay livestock outlay outlay livestockof ICAR of ICAR research of ICAR of ICAR research
(ICAR) (ICAR)
IV Plan 914 579 152 1812 1111 318(1969-74) (26.25)
V Plan 1535 932 259 2002 1215 338(1974-78) (27.79)
VI Plan 3399 2497 356 3399 2497 356(1980-85) (14.26)
VII Plan 4250 3172 446 3094 2309 325(1985-90) (14.06)
VIII Plan 13000 9682 1738 4874 3630 652(1990-95) (17.95)
IX Plan 33770 24556 4710 7650 5562 1067(1997-2002) (19.18)
Figures in parentheses are percent of total research outlayIX plan outlay also includes outlay on account of National Agricultural Technology Project.Source: ICAR Five Year Plans
17
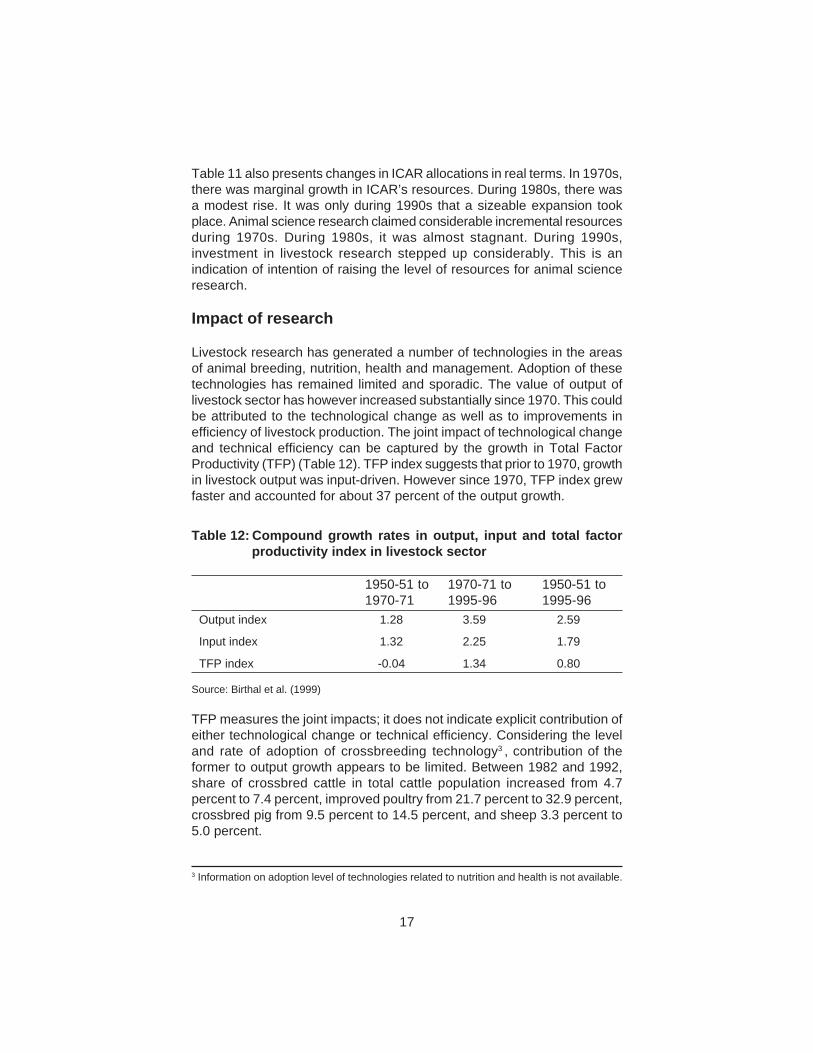
Table 12: Compound growth rates in output, input and total factorproductivity index in livestock sector
1950-51 to 1970-71 to 1950-51 to1970-71 1995-96 1995-96
Output index 1.28 3.59 2.59
Input index 1.32 2.25 1.79
TFP index -0.04 1.34 0.80
Source: Birthal et al. (1999)
TFP measures the joint impacts; it does not indicate explicit contribution ofeither technological change or technical efficiency. Considering the leveland rate of adoption of crossbreeding technology3 , contribution of theformer to output growth appears to be limited. Between 1982 and 1992,share of crossbred cattle in total cattle population increased from 4.7percent to 7.4 percent, improved poultry from 21.7 percent to 32.9 percent,crossbred pig from 9.5 percent to 14.5 percent, and sheep 3.3 percent to5.0 percent.
3 Information on adoption level of technologies related to nutrition and health is not available.
Table 11 also presents changes in ICAR allocations in real terms. In 1970s,there was marginal growth in ICAR’s resources. During 1980s, there wasa modest rise. It was only during 1990s that a sizeable expansion tookplace. Animal science research claimed considerable incremental resourcesduring 1970s. During 1980s, it was almost stagnant. During 1990s,investment in livestock research stepped up considerably. This is anindication of intention of raising the level of resources for animal scienceresearch.
Impact of research
Livestock research has generated a number of technologies in the areasof animal breeding, nutrition, health and management. Adoption of thesetechnologies has remained limited and sporadic. The value of output oflivestock sector has however increased substantially since 1970. This couldbe attributed to the technological change as well as to improvements inefficiency of livestock production. The joint impact of technological changeand technical efficiency can be captured by the growth in Total FactorProductivity (TFP) (Table 12). TFP index suggests that prior to 1970, growthin livestock output was input-driven. However since 1970, TFP index grewfaster and accounted for about 37 percent of the output growth.
18
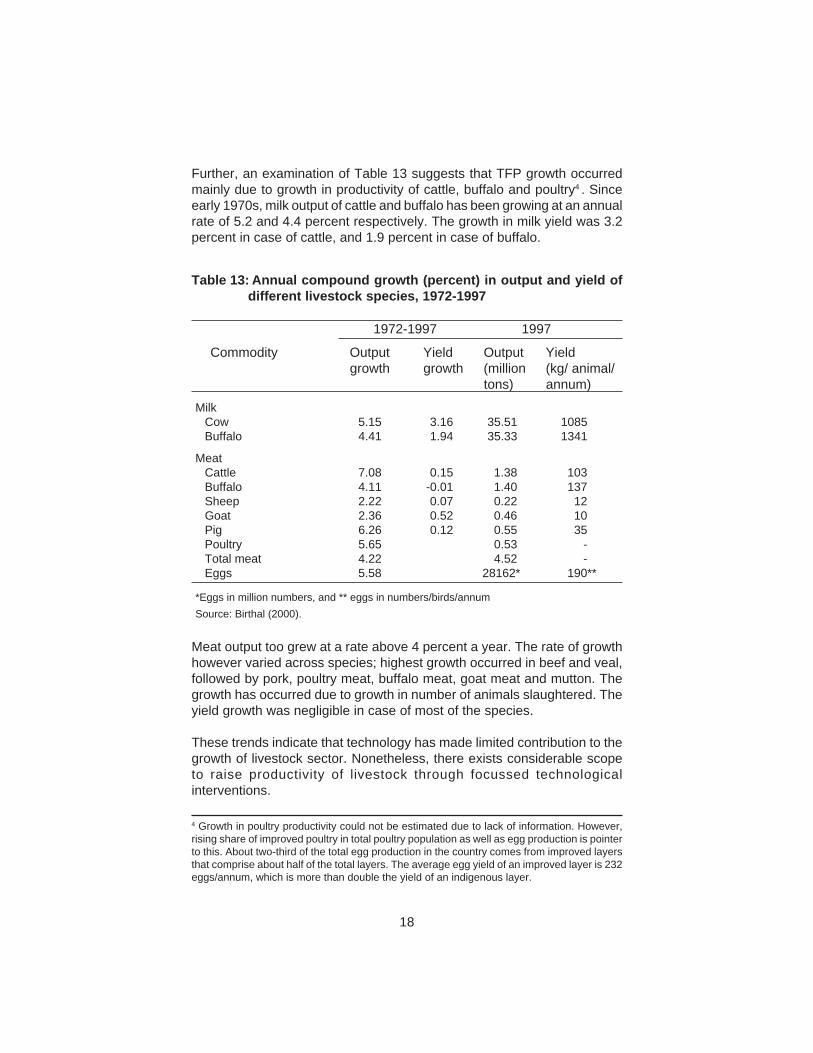
Further, an examination of Table 13 suggests that TFP growth occurredmainly due to growth in productivity of cattle, buffalo and poultry4 . Sinceearly 1970s, milk output of cattle and buffalo has been growing at an annualrate of 5.2 and 4.4 percent respectively. The growth in milk yield was 3.2percent in case of cattle, and 1.9 percent in case of buffalo.
4 Growth in poultry productivity could not be estimated due to lack of information. However,rising share of improved poultry in total poultry population as well as egg production is pointerto this. About two-third of the total egg production in the country comes from improved layersthat comprise about half of the total layers. The average egg yield of an improved layer is 232eggs/annum, which is more than double the yield of an indigenous layer.
Meat output too grew at a rate above 4 percent a year. The rate of growthhowever varied across species; highest growth occurred in beef and veal,followed by pork, poultry meat, buffalo meat, goat meat and mutton. Thegrowth has occurred due to growth in number of animals slaughtered. Theyield growth was negligible in case of most of the species.
These trends indicate that technology has made limited contribution to thegrowth of livestock sector. Nonetheless, there exists considerable scopeto raise productivity of livestock through focussed technologicalinterventions.
Table 13: Annual compound growth (percent) in output and yield ofdifferent livestock species, 1972-1997
1972-1997 1997
Commodity Output Yield Output Yieldgrowth growth (million (kg/ animal/
tons) annum)
MilkCow 5.15 3.16 35.51 1085Buffalo 4.41 1.94 35.33 1341
MeatCattle 7.08 0.15 1.38 103Buffalo 4.11 -0.01 1.40 137Sheep 2.22 0.07 0.22 12Goat 2.36 0.52 0.46 10Pig 6.26 0.12 0.55 35Poultry 5.65 0.53 -Total meat 4.22 4.52 -Eggs 5.58 28162* 190**
*Eggs in million numbers, and ** eggs in numbers/birds/annumSource: Birthal (2000).
19
Livestock species are multi-functional in nature i.e. they generate multiple/joint outputs. Each of the output has economic value, though its relativeutility may vary over space and time. Multi-functionality is more pronouncedin the subsistence oriented mixed crop livestock production systems as inIndia, where livestock is maintained not only to produce food but also toprovide draught power and organic manure to agriculture. Mixed croplivestock production systems are dynamic, and possibilities of tradeoffsbetween crops and livestock as well as within the functions of livestock arequite high. For example, with the emergence of energy intensive croppingsystems in India the emphasis of cattle breeding research is graduallyshifting from dual-purpose breeds to milch breeds. The multi-functionalitythus makes priority assessment exercise a complex process. Besides,livestock research is long-term, capital-intensive, uncertain and slowin producing benefits, which bring in elements of uncertainty in prioritysetting.
Over the last three decades, a number of priority setting methods havebeen developed. These differ widely in scope of analysis, degree ofsophistication and applicability (Shumway 1973, Norton and Davis 1981,Anderson and Parton 1983, Parton et al. 1984, Norton and Pardey 1987,Fox 1987, Norton et al. 1992, Janssen 1994). The priority setting methodscan be classified based on the objectives of priority setting (single or multipleobjectives), measurement concepts (direct and indirect or qualitative andquantitative) and the time dimension (ex ante or ex post). Broadly, thereare six methods of priority setting that have been widely applied in empiricalresearch: (1) Scoring or weighted criteria model (Mahlstede 1971, Evensionet al. 1979, Kirschke 1993, Moscardi 1987, CGIAR 1992, Franzel et al.1995, Jha et al. 1995), (2) Economic surplus/benefit-cost models (Nortonet al. 1987, Norton and Douglas 1989, Davis et al. 1987, Echeverria 1990,Mills 1997, Janssen and Waithaka 1998), (3) Mathematical programmingmodels (Russel 1977, De Wit 1988, Scobie and Jacobsen 1992), (4)Simulation models (Pinstrup-Anderson and Franklin 1977, Lu et al.1978),(5) Econometric methods, and (6) Analytical hierarchy process (Ramanujamand Satty 1981, Satty and Vargas 1994). Some investigators have alsoused a combination of scoring and economic surplus approaches in settingthe research priorities (Kelly and Ryan 1995, Thornton et al. 2000). Eachof these approaches has its advantages and limitations5 .
III METHODOLOGY
5 For a detailed discussion on methods of priority setting and their advantages and limitationssee, Norton (1987), Alston et al. (1995) and Jha et al. (1995).
20
Choice of Method: Multi-criteria Scoring Model
The choice of method depends on the objectives of research, level of priorityassessment (national, institution or program), and its simplicity in application,data requirement and capacity to allow participation of stakeholders inpriority assessment exercise.
Multi-criteria scoring model has been used in this exercise. This is oftenknown as congruence method. This incorporates multiple objectives formaking choices. The objectives included here are growth, equity,sustainability and participation in trade. These are complex and oftenargumentative in nature. Scoring model incorporates multiple objectivesby modifying the simple and traditional measure of research evaluation -changes in value of production- to consider the concerns of equity,sustainability and trade. Given the relative importance of objectives, scoringmodel makes tradeoffs between objectives explicit. The approach isrelatively transparent and allows extensive and active participation ofstakeholders (CGIAR 1992). Finally, the approach is simple to apply and isnot data intensive (McCalla and Ryan 1992). The model can be used torank a long list of commodities, research alternatives and target domains.
Main limitation of this approach is its simplicity and flexibility. Often, thereis a tendency to add in more and more criteria without checking for theirinternal logic and consistency. This gives rise to duplicating criteria.This happens as most of the criteria are directly or indirectly relatedwith the efficiency criterion- the main objective of research (Alston etal. 1995).
Further, scoring model allocates research resources across regions orcommodities in proportion to their contribution to the gross value ofproduction. This implicitly assumes equal opportunities for research acrosscommodities and regions. That means the value of new research generatedis proportional to the value of output from the sector. The analysis is basedon present values and presumes that relative contributions are constant.Thus, the results provide only the starting point for research priority setting.It also does not account for research spillovers and domestic and tradepolicies (Falconi 1999).
The results of scoring model however can be improved by combining themwith other methods such as economic surplus and mathematicalprogramming that consider probability of research success, adoption rate,research spillover effects and distribution of research benefits (Kelly andRyan 1995, Thornton et al. 2000).
21
Basic steps in scoring modelScoring model involves seven broad steps to arrive at a comprehensiveassessment of the priorities. These are:• Identification of research objectives and their indicators (extensity
parameters)• Assigning appropriate weights to research objectives• Selection of research priority dimensions• Construction of initial baseline (IBL)• Modification of IBL• Construction of final baseline (FBL)• Assessment of research priorities
Identification of Research Objectives and Extensity Parameters
The first step is to identify research objectives that are consistent with thenational or regional development goals. The goals often include growthacceleration, improvement in equity, sustainability of natural resources/production systems and participation in international trade. The ‘growthacceleration goal’ suggests that research should enhance productivity in acost-effective manner. Equity implies distribution of efficiency gains acrossregions, socioeconomic groups, farming systems and so forth. Sustainabilityis concerned with conservation and/or judicious use of natural resources.Participation in trade indicates that research needs to focus on commoditieshaving potential for export promotion or import substitution.
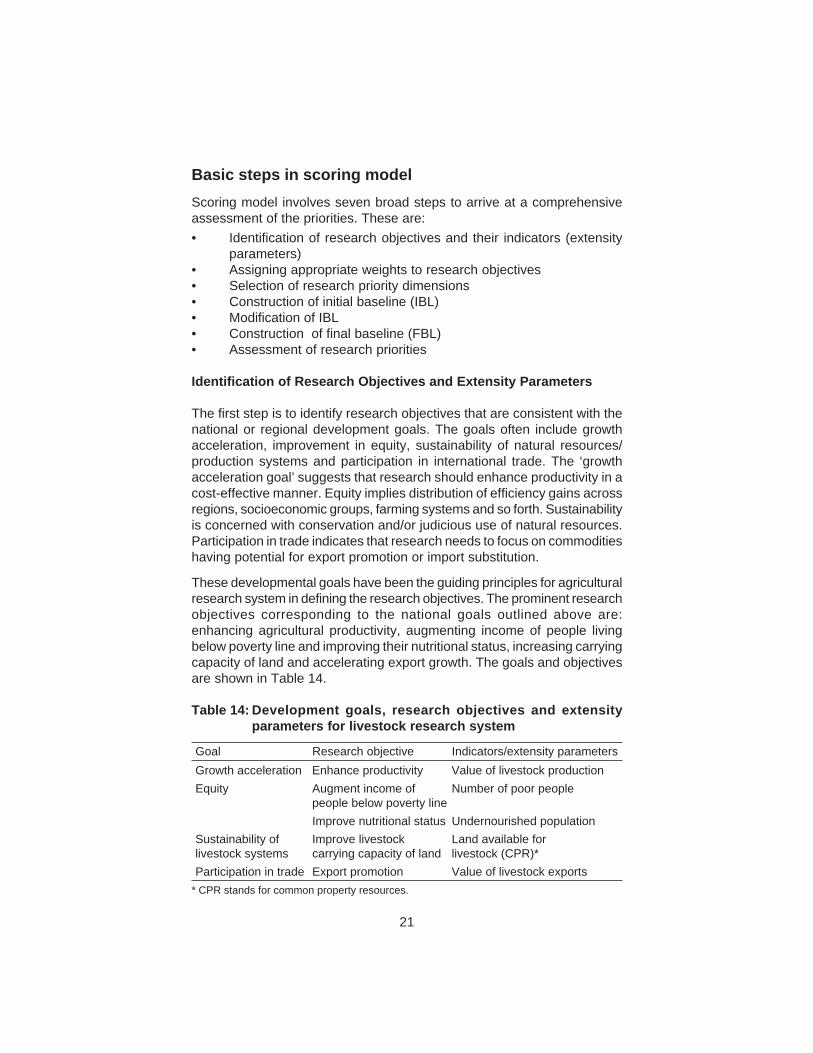
These developmental goals have been the guiding principles for agriculturalresearch system in defining the research objectives. The prominent researchobjectives corresponding to the national goals outlined above are:enhancing agricultural productivity, augmenting income of people livingbelow poverty line and improving their nutritional status, increasing carryingcapacity of land and accelerating export growth. The goals and objectivesare shown in Table 14.
Table 14: Development goals, research objectives and extensityparameters for livestock research system
Goal Research objective Indicators/extensity parametersGrowth acceleration Enhance productivity Value of livestock productionEquity Augment income of Number of poor people
people below poverty lineImprove nutritional status Undernourished population
Sustainability of Improve livestock Land available forlivestock systems carrying capacity of land livestock (CPR)*Participation in trade Export promotion Value of livestock exports
* CPR stands for common property resources.
22
The next step is to identify the indicators/extensity parametersreflecting the magnitude of the problems to be addressed by the researchsystem. Accordingly, the research activities should target the regionswhere the magnitude of the problem is large. The extensity parametersreflecting the objectives of livestock research and used in this studyare discussed below. The sources of these indicators are given inAnnexure I.
Value of livestock production (VOP)
Research enhances production potential of livestock, and benefits of theresearch thus can be increased manifold by large-scale adoption of itsoutputs. That means value of research is proportionate to the value ofproduction, and the latter therefore reflects the research objective ofincreasing productivity or production efficiency.
In this analysis, livestock species has been considered as the focusof research and thus we have included the triennium ending 1997-98average value of the outputs of each species6 . The species arecattle, buffalo, goat, sheep, pig, poultry, camel and equine. Otherspecies such as mithun and yak could not be included in the analysisdue to lack of information on their outputs and services. These speciesare important in certain agroecological regions, but are minor to thelivestock sector.
6 Value of the following outputs is available to estimate the value of contribution of a species:total milk (cattle+buffalo+goat), cattle meat, buffalo meat, goat meat, sheep meat, pig meat,poultry meat, eggs, cattle hide, buffalo hide, goat skin, sheep skin, sheep wool, goat hair, pigbristles, camel hair, total dung (cattle+buffalo). The value of some byproducts such as bones,blood etc. is also available but not by species. However, these comprise only a small fractionof total VOP of livestock and hence have not been considered to compute the contribution ofindividual species. In several cases, we had to apportion the values by species. For instance,total value of milk has been apportioned by species (cattle, buffalo and goat) taking intoconsideration the milk output and price of milk of different species. Similarly the total value ofdung has also been disaggregated at the species level considering their populations anddung evacuation rates. Further, the values of draught services of different species were notavailable, so we had to estimate these values. The value of draught power contribution oflivestock has been estimated using information on draught power utilisation from the Cost ofCultivation Studies. The Cost of Cultivation reports provide per ha value of animal draughtpower for major crops by states. A single estimate of value of animal draught power per hawas arrived at for major crops in different states. Thus the total value of animal draught powerwas arrived at by multiplying the per ha value with gross cropped area in a state. This wasfurther disaggregated at species level in proportion of horsepower available from differentdraught species. For states not included in the Cost of Cultivation Studies, estimates ofneighbouring states were used. The draught services of equine have been valued based oninformation on use of equines from the published and unpublished literature and their horsepower (Birthal et al. 1999).
23
7 The information on the populations of poor and undernourished pertains to 1993-94. Incidenceof poverty and under-nutrition seemingly appear to be significantly and positively correlated.The correlation coefficient between the two however is 0.32 and therefore we have includedboth of these as indicators of equity.
Number of poor and undernourished
The number of persons below poverty line and the number ofundernourished persons are indicators of economic inequality and nutritionalinsecurity respectively. As distribution of livestock wealth is more equitablydistributed compared to land, it is expected that strengthening livestockresearch in the regions having comparatively more number of the poorand undernourished7 would help reduce interpersonal and interregionaleconomic disparities and reduce incidence of malnutrition and under-nutrition.
Common property resources (CPRs)
Common property resources contribute significantly to the feed and fodderconsumption and thus to the sustainability of livestock production (WorldBank 1996). The contribution is higher in case of landless, marginal andsmall landholders who own bulk of the livestock wealth. The commongrazing resources in India have however been deteriorating in quantityand quality. Therefore, conservation and management of CPRs is necessaryto protect the interests of these households and to sustain the growth oflivestock sector. The focus of livestock research thus should be relativelyhigher in the regions having more grazing and wastelands. In this analysis,we have considered area under barren and unculturable lands, permanentpastures and grazing lands, culturable wasteland, fallow lands and landsunder miscellaneous tree crops to constitute the CPRs for the livestocksector. Triennium ending 1997-98 average of the CPR area has been usedin the analysis.
Value of livestock exports
Livestock sector export constitutes around one percent of total exportearnings. There is enormous scope to improve the contribution of livestockproducts in export. In the past, India has been a net importer of variouslivestock products particularly powdered milk. The dependence howeverhas declined drastically in recent years on account of tremendous growthin milk production. Besides, India has the advantage of producing milk aswell as other livestock products at lower costs because of availability ofcheap labour. Further, trade liberalization is opening up opportunities forimproving export performance of livestock products. Participation in tradetherefore has been considered as one of the criteria for priority setting. The
24
indicator for this is the mean value of livestock products exported8 duringtriennium ending 1997-98.
These parameters quantify the magnitude of the problem to be addressedby the research system, and imply that if the research system has to beefficient in achieving specific objective(s) - enhancing productivity, alleviatingpoverty, improving nutritional security, improving sustainability or promotingexports, it should target regions having comparatively high value of thecorresponding indicator.
Assigning Appropriate Weights to Research Objectives
The next step is to assign weights to the indicators of research objectives.This is needed to construct a composite index for priority ranking of regions,species and commodities. Each indicator is assigned an appropriate weightdepending on the relative importance of the concerned research objective.There is no a priori information available on weights to different nationaldevelopmental objectives. Thus, equal weights (0.25) have been assignedto each of the objective. In case of more than one indicator of an objective,each one has been given equal weight without altering the overall weightingstructure. For example, the number of poor, and undernourished population,the two indicators of the equity, share half of the weight (0.125) assignedto the equity objective (0.25). The methodology however permits use ofvarying weights to reflect the relative importance of different objectives,and a sensitivity analysis has been done to assess the impact of differingweighting schemes.
Selection of Research Priority Dimensions
Livestock research prioritization has multiple dimensions. Priority indicescan be developed for regions, livestock species and commodities or acombination of these. In this exercise, we have considered regional, speciesand commodity dimensions.
Regional dimensions ensure that benefits of research are equitablydistributed across regions. Since R & D efforts are generally targeted to
8 Export data at the state level is not available. The contribution of different states to nationalexport earnings from an individual commodity has been assumed to be in proportion of theshare of a state in the total value of the commodity under consideration at the national level.The shares of different commodities so obtained were added to compute the total contributionof a state in national export earnings. The apportioning of export earnings to different statesby commodity takes into consideration the composition of export basket and attaches highervalue to a state contributing more to the production of the commodity exported. This avoidsdouble counting of VOP as is often presumed. The correlation coefficient between the VOPand percent of VOP exported by different states is – 0.19.
25
homogenous agroclimatic regions, priority assessment must considerregional dimensions. In India, agroclimatic regions cut across administrativeboundaries and the necessary information for priority assessment is notavailable for the livestock sector at this level. Therefore, the state has beentaken as the unit for analysis. All 25 states9 and 7 union territories havebeen included in the analysis.
The regional research priorities can be translated into species priorities.Species included in this exercise are cattle, buffalo, goat, sheep, poultry,pig, camel and equine. As the animal in the mixed farming systems performsmultiple functions, the priority for a species is further decomposed intofunctional priorities (products and services).
Construction of Initial Baseline (IBL)
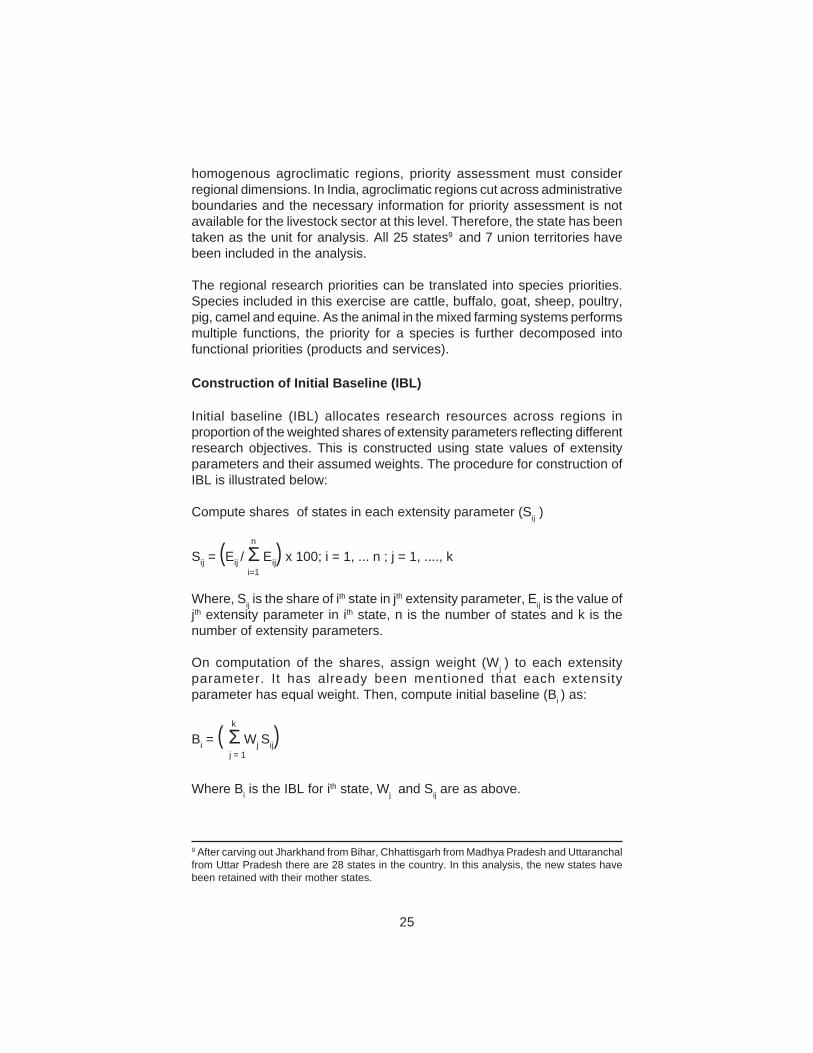
Initial baseline (IBL) allocates research resources across regions inproportion of the weighted shares of extensity parameters reflecting differentresearch objectives. This is constructed using state values of extensityparameters and their assumed weights. The procedure for construction ofIBL is illustrated below:
Compute shares of states in each extensity parameter (Sij )
nSij = (Eij / Σ Eij) x 100; i = 1, ... n ; j = 1, ...., k
i=1
Where, Sij is the share of ith state in jth extensity parameter, Eij is the value ofjth extensity parameter in ith state, n is the number of states and k is thenumber of extensity parameters.
On computation of the shares, assign weight (Wj ) to each extensityparameter. It has already been mentioned that each extensityparameter has equal weight. Then, compute initial baseline (Bi ) as:
k
Bi = ( Σ Wj Sij)j = 1
Where Bi is the IBL for ith state, Wj and Sij are as above.
9 After carving out Jharkhand from Bihar, Chhattisgarh from Madhya Pradesh and Uttaranchalfrom Uttar Pradesh there are 28 states in the country. In this analysis, the new states havebeen retained with their mother states.
26
Modification of Initial Baseline
Value of IBL is a cumulative product of weights and shares of extensityparameters of research objectives. Research resource allocation basedon IBL may not fully capture the major concerns of growth, equity,sustainability and exports, as this reflects size of the problem, but ignoresits intensity. For example, a state might be ranking very high in terms of itsshare in the absolute number of the poor in the country it may not have thesame ranking in terms of intensity of poverty. In research prioritization,intensity of the problem is also important. The effect of intensity of theproblem cannot be captured in an analysis based on extensity parametersalone because of the problem of aggregation of values of intensityparameters across states. The intensity values are thus used to modify theIBL to arrive at the final baseline (FBL), which eventually reflects both thesize and intensity of the problems. The intensity indicators are also knownas modifiers.
Selection of modifiers
Eight intensity indicators were identified for modification of the initial baseline.These include scope for growth in milk production (yield gaps in indigenouscattle, crossbred cattle and buffalo), per capita state domestic product andcombined share of landless, marginal and small farmers in total livestockpopulation (adult cattle equivalent), per capita availability of milk and eggs,and livestock density (adult cattle units/ha of net cropped area plus landavailable for livestock). The modifiers corresponding to different extensityparameters are shown in Table 15 and discussed below.
Efficiency modifiers
There is considerable variation in milk yield across species and states.Yields of different breeds of cattle (indigenous as well as crossbred) andbuffalo obtained under experimental conditions indicate possibilities ofincreasing milk yield. Due to lack of prior information on potential milk yieldof the dominant breeds in different states it is assumed that the local breedsin a state would be replaced by the high yielding breeds of the same species.For this purpose, yield of Red Sindhi for indigenous cattle, of Haryana XFresian for crossbred cattle and of Nili Ravi for buffalo are taken asyardsticks (Pundhir and Sahai 1997). The difference between the yield ofthese breeds obtained under experimental conditions and the mean of therealized yield of all breeds of the respective species provide estimates ofyield gaps. This however is a crucial assumption as the performance ofhigh yielding breeds varies across states depending on agroecological andsocioeconomic conditions. Nonetheless, the gap between realized andpotential yield exists even for the dominant breeds in different states.
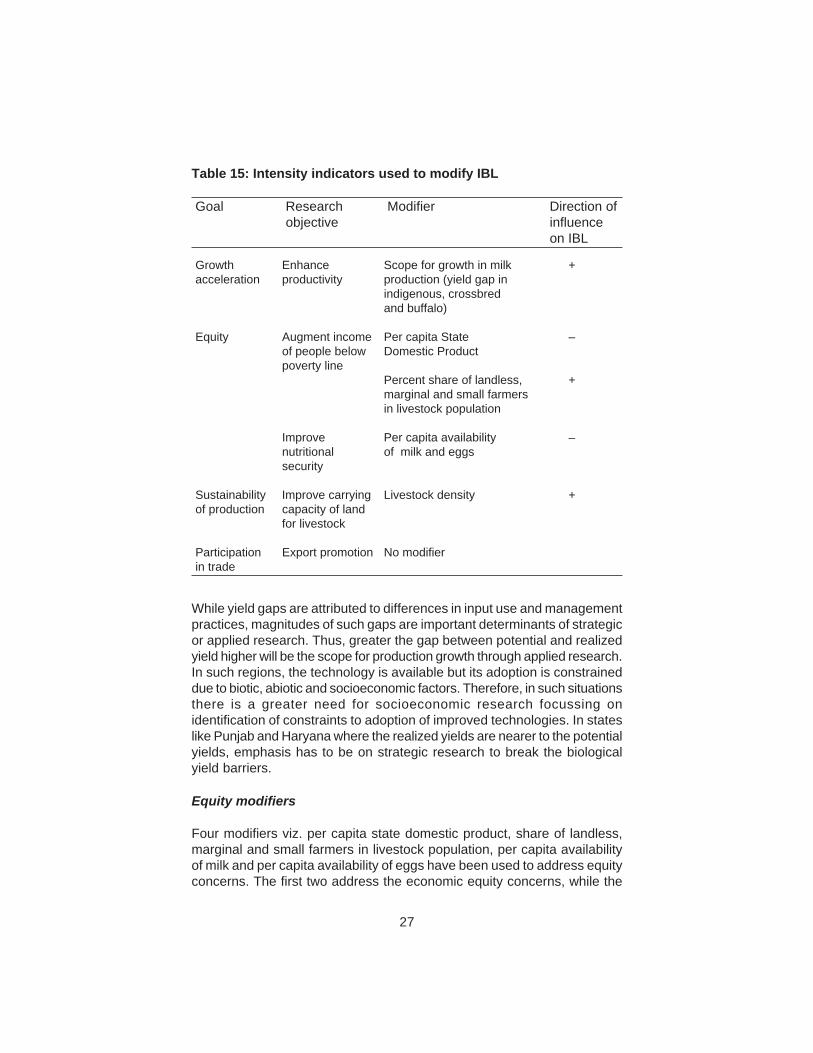
27
Table 15: Intensity indicators used to modify IBL
Goal Research Modifier Direction ofobjective influence
on IBL
Growth Enhance Scope for growth in milk +acceleration productivity production (yield gap in
indigenous, crossbredand buffalo)
Equity Augment income Per capita State –of people below Domestic Productpoverty line
Percent share of landless, +marginal and small farmersin livestock population
Improve Per capita availability –nutritional of milk and eggssecurity
Sustainability Improve carrying Livestock density +of production capacity of land
for livestock
Participation Export promotion No modifierin trade
While yield gaps are attributed to differences in input use and managementpractices, magnitudes of such gaps are important determinants of strategicor applied research. Thus, greater the gap between potential and realizedyield higher will be the scope for production growth through applied research.In such regions, the technology is available but its adoption is constraineddue to biotic, abiotic and socioeconomic factors. Therefore, in such situationsthere is a greater need for socioeconomic research focussing onidentification of constraints to adoption of improved technologies. In stateslike Punjab and Haryana where the realized yields are nearer to the potentialyields, emphasis has to be on strategic research to break the biologicalyield barriers.
Equity modifiers
Four modifiers viz. per capita state domestic product, share of landless,marginal and small farmers in livestock population, per capita availabilityof milk and per capita availability of eggs have been used to address equityconcerns. The first two address the economic equity concerns, while the
28
latter two address the issues related to nutritional equity. To improve incomedistribution more research resources are needed for the states with lowerper capita income and higher concentration of livestock among landless,marginal and small landholders. This would help improve upon theinterpersonal and interregional disparities.
Incidence of undernourishment is expected to be lower in states with higherper capita availability of livestock products. Diversification of food baskettowards livestock products would help mitigate problem ofundernourishment. Therefore, livestock research should target regionshaving higher incidence of undernourished population. Milk and eggs arethe preferred livestock products in the daily diet of the majority population.Thus, per capita availability of these commodities as modifiers takes careof the intensity of nutritional insecurity.
Sustainability modifiers
With an annual growth rate of about 5 percent livestock sector is one of thefastest growing sub-sectors of Indian agriculture. It is however unclearwhether this trend will sustain considering the growing number of livestock,declining per capita land availability, slow growth in area under fodder cropsand quantitative and qualitative deterioration of common grazing lands. Inother words, land and other natural resources available for livestock wouldcome under heavy pressure, threatening the sustainability of naturalresources as well as livestock output growth. This calls for emphasis onyield-enhancing research that would help optimize livestock populationcommensurate with available resources. Livestock density (per unit of netcropped area plus land available for livestock) during the triennium ending1997-98 is used as a modifier to address the sustainability issues in livestockproduction.
Selection of weights and signs of modifiers
Having identified modifiers, the next step is to assign weight to modifiers(in concurrence with their relative importance) and determine their signsas to quantify their individual or joint impact on IBL. The magnitude of theweight of the modifier directly influences the relative emphasis of eachconcern, and this is the explicit weight of the modifier. Besides, the variabilityin distribution of a modifier across states exerts indirect influence, which istermed as the implicit weight of the modifier. Recognizing the role of implicitweight of the modifier in impacting the IBL we have not introduced variedexplicit weights. Evidences indicate that higher weights to the modifiersbring in considerable distortions in relative ranking of regional priorities(CGIAR 1992). Thus, equal weights are assigned to all the modifiers. Themethodology however is flexible to accommodate varying weights.
29
A modifier will have either a positive or negative impact on initial baseline.For instance, higher the per capita domestic product in a state, lower shouldbe the research emphasis there to reduce interregional disparities in incomedistribution. Therefore, a negative sign is attached to this modifier. On theother hand, inter-household distribution of livestock (share of landless,marginal and small holders) would carry a positive sign as this helps improveinterpersonal equity in distribution of benefits of livestock research. Modifiersof nutritional equity (per capita availability of milk and egg) would havenegative signs as the states having less per caput availability would needmore research resources to enhance the production potential of livestockand thereby the availability of different livestock products. Positive signsare attached to efficiency modifiers (yield gaps) as the states with higheryield gaps need more emphasis to enhance the yield level nearer to thepotential yield. The livestock density variable, which addresses sustainabilityconcerns, carries a positive sign.
Thus, signs of the modifiers should be appropriately decided to quantifytheir impact on IBL, as the selection of signs involves logical judgements.The methodology enables use of different signs to different modifiers toevaluate their impacts and tradeoffs involved in priority setting with multipleobjectives.
Impact of modifiers
The impact of selected modifiers on the initial baseline can be quantifiedas follows.
Modified baseline
B’i = [ 1 + {Mij / Max (Mij)} x Wj ] Bi
New priority distribution
n
B”ij = ( B’i / Σ B’j) x 100i=1
Where, Bi is the IBL for ith state, Mij is the data for jth modifier for ith state, Wjis the weight for jth modifier, Bi
’ is the modified baseline for regional distributionof research resources, Bij
” is the new priority distribution for ith state basedon impact of jth modifier, and i refers to number of states (1 to n) and j refersto number of modifiers (1 to m).
The above procedure applies when modifiers have positive signs. Impactof modifiers with negative signs is obtained by subtracting {Mij/Max (Mij)}from unity.
30
Construction of the Final Baseline (FBL)
The impact of individual modifiers is summed up to get the net aggregateimpact of all modifiers. The IBL is then modified using the aggregate impactto obtain the FBL, indexed to sum up to 100 across states.
Assessment of Research Priorities
Priority by states
The FBL indexed to 100 across states generates shares of different statesin total research resources available at the national level. The states canbe ranked based on their shares in order of priority.
Priority by species
For operational purposes, regional priorities need to be translated intospecies and/or commodity priorities. This is done by adjusting the VOP ofeach species in each state by an adjustment factor. The adjustment factorfor each state is obtained by multiplying the VOP by the ratio of prioritydistribution based on FBL and priority distribution based on VOP (FBL/VOP). A ratio greater than one implies an upward adjustment in allocationreinforced by concerns of equity, sustainability or trade or all. A ratio lessthan one implies otherwise. The same procedure can be applied to getfunctional (commodity) priorities for an individual species.
Priority by species and states
The VOP of each species adjusted to the FBL/VOP ratio is used to generatethe relative priorities by species across states and the country as a whole.
31
Livestock sector accounts for nearly one-fourth of the gross value ofagricultural output in the country (Table 16). This however varies widelyacross states. In Punjab, Jammu & Kashmir and Meghalaya, livestockcontributes more than one-third to the total value of output of agriculturalsector. The states in which the contribution of livestock ranges betweenone-fourth to one-third to the gross value of agricultural output are Bihar,Haryana, Himachal Pradesh, Rajasthan and Nagaland. In other states,except Goa, Orissa, Arunachal Pradesh, Assam and Tripura, it rangesbetween 20 to 25 percent.
Estimates by Jha et al. (1995) suggested an allocation of 23 percent of theagricultural research resources for animal science research (last col. ofTable 16). Across states, this varied from 16 percent in Assam to 34 percentin Rajasthan, which was largely in conformity with the contribution oflivestock to gross value of agricultural output in these states.
Distribution of Extensity Parameters
Distribution of extensity parameters viz. value of production (VOP), poverty(POOR), undernourished population (UNUR), sustainability (CPR) andexports (EXPO) across states is shown in Table 17.
Value of output of livestock (VOP)
VOP is the initial indicator of research resource allocation across regionswhen the sole objective of research is to improve the efficiency of research.This means distribution of research resources should be in proportion oftheir shares in total value of output produced in the country. The distributionof VOP shown in Table 17 suggests highest allocation for Uttar Pradesh(14.7%), followed by Maharashtra (8.8%), Punjab (8%), Madhya Pradesh(7.7%), West Bengal (7.5%), Andhra Pradesh (7.4%), Rajasthan (7.3%)and Bihar (7.2%).
Poverty (POOR)
The distribution of poor people across states shows their highestconcentration (18.9%) in Uttar Pradesh (Table 17). Bihar ranks secondwith a share of 15.2 percent, and is followed by Maharashtra (10.3%),
IV REGIONAL PRIORITIES IN LIVESTOCKRESEARCH
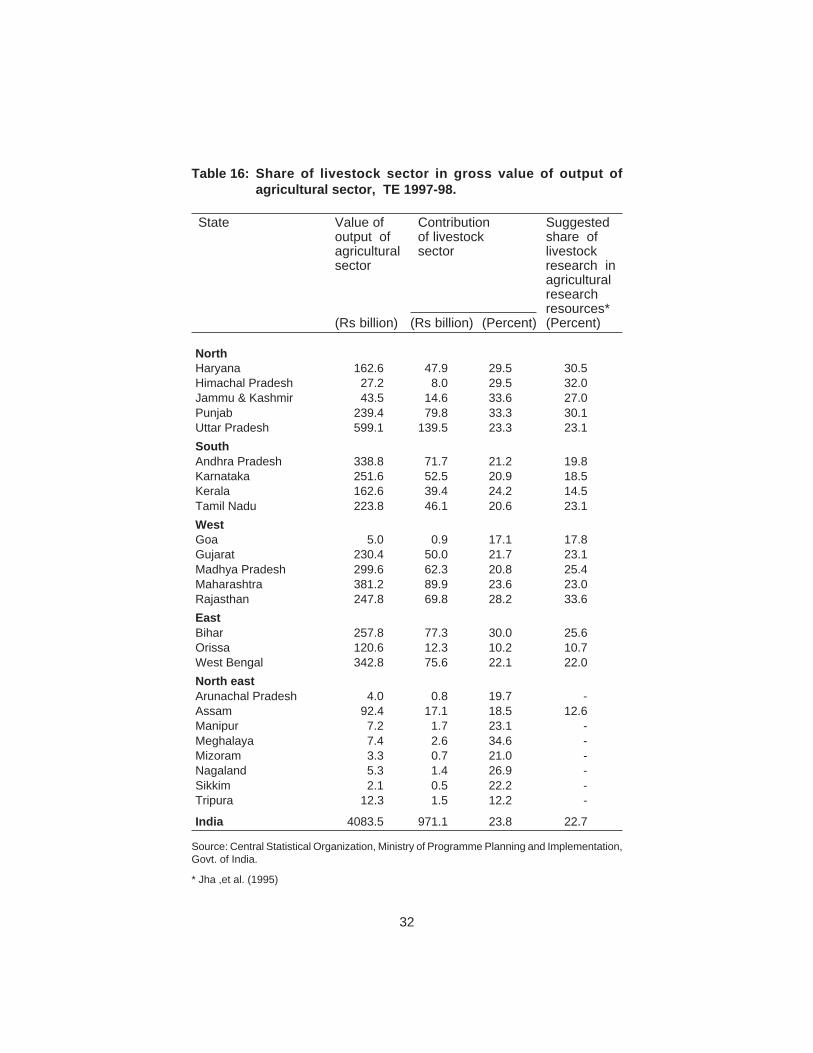
32
Table 16: Share of livestock sector in gross value of output ofagricultural sector, TE 1997-98.
State Value of Contribution Suggestedoutput of of livestock share ofagricultural sector livestocksector research in
agriculturalresearchresources*
(Rs billion) (Rs billion) (Percent) (Percent)
NorthHaryana 162.6 47.9 29.5 30.5Himachal Pradesh 27.2 8.0 29.5 32.0Jammu & Kashmir 43.5 14.6 33.6 27.0Punjab 239.4 79.8 33.3 30.1Uttar Pradesh 599.1 139.5 23.3 23.1SouthAndhra Pradesh 338.8 71.7 21.2 19.8Karnataka 251.6 52.5 20.9 18.5Kerala 162.6 39.4 24.2 14.5Tamil Nadu 223.8 46.1 20.6 23.1WestGoa 5.0 0.9 17.1 17.8Gujarat 230.4 50.0 21.7 23.1Madhya Pradesh 299.6 62.3 20.8 25.4Maharashtra 381.2 89.9 23.6 23.0Rajasthan 247.8 69.8 28.2 33.6EastBihar 257.8 77.3 30.0 25.6Orissa 120.6 12.3 10.2 10.7West Bengal 342.8 75.6 22.1 22.0North eastArunachal Pradesh 4.0 0.8 19.7 -Assam 92.4 17.1 18.5 12.6Manipur 7.2 1.7 23.1 -Meghalaya 7.4 2.6 34.6 -Mizoram 3.3 0.7 21.0 -Nagaland 5.3 1.4 26.9 -Sikkim 2.1 0.5 22.2 -Tripura 12.3 1.5 12.2 -
India 4083.5 971.1 23.8 22.7
Source: Central Statistical Organization, Ministry of Programme Planning and Implementation,Govt. of India.
* Jha ,et al. (1995)
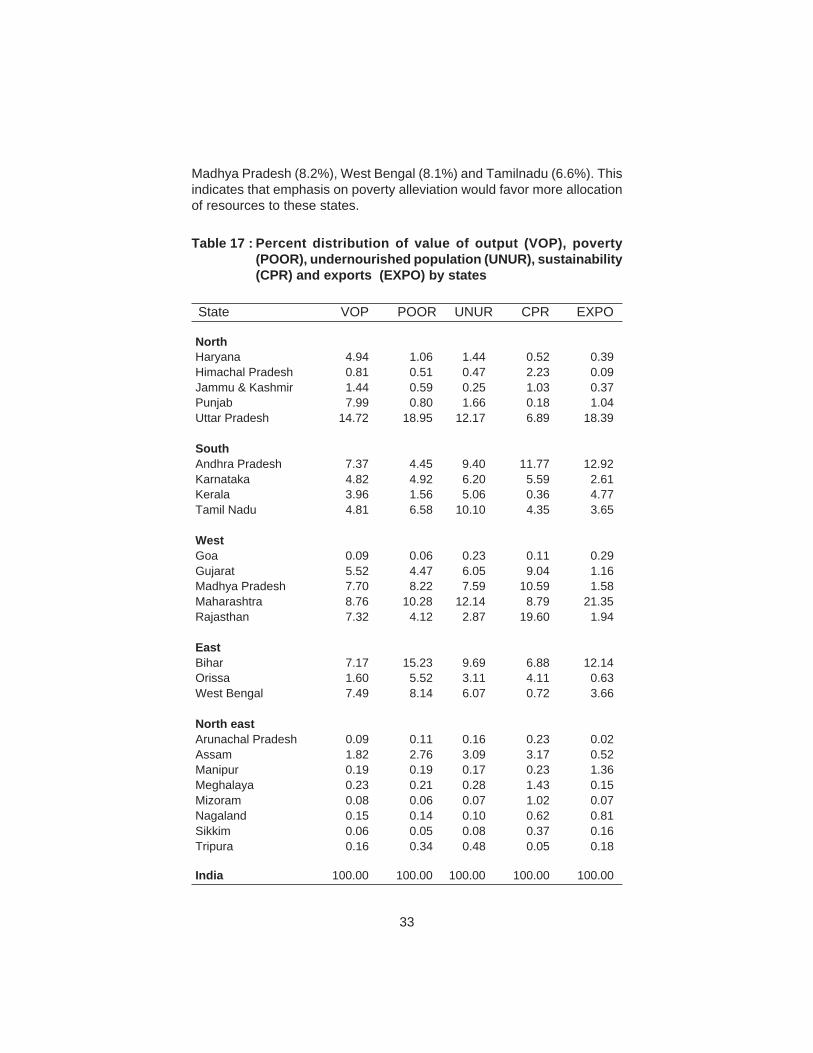
33
Table 17 : Percent distribution of value of output (VOP), poverty(POOR), undernourished population (UNUR), sustainability(CPR) and exports (EXPO) by states
State VOP POOR UNUR CPR EXPO
NorthHaryana 4.94 1.06 1.44 0.52 0.39Himachal Pradesh 0.81 0.51 0.47 2.23 0.09Jammu & Kashmir 1.44 0.59 0.25 1.03 0.37Punjab 7.99 0.80 1.66 0.18 1.04Uttar Pradesh 14.72 18.95 12.17 6.89 18.39
SouthAndhra Pradesh 7.37 4.45 9.40 11.77 12.92Karnataka 4.82 4.92 6.20 5.59 2.61Kerala 3.96 1.56 5.06 0.36 4.77Tamil Nadu 4.81 6.58 10.10 4.35 3.65
WestGoa 0.09 0.06 0.23 0.11 0.29Gujarat 5.52 4.47 6.05 9.04 1.16Madhya Pradesh 7.70 8.22 7.59 10.59 1.58Maharashtra 8.76 10.28 12.14 8.79 21.35Rajasthan 7.32 4.12 2.87 19.60 1.94
EastBihar 7.17 15.23 9.69 6.88 12.14Orissa 1.60 5.52 3.11 4.11 0.63West Bengal 7.49 8.14 6.07 0.72 3.66
North eastArunachal Pradesh 0.09 0.11 0.16 0.23 0.02Assam 1.82 2.76 3.09 3.17 0.52Manipur 0.19 0.19 0.17 0.23 1.36Meghalaya 0.23 0.21 0.28 1.43 0.15Mizoram 0.08 0.06 0.07 1.02 0.07Nagaland 0.15 0.14 0.10 0.62 0.81Sikkim 0.06 0.05 0.08 0.37 0.16Tripura 0.16 0.34 0.48 0.05 0.18
India 100.00 100.00 100.00 100.00 100.00
Madhya Pradesh (8.2%), West Bengal (8.1%) and Tamilnadu (6.6%). Thisindicates that emphasis on poverty alleviation would favor more allocationof resources to these states.
34
Undernourished population (UNUR)
Uttar Pradesh has highest undernourished population (12.2%) in thecountry. This is closely followed by Maharashtra (12.1%). Tamilnadu, Bihar,Andhra Pradesh and Madhya Pradesh are other states having sizeableshare in undernourished population. Concerns for nutritional security/equitywould favor higher resources for these states.
Common property resources (CPR)
The regional distribution of CPRs shown in Table 17 indicates their highestconcentration in Rajasthan (19.6%). Andhra Pradesh, Gujarat, Maharashtra,Uttar Pradesh and Bihar too account for substantial share in total CPRs.Thus, these states should receive higher priority if the emphasis of researchwere to improve sustainability of livestock systems through conservationand management of CPRs.
Exports (EXPO)
This indicator is designed to address the trade-related issues in priorityassessment. It is defined as the share of a state in national export earningsfrom the livestock sector. The export portfolio includes live animals, dairyproducts, meat, and poultry products. With export as a criterion of allocationof research resources, bulk of the resources are shared by Maharashtra,Uttar Pradesh, Andhra Pradesh and Bihar in that order.
Initial Baseline (IBL)
The distribution of extensity parameters indicate that research emphasisshould be on the regions having comparatively higher share in value ofoutput, poor and undernourished population, grazing resources and exports.The shares of the states however vary for each extensity parameter. Acomposite index of allocation of research resources (weighted sum ofextensity parameters) has been generated by assigning equal weight toeach specified objective. In case of equity objective, the weight is sharedequally between its two indicators, i.e. population of the poor and theundernourished. Thus, a baseline for research resource allocation has beenarrived (indexed to sum up to 100 at all India level), and is shown inTable 18.
VOP based allocation assigns high priority to Uttar Pradesh, Maharashtra,Punjab, Madhya Pradesh, West Bengal, Andhra Pradesh, Rajasthan andBihar. When poverty is superimposed on VOP index, Uttar Pradeshconsolidates its position and Bihar gains considerably by moving to second
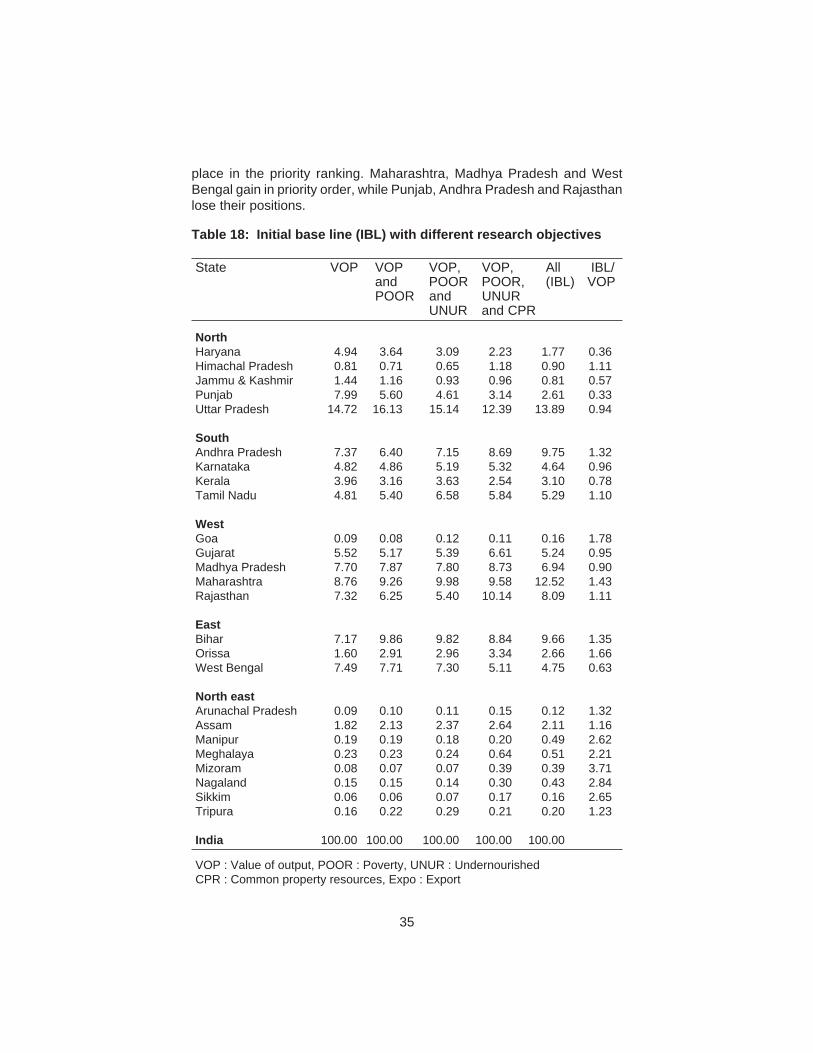
35
place in the priority ranking. Maharashtra, Madhya Pradesh and WestBengal gain in priority order, while Punjab, Andhra Pradesh and Rajasthanlose their positions.
Table 18: Initial base line (IBL) with different research objectives
State VOP VOP VOP, VOP, All IBL/and POOR POOR, (IBL) VOPPOOR and UNUR
UNUR and CPR
NorthHaryana 4.94 3.64 3.09 2.23 1.77 0.36Himachal Pradesh 0.81 0.71 0.65 1.18 0.90 1.11Jammu & Kashmir 1.44 1.16 0.93 0.96 0.81 0.57Punjab 7.99 5.60 4.61 3.14 2.61 0.33Uttar Pradesh 14.72 16.13 15.14 12.39 13.89 0.94
SouthAndhra Pradesh 7.37 6.40 7.15 8.69 9.75 1.32Karnataka 4.82 4.86 5.19 5.32 4.64 0.96Kerala 3.96 3.16 3.63 2.54 3.10 0.78Tamil Nadu 4.81 5.40 6.58 5.84 5.29 1.10
WestGoa 0.09 0.08 0.12 0.11 0.16 1.78Gujarat 5.52 5.17 5.39 6.61 5.24 0.95Madhya Pradesh 7.70 7.87 7.80 8.73 6.94 0.90Maharashtra 8.76 9.26 9.98 9.58 12.52 1.43Rajasthan 7.32 6.25 5.40 10.14 8.09 1.11
EastBihar 7.17 9.86 9.82 8.84 9.66 1.35Orissa 1.60 2.91 2.96 3.34 2.66 1.66West Bengal 7.49 7.71 7.30 5.11 4.75 0.63
North eastArunachal Pradesh 0.09 0.10 0.11 0.15 0.12 1.32Assam 1.82 2.13 2.37 2.64 2.11 1.16Manipur 0.19 0.19 0.18 0.20 0.49 2.62Meghalaya 0.23 0.23 0.24 0.64 0.51 2.21Mizoram 0.08 0.07 0.07 0.39 0.39 3.71Nagaland 0.15 0.15 0.14 0.30 0.43 2.84Sikkim 0.06 0.06 0.07 0.17 0.16 2.65Tripura 0.16 0.22 0.29 0.21 0.20 1.23
India 100.00 100.00 100.00 100.00 100.00
VOP : Value of output, POOR : Poverty, UNUR : UndernourishedCPR : Common property resources, Expo : Export
36
With addition of nutritional security dimension, Uttar Pradesh continues torank first but loses marginally. Maharashtra reverts to its original ranking tosecond place and Bihar slides to the third place. Madhya Pradesh, WestBengal and Andhra Pradesh are other states in the priority order. Punjabloses considerably and is replaced by Tamilnadu. The concerns for equitythus bring in considerable trade off in regional research resource allocation.
The priority ranking of the states is further reshuffled on incorporation ofsustainability considerations. Uttar Pradesh maintains its position, but withconsiderable decline in its share in research resources. Rajasthan emergessecond in the priority list, and is followed by Maharashtra, Bihar, MadhyaPradesh, Andhra Pradesh, Gujarat and Tamilnadu. The final iteration withall the extensity parameters (including exports) suggests that nearly three-fourths of the livestock research resources would be claimed by UttarPradesh (13.9%), Maharashtra (12.5%), Andhra Pradesh (9.7%), Bihar(9.6%), Rajasthan (8.1%), Madhya Pradesh (6.9%), Tamilnadu (5.3%) andGujarat (5.2%).
The IBL/VOP ratio indicates that in the IBL based allocation all the states ineastern (except West Bengal) and northeastern regions improve theirshares over VOP based allocation. Among the western states, Maharashtraand Rajasthan gain considerably, and Madhya Pradesh and Gujarat losemarginally. In the southern region, Andhra Pradesh and Tamilnadu improvetheir shares over the VOP based allocation, and the shares of Kerala andKarnataka get reduced at the margin. In the northern regions, Punjab,Haryana, Jammu & Kashmir lose considerably, while Uttar Pradesh losesmarginally over their VOP shares. It is only Himachal Pradesh in this regionthat gains marginally over its VOP based share. The considerations ofpoverty, nutritional security, sustainability and exports help these states togain over simple VOP based allocation.
Final Baseline (FBL)
The IBL has been modified to accommodate the intensity of the problem10
to be addressed by the research system. The impact of the modifiers onthe IBL, and modified base line i.e. FBL are shown in Table 19.
The distribution pattern of livestock research resources changes whenextensity indicators and their modifiers are considered together. Shares ofHaryana, Punjab and Gujarat, Andhra Pradesh, Karnataka, Tamilnadu,Goa, Maharashtra and Rajasthan further decline, while other statesconsolidate their positions over IBL based allocations. This implies thatneglect of intensity dimensions may lead to sub-optimal allocation ofresearch resources.10 The values of the intensity indicators are given in Annexure II.
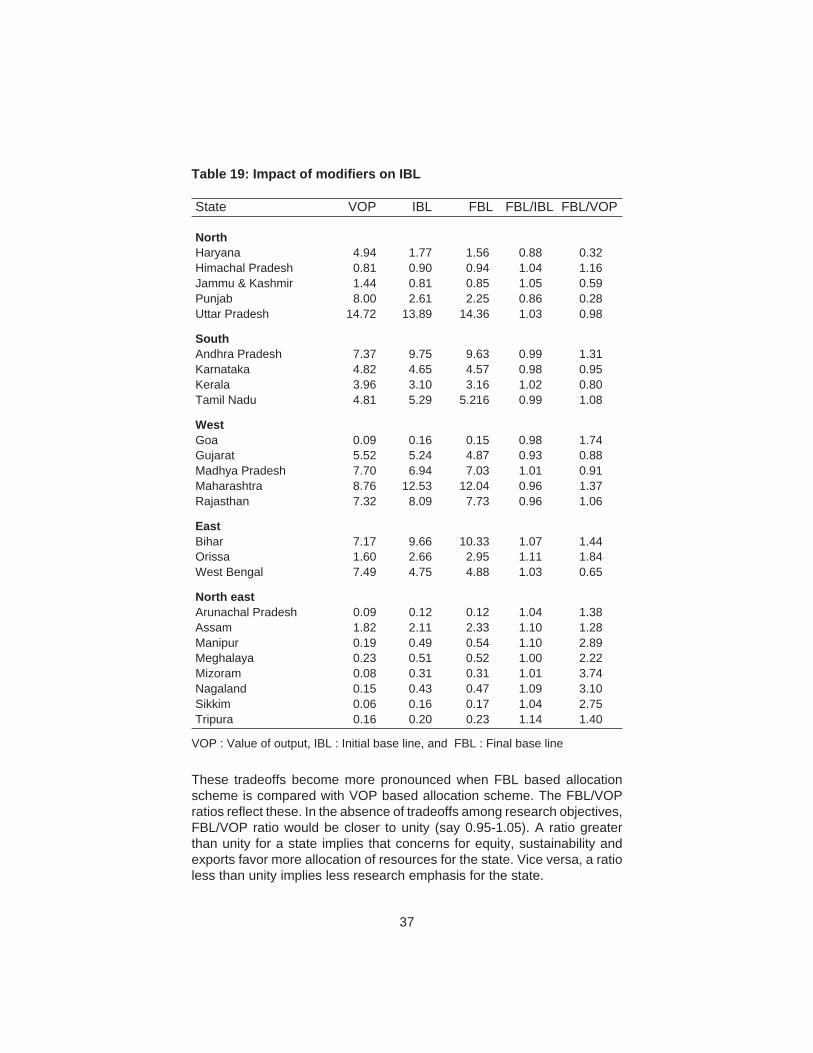
37
These tradeoffs become more pronounced when FBL based allocationscheme is compared with VOP based allocation scheme. The FBL/VOPratios reflect these. In the absence of tradeoffs among research objectives,FBL/VOP ratio would be closer to unity (say 0.95-1.05). A ratio greaterthan unity for a state implies that concerns for equity, sustainability andexports favor more allocation of resources for the state. Vice versa, a ratioless than unity implies less research emphasis for the state.
Table 19: Impact of modifiers on IBL
State VOP IBL FBL FBL/IBL FBL/VOP
NorthHaryana 4.94 1.77 1.56 0.88 0.32Himachal Pradesh 0.81 0.90 0.94 1.04 1.16Jammu & Kashmir 1.44 0.81 0.85 1.05 0.59Punjab 8.00 2.61 2.25 0.86 0.28Uttar Pradesh 14.72 13.89 14.36 1.03 0.98
SouthAndhra Pradesh 7.37 9.75 9.63 0.99 1.31Karnataka 4.82 4.65 4.57 0.98 0.95Kerala 3.96 3.10 3.16 1.02 0.80Tamil Nadu 4.81 5.29 5.216 0.99 1.08
WestGoa 0.09 0.16 0.15 0.98 1.74Gujarat 5.52 5.24 4.87 0.93 0.88Madhya Pradesh 7.70 6.94 7.03 1.01 0.91Maharashtra 8.76 12.53 12.04 0.96 1.37Rajasthan 7.32 8.09 7.73 0.96 1.06
EastBihar 7.17 9.66 10.33 1.07 1.44Orissa 1.60 2.66 2.95 1.11 1.84West Bengal 7.49 4.75 4.88 1.03 0.65
North eastArunachal Pradesh 0.09 0.12 0.12 1.04 1.38Assam 1.82 2.11 2.33 1.10 1.28Manipur 0.19 0.49 0.54 1.10 2.89Meghalaya 0.23 0.51 0.52 1.00 2.22Mizoram 0.08 0.31 0.31 1.01 3.74Nagaland 0.15 0.43 0.47 1.09 3.10Sikkim 0.06 0.16 0.17 1.04 2.75Tripura 0.16 0.20 0.23 1.14 1.40
VOP : Value of output, IBL : Initial base line, and FBL : Final base line
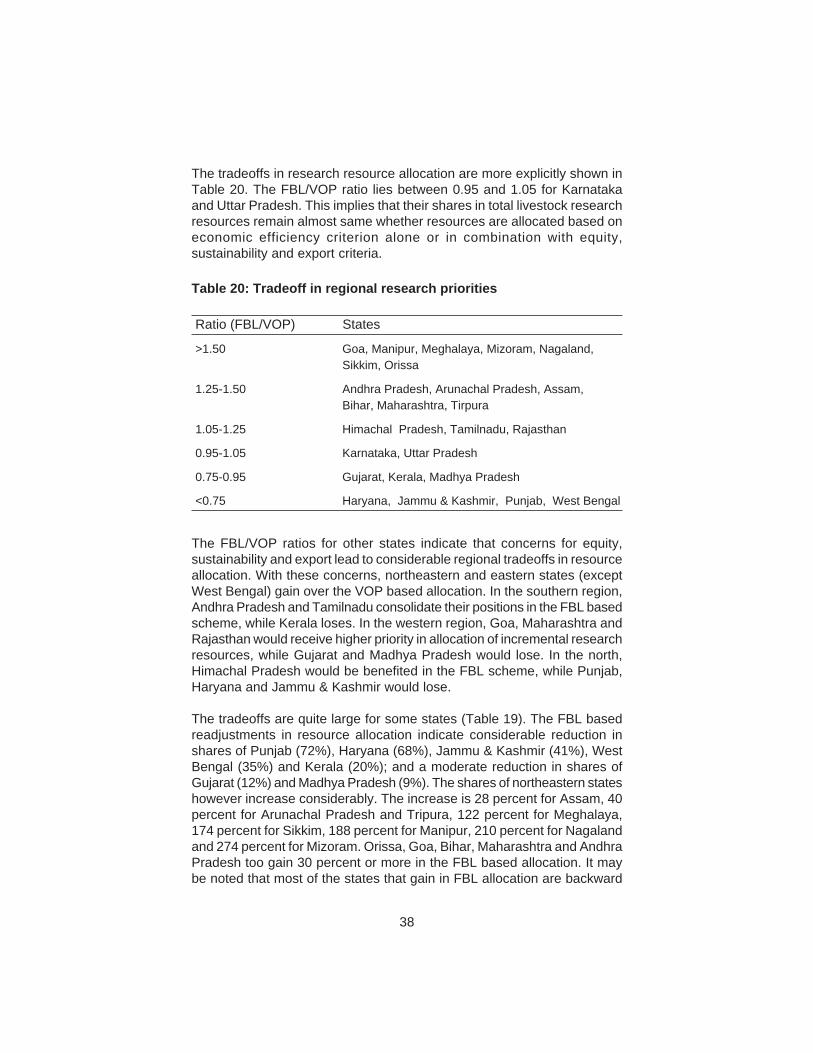
38
The tradeoffs in research resource allocation are more explicitly shown inTable 20. The FBL/VOP ratio lies between 0.95 and 1.05 for Karnatakaand Uttar Pradesh. This implies that their shares in total livestock researchresources remain almost same whether resources are allocated based oneconomic efficiency criterion alone or in combination with equity,sustainability and export criteria.
Table 20: Tradeoff in regional research priorities
Ratio (FBL/VOP) States
>1.50 Goa, Manipur, Meghalaya, Mizoram, Nagaland,Sikkim, Orissa
1.25-1.50 Andhra Pradesh, Arunachal Pradesh, Assam,Bihar, Maharashtra, Tirpura
1.05-1.25 Himachal Pradesh, Tamilnadu, Rajasthan
0.95-1.05 Karnataka, Uttar Pradesh
0.75-0.95 Gujarat, Kerala, Madhya Pradesh
<0.75 Haryana, Jammu & Kashmir, Punjab, West Bengal
The FBL/VOP ratios for other states indicate that concerns for equity,sustainability and export lead to considerable regional tradeoffs in resourceallocation. With these concerns, northeastern and eastern states (exceptWest Bengal) gain over the VOP based allocation. In the southern region,Andhra Pradesh and Tamilnadu consolidate their positions in the FBL basedscheme, while Kerala loses. In the western region, Goa, Maharashtra andRajasthan would receive higher priority in allocation of incremental researchresources, while Gujarat and Madhya Pradesh would lose. In the north,Himachal Pradesh would be benefited in the FBL scheme, while Punjab,Haryana and Jammu & Kashmir would lose.
The tradeoffs are quite large for some states (Table 19). The FBL basedreadjustments in resource allocation indicate considerable reduction inshares of Punjab (72%), Haryana (68%), Jammu & Kashmir (41%), WestBengal (35%) and Kerala (20%); and a moderate reduction in shares ofGujarat (12%) and Madhya Pradesh (9%). The shares of northeastern stateshowever increase considerably. The increase is 28 percent for Assam, 40percent for Arunachal Pradesh and Tripura, 122 percent for Meghalaya,174 percent for Sikkim, 188 percent for Manipur, 210 percent for Nagalandand 274 percent for Mizoram. Orissa, Goa, Bihar, Maharashtra and AndhraPradesh too gain 30 percent or more in the FBL based allocation. It maybe noted that most of the states that gain in FBL allocation are backward
39
or are in the development stage of agriculture, while those lose or maintaintheir shares in incremental allocations are in the fairly advanced stage ofdevelopment. Further, in the former group of states contribution of livestockis less compared to the latter.
The results imply that though improving production efficiency is the mainemphasis of research, ignoring long-term social and environmental goalsin allocation of livestock research resources might aggravate regionaldisparities in livestock development. Unfortunately, no reliable informationis available on the investments made in animal science research at thestate level to verify the readjustments suggested by this analysis.
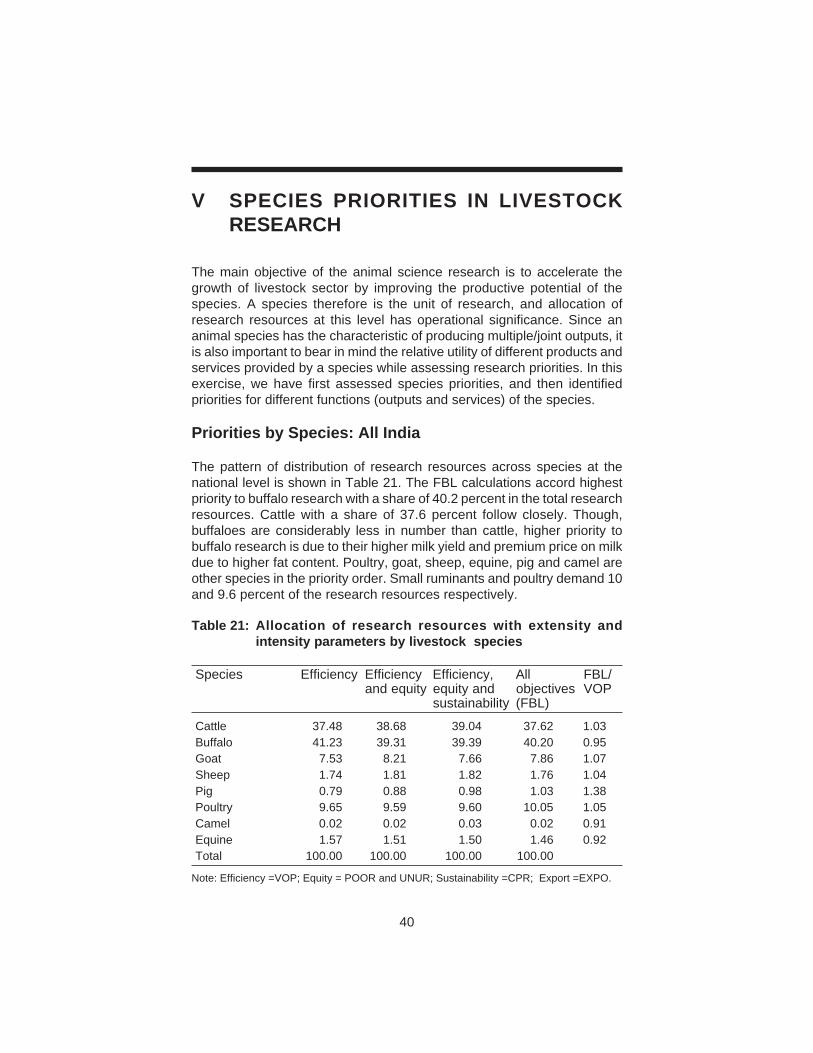
40
The main objective of the animal science research is to accelerate thegrowth of livestock sector by improving the productive potential of thespecies. A species therefore is the unit of research, and allocation ofresearch resources at this level has operational significance. Since ananimal species has the characteristic of producing multiple/joint outputs, itis also important to bear in mind the relative utility of different products andservices provided by a species while assessing research priorities. In thisexercise, we have first assessed species priorities, and then identifiedpriorities for different functions (outputs and services) of the species.
Priorities by Species: All India
The pattern of distribution of research resources across species at thenational level is shown in Table 21. The FBL calculations accord highestpriority to buffalo research with a share of 40.2 percent in the total researchresources. Cattle with a share of 37.6 percent follow closely. Though,buffaloes are considerably less in number than cattle, higher priority tobuffalo research is due to their higher milk yield and premium price on milkdue to higher fat content. Poultry, goat, sheep, equine, pig and camel areother species in the priority order. Small ruminants and poultry demand 10and 9.6 percent of the research resources respectively.
V SPECIES PRIORITIES IN LIVESTOCKRESEARCH
Table 21: Allocation of research resources with extensity andintensity parameters by livestock species
Species Efficiency Efficiency Efficiency, All FBL/and equity equity and objectives VOP
sustainability (FBL)
Cattle 37.48 38.68 39.04 37.62 1.03Buffalo 41.23 39.31 39.39 40.20 0.95Goat 7.53 8.21 7.66 7.86 1.07Sheep 1.74 1.81 1.82 1.76 1.04Pig 0.79 0.88 0.98 1.03 1.38Poultry 9.65 9.59 9.60 10.05 1.05Camel 0.02 0.02 0.03 0.02 0.91Equine 1.57 1.51 1.50 1.46 0.92Total 100.00 100.00 100.00 100.00
Note: Efficiency =VOP; Equity = POOR and UNUR; Sustainability =CPR; Export =EXPO.
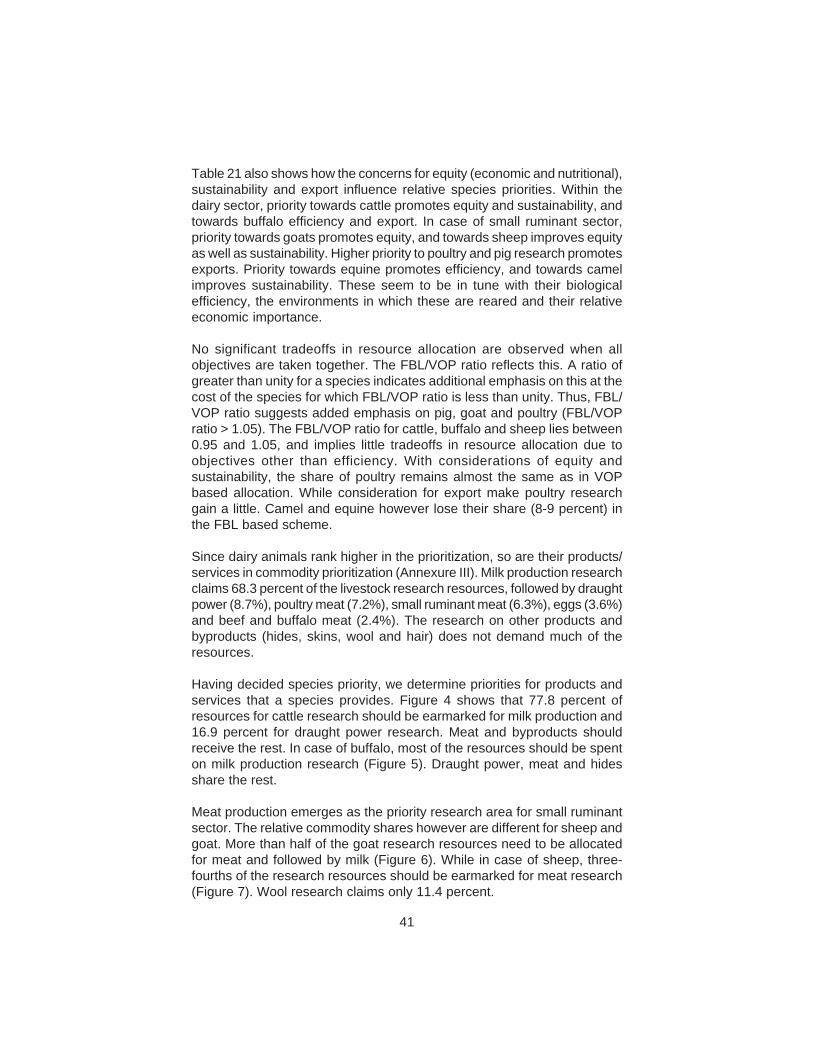
41
Table 21 also shows how the concerns for equity (economic and nutritional),sustainability and export influence relative species priorities. Within thedairy sector, priority towards cattle promotes equity and sustainability, andtowards buffalo efficiency and export. In case of small ruminant sector,priority towards goats promotes equity, and towards sheep improves equityas well as sustainability. Higher priority to poultry and pig research promotesexports. Priority towards equine promotes efficiency, and towards camelimproves sustainability. These seem to be in tune with their biologicalefficiency, the environments in which these are reared and their relativeeconomic importance.
No significant tradeoffs in resource allocation are observed when allobjectives are taken together. The FBL/VOP ratio reflects this. A ratio ofgreater than unity for a species indicates additional emphasis on this at thecost of the species for which FBL/VOP ratio is less than unity. Thus, FBL/VOP ratio suggests added emphasis on pig, goat and poultry (FBL/VOPratio > 1.05). The FBL/VOP ratio for cattle, buffalo and sheep lies between0.95 and 1.05, and implies little tradeoffs in resource allocation due toobjectives other than efficiency. With considerations of equity andsustainability, the share of poultry remains almost the same as in VOPbased allocation. While consideration for export make poultry researchgain a little. Camel and equine however lose their share (8-9 percent) inthe FBL based scheme.
Since dairy animals rank higher in the prioritization, so are their products/services in commodity prioritization (Annexure III). Milk production researchclaims 68.3 percent of the livestock research resources, followed by draughtpower (8.7%), poultry meat (7.2%), small ruminant meat (6.3%), eggs (3.6%)and beef and buffalo meat (2.4%). The research on other products andbyproducts (hides, skins, wool and hair) does not demand much of theresources.
Having decided species priority, we determine priorities for products andservices that a species provides. Figure 4 shows that 77.8 percent ofresources for cattle research should be earmarked for milk production and16.9 percent for draught power research. Meat and byproducts shouldreceive the rest. In case of buffalo, most of the resources should be spenton milk production research (Figure 5). Draught power, meat and hidesshare the rest.
Meat production emerges as the priority research area for small ruminantsector. The relative commodity shares however are different for sheep andgoat. More than half of the goat research resources need to be allocatedfor meat and followed by milk (Figure 6). While in case of sheep, three-fourths of the research resources should be earmarked for meat research(Figure 7). Wool research claims only 11.4 percent.
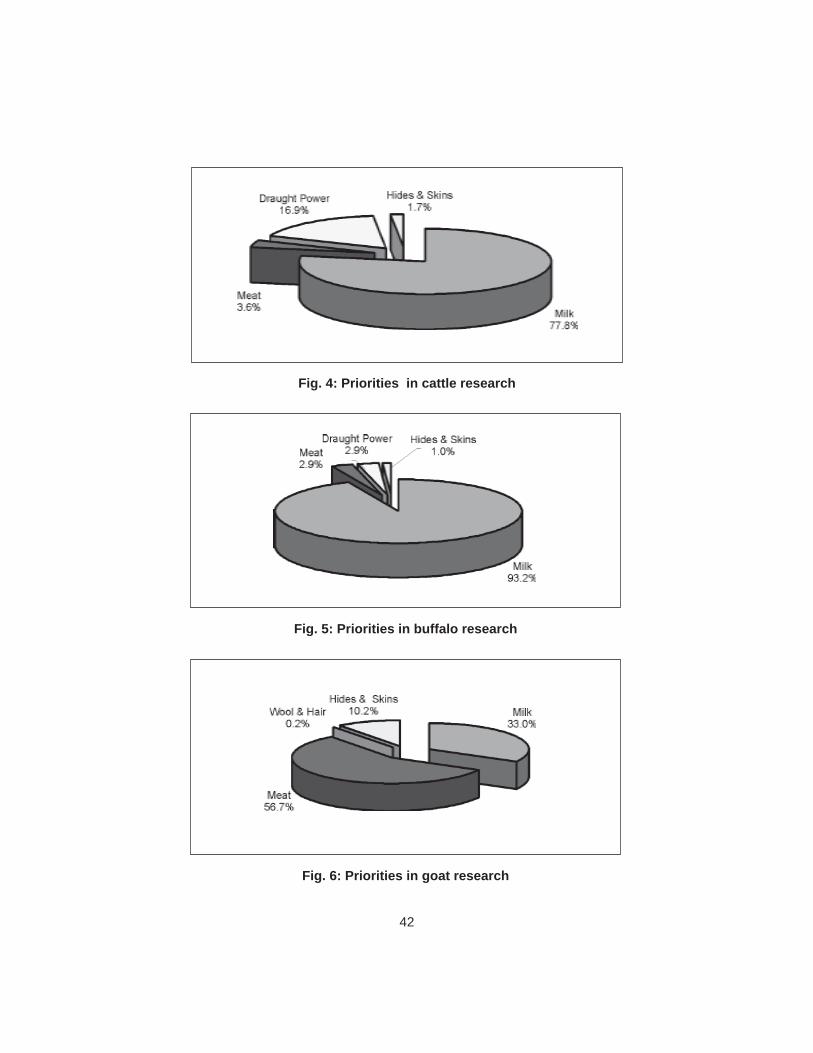
42
Fig. 4: Priorities in cattle research
Fig. 5: Priorities in buffalo research
Fig. 6: Priorities in goat research
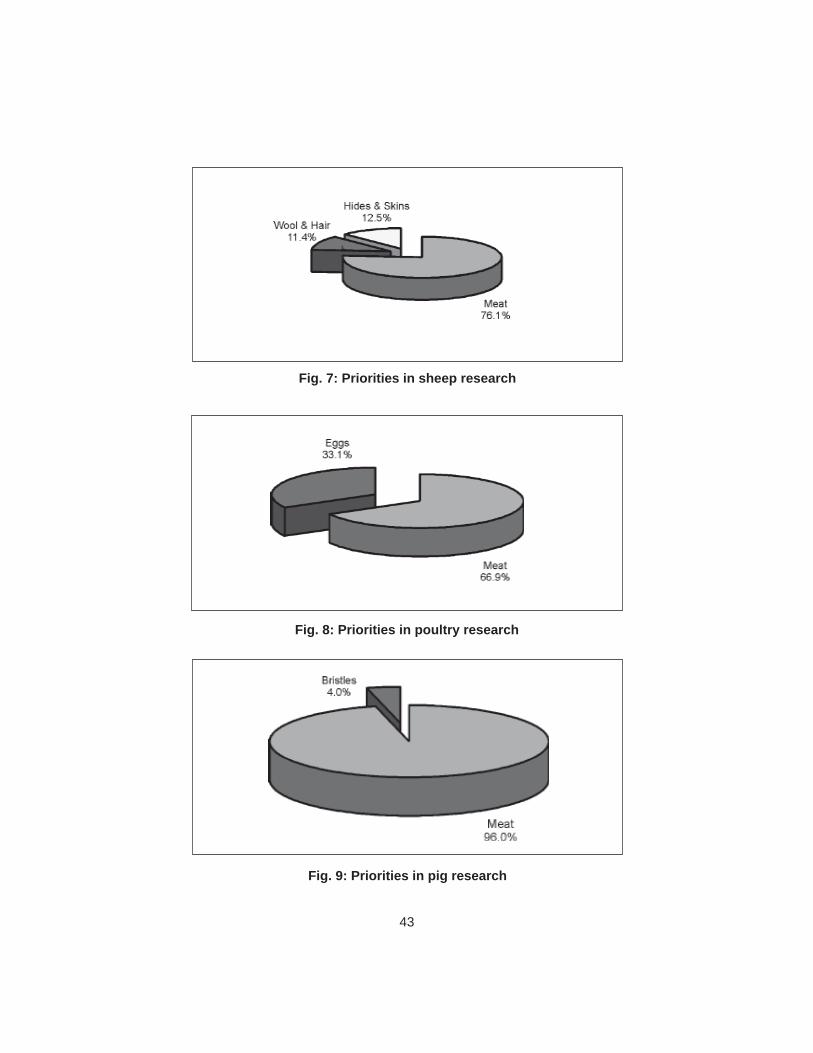
43
Fig. 7: Priorities in sheep research
Fig. 8: Priorities in poultry research
Fig. 9: Priorities in pig research
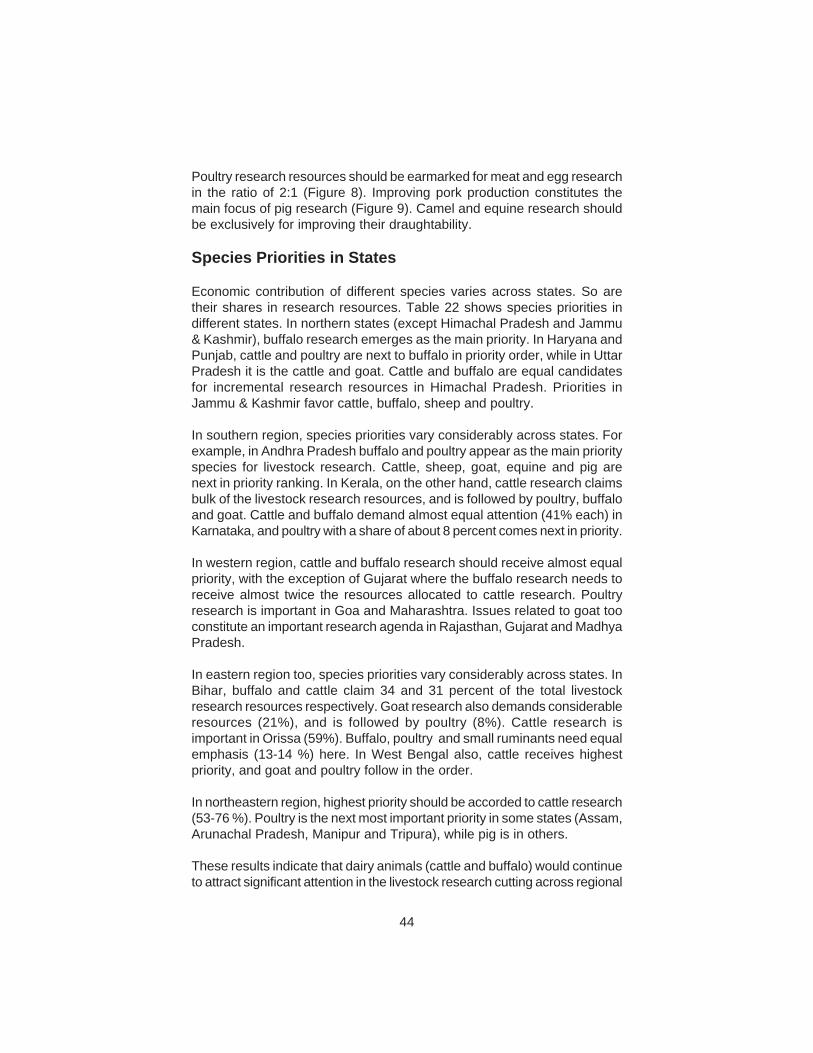
Poultry research resources should be earmarked for meat and egg researchin the ratio of 2:1 (Figure 8). Improving pork production constitutes themain focus of pig research (Figure 9). Camel and equine research shouldbe exclusively for improving their draughtability.
Species Priorities in States
Economic contribution of different species varies across states. So aretheir shares in research resources. Table 22 shows species priorities indifferent states. In northern states (except Himachal Pradesh and Jammu& Kashmir), buffalo research emerges as the main priority. In Haryana andPunjab, cattle and poultry are next to buffalo in priority order, while in UttarPradesh it is the cattle and goat. Cattle and buffalo are equal candidatesfor incremental research resources in Himachal Pradesh. Priorities inJammu & Kashmir favor cattle, buffalo, sheep and poultry.
In southern region, species priorities vary considerably across states. Forexample, in Andhra Pradesh buffalo and poultry appear as the main priorityspecies for livestock research. Cattle, sheep, goat, equine and pig arenext in priority ranking. In Kerala, on the other hand, cattle research claimsbulk of the livestock research resources, and is followed by poultry, buffaloand goat. Cattle and buffalo demand almost equal attention (41% each) inKarnataka, and poultry with a share of about 8 percent comes next in priority.
In western region, cattle and buffalo research should receive almost equalpriority, with the exception of Gujarat where the buffalo research needs toreceive almost twice the resources allocated to cattle research. Poultryresearch is important in Goa and Maharashtra. Issues related to goat tooconstitute an important research agenda in Rajasthan, Gujarat and MadhyaPradesh.
In eastern region too, species priorities vary considerably across states. InBihar, buffalo and cattle claim 34 and 31 percent of the total livestockresearch resources respectively. Goat research also demands considerableresources (21%), and is followed by poultry (8%). Cattle research isimportant in Orissa (59%). Buffalo, poultry and small ruminants need equalemphasis (13-14 %) here. In West Bengal also, cattle receives highestpriority, and goat and poultry follow in the order.
In northeastern region, highest priority should be accorded to cattle research(53-76 %). Poultry is the next most important priority in some states (Assam,Arunachal Pradesh, Manipur and Tripura), while pig is in others.
These results indicate that dairy animals (cattle and buffalo) would continueto attract significant attention in the livestock research cutting across regional
44
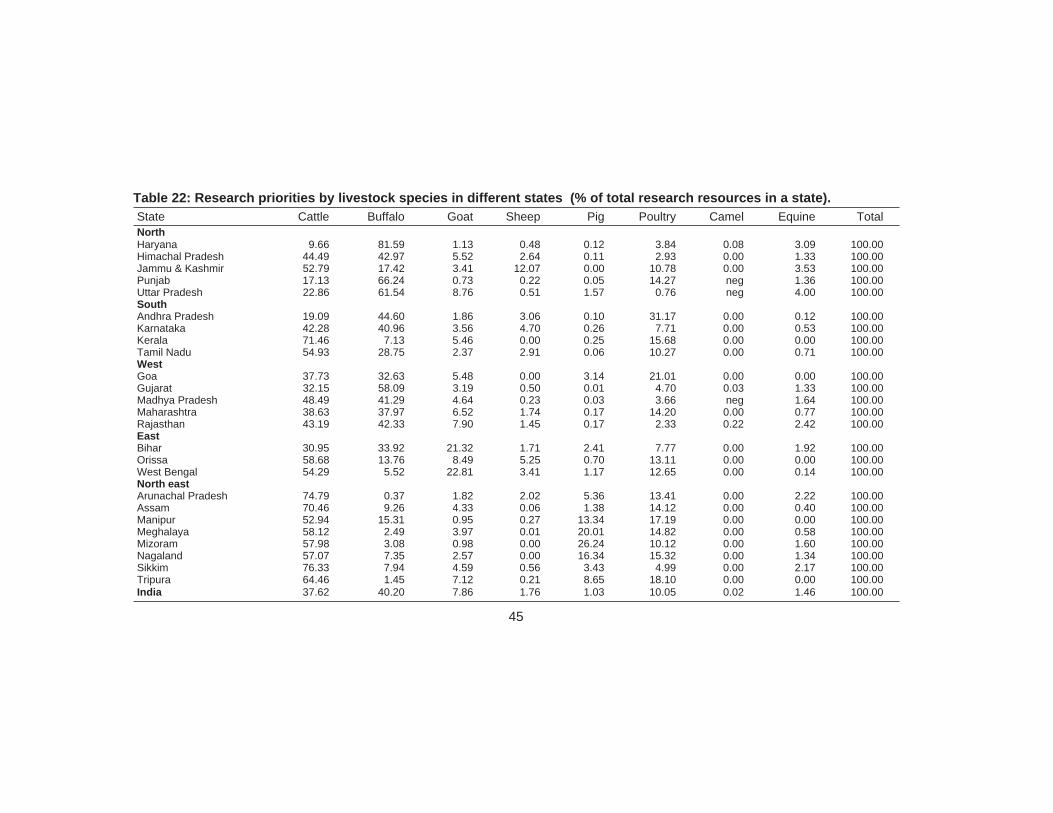
Table 22: Research priorities by livestock species in different states (% of total research resources in a state).State Cattle Buffalo Goat Sheep Pig Poultry Camel Equine TotalNorthHaryana 9.66 81.59 1.13 0.48 0.12 3.84 0.08 3.09 100.00Himachal Pradesh 44.49 42.97 5.52 2.64 0.11 2.93 0.00 1.33 100.00Jammu & Kashmir 52.79 17.42 3.41 12.07 0.00 10.78 0.00 3.53 100.00Punjab 17.13 66.24 0.73 0.22 0.05 14.27 neg 1.36 100.00Uttar Pradesh 22.86 61.54 8.76 0.51 1.57 0.76 neg 4.00 100.00SouthAndhra Pradesh 19.09 44.60 1.86 3.06 0.10 31.17 0.00 0.12 100.00Karnataka 42.28 40.96 3.56 4.70 0.26 7.71 0.00 0.53 100.00Kerala 71.46 7.13 5.46 0.00 0.25 15.68 0.00 0.00 100.00Tamil Nadu 54.93 28.75 2.37 2.91 0.06 10.27 0.00 0.71 100.00WestGoa 37.73 32.63 5.48 0.00 3.14 21.01 0.00 0.00 100.00Gujarat 32.15 58.09 3.19 0.50 0.01 4.70 0.03 1.33 100.00Madhya Pradesh 48.49 41.29 4.64 0.23 0.03 3.66 neg 1.64 100.00Maharashtra 38.63 37.97 6.52 1.74 0.17 14.20 0.00 0.77 100.00Rajasthan 43.19 42.33 7.90 1.45 0.17 2.33 0.22 2.42 100.00EastBihar 30.95 33.92 21.32 1.71 2.41 7.77 0.00 1.92 100.00Orissa 58.68 13.76 8.49 5.25 0.70 13.11 0.00 0.00 100.00West Bengal 54.29 5.52 22.81 3.41 1.17 12.65 0.00 0.14 100.00North eastArunachal Pradesh 74.79 0.37 1.82 2.02 5.36 13.41 0.00 2.22 100.00Assam 70.46 9.26 4.33 0.06 1.38 14.12 0.00 0.40 100.00Manipur 52.94 15.31 0.95 0.27 13.34 17.19 0.00 0.00 100.00Meghalaya 58.12 2.49 3.97 0.01 20.01 14.82 0.00 0.58 100.00Mizoram 57.98 3.08 0.98 0.00 26.24 10.12 0.00 1.60 100.00Nagaland 57.07 7.35 2.57 0.00 16.34 15.32 0.00 1.34 100.00Sikkim 76.33 7.94 4.59 0.56 3.43 4.99 0.00 2.17 100.00Tripura 64.46 1.45 7.12 0.21 8.65 18.10 0.00 0.00 100.00India 37.62 40.20 7.86 1.76 1.03 10.05 0.02 1.46 100.00
45
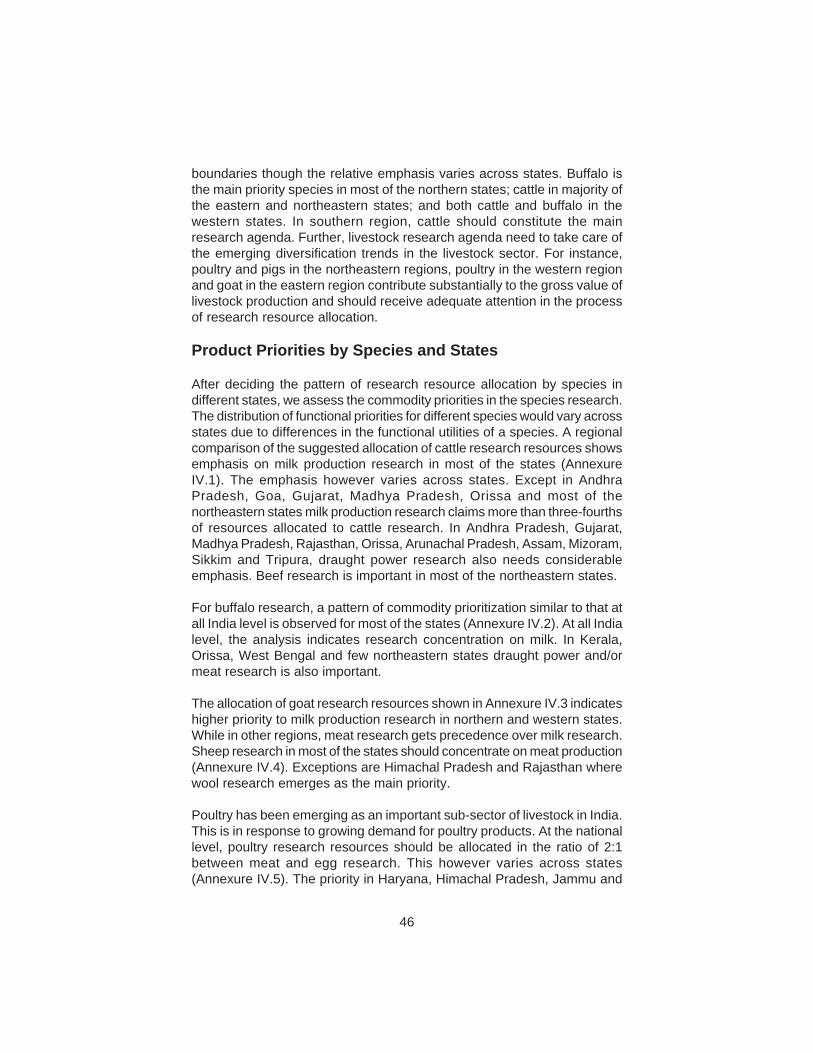
46
boundaries though the relative emphasis varies across states. Buffalo isthe main priority species in most of the northern states; cattle in majority ofthe eastern and northeastern states; and both cattle and buffalo in thewestern states. In southern region, cattle should constitute the mainresearch agenda. Further, livestock research agenda need to take care ofthe emerging diversification trends in the livestock sector. For instance,poultry and pigs in the northeastern regions, poultry in the western regionand goat in the eastern region contribute substantially to the gross value oflivestock production and should receive adequate attention in the processof research resource allocation.
Product Priorities by Species and States
After deciding the pattern of research resource allocation by species indifferent states, we assess the commodity priorities in the species research.The distribution of functional priorities for different species would vary acrossstates due to differences in the functional utilities of a species. A regionalcomparison of the suggested allocation of cattle research resources showsemphasis on milk production research in most of the states (AnnexureIV.1). The emphasis however varies across states. Except in AndhraPradesh, Goa, Gujarat, Madhya Pradesh, Orissa and most of thenortheastern states milk production research claims more than three-fourthsof resources allocated to cattle research. In Andhra Pradesh, Gujarat,Madhya Pradesh, Rajasthan, Orissa, Arunachal Pradesh, Assam, Mizoram,Sikkim and Tripura, draught power research also needs considerableemphasis. Beef research is important in most of the northeastern states.
For buffalo research, a pattern of commodity prioritization similar to that atall India level is observed for most of the states (Annexure IV.2). At all Indialevel, the analysis indicates research concentration on milk. In Kerala,Orissa, West Bengal and few northeastern states draught power and/ormeat research is also important.
The allocation of goat research resources shown in Annexure IV.3 indicateshigher priority to milk production research in northern and western states.While in other regions, meat research gets precedence over milk research.Sheep research in most of the states should concentrate on meat production(Annexure IV.4). Exceptions are Himachal Pradesh and Rajasthan wherewool research emerges as the main priority.
Poultry has been emerging as an important sub-sector of livestock in India.This is in response to growing demand for poultry products. At the nationallevel, poultry research resources should be allocated in the ratio of 2:1between meat and egg research. This however varies across states(Annexure IV.5). The priority in Haryana, Himachal Pradesh, Jammu and
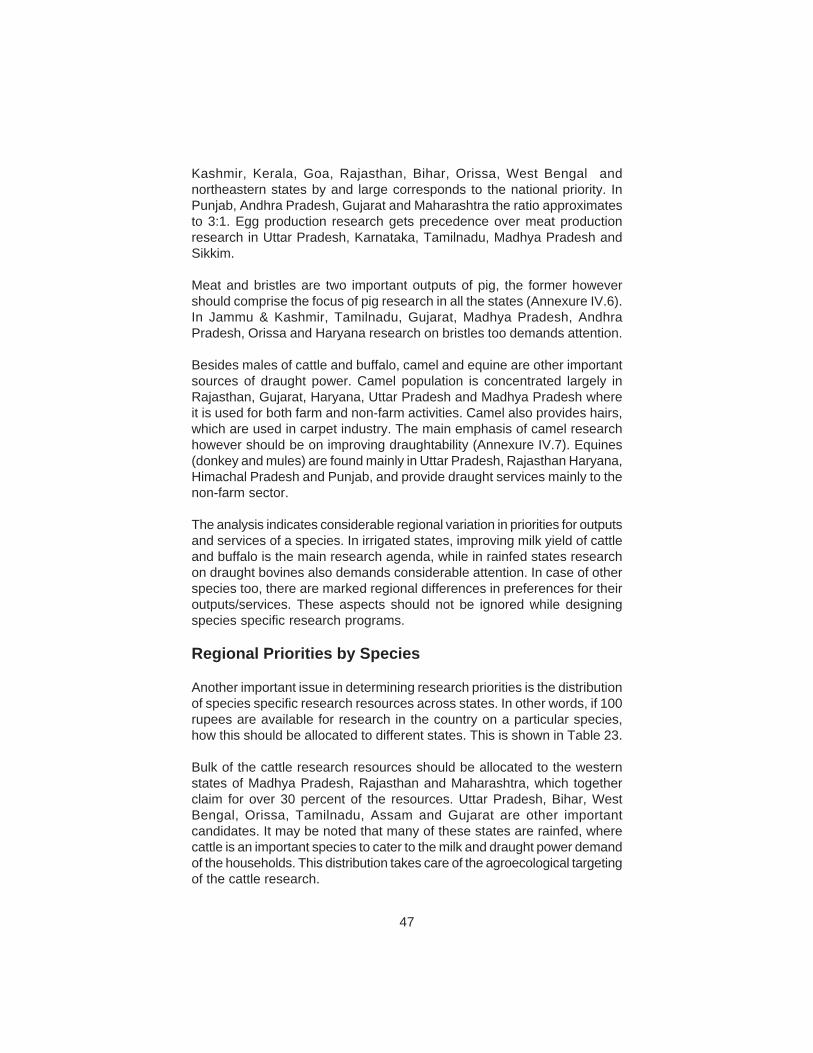
47
Kashmir, Kerala, Goa, Rajasthan, Bihar, Orissa, West Bengal andnortheastern states by and large corresponds to the national priority. InPunjab, Andhra Pradesh, Gujarat and Maharashtra the ratio approximatesto 3:1. Egg production research gets precedence over meat productionresearch in Uttar Pradesh, Karnataka, Tamilnadu, Madhya Pradesh andSikkim.
Meat and bristles are two important outputs of pig, the former howevershould comprise the focus of pig research in all the states (Annexure IV.6).In Jammu & Kashmir, Tamilnadu, Gujarat, Madhya Pradesh, AndhraPradesh, Orissa and Haryana research on bristles too demands attention.
Besides males of cattle and buffalo, camel and equine are other importantsources of draught power. Camel population is concentrated largely inRajasthan, Gujarat, Haryana, Uttar Pradesh and Madhya Pradesh whereit is used for both farm and non-farm activities. Camel also provides hairs,which are used in carpet industry. The main emphasis of camel researchhowever should be on improving draughtability (Annexure IV.7). Equines(donkey and mules) are found mainly in Uttar Pradesh, Rajasthan Haryana,Himachal Pradesh and Punjab, and provide draught services mainly to thenon-farm sector.
The analysis indicates considerable regional variation in priorities for outputsand services of a species. In irrigated states, improving milk yield of cattleand buffalo is the main research agenda, while in rainfed states researchon draught bovines also demands considerable attention. In case of otherspecies too, there are marked regional differences in preferences for theiroutputs/services. These aspects should not be ignored while designingspecies specific research programs.
Regional Priorities by Species
Another important issue in determining research priorities is the distributionof species specific research resources across states. In other words, if 100rupees are available for research in the country on a particular species,how this should be allocated to different states. This is shown in Table 23.
Bulk of the cattle research resources should be allocated to the westernstates of Madhya Pradesh, Rajasthan and Maharashtra, which togetherclaim for over 30 percent of the resources. Uttar Pradesh, Bihar, WestBengal, Orissa, Tamilnadu, Assam and Gujarat are other importantcandidates. It may be noted that many of these states are rainfed, wherecattle is an important species to cater to the milk and draught power demandof the households. This distribution takes care of the agroecological targetingof the cattle research.
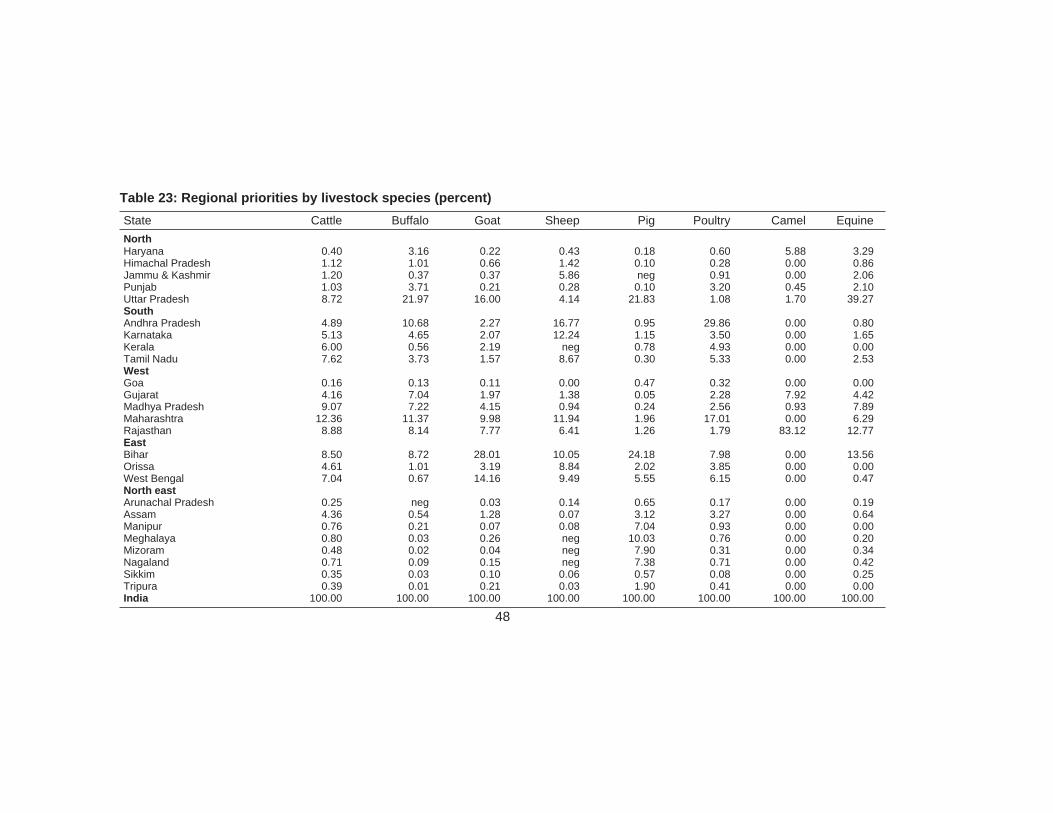
Table 23: Regional priorities by livestock species (percent)State Cattle Buffalo Goat Sheep Pig Poultry Camel EquineNorthHaryana 0.40 3.16 0.22 0.43 0.18 0.60 5.88 3.29Himachal Pradesh 1.12 1.01 0.66 1.42 0.10 0.28 0.00 0.86Jammu & Kashmir 1.20 0.37 0.37 5.86 neg 0.91 0.00 2.06Punjab 1.03 3.71 0.21 0.28 0.10 3.20 0.45 2.10Uttar Pradesh 8.72 21.97 16.00 4.14 21.83 1.08 1.70 39.27SouthAndhra Pradesh 4.89 10.68 2.27 16.77 0.95 29.86 0.00 0.80Karnataka 5.13 4.65 2.07 12.24 1.15 3.50 0.00 1.65Kerala 6.00 0.56 2.19 neg 0.78 4.93 0.00 0.00Tamil Nadu 7.62 3.73 1.57 8.67 0.30 5.33 0.00 2.53WestGoa 0.16 0.13 0.11 0.00 0.47 0.32 0.00 0.00Gujarat 4.16 7.04 1.97 1.38 0.05 2.28 7.92 4.42Madhya Pradesh 9.07 7.22 4.15 0.94 0.24 2.56 0.93 7.89Maharashtra 12.36 11.37 9.98 11.94 1.96 17.01 0.00 6.29Rajasthan 8.88 8.14 7.77 6.41 1.26 1.79 83.12 12.77EastBihar 8.50 8.72 28.01 10.05 24.18 7.98 0.00 13.56Orissa 4.61 1.01 3.19 8.84 2.02 3.85 0.00 0.00West Bengal 7.04 0.67 14.16 9.49 5.55 6.15 0.00 0.47North eastArunachal Pradesh 0.25 neg 0.03 0.14 0.65 0.17 0.00 0.19Assam 4.36 0.54 1.28 0.07 3.12 3.27 0.00 0.64Manipur 0.76 0.21 0.07 0.08 7.04 0.93 0.00 0.00Meghalaya 0.80 0.03 0.26 neg 10.03 0.76 0.00 0.20Mizoram 0.48 0.02 0.04 neg 7.90 0.31 0.00 0.34Nagaland 0.71 0.09 0.15 neg 7.38 0.71 0.00 0.42Sikkim 0.35 0.03 0.10 0.06 0.57 0.08 0.00 0.25Tripura 0.39 0.01 0.21 0.03 1.90 0.41 0.00 0.00India 100.00 100.00 100.00 100.00 100.00 100.00 100.00 100.00
48
Research on buffalo should target Uttar Pradesh (21.2%), Madhya Pradesh(10%), Rajasthan (9.4%), Andhra Pradesh (9.1%), Maharashtra (8.5%)Bihar (8.3%), Punjab (5.7%) and Karnataka (5.6%). The wide dispersionof buffalo research resources indicates adaptability of buffalo to variedclimatic conditions in the country.
Goat research should target eastern region mainly Bihar and West Bengal.These two states together demand about 43 percent of national goatresearch resources. Uttar Pradesh, Rajasthan, Maharashtra and MadhyaPradesh are other important target domains. Sheep research should havemore focus in southern region (Karnataka, Andhra Pradesh and Tamilnadu).Other target domains include Orissa, West Bengal and Bihar in the east,Maharashtra and Rajasthan in the west and Jammu & Kashmir in the north.
Andhra Pradesh and Maharashtra are the priority states for poultry researchwith a share of 26.5 percent and 13.2 percent in national research resourcesrespectively. The other important states in priority are Bihar, West Bengal,Tamilnadu, Orissa, Punjab and Assam.
Northeastern states, Bihar and Uttar Pradesh constitute the main targetdomains for pig research. Camel research should target mainly Rajasthan.For equine research Uttar Pradesh ranks first in priority, followed by Bihar,Rajasthan, Madhya Pradesh, Gujarat and Maharashtra.
This pattern of allocation of regional research resources might be incongruence with the existing pattern of allocation. It is however difficult tocomment on this due to lack of state level and species level information onresearch investment.
49
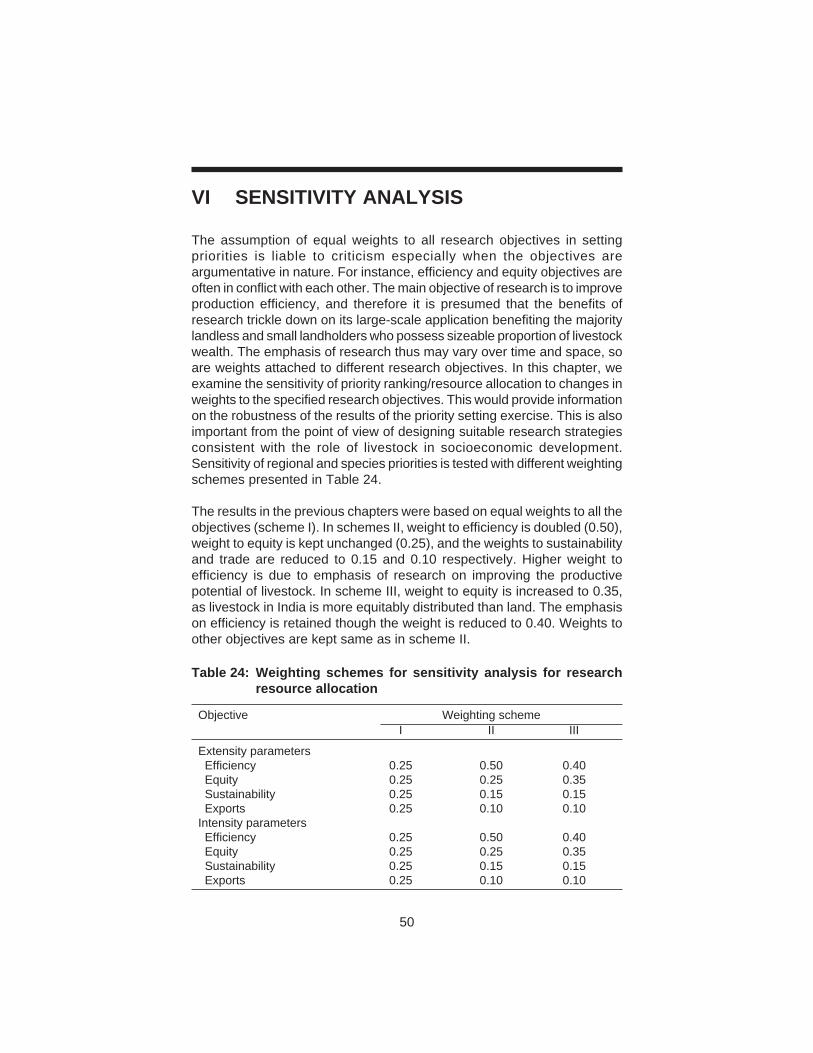
50
The assumption of equal weights to all research objectives in settingpriorities is liable to criticism especially when the objectives areargumentative in nature. For instance, efficiency and equity objectives areoften in conflict with each other. The main objective of research is to improveproduction efficiency, and therefore it is presumed that the benefits ofresearch trickle down on its large-scale application benefiting the majoritylandless and small landholders who possess sizeable proportion of livestockwealth. The emphasis of research thus may vary over time and space, soare weights attached to different research objectives. In this chapter, weexamine the sensitivity of priority ranking/resource allocation to changes inweights to the specified research objectives. This would provide informationon the robustness of the results of the priority setting exercise. This is alsoimportant from the point of view of designing suitable research strategiesconsistent with the role of livestock in socioeconomic development.Sensitivity of regional and species priorities is tested with different weightingschemes presented in Table 24.
The results in the previous chapters were based on equal weights to all theobjectives (scheme I). In schemes II, weight to efficiency is doubled (0.50),weight to equity is kept unchanged (0.25), and the weights to sustainabilityand trade are reduced to 0.15 and 0.10 respectively. Higher weight toefficiency is due to emphasis of research on improving the productivepotential of livestock. In scheme III, weight to equity is increased to 0.35,as livestock in India is more equitably distributed than land. The emphasison efficiency is retained though the weight is reduced to 0.40. Weights toother objectives are kept same as in scheme II.
VI SENSITIVITY ANALYSIS
Table 24: Weighting schemes for sensitivity analysis for researchresource allocation
Objective Weighting schemeI II III
Extensity parametersEfficiency 0.25 0.50 0.40Equity 0.25 0.25 0.35Sustainability 0.25 0.15 0.15Exports 0.25 0.10 0.10
Intensity parametersEfficiency 0.25 0.50 0.40Equity 0.25 0.25 0.35Sustainability 0.25 0.15 0.15Exports 0.25 0.10 0.10
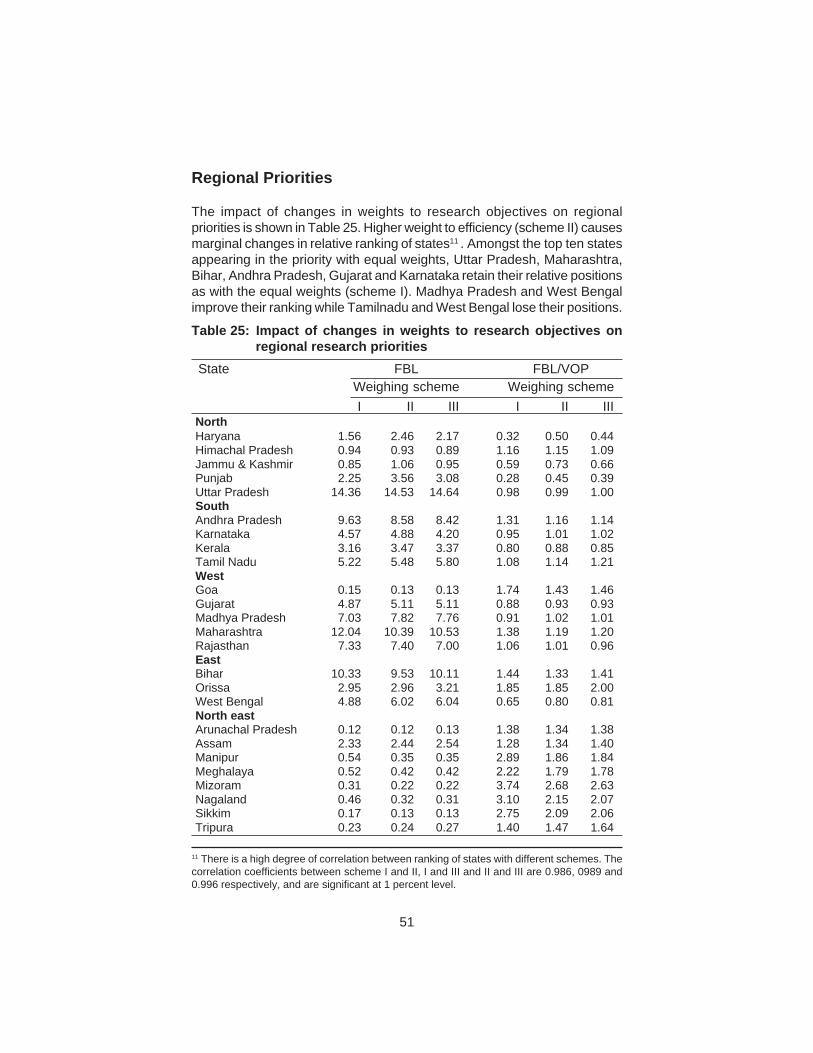
51
Regional Priorities
The impact of changes in weights to research objectives on regionalpriorities is shown in Table 25. Higher weight to efficiency (scheme II) causesmarginal changes in relative ranking of states11 . Amongst the top ten statesappearing in the priority with equal weights, Uttar Pradesh, Maharashtra,Bihar, Andhra Pradesh, Gujarat and Karnataka retain their relative positionsas with the equal weights (scheme I). Madhya Pradesh and West Bengalimprove their ranking while Tamilnadu and West Bengal lose their positions.
11 There is a high degree of correlation between ranking of states with different schemes. Thecorrelation coefficients between scheme I and II, I and III and II and III are 0.986, 0989 and0.996 respectively, and are significant at 1 percent level.
Table 25: Impact of changes in weights to research objectives onregional research priorities
State FBL FBL/VOPWeighing scheme Weighing schemeI II III I II III
NorthHaryana 1.56 2.46 2.17 0.32 0.50 0.44Himachal Pradesh 0.94 0.93 0.89 1.16 1.15 1.09Jammu & Kashmir 0.85 1.06 0.95 0.59 0.73 0.66Punjab 2.25 3.56 3.08 0.28 0.45 0.39Uttar Pradesh 14.36 14.53 14.64 0.98 0.99 1.00SouthAndhra Pradesh 9.63 8.58 8.42 1.31 1.16 1.14Karnataka 4.57 4.88 4.20 0.95 1.01 1.02Kerala 3.16 3.47 3.37 0.80 0.88 0.85Tamil Nadu 5.22 5.48 5.80 1.08 1.14 1.21WestGoa 0.15 0.13 0.13 1.74 1.43 1.46Gujarat 4.87 5.11 5.11 0.88 0.93 0.93Madhya Pradesh 7.03 7.82 7.76 0.91 1.02 1.01Maharashtra 12.04 10.39 10.53 1.38 1.19 1.20Rajasthan 7.33 7.40 7.00 1.06 1.01 0.96EastBihar 10.33 9.53 10.11 1.44 1.33 1.41Orissa 2.95 2.96 3.21 1.85 1.85 2.00West Bengal 4.88 6.02 6.04 0.65 0.80 0.81North eastArunachal Pradesh 0.12 0.12 0.13 1.38 1.34 1.38Assam 2.33 2.44 2.54 1.28 1.34 1.40Manipur 0.54 0.35 0.35 2.89 1.86 1.84Meghalaya 0.52 0.42 0.42 2.22 1.79 1.78Mizoram 0.31 0.22 0.22 3.74 2.68 2.63Nagaland 0.46 0.32 0.31 3.10 2.15 2.07Sikkim 0.17 0.13 0.13 2.75 2.09 2.06Tripura 0.23 0.24 0.27 1.40 1.47 1.64
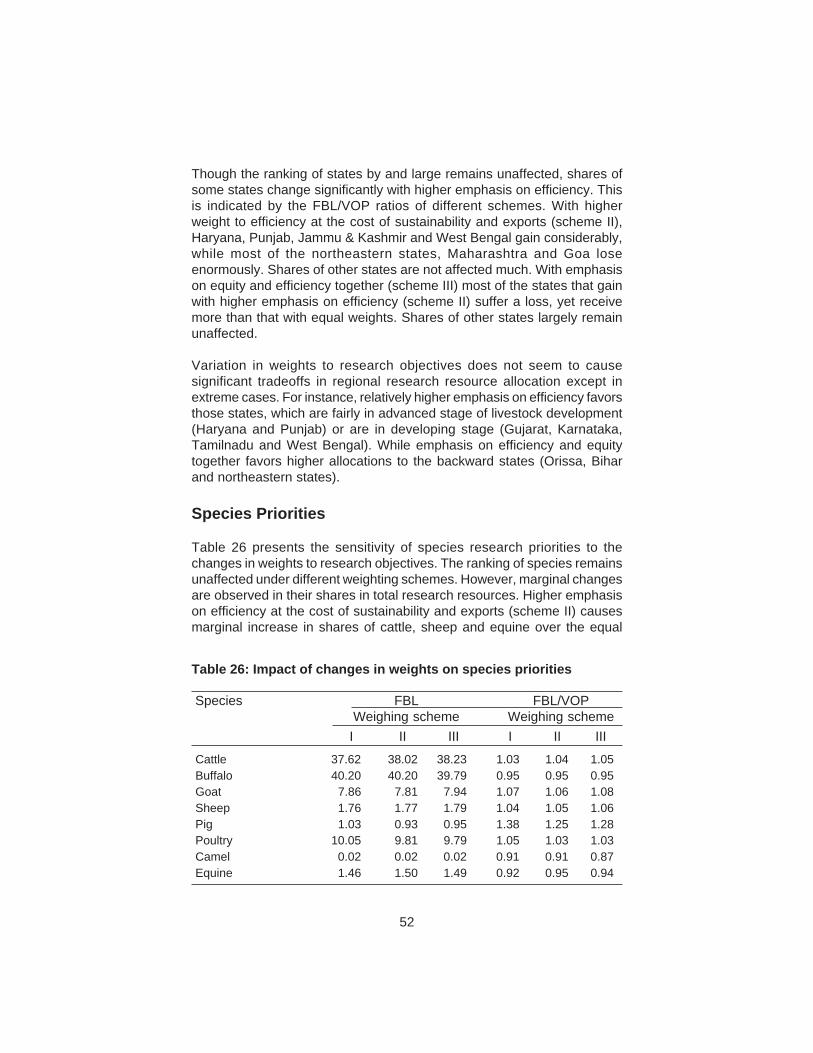
52
Though the ranking of states by and large remains unaffected, shares ofsome states change significantly with higher emphasis on efficiency. Thisis indicated by the FBL/VOP ratios of different schemes. With higherweight to efficiency at the cost of sustainability and exports (scheme II),Haryana, Punjab, Jammu & Kashmir and West Bengal gain considerably,while most of the northeastern states, Maharashtra and Goa loseenormously. Shares of other states are not affected much. With emphasison equity and efficiency together (scheme III) most of the states that gainwith higher emphasis on efficiency (scheme II) suffer a loss, yet receivemore than that with equal weights. Shares of other states largely remainunaffected.
Variation in weights to research objectives does not seem to causesignificant tradeoffs in regional research resource allocation except inextreme cases. For instance, relatively higher emphasis on efficiency favorsthose states, which are fairly in advanced stage of livestock development(Haryana and Punjab) or are in developing stage (Gujarat, Karnataka,Tamilnadu and West Bengal). While emphasis on efficiency and equitytogether favors higher allocations to the backward states (Orissa, Biharand northeastern states).
Species Priorities
Table 26 presents the sensitivity of species research priorities to thechanges in weights to research objectives. The ranking of species remainsunaffected under different weighting schemes. However, marginal changesare observed in their shares in total research resources. Higher emphasison efficiency at the cost of sustainability and exports (scheme II) causesmarginal increase in shares of cattle, sheep and equine over the equal
Table 26: Impact of changes in weights on species priorities
Species FBL FBL/VOPWeighing scheme Weighing schemeI II III I II III
Cattle 37.62 38.02 38.23 1.03 1.04 1.05Buffalo 40.20 40.20 39.79 0.95 0.95 0.95Goat 7.86 7.81 7.94 1.07 1.06 1.08Sheep 1.76 1.77 1.79 1.04 1.05 1.06Pig 1.03 0.93 0.95 1.38 1.25 1.28Poultry 10.05 9.81 9.79 1.05 1.03 1.03Camel 0.02 0.02 0.02 0.91 0.91 0.87Equine 1.46 1.50 1.49 0.92 0.95 0.94
53
12 The information on research articles was compiled from the Annual Reports of these institutes.
emphasis scheme. Allocations to buffalo and camel remain unaffected,while other species lose. Higher emphasis on efficiency and equity togetherat the cost of sustainability and exports (scheme III) favors marginal increasein resources for cattle, goat, sheep and equine research, and a marginaldecline in shares of buffalo, poultry and pig over scheme I.
The analysis suggests that regional pattern of allocation of researchresources is not much sensitive to changes in weights to researchobjectives. So is the pattern of resource allocation across species.
Existing and Suggested Allocation of Resources
Whether the proposed pattern of allocation of livestock research resourcesis in congruence with the existing pattern is difficult to comment upon in theabsence of reliable information on research investment by states andspecies. Location of a livestock research entity could however provide somesubjective judgement of regional pattern of investment in livestock research.But, this kind of subjectivity is liable to criticism because of differences inthe size and functions of different entities as well as in the quality of research.Nevertheless, an assessment of pattern of investment in species researchat the national level has been undertaken using investments made by ICARin research on different species. One needs to note the limitation imposedby absence of state level data.
The information on investment in livestock research has been compiledfrom the Budget Books of the ICAR for the period 1995-96 to 1997-98.Total investment includes expenditures in the livestock research institutes,research centres and All India Coordinated Research Projects (AICRP).Besides, expenditure on account of the adhoc research projects funded bythe Council in the area of animal science under AP Cess scheme is alsoincluded.
Most of the research centres, AICRPs and AP Cess schemes have speciesor commodity focus. Expenditures of commodity/ species specific researchentities and projects have been allocated to the species under consideration.Expenditures of multi-species research entities (National Dairy ResearchInstitute, Indian Veterinary Research Institute, National Bureau of AnimalGenetic Resources, National Institute of Animal Nutrition and Physiology)have been allocated to different species in proportion of the publishedresearch articles on different species12 . Investment on a species soestimated has been added to the sum total of the expenditure of speciesspecific research to arrive at total research investment on a species.
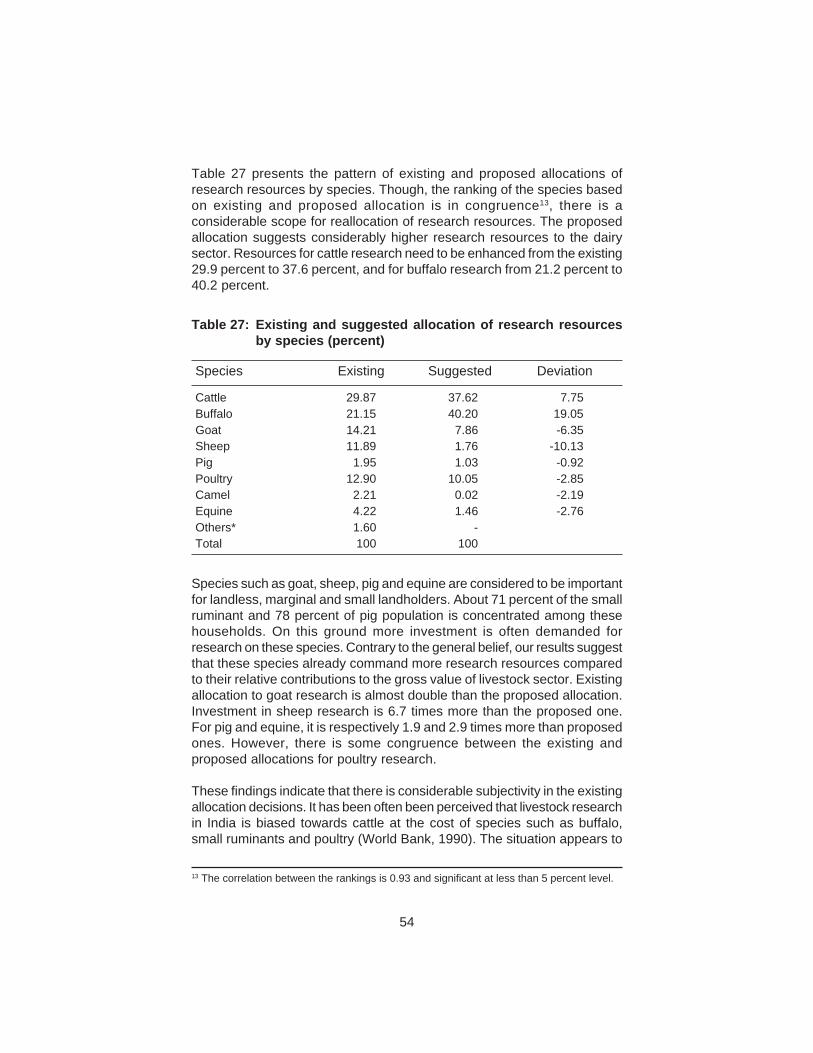
54
13 The correlation between the rankings is 0.93 and significant at less than 5 percent level.
Table 27 presents the pattern of existing and proposed allocations ofresearch resources by species. Though, the ranking of the species basedon existing and proposed allocation is in congruence13, there is aconsiderable scope for reallocation of research resources. The proposedallocation suggests considerably higher research resources to the dairysector. Resources for cattle research need to be enhanced from the existing29.9 percent to 37.6 percent, and for buffalo research from 21.2 percent to40.2 percent.
Species such as goat, sheep, pig and equine are considered to be importantfor landless, marginal and small landholders. About 71 percent of the smallruminant and 78 percent of pig population is concentrated among thesehouseholds. On this ground more investment is often demanded forresearch on these species. Contrary to the general belief, our results suggestthat these species already command more research resources comparedto their relative contributions to the gross value of livestock sector. Existingallocation to goat research is almost double than the proposed allocation.Investment in sheep research is 6.7 times more than the proposed one.For pig and equine, it is respectively 1.9 and 2.9 times more than proposedones. However, there is some congruence between the existing andproposed allocations for poultry research.
These findings indicate that there is considerable subjectivity in the existingallocation decisions. It has been often been perceived that livestock researchin India is biased towards cattle at the cost of species such as buffalo,small ruminants and poultry (World Bank, 1990). The situation appears to
Table 27: Existing and suggested allocation of research resourcesby species (percent)
Species Existing Suggested Deviation
Cattle 29.87 37.62 7.75Buffalo 21.15 40.20 19.05Goat 14.21 7.86 -6.35Sheep 11.89 1.76 -10.13Pig 1.95 1.03 -0.92Poultry 12.90 10.05 -2.85Camel 2.21 0.02 -2.19Equine 4.22 1.46 -2.76Others* 1.60 -Total 100 100
55
have changed; cattle receives less research resources than its relativecontribution. The bias against buffalo research is enormous and needs tobe corrected.
Most of the so-called neglected and pro-poor species claim proportionatelyhigher shares in research resources than their relative economiccontributions. The evolution pattern of livestock research as discussed inChapter II suggests that in the past many of these species such as goat,equines, camel and pig did not receive adequate attention in the animalscience research. It is only recently that ICAR has established researchinstitutes for most of these species to strengthen research and developmentefforts. That means higher initial capital investment in the fixed assets suchas buildings, laboratories and equipment. Research on sheep iscomparatively old, and a breakthrough in research is yet to take place, asthe productivity of sheep in terms of meat as well as wool has beenstagnating for quite some time.
Whatever might be the reasons for imbalances in allocation of researchresources across regions and species there is a need to have a fresh lookat the livestock research resource allocation process keeping in view therelative importance of different species, their past performance and thepotential in meeting the socioeconomic, ecological and policy goals.However, it should be kept in mind that livestock research is complex,capital-intensive, long-term and slow in producing benefits. The nature andcost of research vary from species to species, so would be the rates ofreturn on investment in research. For instance, compared to small ruminantsand monogastrics, large ruminant research is complex, time taking andcapital-intensive, and thus might yield low rates of returns.
56
The robust growth in the livestock sector in recent years indicates that ifmanaged properly, livestock could be a driving force in the growth ofagricultural sector in the coming decades. Apart from its immense andrising contributions to agricultural gross domestic product and food andnutritional security, livestock has the capacity to reduce interpersonal andinterregional economic disparities, as there exists considerable scope toenhance its income and employment contributions. But, there areapprehensions. The current trends in livestock production may not sustainfor long due to various operating constraints. Increasing livestock population,chronic feed and fodder scarcity, deterioration of common grazing lands,frequent occurrence of diseases and rising competition for land betweenman and animal would strain the livestock production. Productivity oflivestock is low, and is not showing any sign of growth particularly of sheep,goat and pig. Growth in productivity of indigenous cattle is also notencouraging. Adoption of improved technologies is low. Further, there isconsiderable interregional variation in productivity and technology adoption.These call for revisiting livestock research priorities across regions, speciesand commodities.
In a seminal attempt to prioritize research for Indian agriculture, Jha et al.(1995) indicated that expenditure on livestock research is more or less inline with livestock sector’s relative contribution to gross output of agriculturalsector. This however varied over time. In 1970s, livestock researchaccounted for more resources than the relative contribution of livestocksector to AgGDP. It fell down drastically in the eighties. In recent years,realizing the growth potential of livestock sector and its impact on equityand nutritional security efforts have been made to restore livestockresearch’s share commensurate with the relative contribution of the livestocksector to AgGDP. During ninth five year plan, animal science researchreceived 19 percent of ICAR’s research resources, which by and large is incongruence with livestock sector’s share in AgGDP.
Thus, considering the growing realization of the importance of livestocksector in socioeconomic development this study has identified regionaland species priorities for allocation of limited research resources in a multi-criteria framework with efficiency, equity, sustainability and tradeparticipation as research objectives. The study began with assessingregional priorities with the sole criterion of efficiency and subsequentlyexamined the effects of other criteria on the pattern of research resource
VII CONCLUSIONS AND POLICYIMPLICATIONS
57
allocation. It came out that ignoring social and sustainability dimensions indeciding priorities leads to sub-optimality in regional allocation of researchresources.
In a pure economic efficiency framework, northeastern states togetherreceive about 3 percent of the national livestock research resources. Theirshare almost doubles when the equity, nutritional security, sustainabilityand trade issues are superimposed on economic efficiency criterion. Theother states that stand to gain significantly with inclusion of equity andsustainability dimensions are Himachal Pradesh, Andhra Pradesh, Goa,Maharashtra, Bihar and Orissa. Most of these states are agriculturallybackward or are developing slowly. A larger proportion of incrementalresearch resources should therefore flow into these states to acceleratethe growth of livestock sector and to improve upon interregional andinterpersonal disparities.
Regional pattern of allocation of livestock research resources varies fromspecies to species. Cattle research should target western states of MadhyaPradesh, Rajasthan and Maharashtra. Uttar Pradesh, Bihar, West Bengal,Orissa, Tamilnadu, Assam and Gujarat are other important target domainsfor cattle research. Buffalo research activities should be concentrated mainlyin Uttar Pradesh, Madhya Pradesh, Rajasthan, Andhra Pradesh,Maharashtra and Bihar. Target domain for goat research includes mainlyeastern states of Bihar and West Bengal. Focus on sheep research shouldbe in southern states viz. Karnataka, Andhra Pradesh and Tamilnadu.Andhra Pradesh and Maharashtra are the main claimants for poultryresearch resources. Northeastern region, Bihar and Uttar Pradesh appearas the priority states for pig research. Camel research should by and largebe confined to Rajasthan. For equine research, Uttar Pradesh shouldreceive the highest priority.
Concerns for equity, sustainability and trade shift emphasis towards animalsthat have short life span, generate quick returns, improve equity and requireless initial investment and recurring costs. These include goat, sheep andpig. Cattle also fall in this group. Priority towards buffalo, equine and camelpromotes efficiency. With all objectives in consideration, buffalo demandshighest attention in livestock research (40.2 %) and followed by cattle(37.6%), poultry (10%) and goat (7.9%). Sheep, equine, pig and camelfollow in the priority order.
In mixed crop livestock systems, an animal is maintained to provide anumber of products and services. Thus, multi-functionality of a speciesdemands a balanced allocation of research resources among its differentfunctions/commodities. Bulk of the bovine (cattle and buffalo) research atthe national level should target milk production, followed by draught power
58
and meat. Research on goats should focus on meat, followed by milk andskins. Sheep research should target mainly meat production. Woolproduction and skins rank next in the order. In case of poultry, meat researchdemands two-third of the resources and the rest should be earmarked foregg production research. Improving efficiency of meat production shouldbe the main concern of pig research. For camel and equine, the researchshould exclusively address the draughtability concerns.
The functional distribution of research resources however varies acrossregions depending on the utility of products and services derived from aspecies. Bovine research in most of the states should concentrate on milkand followed by draught power. However, in northeastern states beefresearch is also important. Focus of goat research in western and northernstates should be on milk, while in most of the southern, eastern andnortheastern states meat research gets precedence over milk research.Functional distribution of sheep research resources exhibits a varied patternacross states; both meat and wool research demand considerable attentionin northern and western states. In southern, eastern and northeastern statesmeat appears as the agenda for sheep research. Poultry research shouldgive high priority to meat production in most of the states, except UttarPradesh, Karnataka and Madhya Pradesh where egg research demandscomparatively more resources.
Whether the proposed allocation is in congruence with the existing patternof allocation is rather difficult to comment upon in absence of researchinvestment data at regional level. However, an examination of existingallocation by species at the national level indicates considerable deviationsfrom the proposed allocation. Our results call for greater emphasis on buffaloand cattle research. This needs to be viewed in terms of their long generationinterval compared to small ruminants and monogastrics. Ceteris paribus,this means that the rates of return to successful productivity enhancingresearch on the former will be lower than the latter, especially for breeding.
The study has generated indices for allocation of livestock researchresources across regions, species and commodities. It suggests targetdomains, species and commodities for livestock research. The study doesnot propose the research agenda in terms of breeding, nutrition, healthand management. This also does not provide the alternative researchstrategies to address these issues in a cost-effective manner. These issuesconcern the demand-side aspects of animal science research and requireconsiderable amount of information from the livestock owners and scientificcommunity. The next phase of this study targets development of thedemand-driven agenda for animal science research.
59
Adams, Jr. R.H. and Jane, J. He.1995. Sources of income inequality andpoverty in rural Pakistan. International Food Policy Research Institute,Washington, D.C.
Alston, J.M., G.W. Norton and P.G. Pardey. 1995. Science under scarcity:Principles and practices for agricultural research evaluation and prioritysetting. Cornell University Press, Ithaca and London.
Anderson, J.R. and K.A. Parton.1983. Techniques for guiding the allocationof resources among rural research projects. Prometheus 1(1): 180-201.
Birthal, P.S. 2000. Technological change in India’s livestock sector and itsimpact. Presented at the VIII annual conference on Livestock in differentfarming systems in India. Agricultural Economics Research Association(India), Indian Agricultural Research Institute, New Delhi.
Birthal, P.S. and M.K. Singh.1995. Structure of rural income inequality: Astudy in western Uttar Pradesh. Indian Journal of Agricultural Economics50(2):168-175.
Birthal, P.S., Anjani Kumar, A. Ravishankar and U.K. Pandey.1999. Sourcesof growth in the livestock sector. Policy Paper 9. National Centre forAgricultural Economics and Policy Research, New Delhi.
CGIAR. 1992. Review of CGIAR priorities and strategies (part I). TACSecretariat, FAO, Rome, Italy.
Contant, R.B. 2001. Priority setting. In Planning agricultural research (G.Gijsbers, W. Janssen, H.H. Odame and G. Meijerink, eds.). CABInternational, Wallingford, U.K. and ISNAR, The Hague, Netherlands.
Davis, J.S., P. Oram and J.G. Ryan. 1987. Assessment of agriculturalresearch priorities: an international perspective. Australian Centre forInternational Agricultural Research, Canberra and International Food PolicyResearch Institute, Washington, D.C.
Delgado, C., M. Rosegrant, H. Steinfeld, S. Ehui, and C. Courbois. 1999.Livestock to 2020: The next food revolution. Food, Agriculture, and theEnvironment Discussion Paper 28. International Food Policy ResearchInstitute, Washington, D.C.
REFERENCES
60
De Wit, C.T. 1988. The use of interactive multiple goal programming in theresource allocation process of the CGIAR system. TAC/CGIAR, Rome,Italy.
Echeverria, R.G. 1990. Assessing the impact of agricultural research. InMethods for diagnosing research system constraints and assessing theimpact of agricultural research (R.G. Echeverria, ed.).
Evension, R.E., P.E. Waggoner and V.W. Ruttan. 1979. Economic benefitsfrom research: an example from agriculture. Science 205: 1101-1107.
Fox, G. 1987. Models of resource allocation in public agricultural research:A survey. Journal of Agricultural Economics 37: 449-462.
Falconi, C.A. 1999. Methods of priority setting in agricultural biotechnologyresearch. In Managing agricultural biotechnology: Addressingresearch program needs and policy implications (J.I. Cohen, ed.). CABInternational.
Franzel, S., H. Jaenicke and W. Janssen. 1995. Priority setting for MPTimprovement research. The Hague, The Netherlands.
Gaddi, G.M. and L.B. Kunal.1996. Sources of output growth in new milkproduction technology and some implications to research investment. IndianJournal of Agricultural Economics 51(3): 389-395.
Hann, C. de, H.Steinfeld and H. Blackburn. 1997. Livestock and theenvironment: Finding a balance. FAO/USAID/World Bank. WRENmedia,Eye, U.K.
ICAR. 1989. 40 years of agricultural research and education in India. IndianCouncil of Agricultural Research, New Delhi.
ICAR. 2000. Handbook of ICAR research institutes. Indian Council ofAgricultural Research, New Delhi.
GOI. 1976. Report of the National Commission on Agriculture, Part VII,Animal husbandry. Ministry of Agriculture and Irrigation, Government ofIndia, New Delhi.
GOI. 1976. Report of the National Commission on Agriculture, Part XI,Research, education and extension. Ministry of Agriculture and Irrigation,Government of India, New Delhi.
61
Janssen, W. 1994. Priority setting as a practical tool for researchmanagement. ISNAR Discussion Paper. ISNAR, The Hague, Netherlands.
Janssen, W. and M. Waithaka. 1998. Priority setting for livestock research:The case of KARI’s dairy program. International Livestock ResearchInstitute, Addis Ababa, Ethiopia.
Jha, D. 2001. Agricultural research and small farms. Indian Journal ofAgricultural Economics 56 (1): 1-23.
Jha, D., P. Kumar, Mruthyunjaya, S. Pal, S. Selvarajan, and Alka Singh.1995. Research priorities in Indian agriculture. Policy Paper 3. NationalCentre for Agricultural Economics and Policy Research, New Delhi.
Kelly, T.G. and J.G. Ryan. 1995. Applied participatory priority setting ininternational agricultural research: Making trade-offs transparent andexplicit. Agricultural Systems 49: 177-216.
Kirschke, D.1993. Research priority setting for livestock developmentin developing countries. Paper presented in the Internationalconference on Livestock development in developing countries. Weilheim,Germany.
Kumar, A. 2000. Performance of livestock sector in India: Implications forfood security. Afro-Asian Journal of Rural Development 14(2): 77-90.
Kumar, A. and P.S. Birthal. 2001. Economic impact of crossbreedingresearch on cattle in India. Paper presented at the ICAR-ICRISAT workshopon Documentation, adoption and impact of livestock technologies in themixed crop livestock systems in India. ICRISAT, Patancheru, India.
Kumar, A. 2000. Trade in livestock products: Trend, performanceand competitiveness. Presented at the VIII annual conference onLivestock in different farming systems in India. Agricultural EconomicsResearch Association (India), Indian Agricultural Research Institute,New Delhi.
Kumar. P. 1998. Food demand-supply projections. Indian AgriculturalResearch Institute, New Delhi.
Kumar, P., C.C. Maji and R.K. Patel. 1977. Returns on investment inresearch and extension: A study on Indo-Swiss cattle improvement project,Kerala. Indian Journal of Agricultural Economics 32(3).
62
Kumar P. and P.K. Joshi.1999. Socioeconomic factors contributing tonutritional security of rural households. Paper presented at the workshopon Diversification of agriculture for human nutrition. National Academy ofAgricultural Sciences, New Delhi and National Institute of Nutrition,Hyderabad.
Lu, Y., L. Quance and C.L. Liu. 1978. Projecting agricultural productivityand its economic impact. American Journal of Agricultural Economics 60:976-980.
Mahlstede, J.P. 1971. Long range planning at the Iowa agricultural andhome economics experiment stations. In Resource allocation in agriculturalresearch (W.L. Fishel, ed.). University of Minnesota Press, Minneapolis,Minnesota.
McCalla, A.F. and J.G. Ryan. 1992. Setting agricultural research priorities:Lessons from CGIAR study. American Journal of Agricultural Economics74(5): 1095-1100.
Mills, B. 1997. Ex ante research evaluation and regional trade flows: Maizein Kenya. ISNAR, The Hague, Netherlands.
Moscardi, E.R. 1987. Allocating resources for agricultural research andextension in Argentina: Experiences of INTA. Paper presented at theconference on Allocating Resources for developing country agriculturalresearch. Bellagio, Italy.
Norton, G.W. 1987. Priority setting methods for agricultural research: Recentexperiences in the Dominican Republic, Ecuador and Uruguay. ProjectPaper No. 6. ISNAR, The Hague, Netherlands.
Norton. G. W. and C. Douglas. 1989. Analysis of net economic benefits ofagricultural research and extension in eastern Caribbean. SP 89-8. VirginiaPolytechnic Institute and State University.
Norton, G.W. and J.S. Davis. 1981. Evaluating returns to agriculturalresearch: a review. American Journal of Agricultural Economics 63(4):685-99.
Norton, G.W. and P.G. Pardey.1987. Priority setting mechanismsfor national agricultural research systems: Present experienceand future needs. Working Paper No. 7. ISNAR, The Hague,Netherlands.
63
Norton, G.W., P.G. Pardey and J.M. Alston. 1992. Economic issues inagricultural research priority setting. American Journal of AgriculturalEconomics 74(5): 1089-1094.
Parton, K.A., J.R. Anderson and J.P. Makeham. 1984. Evaluation methodsfor Australian wood production research. Agricultural Economics BulletinNo. 29. University of New England, Armidale.
Pinstrup-Anderson, P. and D. Franklin .1977. A system approach toagricultural research resource allocation in developing countries. InResource allocation and productivity in national and international research(C.T.M. Arndt, D.G. Dalrymple, and V. W. Ruttan, eds.). University ofMinnesota Press, Minneapolis, Minnesota.
Pundhir, R.K. and R. Sahai.1997. Conservation of indigenous cattle breeds.Dairy India, 1997. Gupta Publishers, New Delhi.
Ramanujam, V. and T. Satty. 1981. Technological choice in the lessdeveloped countries: An analytical hierarchy approach. TechnologicalForecasting and Social Change, 19: 81-98.
Russell, D.G. 1977. Resource allocation in agricultural research using socio-economic evaluation and mathematical models. Canadian Journal ofAgricultural Economics 23 : 29-52.
Satty, T. and L. Vargas. 1994. Decision making in economic, political,social and technological environments with the AHP. University ofPittsburgh.
Scobie, G.M. and V. Jacobsen. 1992. Allocation of R&D funds in theAustralian wool industry. University of Waikato, Hamilton, New Zealand.
Sere, C. and H. Steinfeld. 1996. World livestock production systems:Current status, issues and trends. FAO Animal Production and HealthPaper 127. FAO, Rome, Italy.
Sharma, V.P. and P. Sharma. 2000. The implications of agricultural tradeliberalization for Indian dairy industry. Presented at the VIII annualconference on Livestock in different farming systems in India. AgriculturalEconomics Research Association (India), Indian Agricultural ResearchInstitute, New Delhi.
Shumway, C.R. 1973. Allocation of scarce resources to agriculturalresearch: Review of methodology. American Journal of AgriculturalEconomics 55(4):547-558.
64
Singh, P. and A. B. Majumdar.1992. Current status of feed and foddermanagement of livestock. Agricultural Situation in India, (August):375-382.
Thornton, P.K., T.F. Randolph, P.M. Kristjanson, W.S. Omamo, A.N. Oderoand J.G. Ryan. 2000. Priority assessment for the International LivestockResearch Institute, 2000-2010. ILRI Impact Assessment Series No. 6.International Livestock Research Institute, Nairobi, Kenya.
World Bank. 1990. Agricultural research in India: Prologue, performanceand prospects. The World Bank, Washington D.C.
World Bank. 1996. India livestock sector review: Enhancing growth anddevelopment. The World Bank, Washington D.C.
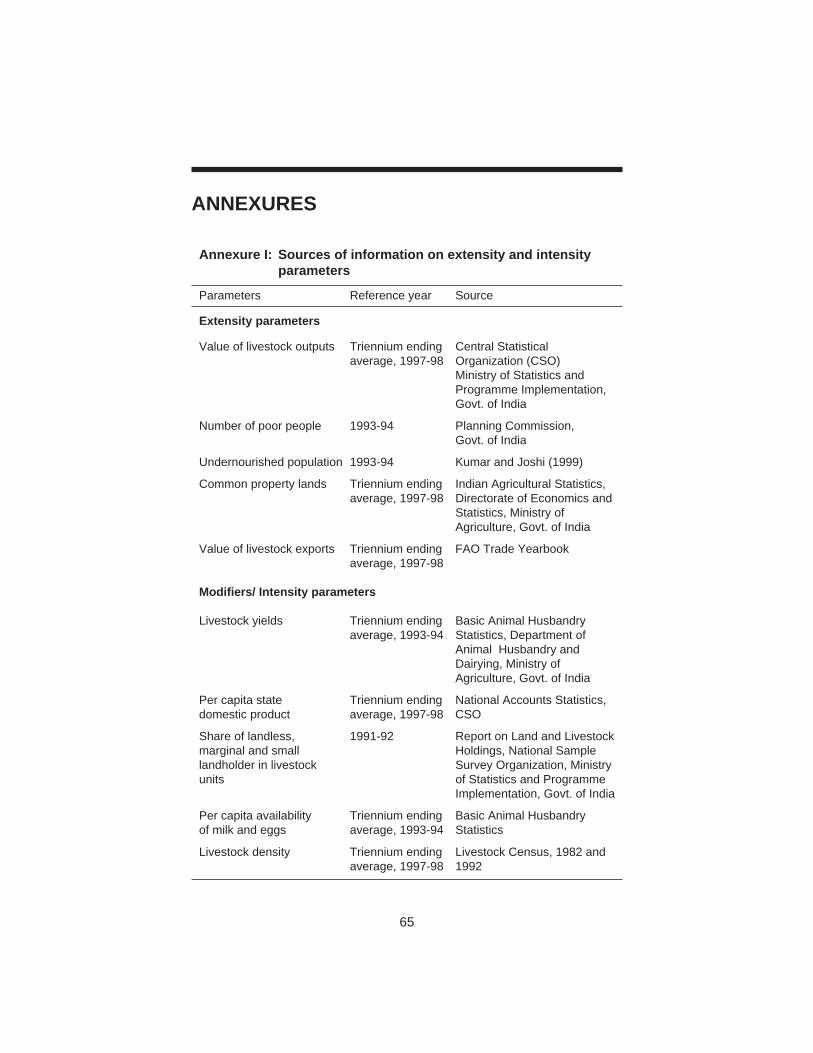
65
ANNEXURES
Annexure I: Sources of information on extensity and intensityparameters
Parameters Reference year Source
Extensity parameters
Value of livestock outputs Triennium ending Central Statisticalaverage, 1997-98 Organization (CSO)
Ministry of Statistics andProgramme Implementation,Govt. of India
Number of poor people 1993-94 Planning Commission,Govt. of India
Undernourished population 1993-94 Kumar and Joshi (1999)
Common property lands Triennium ending Indian Agricultural Statistics,average, 1997-98 Directorate of Economics and
Statistics, Ministry ofAgriculture, Govt. of India
Value of livestock exports Triennium ending FAO Trade Yearbookaverage, 1997-98
Modifiers/ Intensity parameters
Livestock yields Triennium ending Basic Animal Husbandryaverage, 1993-94 Statistics, Department of
Animal Husbandry andDairying, Ministry ofAgriculture, Govt. of India
Per capita state Triennium ending National Accounts Statistics,domestic product average, 1997-98 CSO
Share of landless, 1991-92 Report on Land and Livestockmarginal and small Holdings, National Samplelandholder in livestock Survey Organization, Ministryunits of Statistics and Programme
Implementation, Govt. of India
Per capita availability Triennium ending Basic Animal Husbandryof milk and eggs average, 1993-94 Statistics
Livestock density Triennium ending Livestock Census, 1982 andaverage, 1997-98 1992
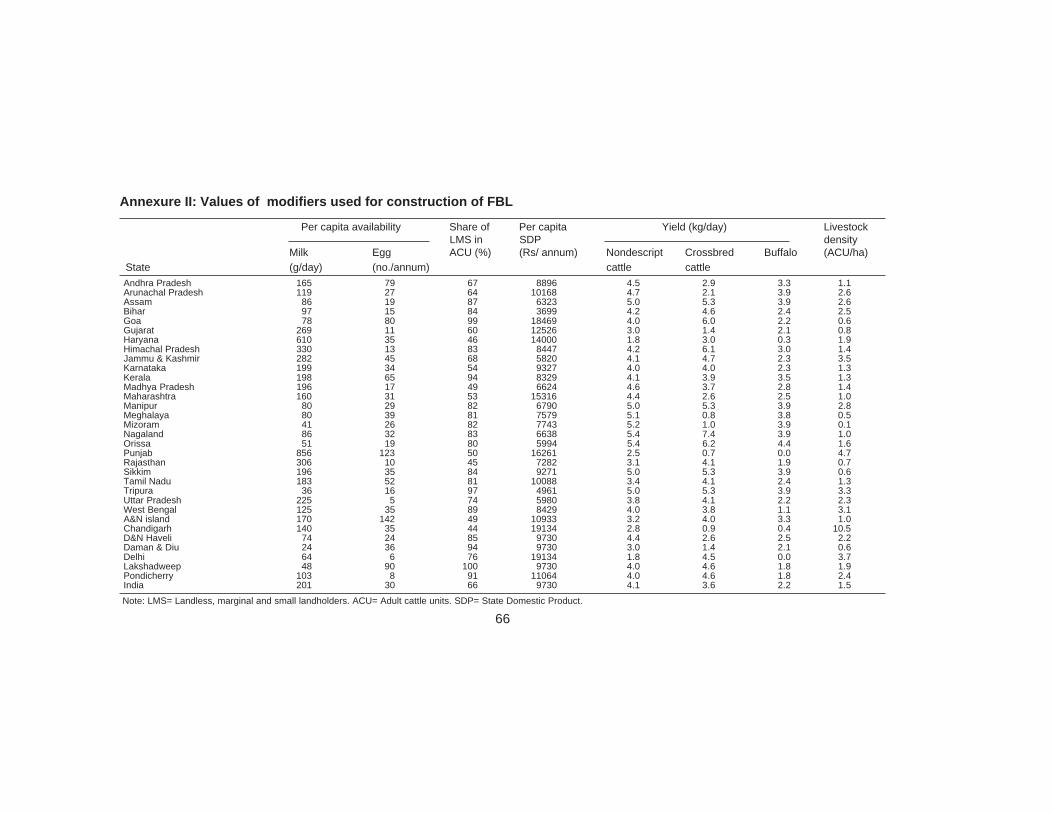
Annexure II: Values of modifiers used for construction of FBL
Per capita availability Share of Per capita Yield (kg/day) LivestockLMS in SDP density
Milk Egg ACU (%) (Rs/ annum) Nondescript Crossbred Buffalo (ACU/ha) State (g/day) (no./annum) cattle cattleAndhra Pradesh 165 79 67 8896 4.5 2.9 3.3 1.1Arunachal Pradesh 119 27 64 10168 4.7 2.1 3.9 2.6Assam 86 19 87 6323 5.0 5.3 3.9 2.6Bihar 97 15 84 3699 4.2 4.6 2.4 2.5Goa 78 80 99 18469 4.0 6.0 2.2 0.6Gujarat 269 11 60 12526 3.0 1.4 2.1 0.8Haryana 610 35 46 14000 1.8 3.0 0.3 1.9Himachal Pradesh 330 13 83 8447 4.2 6.1 3.0 1.4Jammu & Kashmir 282 45 68 5820 4.1 4.7 2.3 3.5Karnataka 199 34 54 9327 4.0 4.0 2.3 1.3Kerala 198 65 94 8329 4.1 3.9 3.5 1.3Madhya Pradesh 196 17 49 6624 4.6 3.7 2.8 1.4Maharashtra 160 31 53 15316 4.4 2.6 2.5 1.0Manipur 80 29 82 6790 5.0 5.3 3.9 2.8Meghalaya 80 39 81 7579 5.1 0.8 3.8 0.5Mizoram 41 26 82 7743 5.2 1.0 3.9 0.1Nagaland 86 32 83 6638 5.4 7.4 3.9 1.0Orissa 51 19 80 5994 5.4 6.2 4.4 1.6Punjab 856 123 50 16261 2.5 0.7 0.0 4.7Rajasthan 306 10 45 7282 3.1 4.1 1.9 0.7Sikkim 196 35 84 9271 5.0 5.3 3.9 0.6Tamil Nadu 183 52 81 10088 3.4 4.1 2.4 1.3Tripura 36 16 97 4961 5.0 5.3 3.9 3.3Uttar Pradesh 225 5 74 5980 3.8 4.1 2.2 2.3West Bengal 125 35 89 8429 4.0 3.8 1.1 3.1A&N island 170 142 49 10933 3.2 4.0 3.3 1.0Chandigarh 140 35 44 19134 2.8 0.9 0.4 10.5D&N Haveli 74 24 85 9730 4.4 2.6 2.5 2.2Daman & Diu 24 36 94 9730 3.0 1.4 2.1 0.6Delhi 64 6 76 19134 1.8 4.5 0.0 3.7Lakshadweep 48 90 100 9730 4.0 4.6 1.8 1.9Pondicherry 103 8 91 11064 4.0 4.6 1.8 2.4India 201 30 66 9730 4.1 3.6 2.2 1.5
Note: LMS= Landless, marginal and small landholders. ACU= Adult cattle units. SDP= State Domestic Product.
66
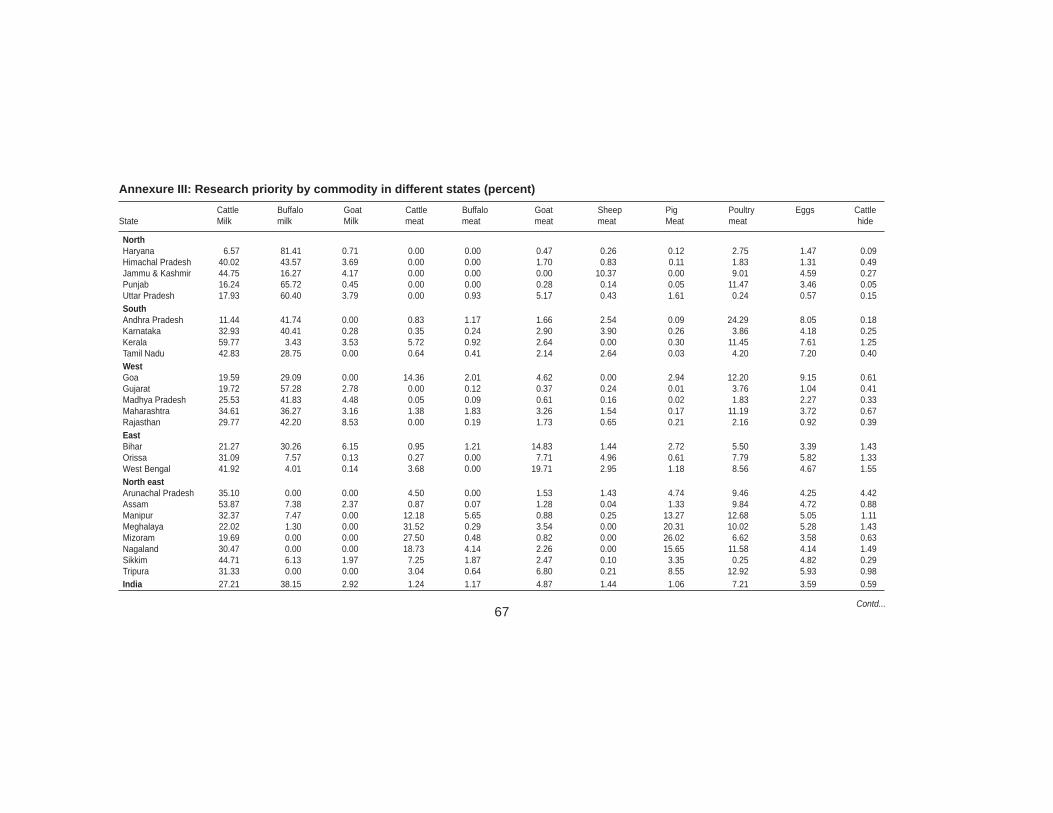
Annexure III: Research priority by commodity in different states (percent)Cattle Buffalo Goat Cattle Buffalo Goat Sheep Pig Poultry Eggs Cattle
State Milk milk Milk meat meat meat meat Meat meat hide
NorthHaryana 6.57 81.41 0.71 0.00 0.00 0.47 0.26 0.12 2.75 1.47 0.09Himachal Pradesh 40.02 43.57 3.69 0.00 0.00 1.70 0.83 0.11 1.83 1.31 0.49Jammu & Kashmir 44.75 16.27 4.17 0.00 0.00 0.00 10.37 0.00 9.01 4.59 0.27Punjab 16.24 65.72 0.45 0.00 0.00 0.28 0.14 0.05 11.47 3.46 0.05Uttar Pradesh 17.93 60.40 3.79 0.00 0.93 5.17 0.43 1.61 0.24 0.57 0.15SouthAndhra Pradesh 11.44 41.74 0.00 0.83 1.17 1.66 2.54 0.09 24.29 8.05 0.18Karnataka 32.93 40.41 0.28 0.35 0.24 2.90 3.90 0.26 3.86 4.18 0.25Kerala 59.77 3.43 3.53 5.72 0.92 2.64 0.00 0.30 11.45 7.61 1.25Tamil Nadu 42.83 28.75 0.00 0.64 0.41 2.14 2.64 0.03 4.20 7.20 0.40WestGoa 19.59 29.09 0.00 14.36 2.01 4.62 0.00 2.94 12.20 9.15 0.61Gujarat 19.72 57.28 2.78 0.00 0.12 0.37 0.24 0.01 3.76 1.04 0.41Madhya Pradesh 25.53 41.83 4.48 0.05 0.09 0.61 0.16 0.02 1.83 2.27 0.33Maharashtra 34.61 36.27 3.16 1.38 1.83 3.26 1.54 0.17 11.19 3.72 0.67Rajasthan 29.77 42.20 8.53 0.00 0.19 1.73 0.65 0.21 2.16 0.92 0.39EastBihar 21.27 30.26 6.15 0.95 1.21 14.83 1.44 2.72 5.50 3.39 1.43Orissa 31.09 7.57 0.13 0.27 0.00 7.71 4.96 0.61 7.79 5.82 1.33West Bengal 41.92 4.01 0.14 3.68 0.00 19.71 2.95 1.18 8.56 4.67 1.55North eastArunachal Pradesh 35.10 0.00 0.00 4.50 0.00 1.53 1.43 4.74 9.46 4.25 4.42Assam 53.87 7.38 2.37 0.87 0.07 1.28 0.04 1.33 9.84 4.72 0.88Manipur 32.37 7.47 0.00 12.18 5.65 0.88 0.25 13.27 12.68 5.05 1.11Meghalaya 22.02 1.30 0.00 31.52 0.29 3.54 0.00 20.31 10.02 5.28 1.43Mizoram 19.69 0.00 0.00 27.50 0.48 0.82 0.00 26.02 6.62 3.58 0.63Nagaland 30.47 0.00 0.00 18.73 4.14 2.26 0.00 15.65 11.58 4.14 1.49Sikkim 44.71 6.13 1.97 7.25 1.87 2.47 0.10 3.35 0.25 4.82 0.29Tripura 31.33 0.00 0.00 3.04 0.64 6.80 0.21 8.55 12.92 5.93 0.98India 27.21 38.15 2.92 1.24 1.17 4.87 1.44 1.06 7.21 3.59 0.59
67Contd...
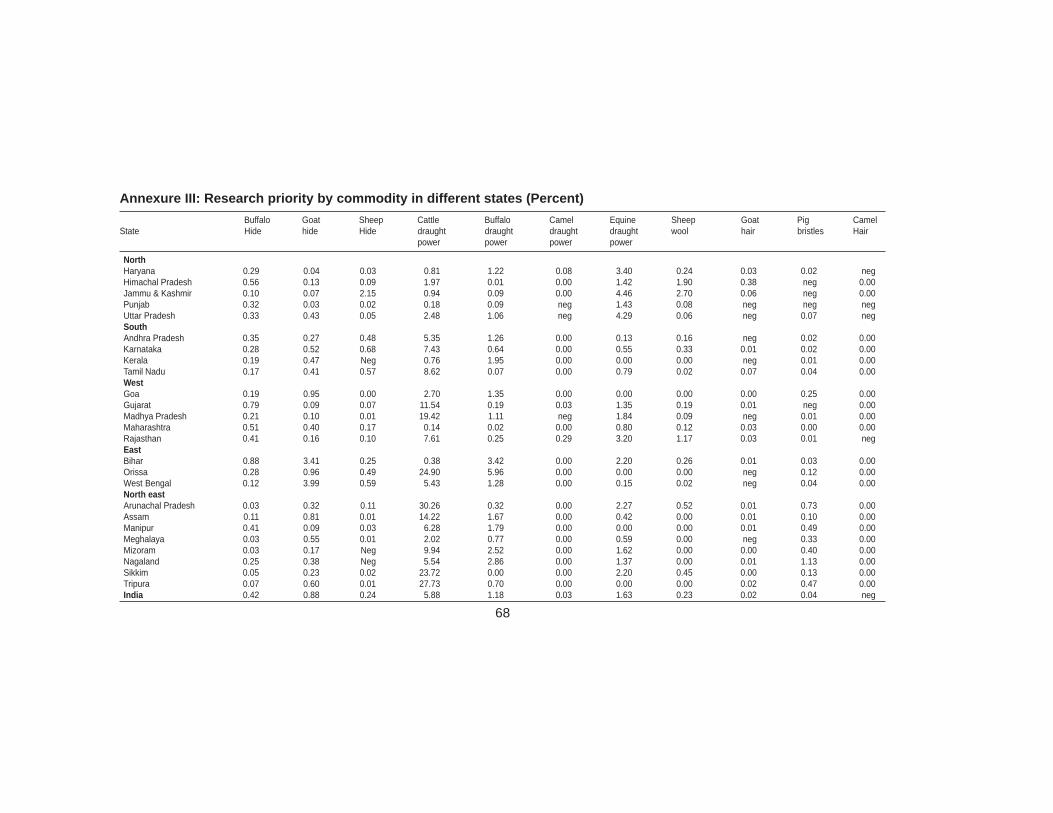
Annexure III: Research priority by commodity in different states (Percent)Buffalo Goat Sheep Cattle Buffalo Camel Equine Sheep Goat Pig Camel
State Hide hide Hide draught draught draught draught wool hair bristles Hairpower power power power
NorthHaryana 0.29 0.04 0.03 0.81 1.22 0.08 3.40 0.24 0.03 0.02 negHimachal Pradesh 0.56 0.13 0.09 1.97 0.01 0.00 1.42 1.90 0.38 neg 0.00Jammu & Kashmir 0.10 0.07 2.15 0.94 0.09 0.00 4.46 2.70 0.06 neg 0.00Punjab 0.32 0.03 0.02 0.18 0.09 neg 1.43 0.08 neg neg negUttar Pradesh 0.33 0.43 0.05 2.48 1.06 neg 4.29 0.06 neg 0.07 negSouthAndhra Pradesh 0.35 0.27 0.48 5.35 1.26 0.00 0.13 0.16 neg 0.02 0.00Karnataka 0.28 0.52 0.68 7.43 0.64 0.00 0.55 0.33 0.01 0.02 0.00Kerala 0.19 0.47 Neg 0.76 1.95 0.00 0.00 0.00 neg 0.01 0.00Tamil Nadu 0.17 0.41 0.57 8.62 0.07 0.00 0.79 0.02 0.07 0.04 0.00WestGoa 0.19 0.95 0.00 2.70 1.35 0.00 0.00 0.00 0.00 0.25 0.00Gujarat 0.79 0.09 0.07 11.54 0.19 0.03 1.35 0.19 0.01 neg 0.00Madhya Pradesh 0.21 0.10 0.01 19.42 1.11 neg 1.84 0.09 neg 0.01 0.00Maharashtra 0.51 0.40 0.17 0.14 0.02 0.00 0.80 0.12 0.03 0.00 0.00Rajasthan 0.41 0.16 0.10 7.61 0.25 0.29 3.20 1.17 0.03 0.01 negEastBihar 0.88 3.41 0.25 0.38 3.42 0.00 2.20 0.26 0.01 0.03 0.00Orissa 0.28 0.96 0.49 24.90 5.96 0.00 0.00 0.00 neg 0.12 0.00West Bengal 0.12 3.99 0.59 5.43 1.28 0.00 0.15 0.02 neg 0.04 0.00North eastArunachal Pradesh 0.03 0.32 0.11 30.26 0.32 0.00 2.27 0.52 0.01 0.73 0.00Assam 0.11 0.81 0.01 14.22 1.67 0.00 0.42 0.00 0.01 0.10 0.00Manipur 0.41 0.09 0.03 6.28 1.79 0.00 0.00 0.00 0.01 0.49 0.00Meghalaya 0.03 0.55 0.01 2.02 0.77 0.00 0.59 0.00 neg 0.33 0.00Mizoram 0.03 0.17 Neg 9.94 2.52 0.00 1.62 0.00 0.00 0.40 0.00Nagaland 0.25 0.38 Neg 5.54 2.86 0.00 1.37 0.00 0.01 1.13 0.00Sikkim 0.05 0.23 0.02 23.72 0.00 0.00 2.20 0.45 0.00 0.13 0.00Tripura 0.07 0.60 0.01 27.73 0.70 0.00 0.00 0.00 0.02 0.47 0.00India 0.42 0.88 0.24 5.88 1.18 0.03 1.63 0.23 0.02 0.04 neg
68
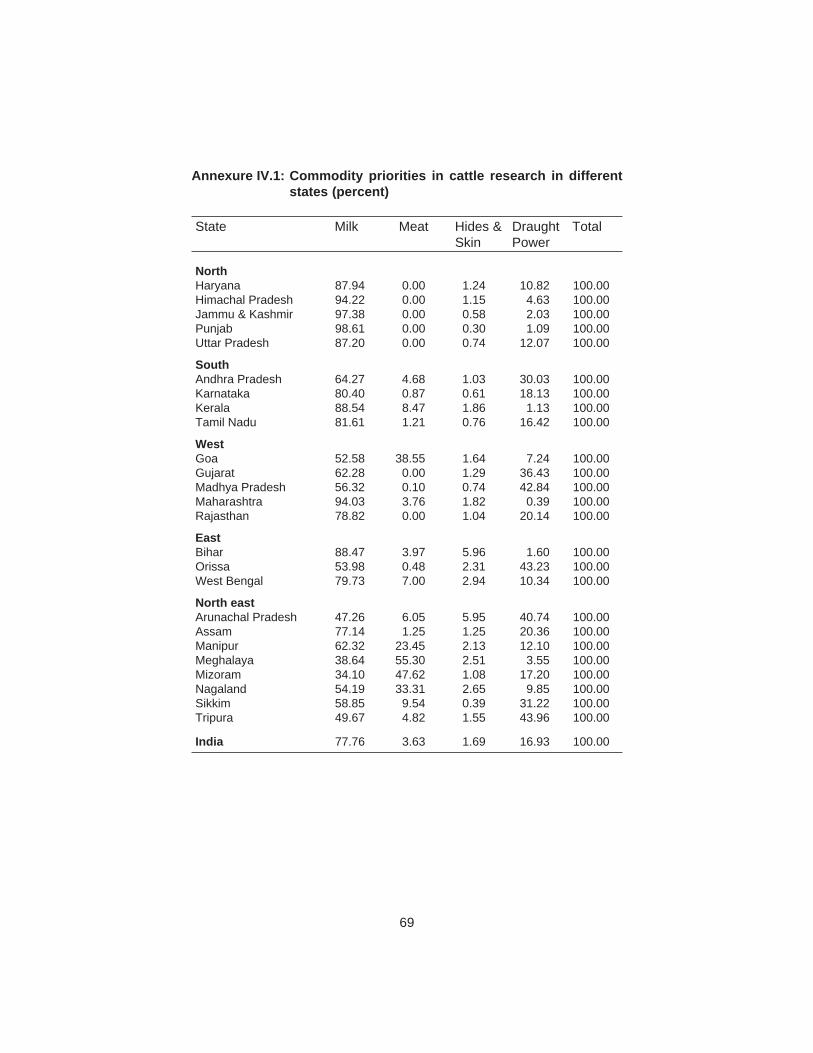
Annexure IV.1: Commodity priorities in cattle research in differentstates (percent)
State Milk Meat Hides & Draught TotalSkin Power
NorthHaryana 87.94 0.00 1.24 10.82 100.00Himachal Pradesh 94.22 0.00 1.15 4.63 100.00Jammu & Kashmir 97.38 0.00 0.58 2.03 100.00Punjab 98.61 0.00 0.30 1.09 100.00Uttar Pradesh 87.20 0.00 0.74 12.07 100.00
SouthAndhra Pradesh 64.27 4.68 1.03 30.03 100.00Karnataka 80.40 0.87 0.61 18.13 100.00Kerala 88.54 8.47 1.86 1.13 100.00Tamil Nadu 81.61 1.21 0.76 16.42 100.00
WestGoa 52.58 38.55 1.64 7.24 100.00Gujarat 62.28 0.00 1.29 36.43 100.00Madhya Pradesh 56.32 0.10 0.74 42.84 100.00Maharashtra 94.03 3.76 1.82 0.39 100.00Rajasthan 78.82 0.00 1.04 20.14 100.00
EastBihar 88.47 3.97 5.96 1.60 100.00Orissa 53.98 0.48 2.31 43.23 100.00West Bengal 79.73 7.00 2.94 10.34 100.00
North eastArunachal Pradesh 47.26 6.05 5.95 40.74 100.00Assam 77.14 1.25 1.25 20.36 100.00Manipur 62.32 23.45 2.13 12.10 100.00Meghalaya 38.64 55.30 2.51 3.55 100.00Mizoram 34.10 47.62 1.08 17.20 100.00Nagaland 54.19 33.31 2.65 9.85 100.00Sikkim 58.85 9.54 0.39 31.22 100.00Tripura 49.67 4.82 1.55 43.96 100.00
India 77.76 3.63 1.69 16.93 100.00
69
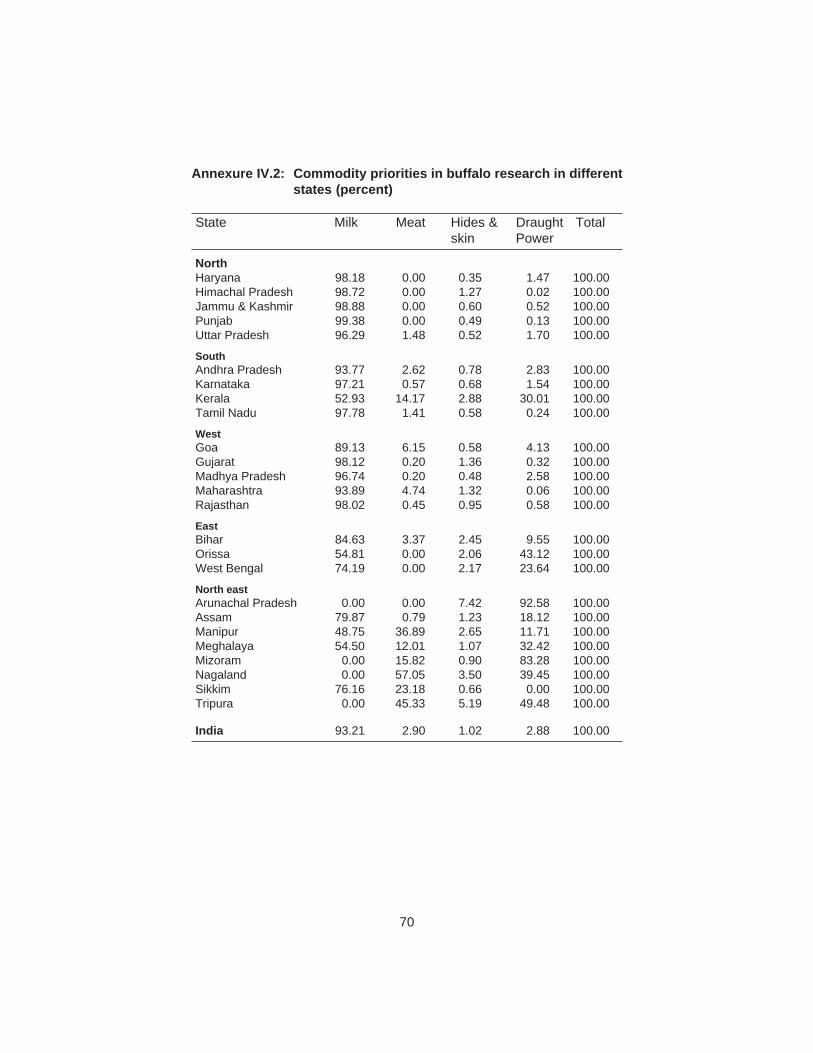
70
Annexure IV.2: Commodity priorities in buffalo research in differentstates (percent)
State Milk Meat Hides & Draught Totalskin Power
NorthHaryana 98.18 0.00 0.35 1.47 100.00Himachal Pradesh 98.72 0.00 1.27 0.02 100.00Jammu & Kashmir 98.88 0.00 0.60 0.52 100.00Punjab 99.38 0.00 0.49 0.13 100.00Uttar Pradesh 96.29 1.48 0.52 1.70 100.00
SouthAndhra Pradesh 93.77 2.62 0.78 2.83 100.00Karnataka 97.21 0.57 0.68 1.54 100.00Kerala 52.93 14.17 2.88 30.01 100.00Tamil Nadu 97.78 1.41 0.58 0.24 100.00
WestGoa 89.13 6.15 0.58 4.13 100.00Gujarat 98.12 0.20 1.36 0.32 100.00Madhya Pradesh 96.74 0.20 0.48 2.58 100.00Maharashtra 93.89 4.74 1.32 0.06 100.00Rajasthan 98.02 0.45 0.95 0.58 100.00
EastBihar 84.63 3.37 2.45 9.55 100.00Orissa 54.81 0.00 2.06 43.12 100.00West Bengal 74.19 0.00 2.17 23.64 100.00
North eastArunachal Pradesh 0.00 0.00 7.42 92.58 100.00Assam 79.87 0.79 1.23 18.12 100.00Manipur 48.75 36.89 2.65 11.71 100.00Meghalaya 54.50 12.01 1.07 32.42 100.00Mizoram 0.00 15.82 0.90 83.28 100.00Nagaland 0.00 57.05 3.50 39.45 100.00Sikkim 76.16 23.18 0.66 0.00 100.00Tripura 0.00 45.33 5.19 49.48 100.00
India 93.21 2.90 1.02 2.88 100.00
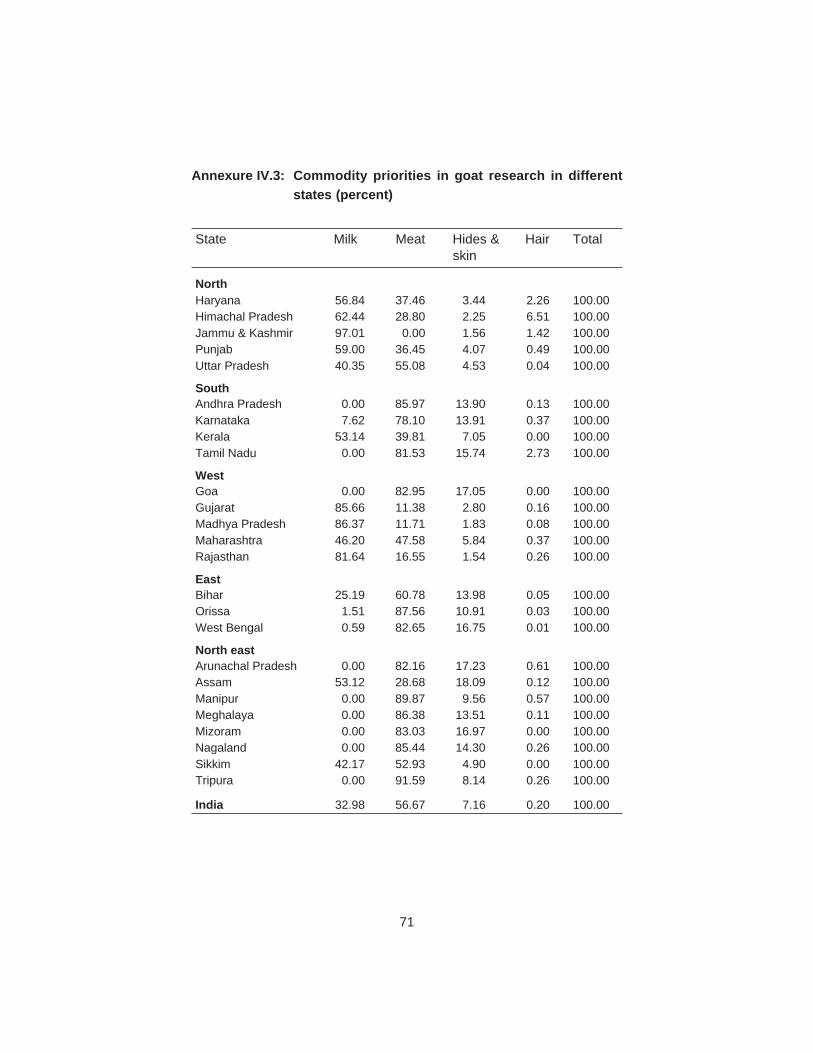
71
Annexure IV.3: Commodity priorities in goat research in differentstates (percent)
State Milk Meat Hides & Hair Totalskin
NorthHaryana 56.84 37.46 3.44 2.26 100.00Himachal Pradesh 62.44 28.80 2.25 6.51 100.00Jammu & Kashmir 97.01 0.00 1.56 1.42 100.00Punjab 59.00 36.45 4.07 0.49 100.00Uttar Pradesh 40.35 55.08 4.53 0.04 100.00
SouthAndhra Pradesh 0.00 85.97 13.90 0.13 100.00Karnataka 7.62 78.10 13.91 0.37 100.00Kerala 53.14 39.81 7.05 0.00 100.00Tamil Nadu 0.00 81.53 15.74 2.73 100.00
WestGoa 0.00 82.95 17.05 0.00 100.00Gujarat 85.66 11.38 2.80 0.16 100.00Madhya Pradesh 86.37 11.71 1.83 0.08 100.00Maharashtra 46.20 47.58 5.84 0.37 100.00Rajasthan 81.64 16.55 1.54 0.26 100.00
EastBihar 25.19 60.78 13.98 0.05 100.00Orissa 1.51 87.56 10.91 0.03 100.00West Bengal 0.59 82.65 16.75 0.01 100.00
North eastArunachal Pradesh 0.00 82.16 17.23 0.61 100.00Assam 53.12 28.68 18.09 0.12 100.00Manipur 0.00 89.87 9.56 0.57 100.00Meghalaya 0.00 86.38 13.51 0.11 100.00Mizoram 0.00 83.03 16.97 0.00 100.00Nagaland 0.00 85.44 14.30 0.26 100.00Sikkim 42.17 52.93 4.90 0.00 100.00Tripura 0.00 91.59 8.14 0.26 100.00
India 32.98 56.67 7.16 0.20 100.00
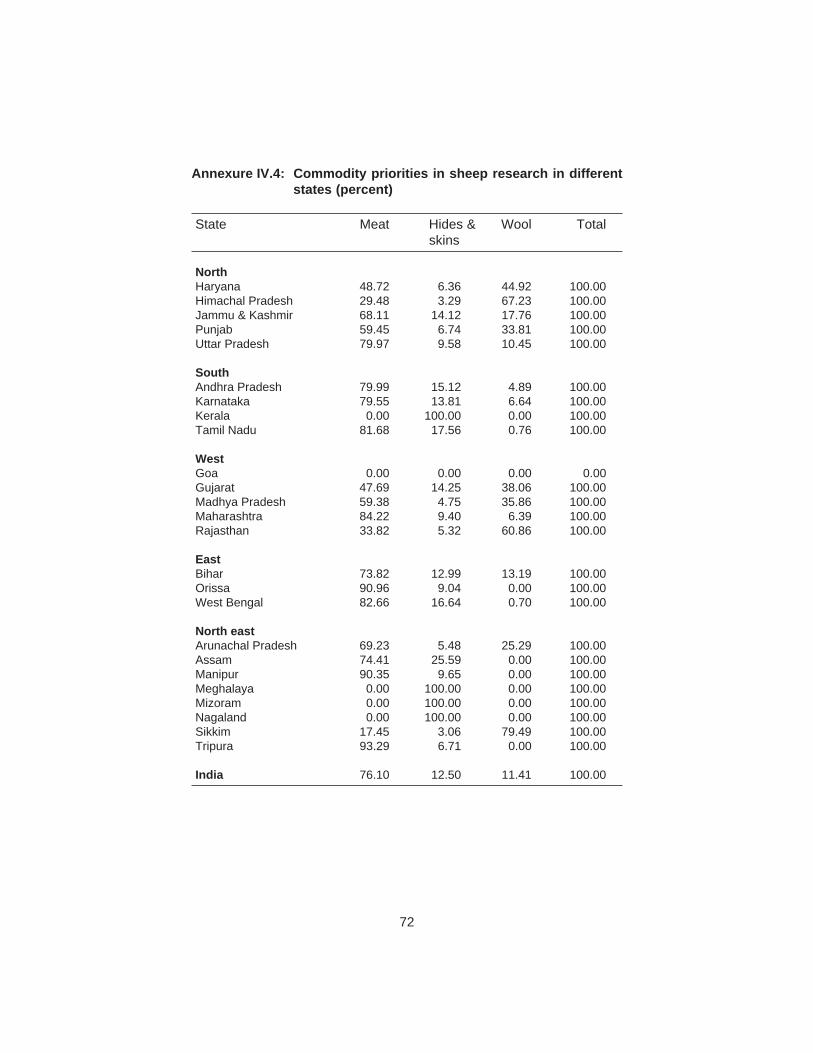
72
Annexure IV.4: Commodity priorities in sheep research in differentstates (percent)
State Meat Hides & Wool Totalskins
NorthHaryana 48.72 6.36 44.92 100.00Himachal Pradesh 29.48 3.29 67.23 100.00Jammu & Kashmir 68.11 14.12 17.76 100.00Punjab 59.45 6.74 33.81 100.00Uttar Pradesh 79.97 9.58 10.45 100.00
SouthAndhra Pradesh 79.99 15.12 4.89 100.00Karnataka 79.55 13.81 6.64 100.00Kerala 0.00 100.00 0.00 100.00Tamil Nadu 81.68 17.56 0.76 100.00
WestGoa 0.00 0.00 0.00 0.00Gujarat 47.69 14.25 38.06 100.00Madhya Pradesh 59.38 4.75 35.86 100.00Maharashtra 84.22 9.40 6.39 100.00Rajasthan 33.82 5.32 60.86 100.00
EastBihar 73.82 12.99 13.19 100.00Orissa 90.96 9.04 0.00 100.00West Bengal 82.66 16.64 0.70 100.00
North eastArunachal Pradesh 69.23 5.48 25.29 100.00Assam 74.41 25.59 0.00 100.00Manipur 90.35 9.65 0.00 100.00Meghalaya 0.00 100.00 0.00 100.00Mizoram 0.00 100.00 0.00 100.00Nagaland 0.00 100.00 0.00 100.00Sikkim 17.45 3.06 79.49 100.00Tripura 93.29 6.71 0.00 100.00
India 76.10 12.50 11.41 100.00
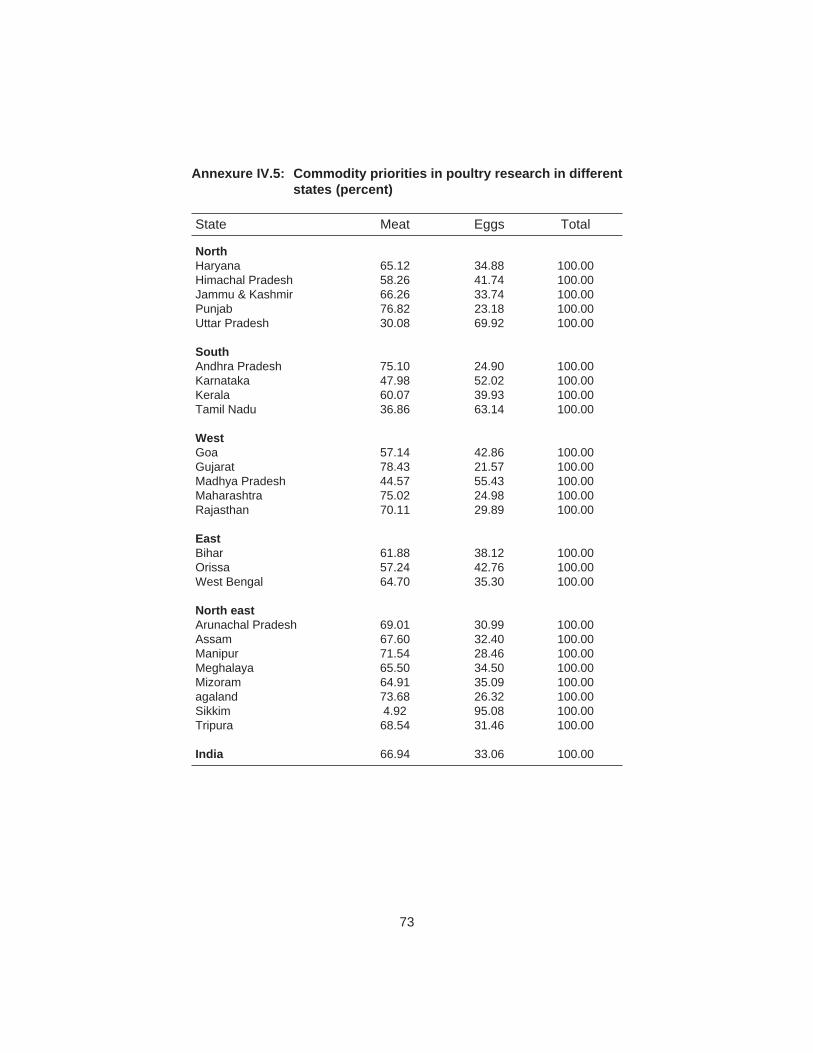
73
Annexure IV.5: Commodity priorities in poultry research in differentstates (percent)
State Meat Eggs Total
NorthHaryana 65.12 34.88 100.00Himachal Pradesh 58.26 41.74 100.00Jammu & Kashmir 66.26 33.74 100.00Punjab 76.82 23.18 100.00Uttar Pradesh 30.08 69.92 100.00
SouthAndhra Pradesh 75.10 24.90 100.00Karnataka 47.98 52.02 100.00Kerala 60.07 39.93 100.00Tamil Nadu 36.86 63.14 100.00
WestGoa 57.14 42.86 100.00Gujarat 78.43 21.57 100.00Madhya Pradesh 44.57 55.43 100.00Maharashtra 75.02 24.98 100.00Rajasthan 70.11 29.89 100.00
EastBihar 61.88 38.12 100.00Orissa 57.24 42.76 100.00West Bengal 64.70 35.30 100.00
North eastArunachal Pradesh 69.01 30.99 100.00Assam 67.60 32.40 100.00Manipur 71.54 28.46 100.00Meghalaya 65.50 34.50 100.00Mizoram 64.91 35.09 100.00agaland 73.68 26.32 100.00Sikkim 4.92 95.08 100.00Tripura 68.54 31.46 100.00
India 66.94 33.06 100.00
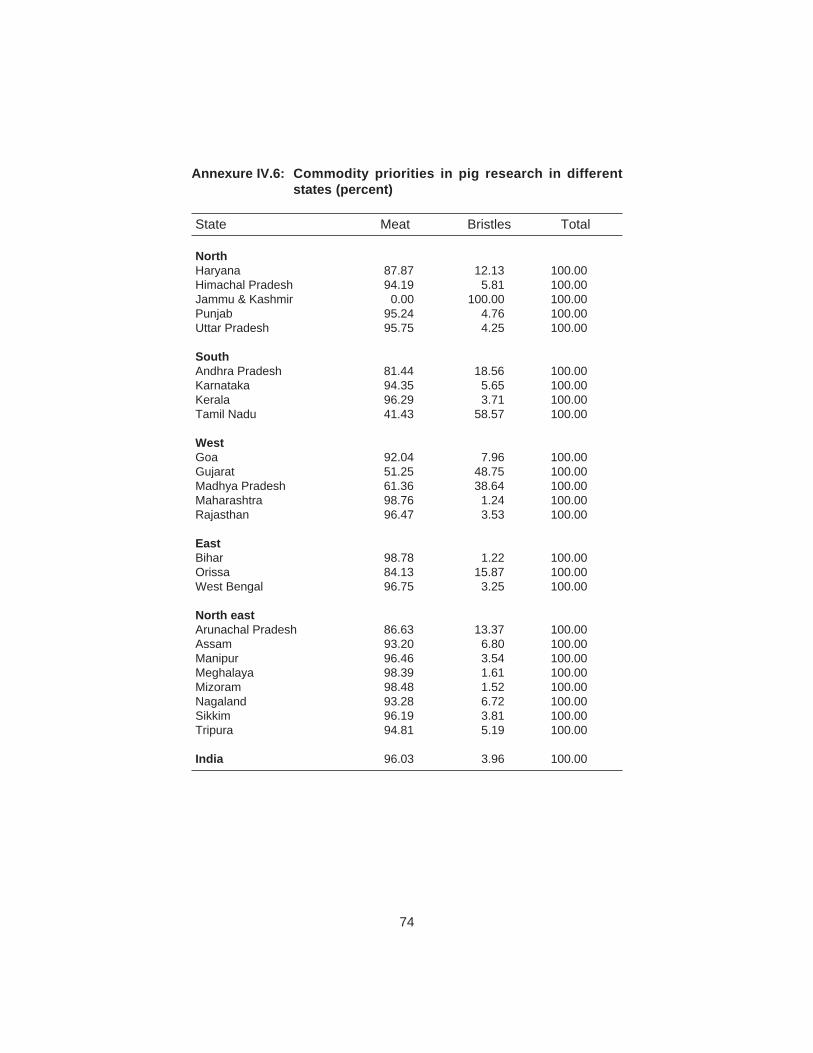
74
Annexure IV.6: Commodity priorities in pig research in differentstates (percent)
State Meat Bristles Total
NorthHaryana 87.87 12.13 100.00Himachal Pradesh 94.19 5.81 100.00Jammu & Kashmir 0.00 100.00 100.00Punjab 95.24 4.76 100.00Uttar Pradesh 95.75 4.25 100.00
SouthAndhra Pradesh 81.44 18.56 100.00Karnataka 94.35 5.65 100.00Kerala 96.29 3.71 100.00Tamil Nadu 41.43 58.57 100.00
WestGoa 92.04 7.96 100.00Gujarat 51.25 48.75 100.00Madhya Pradesh 61.36 38.64 100.00Maharashtra 98.76 1.24 100.00Rajasthan 96.47 3.53 100.00
EastBihar 98.78 1.22 100.00Orissa 84.13 15.87 100.00West Bengal 96.75 3.25 100.00
North eastArunachal Pradesh 86.63 13.37 100.00Assam 93.20 6.80 100.00Manipur 96.46 3.54 100.00Meghalaya 98.39 1.61 100.00Mizoram 98.48 1.52 100.00Nagaland 93.28 6.72 100.00Sikkim 96.19 3.81 100.00Tripura 94.81 5.19 100.00
India 96.03 3.96 100.00
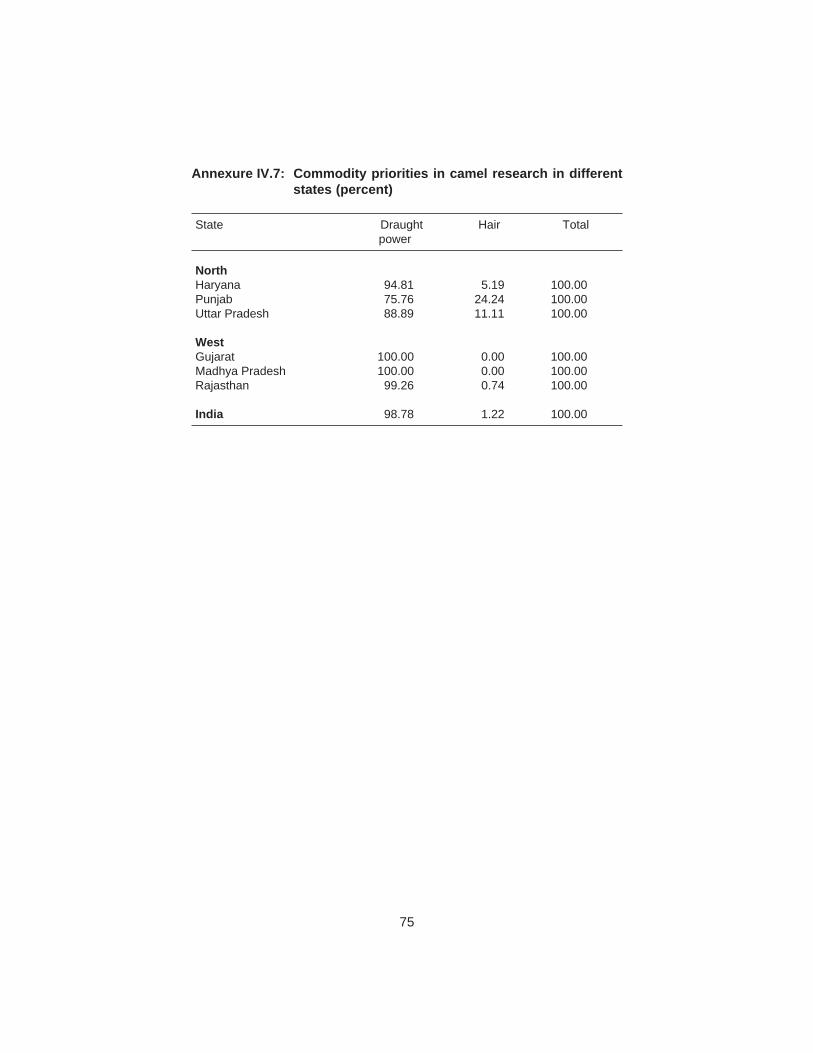
75
Annexure IV.7: Commodity priorities in camel research in differentstates (percent)
State Draught Hair Totalpower
NorthHaryana 94.81 5.19 100.00Punjab 75.76 24.24 100.00Uttar Pradesh 88.89 11.11 100.00
WestGujarat 100.00 0.00 100.00Madhya Pradesh 100.00 0.00 100.00Rajasthan 99.26 0.74 100.00
India 98.78 1.22 100.00