Embed Size (px)
Citation preview

An Analysis of Audit Fees Following the Passage of Sarbanes-Oxley
Paul A. Griffina and David H. Lontb*
aUniversity of California
bUniversity of Otago
Abstract
This study analyzes audit fees following SOX, in particular, the residual increase in audit fees controlling for those factors predicted to change such fees but for the Act. We find significant relations between residual audit fees and incremental audit risk, audit effort, and auditor changes. These factors are noticeably more influential in the period following SOX that includes the implementation of section 404 on internal control. Our results imply that SOX most likely caused an increase in the auditing profession’s share of the risk of defective financial statements and client companies’ resources to audit a costlier accounting system.
JEL Classifications: K22, L80, M41, M42
Keywords: Sarbanes-Oxley, audit fees, SEC certification, section 404, internal control
1. Introduction
This study examines the impact of the Sarbanes-Oxley Act of 2002 (hereafter, SOX or the Act) on audit fees and provides evidence that supports hypotheses about key factors that explain that impact. SOX changed substantially the overall scope, quality, and cost of an audit by requiring an integrated audit of company financial statements and disclosures and the internal controls that form the basis for those statements and
* Corresponding author: Paul A. Griffin, Graduate School of Management, University of California, Davis, 95616. Tel: 1-530-752-7372. Fax: 1-425-799-4143. We thank Jesse Gentry, Timothy Lashua, Lisa Whiting (KPMG), Joe Cyr (Audit Analytics), Michael Maher, Prasad Naik, Chih-Ling Tsai (University of California, Davis), Donald Stokes (University of Technology, Sydney), Stephen Taylor (University of New South Wales), David Marginson (University of Manchester), and Tim Fairhall (Victoria University of Wellington) for their useful comments. We also thank a reviewer for this journal. Previous versions of this paper have been presented at the Victoria University of Wellington, University of Otago, University of Technology, Sydney, and University of California, Davis. An earlier version was also presented at the 2005 National Meetings of the American Accounting Association, San Francisco. Michael Bowers assisted in the data collection. All errors and omissions are the responsibility of the authors.
05_Griffin Lont.indd 161 8/29/07 11:00:02 AM

Paul A. Griffin and David H. Lont Asia-Pacific Journal of Accounting & Economics 14 (2007) 161–192
162
disclosures. SOX also changed the oversight of the auditing profession by creating the Public Company Accounting Oversight Board (PCAOB). These changes in regulation and oversight of financial accounting and auditing – possibly the most far-reaching since the securities acts of the 1930s – created new challenges and fee opportunities for the auditing profession.
In 2002 and 2003, for example, SOX mandated significant changes in financial reporting such as the provision (section 302) for certification of financial statements (SEC Release 33-8124, August 29, 2002), reconciliation of non-GAAP financial measures (SEC Release 33-8176, January 22, 2003), and enhancement of disclosures about special purpose entities and other off-balance sheet items (SEC Release 33-8182, January 28, 2003). A major provision of the Act was the 2004 requirement for management to assess and report on internal controls over financial reporting and for auditors to attest to that assessment and to report on internal control (section 404). The SEC issued a final release on internal control in early 2004 (SEC Release 33-8392, February 24, 2004), after extending filing compliance to fiscal year ends from November 15, 2004, due mainly to companies’ and auditors’ concerns about the “substantial time and resources needed” for proper implementation. The PCAOB released Auditing Standard No. 2 on attestation engagements under section 404 on March 9, 2004 (PCAOB 2004). That standard set forth in detail auditors’ requirements for performing an audit of internal control over financial reporting in accordance with SOX.1
How costly were these provisions? The SEC provided only partial information on the likely costs imposed on companies by these provisions, and an earlier release (SEC Release 33-8238, June 5, 2003) explicitly excluded an estimate of the additional audit fees – which it noted could be substantial – in a calculation of section 404 annual compliance costs of US$1.24 billion (US$91,000 per company). Others, too, have estimated and/or commented on the overall impact of SOX on company costs, often with disparate views (e.g., Committee on Financial Services 2005, Butler and Ribstein 2006). But none to our knowledge has singled out audit fees and documented with controls how much they have changed in response to SOX, which is an initial goal of this paper. This paper aims to capture the response to SOX as the residual audit fee following the Act, that is, the difference between the actual audit fee and the audit fee expected in the absence of the Act (discussed further below).
A second goal is to test propositions about the reasons to explain residual audit fees. This paper posits that residual audit fees following SOX can be partially explained by two factors – audit risk and audit effort. In the first case, higher audit fees should be observed in the event that SOX lowers auditors’ thresholds regarding the risks of defective financial statements, including litigation risk. Second, higher audit fees should also be observed if SOX increases the time and resources a company applies to operate its accounting system, including the additional effort for reporting and attestation on financial statements and internal controls. Section 404 of SOX, for example, specifically mandates that auditors evaluate management’s assertions about internal controls, test
1 During this same period and, in part, as a response to the same corporate scandals and bankruptcies that preceded the Act, the profession adopted and/or revised other auditing standards such as the standards on enhanced responsibility for fraud detection and communication (Statement on Auditing Standards No. 99, 2002), and revenue recognition (SEC Staff Accounting Bulletin No. 104, 2003).
05_Griffin Lont.indd 162 8/29/07 11:00:02 AM
Paul A. Griffin and David H. Lont Asia-Pacific Journal of Accounting & Economics 14 (2007) 161–192
163
those controls, and issue an independent opinion based thereon. Auditors prior to SOX were required to test internal controls only if they chose to rely on such to reduce substantive testing.
Hypotheses about the influence of two related factors are also tested. It is reasoned that audit fees should change because of auditor realignments in response to SOX. Such propositions are introduced because, as is noted in section 3, the frequency of resignations and dismissals has increased significantly in the past few years, and most of these have occurred after the passage of SOX (see, also, Ettredge et al. 2006). If an auditor resigns, for example, because the fee is too low for the additional risk under the Act, it is hypothesized that subsequent fees should increase (e.g., DeFond et al. 1997, Krishnan and Krishnan 1997). Conversely, if a company dismisses its auditor because the fee is excessive, it should be observed that subsequent fees decrease, including the effects of possible fee discounting (e.g., Simon and Francis 1988, Sankaraguruswamy and Whisenant 2004). This paper also compares the significance of the risk and effort proxies to explain residual audit fees over time and hypothesizes that such effects should explain more of the later audit fee residuals to the extent that the auditor applies more time and resources to the internal control requirements rather than the earlier provisions on certification and disclosure.
The distinction between audit risk and audit effort in setting audit fees is important because it helps us understand the profession’s response to the opportunities and challenges of SOX. If risk factors predominate, this model implies significant additional risk sharing and price protection on the part of the auditor following SOX, since the auditor shares in – and is compensated for – the additional risk of defective financial statements, including litigation risk.
Auditing Standard No. 2 (PCAOB 2004), for example, under the integrated audit concept, imposes additional risk by requiring the auditor to evaluate all controls that address the possibility of fraud that could have a material impact on the financial statements. Auditing Standard No. 2, in fact, sets an unusually low risk threshold (Committee on Capital Markets Regulation 2006). The standard not only imposes higher costs by requiring auditors to look for “significant deficiencies” in internal controls and to provide “reasonable assurance” that “no material weaknesses” exist, but also defines a deficiency as significant and a weakness as material if there is “more than a remote likelihood” that a material misstatement of the annual or interim financial statements will not be prevented or detected.2
On the other hand, if effort factors predominate, our theory suggests that the audit fee increases following SOX will more likely reflect the additional time and resources to audit a costlier accounting and reporting system, and such costs fall more squarely on company shareholders, apart from financial statement risk sharing.
To implement this study, a measure of residual audit fee is constructed as the difference between actual audit fee in a post-SOX period and predicted audit fee in that
2 The costs of a low risk threshold are compounded by possible additional management and auditor liability under section 906 of SOX, which subjects CEOs and CFOs to criminal sanctions for material misrepresentations, including knowledge of internal control weaknesses.
05_Griffin Lont.indd 163 8/29/07 11:00:02 AM

Paul A. Griffin and David H. Lont Asia-Pacific Journal of Accounting & Economics 14 (2007) 161–192
164
same post-SOX period conditional on a model of audit fee in the absence of SOX.3 An extensive literature on audit fee determinants (section 2) helps us specify that model. The paper then examines whether this prediction error can be explained by proxies for audit risk and audit effort in the post-SOX period. Also included are variables to control for residual audit fees’ response to auditor realignments and time-related shifts more generally, for example, in response to the earlier (section 302) or later (section 404) requirements.
The results, based on an initial sample of more than 20,000 company-year audit fee observations for Big 4/5 audit firms for 2000-2004, generally confirm the hypotheses about the direction and amount of residual audit fee following SOX and the reasons for such. First, based on a logarithmic model, this paper documents a dollar-equivalent mean (median) residual increase in audit fees per company of US$1.1 million (US$320,000) from the fiscal year immediately prior to passage of the Act (July 25, 2002) to fiscal year 2004 and, of these amounts, slightly less than one-half reflects an unexpected jump in fees from 2003 to 2004, presumably in relation to section 404.
These residual audit fee increases, however, are not uniform across the Big 4 firms. For example, Price Waterhouse Coopers gains the most in every post-SOX year, both in dollar terms (e.g., a US$1.6 million mean increase to 2004) and as an increase in fees from one year prior to the passage of the Act (e.g., a 172% mean increase to 2004).
It is also found that these dollar-equivalent results are not substantially different from the actual mean audit fee change from before SOX to 2004 and, therefore, they may not be surprising, especially from a practical standpoint. One implication is that the actual changes in audit fees following SOX may, therefore, be mostly unanticipated changes, a notion that has been assumed rather than documented in the literature thus far. However, such fee increases based on dollar-equivalent or actual means can be influenced by outliers (e.g., large audit fee changes) and these can generate unreliable results. The hypothesis tests in the paper use logarithmic regressions to reduce the impact of outliers.
Second, regression analysis indicates that both the audit risk and audit effort proxies, and the auditor realignment variables, all significantly explain residual audit fees following SOX in ways that support our hypotheses. Companies in the post-SOX period with greater litigation risk and negative earnings (our audit risk proxies) experience significantly higher residual audit fees (supports H1). This is consistent with higher than expected post-SOX audit risk as a fee driver. Larger companies, those with December 31 fiscal year ends, and those with more days from year end to auditor signature date (our audit effort proxies) also experience significantly higher residual audit fees, consistent with higher than expected post-SOX audit effort as a second fee driver (supports H2). Residual audit fees also increase significantly following an auditor resignation in the post-SOX period. This is consistent with the view that an incoming auditor charges more to reflect increased audit risk, whereas residual audit fees decline significantly for
3 For consistency, the term “residual audit fee” is used throughout the paper as actual audit fee less predicted audit fee. This term, however, could be equivalently represented as “residual change in audit fee,” defined as the difference between actual audit fee change and predicted audit fee change, where predicted audit fee change is the difference between predicted audit fee next period (conditional on an audit fee model) and actual audit fee this period.
05_Griffin Lont.indd 164 8/29/07 11:00:02 AM

Paul A. Griffin and David H. Lont Asia-Pacific Journal of Accounting & Economics 14 (2007) 161–192
165
companies that dismiss their auditor in the post-SOX period, consistent with decreased audit effort and/or fee discounting by the incoming auditor (supports H3).
Additionally, it is found that our audit risk and audit effort proxies are more influential in explaining residual audit fees following the later SOX requirements, in particular, section 404 on internal controls (supports H4). These results are robust to different regression estimation approaches, variable definitions, and other reliability checks.
The remainder of the paper is organised as follows. Section 2 states a theoretical foundation for the hypotheses and specifies the empirical models to test these hypotheses. Section 3 identifies and describes the data and characteristics of the sample. Section 4 presents the results and examines their robustness to alternatives. Section 5 summarizes the conclusions and discusses their implications for professionals and researchers.
2. Theory and Models
2.1. Theoretical Analysis
The analysis of unexpected or residual audit fees – the primary variable of interest – requires a model of expected audit fees in the absence of SOX. We build upon an extensive literature on the determinants of audit fees, dating back to Simunic (1980). This seminal study models audit fees as an element of the cost of the company’s accounting system, where a profit maximizing company seeks to minimize the expected cost of financial reporting. This cost consists of three components: (1) the cost of operating the internal accounting system, va, where v is the per unit cost of utilizing a units of internal accounting resources, (2) the cost of external auditing, pq, where p is the per unit equilibrium price of utilizing q units of external auditing resources (including a normal return to the auditor), and (3) the company’s share of expected losses from defects in the audited financial statements, E(d|a,q)(1-E(φ)), where E(d|a,q) are the expected losses conditional on the auditing and accounting system resources utilized, and E(φ) and 1-E(φ) are the auditor’s and company’s shares, respectively, of those expected losses. The auditor’s problem is to supply q units of external auditing resources at an equilibrium price per unit, p, to the point of incremental expected total cost to the auditor, where such cost comprises the cost of external auditing, cq, and the auditor’s share of expected losses from defects in the audited financial statements, E(d|a,q)E(φ). With competition, the auditor establishes a fee, pq, which is equal to the incremental expected total cost, or pq = E(C) = cq + E(d|a,q)E(φ).
Several studies (see below, for example) use this theory to model and estimate the determinants of audit fees, for instance, to establish a baseline audit fee to test whether fees are too high or too low, to test for the incremental effects of additional or experimental variables, and to assess methodological alternatives that might better represent possible interplay among the determinants. The extensiveness of more than two decades of literature on this topic is recognized (see, also, Appendix 1).
The preceding theory, as with prior research, is used to predict the impact of audit risk and audit effort on audit fees. For example, Seetharaman et al. (2002) predict the
05_Griffin Lont.indd 165 8/29/07 11:00:03 AM

Paul A. Griffin and David H. Lont Asia-Pacific Journal of Accounting & Economics 14 (2007) 161–192
166
impact on audit fees of differences in the litigation environment of the country in which an auditor operates. They reason that in a more litigious situation the auditor will assess higher levels of E(d|a,q) and E(φ), and this leads to an increase in audit fees. This paper reasons similarly in that SOX lowers the litigation threshold for SEC registrants and auditors. Our first hypothesis, in the alternate form, may, thus, be stated as follows: that audit fees following SOX, at least in the short term, should increase as a result of an increased assessment of audit risk, E(d|a,q)E(φ) (H1).
The theory also predicts a positive relation between residual audit fee changes following SOX and post-SOX audit effort. It is reasoned here that to the extent that SOX increases the cost of operating the company’s internal accounting system, va, especially the internal accounting resources a utilized, it also would necessarily increase the resources required to audit that system. The cost of auditing the additional accounting resources in response to SOX should be reflected in a higher cq. Assuming c is constant, or comparatively unchanged, a second hypothesis is offered, stated in the alternate form, that audit fees should change in response to a change in q, in other words, the incremental audit effort in response to SOX (H2). There may, of course, be an offsetting effect on E(d|a,q) and audit risk to the extent that increases in a and q reduce the cost of defective financial statements. But this should make a test of H1 more difficult to reject. As discussed earlier, this paper also hypothesizes a positive relation between residual audit fee changes after SOX and auditor resignations (higher audit risk) and a negative relation between residual audit fee changes after SOX and auditor dismissals (reduced audit effort and/or fee discounting) (H3). Finally, this paper interacts the effects of the audit risk and effort proxies on audit fees with the timing of the provisions and hypothesizes that audit fees will be more responsive to audit risk and effort factors later in the study period, especially to the extent that section 404 on internal controls absorbs more auditing resources than the earlier provisions (H4).
2.2. Empirical Models
This section states the empirical models to test the hypotheses. Model 1 regresses audit fee determinants on audit fees in a control period (fiscal periods prior to SOX) and this model is used to predict audit fees in the fiscal periods following SOX. Model 2 regresses proxies for audit effort and audit risk, and auditor realignment variables, on residual audit fees, that is, the difference between actual audit fees in the post-SOX period and audit fees predicted by model 1 conditional on the actual values of the audit fee determinants in the post-SOX period (model 2).
As a supplement to model 2, a third model is also stated to pool the pre- and post-SOX audit fee data into a single model (model 3). This model combines the variables in models 1 and 2 and includes interaction variables to test for possible time-dependent impacts such as whether the audit risk or audit effort variables are more influential later rather than earlier in the post-SOX period. The models are specified without subscripts for company i and year t for convenience.
05_Griffin Lont.indd 166 8/29/07 11:00:03 AM

Paul A. Griffin and David H. Lont Asia-Pacific Journal of Accounting & Economics 14 (2007) 161–192
167
Model 1 is stated as follows:
Log(Aud) = α + β1,1 Log(AudRel) + β1,2Log(Tax) + β1,3Log(OthNA) + β1,4Litig + β1,5NegEPS + β1,6Log(Zquin) + β1,7GoingCon + β1,8Issues + β1,9Tenure + β1,10FYRDec31 + β1,11 Days2Sign + β1,12Mkt/Book + β1,13Log(Mcap) + β1,14Log(Size) + β1,15Segm + β1,16Frgn + β1,17Log(Cash&CE) + β1,18Log(Rec&Inv) + β1,19Log(OffBS) + β1,20XI&DisC+ β1,21IndyLeader+ β1,22IndySize+β1,23Instit + Σj =-1,…4β24,jAudCh + ε (1)
We define the variables below and rely on prior research to support the expected signs of the coefficients. This model is consistent with Simunic’s (1980) audit fee model and similar to other audit fee models in the literature.4 In addition to these studies, separate variables for non-audit, tax, and other non-audit fees are included along with other variables less well documented in the literature, such as the extent of prior securities litigation against the company, number of reportable events, days to auditor signature, and type of auditor realignment (e.g., dismissal, resignation). Appendix 1 lists key prior research pertaining to the expected sign of the relation of each variable to audit fees. ε represents estimation period random error.
# Variable Sign Definition
0 Log(Aud) Log10 of audit fees for fiscal year.
1 Log(AudRel) + Log10 of audit-related fees for fiscal year.
2 Log(Tax) + Log10 of total tax-related fees for fiscal year.
3 Log(OthNA) + Log10 of other (non-tax, non-audit related) non-audit fees for fiscal year.
4 Litig +Litigation risk = 1 if the company has been subject to a securities class action, issued an SEC NT filing, or restated earnings in the year prior to the audit year, otherwise 0.
5 NegEPS + Fiscal year earnings per share before extraordinary and discontinued operations less than zero=1, otherwise 0.
6 Zquin + Quintile ranking of Altman Z-score times -1.
7 GoingCon + Going concern qualification =1, otherwise 0.
8 Issues + Issues=1 if the company makes at least one non-standard reportable event disclosure in the 8-K filing, otherwise 0.
4 For a more general review of the literature on audit fee models, see inter alia Hay et al. (2006), who examine 186 analyses in 147 studies over 1977-2003 based on data from 20 different countries. The most pervasive audit fee determinant from these studies is company size. Other reviews include Yardley et al. (1992), Turpen (1995), and Simunic and Stein (1996) (mostly on litigation risk). Other studies have addressed whether audit or non-audit fees threaten auditor independence, and have tested variations of the hypothesis that higher non-audit fees are associated with a greater incidence of earnings management, where the latter offers indirect evidence of weakened auditor independence. These studies use SEC Release 33-7919 disclosures for fiscal years 2000 and 2001 and include Frankel et al. (2002), Chung and Kallapur (2003), Kinney et al. (2004), and Larcker and Richardson (2004).
05_Griffin Lont.indd 167 8/29/07 11:00:03 AM

Paul A. Griffin and David H. Lont Asia-Pacific Journal of Accounting & Economics 14 (2007) 161–192
168
9 Tenure + Number of years company audited by incumbent auditor.
10 FYRDec31 + Fiscal year ended December 31=1, otherwise 0.
11 Days2Sign + Days from fiscal year end to auditor’s signature > median Days to Signature =1, otherwise 0.
12 Mkt/Book + Ratio of market capitalization to common book equity at end of fiscal year.
13 Log(Mcap) + Log10 of market capitalization of common shares at end of fiscal year, millions.
14 Log(Size) + Log10 of total assets for fiscal year, millions.
15 Segm + Number of segments at end of fiscal year.
16 Frgn + Ratio of foreign sales to total sales for fiscal year, %.
17 Log(Cash&CE) − Log10 of cash and cash equivalents at end of fiscal year, millions.
18 Log(Rec&Inv) + Log10 of receivables and inventory at end of fiscal year, millions.
19 Log(OffBS) + Log10 of sum of operating lease commitments at end of fiscal year, millions.
20 XI&DisC + Extraordinary items and discontinued operations for fiscal year not equal to zero=1, otherwise 0.
21 IndyLeader −Audit firm has greatest number of clients in 3-digit NAICS catego-ry=1, otherwise 0.
22 IndySize + Decile ranking of number of companies in 3-digit NAICS code.
23 Instit + Ratio of institutional common shares held to total shares outstanding at end of fiscal year, %.
24,1 Dismiss − Dismissal=1 in incoming auditor change year, otherwise 0.
24,2 Resign + Resignation=1 in incoming auditor change year, otherwise 0.
24,3 AudChOther ? Auditor change reason unstated=1 in incoming auditor change year, otherwise 0.
24,4 AudChFromAA ? Andersen dismissal due to indictment=1, otherwise 0.
Model 1 is used to predict residual audit fees for company i in period t following SOX, namely, ε̂it = Log(Audit) – PredLog(Audit| model 1), where PredLog(Audit| model 1) = α̂ + Σj=1,…,24 β̂jDeterminantitj, where the j determinants in the t post-SOX periods are
multiplied by β̂j estimated over fiscal periods prior to SOX. Residual audit fees are used, in turn, as the dependent variable in our second-stage model 2. This model regresses key audit risk and effort proxies on post-SOX residual audit fees, ε̂it. This model is stated, without i and t subscripts, as follows.
ε̂ = α + Σp=1,…,P γ1pAudRiskp + Σq=1,…,Q γ2qAudEffortq + Σr=1,…,R γ3rAudRealignr + ω (2)
where AudRiskp = Litig, NegEPS; AudEffortq = FYRDec31, Days2Sign, and Log(MCap);
05_Griffin Lont.indd 168 8/29/07 11:00:04 AM

Paul A. Griffin and David H. Lont Asia-Pacific Journal of Accounting & Economics 14 (2007) 161–192
169
AudRealign = unit variables for Dismiss, Resign, AudChOther for the fiscal periods following SOX, and ω is a random error term. It is posited that the estimated γ coefficients should be positive for the audit risk and audit effort proxies, and negative and positive for dismissals and resignations, respectively. No prediction regarding the sign of γ for other auditor changes is made.
The choices of the proxies for audit risk and audit effort are guided by a desire to employ as direct measures as possible. Prior research has tended to use less direct measures, such as stock price volatility (e.g., Lys and Watts 1994) or leverage (Gul and Tsui 1997) as a proxy for litigation risk, which may explain their mixed results. Companies with prior litigation (and the potential for litigation as evidenced by a restatement or late filing) and/or negative earnings should be riskier to audit than others. Companies whose incumbent auditor has resigned should also impose more audit risk than otherwise similar companies. Of course, there may be other reasons for a resignation. It is also reasonable that larger companies and those with December 31 year ends and longer audit periods should require more audit effort. Market capitalization is selected as a proxy for size-related audit effort because this includes assets (and liabilities) not recognized in the accounting statements. Unrecognized amounts (e.g., intangibles and contracts) can constitute a substantial fraction of company net assets to which auditing resources are applied. Moreover, this could be increasingly the case for many companies in recent years, including our sample. Nonetheless, other size proxies (e.g., total assets, revenues) are tested and these are commented on in a later section. An incoming auditor following a dismissal, on the other hand, should complete the audit for a lower fee than the incumbent. It is recognized, however, that some of these variables may not uniquely reflect audit risk or audit effort. For example, as the audit period increases, this could be a sign of delay to complete the audit, which could increase audit risk. Further, a lack of clear theory to select the proxies necessarily implies an arbitrary element in their choice, although as is discussed later, these results are robust to other risk and effort proxies and model estimation in a non-SOX period. It is also recognized that the explanatory power of the audit effort proxies could be mitigated in those situations when audit fee effort is alleviated, for instance, when the auditor receives additional (audit-related) compensation from internal control design.
The third model uses the entire study period to estimate the parameters of the audit fee model and includes multiplicative interaction variables to capture the incremental effects of audit effort and audit risk in the post-SOX period. This model, also, uses interaction variables to distinguish between the initial period following the Act (SOXA), which covers implementation of the certification provisions, and the later period, from April 1, 2003, which covers implementation of section 404 on internal control (SOXB). We choose April 1 as the fiscal year cutoff date for the SOXA period so as to precede the first issue date of the section 404 rules (June 5, 2003) by one quarter. As already noted, hypothesis 4 states that the SOXB coefficients should be more influential than the SOXA coefficients in explaining post SOX audit fees. We state model 3, without i and t subscripts, as follows:
Log(Aud) = α + Σ j=1,…,24β jDeterminant j + δ1SOXA + δ2SOXB + ΣA,BSOXT{(Σp=1,2
η1pAudRiskp) + SOXT(Σq=1,2,3 η2qAudEffortq) + SOXT(Σr=1,2,3 η3rAudRealignr)} + μ, (3)
05_Griffin Lont.indd 169 8/29/07 11:00:04 AM

Paul A. Griffin and David H. Lont Asia-Pacific Journal of Accounting & Economics 14 (2007) 161–192
170
where the Determinantj variables are those in model 1; the AudRiskp, AudEffortq, and AudRealignr variables are those in model 2; SOXT = SOXA or SOXB, where SOXA = 1 for observations from July 25, 2002 to April 1, 2003, otherwise 0, SOXB = 1 for observations from April 1 to December 31, 2004, otherwise 0; and μ reflects random error. Following Brambor et al. (2006), we include both “mean” and “slope” coefficients in the same model for the interaction of SOXT and the risk and effort proxies. In sum, model 3 controls for the determinants of expected or normal audit fees and then tests whether the relations between post-SOX audit fees and audit effort, audit risk, and realignment (coefficients ηp, ηq, and ηr for audit risk, audit effort, and realignment, respectively) are larger or smaller for the SOXA sub-period than the SOXB sub-period. The model also controls for a mean shift effect of SOX on audit fees (coefficients δ1 and δ2). To the extent that one or more of the βj parameters in model 3 may reflect some of the effects of SOX because, for example, such βj parameters are estimated over the entire study period, this approach may be a more conservative test of the impact of SOX on audit fees. The ηp, ηq, ηr, and βj coefficients may also be threatened by collinear independent variables in the model. We comment on this in a later section on robustness checks.
3. Data and Sample Characteristics
3.1. Data
SEC registrants presently disclose two years of audit fee data in their DEF14a proxy statements, or Form 10-K filings, pursuant to SEC Release 33-8183 (January 28, 2003), and provide certain information about auditor changes in their Form 8-K pursuant to SEC Release 33-8400 (March 16, 2004). Audit fee and auditor change data for 25,851 company-years are obtained from Audit Analytics.5 These data cover 7,424 individual SEC registrants audited by a Big 4/5 firm with fiscal year ends from the first quarter of 2000 to December 31, 2004. This is essentially the Big 4/5 audit fee population for that period. Our analysis is restricted to companies audited by a Big 4/5 firm to increase the homogeneity of the sample and, thus, the power of the tests. The auditor realignment observations, therefore, exclude non-lateral and non-Big 4/5 auditor changes. These may be associated with different kinds of company-auditor realignments such as those from a company restructuring or changed need for service (e.g., Sankaraguruswamy and Whisenant 2004).
Restated audit fee amounts are used when such amounts are restated as a result of the newer SEC definitions and combine the audit and non-audit fee amounts of different Big 4/5 auditors when a change in the auditor occurs during the fiscal year. When a company splits “other” non-audit fees, other than tax or audit-related fees, into different categories (e.g., benefit plan related, financial information system design and implementation, miscellaneous), these are combined into one category.
Securities class action litigation data on 3,230 securities class action lawsuits filed against 2,708 SEC companies since 1980 are obtained from a database maintained
5 Audit Analytics is an on-line data service available from Ives, Inc.
05_Griffin Lont.indd 170 8/29/07 11:00:04 AM

Paul A. Griffin and David H. Lont Asia-Pacific Journal of Accounting & Economics 14 (2007) 161–192
171
by Institutional Shareholder Services, Inc. Because ISS states that it provides comprehensive coverage of shareholder litigation events, it is reasonably assumed that companies not in this sample have not been sued in securities class actions. Since the database reports the date of the corrective disclosure or restatement that triggers the class action, it is also possible to pinpoint prior litigation relative to the fiscal year of the audit fee. We gather additional auditor and financial data from Compustat and SEC EDGAR.3.2. Sample
Table 1 summarizes the sample by year and Big 4/5 firm. Panel A shows that the sample comprises at least 4,000 companies per year, spread across five accounting firms. However, the number of Andersen audited companies drops off rapidly after 2001 following its indictment in March 2002 (SEC Release 2002-37), although the increasing percentages of the other Big 4 after 2001 suggest that such companies migrated mostly to other Big 4 auditors. Panels B and C indicate that the audit fee data are substantially skewed. For example, whereas mean Big 4/5 audit fees per company start at US$513,016 in 2000 and increase to US$1,787,427 in 2004, median audit fees per company start much lower at US$176,000 in 2000 and increase to US$721,525 in 2004.
Table 1Audit Fee Sample Characteristics By Year and Audit Firm1
Fiscal Year Andersen Deloitte &Touche
Ernst &Young KPMG
PriceWater-house
Coopers
Total Big4/5
A: Distribution of Company-Year Observations2000 19.84% 15.86% 23.49% 17.38% 23.44% 4,0232001 17.87% 17.07% 23.84% 17.52% 23.70% 5,7522002 5.71% 20.23% 28.01% 19.95% 26.10% 6,2152003 0.09% 21.59% 30.42% 21.61% 26.29% 5,7472004 0.00% 21.95% 28.78% 23.19% 26.08% 4,114All years 25,851
B: Mean Audit Fee, in dollars2000 534,506 536,437 410,916 450,920 627,327 513,0162001 443,151 539,081 393,501 415,224 679,501 498,8062002 646,041 713,730 665,532 657,085 832,055 715,9412003 313,700 857,708 786,877 848,919 1,067,156 888,8592004 na 1,727,562 1,471,556 1,756,450 2,213,895 1,787,427
C: Median Audit Fee, in dollars2000 180,950 159,000 181,500 168,000 186,000 176,0002001 185,000 166,429 183,714 160,250 190,000 180,0002002 248,000 223,250 220,004 194,000 228,748 219,0002003 245,000 272,000 271,473 257,534 302,503 278,2002004 na 671,577 719,000 645,635 883,000 721,525
05_Griffin Lont.indd 171 8/29/07 11:00:05 AM

Paul A. Griffin and David H. Lont Asia-Pacific Journal of Accounting & Economics 14 (2007) 161–192
172
D: Total Audit Fees, in millions of dollars2000 426.54 342.25 388.32 315.19 591.57 2,063.862001 455.56 529.38 539.49 418.55 926.16 2,869.132002 229.34 897.16 1,158.69 814.78 1,349.59 4,449.572003 1.57 1,064.42 1,375.46 1,054.36 1,612.47 5,108.282004 na 1,559.99 1,742.32 1,675.65 2,375.51 7,353.47
E: Distribution of Big 4/5 Lateral Auditor Realignments2
DismissalAndersen Other Big 4 Total Big 4/5 Resignation Other Total
2000 0 7 7 2 12 212001 15 78 93 9 77 1792002 698 96 794 21 141 9562003 299 122 421 18 83 5222004 0 83 83 23 52 158
Notes1 Based on the availability of a DEF14A filing for fiscal years from January 1, 2000 to December 31, 2004.
Audit fee data are for Big 4/5 non-auditor change and Big4/5 lateral auditor change companies.2 A Big 4/5 lateral auditor realignment reflects a change in auditor from one Big 4/5 firm to another Big 4/5
firm.
Consistent with prior research, skewness is reduced by transforming the data logarithmically. Panel D shows aggregate annual audit fees, which for this sample have increased by US$5.29 billion, from US$2.06 billion in 2000 to US$7.35 billion in 2004. Individually, Price Waterhouse Coopers garners the greatest share of this increase, that is, US$1.78 billion or 34% of the aggregate US$5.29 billion amount. It is later addressed (section 4) whether such fee increases would have occurred for reasons other than SOX or whether such fee increases are primarily a consequence of SOX and cannot be explained by other factors. Finally, panel E reports the distribution of Big 4/5 auditor realignments over the study period. As expected, the frequency of Andersen dismissals jumps substantially in 2002. But non-Andersen dismissals and resignations jump substantially too, starting in 2001 and 2002, and remain elevated for the remainder of the study period. It is examined later whether these higher rates of auditor realignment might be associated with residual audit fees following SOX in response to audit risk and audit effort.
3.3. Univariate Analysis
Table 2 provides descriptive statistics for the log of audit fees for 2000-2004 (our dependent variable for model 1) and partitions these data based on certain audit risk and effort proxies. These proxies are litigation risk (1 if company has been subject to a securities class action, issued an SEC NT filing, or restated earnings in the year prior to the audit year, otherwise 0), company size (relative to median total assets in the audit year), company profitability (1 if earnings per share before extraordinary items and discontinued operations are negative, otherwise 0), the busy season (1 if the company
05_Griffin Lont.indd 172 8/29/07 11:00:05 AM

Paul A. Griffin and David H. Lont Asia-Pacific Journal of Accounting & Economics 14 (2007) 161–192
173
has a December 31 fiscal year end, otherwise 0),6 and the number of days from fiscal year end to the auditor’s signature date. Table 2 offers the following observations. First, a logarithmic transformation of audit fees reduces substantially skewness, which is essentially zero over all years. Second, with the exception of days to signature, each of the other audit risk or effort proxies systematically and significantly explains audit fee differences in the direction predicted or as indicated in prior research for each of the years 2000 through 2004. In other words, audit fees in general, and apart from any hypothesized effects of SOX, are significantly higher for companies with greater litigation risk (panel B), larger companies (panel C), less profitable companies (panel D), and when most audit effort occurs in the busy season (panel E). It is expected that the variables in table 2 that explain differences in audit fees on a univariate basis will also be significant in a multivariate regression analysis that controls for common effects.
Table 2
Descriptive Statistics for Log of Audit Fees By Year
Fiscal Year1
Variable Total 2000 2001 2002 2003 2004
A. Audit FirmBig 4/52 mean 5.43 5.29 5.28 5.35 5.43 5.86
std. deviation 0.63 0.53 0.55 0.63 0.66 0.58skewness 0.14 0.47 0.30 0.06 (0.08) 0.02median 5.39 5.25 5.26 5.34 5.44 5.86count 25,851 4,023 5,752 6,215 5,747 4,114
B. Litigation Risk3
Higher mean 5.75 5.53 5.55 5.71 5.80 6.08median 5.66 5.41 5.45 5.61 5.72 6.04
Lower mean 5.36 5.26 5.23 5.28 5.36 5.80median 5.34 5.22 5.22 5.29 5.39 5.82
Difference t value 37.37 11.67 15.93 19.50 19.46 12.63signif.7 *** *** *** *** *** ***
C. Company Size4
Higher mean 5.71 5.51 5.52 5.67 5.71 6.02median 5.69 5.45 5.50 5.65 5.70 6.00
Lower mean 5.14 5.08 5.05 5.14 5.15 5.39median 5.14 5.07 5.06 5.16 5.17 5.38
Difference t value 73.48 23.76 32.40 34.33 33.44 32.77signif.7 *** *** *** *** *** ***
D. Company Profitability5
Higher mean 5.67 5.51 5.53 5.63 5.73 5.89median 5.61 5.43 5.45 5.57 5.66 5.89
Lower mean 5.47 5.24 5.29 5.46 5.53 5.81median 5.40 5.18 5.24 5.38 5.47 5.81
Difference t value 24.86 15.12 16.59 10.70 11.66 4.30signif.7 *** *** *** *** *** ***
6 December 31 year end companies comprise 69.87% of the sample.
05_Griffin Lont.indd 173 8/29/07 11:00:06 AM

Paul A. Griffin and David H. Lont Asia-Pacific Journal of Accounting & Economics 14 (2007) 161–192
174
E. Fiscal Year EndDec. 31 mean 5.49 5.33 5.34 5.43 5.50 5.97
median 5.44 5.27 5.28 5.39 5.49 5.96non-Dec. 31 mean 5.27 4.92 5.16 5.18 5.28 5.63
median 5.28 4.82 5.18 5.21 5.34 5.60Difference t value 25.60 14.74 11.65 14.63 12.13 18.61
signif.7 *** *** *** *** *** ***
F. Days to Signature6
Greater than 90 mean 5.55 5.96 5.44 5.51 4.97 5.79median 5.46 5.96 5.37 5.42 4.93 5.78
Less than 90 mean 5.59 5.30 5.38 5.47 4.94 5.87median 5.54 5.24 5.30 5.42 4.51 5.86
Difference t value (1.61) na 1.24 1.04 0.13 (1.41)signif.7 ns ns ns ns ns ns
Notes 1 Fiscal years from January 1, 2000 to December 31, 2004. Audit fee data are for Big 4/5 non-auditor
realignment companies and Big 4/5 lateral auditor realignment companies only.2 Big 4/5 = Arthur Andersen & Co, Deloitte & Touche, Ernst & Young, KPMG, and PriceWaterhouse
Coopers.3 Litigation risk = 1 if the company has been subject to a securities class action, issued an SEC NT filing, or
restated earnings in the year prior to the audit year, otherwise 0.4 Total assets and earnings per share are relative to the median in the fiscal year.5 Based on earnings per share before extraordinary items and discontinued operations.6 Days from end of fiscal year to auditor’s signature date.7 Significance of t statistic versus null hypothesis of no difference in the means (two tailed test): ***=less
than .0001; **=less than .001, *=less than .01, +=less than .05, ++=less than .10, and ns=not significant.
4. Regression Analysis
4.1. Model 1
Table 3 summarizes the results of estimating model 1 and reports the coefficients for three estimation periods: Observations from January 1, 2000 to (1) December 31, 2004 (all observations), (2) April 1, 2003 (observations prior to section 404 on internal control), and (3) July 25, 2002 (observations prior to the passage of SOX). Cross-sectional ordinary least squares (OLS) regression procedures applied to each estimation period are used to derive the coefficients. These estimation period coefficients are then used to condition our prediction of residual audit fees following SOX. For example, model 1 predicts residual audit fees for the period from April 1, 2003 (the SOXB period) conditional on audit fee coefficients estimated over the period to April 1, 2003. Model 1 also predicts residual audit fees for the period from July 25, 2002 (the SOXA and SOXB periods) conditional on audit fee coefficients estimated over the period to July 25, 2002.
Table 3 documents that the coefficients are mostly consistent in sign and significance across the three estimation periods. The coefficients for the audit risk proxies such as Litig, NegEPS, Zquin, GoingCon, and Issues are positive and significant, as expected. The coefficients for the audit effort variables such as FYRDec31, Days2Sign,
05_Griffin Lont.indd 174 8/29/07 11:00:06 AM

Paul A. Griffin and David H. Lont Asia-Pacific Journal of Accounting & Economics 14 (2007) 161–192
175
Log(Mcap), and Log(Size) are also predictably positive and significant across the different estimation periods. In addition, the coefficients for the non-audit fee variables Log(AudRel), Log(Tax), and Log(OthNA) are positive and significant. This last result is consistent with the view that such variables are not fully endogenous to the model, that is, they represent determinants not jointly reflected in the other variables.7 Most other variable coefficients are consistent with the literature. Audit fees are higher the longer the incumbent auditor has been engaged, the more the company operates internationally, the higher the off-balance sheet liabilities, and when there are more extraordinary items. However, some variables shown to be significant in explaining audit fees in earlier studies are not uniformly significant in the present study, for example, the numbers of segments and resignations are associated with a significant increase in audit fees based on all observations but are not significant in the pre-SOX period. Audit fees following Andersen and other Big 4 dismissals do not change significantly either. These factors are examined further in the model 2 regressions that focus on the post SOX period.
Table 3Regression Estimation of Log of Audit Fee
Estimation Period 1. Observations to 12/31/2004
2. Observations to4/1/2003
3. Observations to7/25/2002
Variable2 Coeff. Signif.1 Coeff. Signif.1 Coeff. Signif.1
Intercept 1.8499 *** 1.9807 *** 2.1184 ***Log(AudRel) 0.0379 *** 0.0233 *** 0.0219 ***Log(Tax) 0.0444 *** 0.0334 *** 0.0311 ***Log(OthNA) 0.0270 *** 0.0370 *** 0.0490 ***Litig 0.1301 *** 0.0921 *** 0.0895 ***NegEPS 0.1647 *** 0.1346 *** 0.1193 ***Zquin 0.0049 + 0.0046 ++ 0.0058 ++GoingCon 0.1670 *** 0.1762 *** 0.1776 ***Issues 0.2581 *** 0.2975 *** 0.1445 +Tenure 0.0455 *** 0.0465 *** 0.0425 ***FYRDec31 0.1395 *** 0.1039 *** 0.0926 ***Days2Sign 0.2011 *** 0.1542 *** 0.1472 ***Mkt/Book 0.0035 *** -0.0007 + - 0.0006 ++Log(Mcap) 0.1900 *** 0.0526 *** 0.0437 ***Log(Size) 0.1725 *** 0.2971 *** 0.2850 ***Segm 0.0220 ** 0.0036 ns 0.0019 nsFrgn 0.0012 *** 0.0002 ns 0.0002 nsLog(Cash&CE) -0.0069 ++ 0.0414 *** 0.0379 ***Log(Rec&Inv) 0.0399 *** 0.0144 *** 0.0225 ***
7 An earlier version of this paper compares the impact on audit fees of the non-audit fee variables based on a joint estimation approach versus an ordinary least squares (OLS) approach. Unlike Whisenant et al. (2003), who document that non-audit fees do not appear to affect audit fees directly after controlling for the joint determination of both fee variables, we find that each of the non-audit fee variables does affect audit fees after controlling for joint estimation. It is also documented that the results from OLS are qualitatively similar to those from joint estimation.
05_Griffin Lont.indd 175 8/29/07 11:00:07 AM

Paul A. Griffin and David H. Lont Asia-Pacific Journal of Accounting & Economics 14 (2007) 161–192
176
Log(OffBS) 0.0065 ++ 0.0170 *** 0.0234 ***XI&DisC 0.0552 *** 0.0439 *** 0.0275 *IndyLeader -0.0581 *** -0.0403 *** -0.0377 ***IndySize 0.0071 *** 0.0066 *** 0.0056 ***Instit 0.0013 *** 0.0001 ns 0.0000 nsDismiss 0.0109 ns 0.0117 ns 0.0310 nsResign 0.1694 *** 0.0380 ns -0.0956 nsAudChOther -0.0240 ns -0.0448 ns -0.0975 +AudChFromAA -0.0197 ns 0.0005 ns 0.0507 nsAdjusted R2 65.10% 71.53% 70.67%No. of observations 20,731 12,333 7,607
Notes1 Tests of significance: ***=less than .0001; **=less than .001, *=less than .01, +=less than .05, ++=less than
.10, and ns=not significant. Tests are relative to a zero regression coefficient.2 Definitions of the variables:
# Variable Definition Source
0 Log(Aud) Log10 of total audit fees for fiscal year. DEF14A1 Log(AudRel) Log10 of total audit-related fee for fiscal year. DEF14A2 Log(Tax) Log10 of total tax-related fee for fiscal year. DEF14A3 Log(OthNA) Log10 of other (non-tax, non-audit related) non-audit fees for
fiscal year. DEF14A
4 Litig Litigation risk = 1 if the company has been subject to a securities class action, issued an SEC NT filing, or restated earnings in the year prior to the audit year, otherwise 0.
ISS, 8-K
5 NegEPS Fiscal year earnings per share before extraordinary and discontinued operations less than zero=1, otherwise 0.
Compustat
6 Zquin Quintile ranking of Altman Z-score times -1 Compustat7 GoingCon Going concern qualification=1, otherwise 0. 8-K8 Issues Issues=1 if the company makes at least one non-standard
reportable event disclosure in the 8-K filing, otherwise 0.8-K
9 Tenure Number of years company audited by incumbent auditor. Compustat10 FYRDec31 Fiscal year ended December 31=1, otherwise 0. Compustat11 Days2Sign Days from fiscal year end to auditor’s signature > median Days
to Signature=1, otherwise 0.Compustat
12 Mkt/Book Ratio of market capitalization to common book equity at end of fiscal year.
CRSP/Compustat
13 Log(Mcap) Log10 of market capitalization of common shares at end of fiscal year, millions.
Compustat
14 Log(Size) Log10 of total assets for fiscal year, millions. Compustat15 Segm Number of segments at end of fiscal year. Compustat16 Frgn Ratio of foreign sales to total sales for fiscal year, %. Compustat17 Log(Cash&CE) Log10 of cash and cash equivalents at end of fiscal year, millions. Compustat18 Log(Rec&Inv) Log10 of receivables and inventory at end of fiscal year, millions. Compustat19 Log(OffBS) Log10 of sum of operating lease commitments at end of fiscal
year, millions.Compustat
05_Griffin Lont.indd 176 8/29/07 11:00:07 AM

Paul A. Griffin and David H. Lont Asia-Pacific Journal of Accounting & Economics 14 (2007) 161–192
177
20 XI&DisC Extraordinary items and discontinued operations for fiscal year not equal to zero=1, otherwise 0.
Compustat
21 IndyLeader Audit firm has greatest number of clients in 3-digit NAICS category=1, otherwise 0.
NAICS
22 IndySize Decile ranking of number of companies in 3-digit NAICS code. NAICS23 Instit Ratio of institutional common shares held to total shares
outstanding at end of fiscal year, %.Compustat
24.1 Dismiss Dismissal=1 in incoming auditor change year, otherwise 0. 8-K24.2 Resign Resignation=1 in incoming auditor change year, otherwise 0. 8-K24.3 AudChOther Auditor change reason unstated=1 in incoming auditor change
year, otherwise 0.8-K
24.4 AudChFromAA Andersen dismissal due to indictment=1, otherwise 0. Direct
4.2. Model 2
Table 4 summarizes the results of estimating model 2, which is used to test hypotheses H1, H2, and H3. The table shows two sets of regressions. The first set regresses audit risk and audit effort on residual audit fees over the period from July 25, 2002 to December 31, 2004. This period combines the SOXA and SOXB sub-periods. The second set regresses audit risk and audit effort on residual audit fees from April 1, 2003 to December 31, 2004. Hence, this second period covers the SOXB sub-period only. Regressions 1 and 3 exclude the auditor realignment variables, whereas regressions 2 and 4 include the auditor realignment variables. Regressions 1 and 2, also, include an intercept variable for the SOXB sub-period to control for a possible post-SOX mean shift from the first to the second regression period in conjunction with the other explanatory variables.
From regression 1, it is observed that the coefficients on Litig(γ11=0.044) and NegEPS(γ12=0.116) (audit risk proxies) are positive and significant, at alpha levels of less than 0.1%. This result supports H1 (in the alternative form). In other words, regression 1 documents a positive relation between residual audit fees in the post-SOX period and post-SOX audit risk after controlling for those factors expected to explain audit fees in a non-SOX period, including “normal” audit risk, effort and other factors. This is interpreted as implying that the higher audit fees following SOX not predicted by a pre-SOX audit fee model are partially attributable to higher levels of post-SOX audit risk, which apparently auditors “shift” to the client as a higher audit fee. Given our theory, this implies additional risk sharing and price protection on the part of the auditor, presumably in response to SOX.
Likewise, the model 2 coefficients on FYRDec31 (γ21=0.092), Days2Sign (γ22=0.044), and Log(MCap) (γ23=0.114) (audit effort proxies) are positive and significant at alpha levels of less than 5%. This supports H2 (in the alternative form), namely, that residual audit fees following SOX are positively associated with post-SOX audit effort, again, after controlling for those factors that would explain audit fees in a non-SOX period.
05_Griffin Lont.indd 177 8/29/07 11:00:08 AM

Paul A. Griffin and David H. Lont Asia-Pacific Journal of Accounting & Economics 14 (2007) 161–192
178
Table 4
Regression Analysis of Residual Audit Fees Following SOX
Estimation period Pre 7/25/2002 Pre 4/1/2003
Regression period Post 7/25/2002 Post 4/1/2003
Indep. Var.2 Coeff. Sig.1 Coeff. Sig.1 Coeff. Sig.1 Coeff. Sig.1
Regression # 1 2 3 4
Intercept -0.964 *** -0.954 *** -1.290 *** -1.278 ***Litig 0.044 *** 0.041 ** 0.139 *** 0.054 **NegEPS 0.116 *** 0.117 *** 0.101 *** 0.139 ***FYRDec31 0.092 *** 0.093 *** 0.039 ns 0.101 ***Days2Sign 0.044 + 0.043 + 0.159 *** 0.039 nsLog(Mcap) 0.114 *** 0.114 *** 0.056 *** 0.158 ***SOXB 0.168 *** 0.156 ***Dismiss -0.106 *** -0.110 ***Resign 0.285 *** 0.149 +AudChOther 0.064 ++ 0.015 nsAdjusted R2 11.80% 12.40% 10.28% 10.56%Number ofobservations
13,124 13,124 8,398 8,398
Notes1 Tests of significance of coefficients: ***=less than .0001; ** =less than .001, *=less than .01, + =less than
.05, ++ =less than .10, and ns=not significant. Tests are relative to a zero regression coefficient.2 The dependent variable for each regression is residual audit fees (log of audit fees less predicted log of audit
fees), ε̂it, where predicted log of audit fees is based on the regression coefficients estimated in table 3 (columns 2 and 3) using the actual values of the independent variables in the post April 1, 2003 or post July 25, 2002 periods. SOXB is a unit variable that equals one for observations after April 1, 2003 and zero otherwise. See table 3 for definitions of the other independent variables.
The second regression in table 4 includes the auditor realignment variables as they, too, may capture changes in audit risk and effort. These regression results support hypothesis H3 (in the alternative form). The Dismiss variable is significantly negative (γ31=-0.106), consistent with the view that incoming auditors following a dismissal in the post-SOX period utilize fewer resources to conduct the audit, including possible fee discounting. Conversely, the Resign variable is significantly positive (γ32=0.285), which supports the view that incoming auditors in the post-SOX period increase their fees to compensate for the additional audit risk following a resignation.
As a sensitivity check, we run regressions 3 and 4, which are based on residual audit fees from model 1 when the model 1 estimation period includes the SOXA sub-period. As such, these (model 2) regressions control for both audit fee determinants in general and the effects on audit fees, if any, of the Act’s provisions in the SOXA sub-period. The results are qualitatively unchanged when the residual audit fee regressions are based on the later period only. For example, regression 4 documents positive and significant coefficients for Litig (γ11=0.054) and NegEPS (γ12=0.139) (audit risk proxies), positive
05_Griffin Lont.indd 178 8/29/07 11:00:08 AM

Paul A. Griffin and David H. Lont Asia-Pacific Journal of Accounting & Economics 14 (2007) 161–192
179
and significant coefficients for FYRDec31 (γ21=0.101) and Log(MCap) (γ23=0.158) (audit effort proxies), and negative and positive coefficients for dismissals (γ31= -0.110) and resignations (γ32=0.149), respectively. In other words, when we focus only on residual audit fees from April 1, 2003 (the SOXB sub-period) conditional on an estimation period that includes the SOXA sub-period, we still find results that support hypotheses H1, H2, and H3. This may be a more conservative test of the hypotheses in that the impact of earlier provisions such as section 302 on certification are controlled for by including the effects of SOXA in the estimation period prior to predicting residual audit fees.
4.3. Model 3
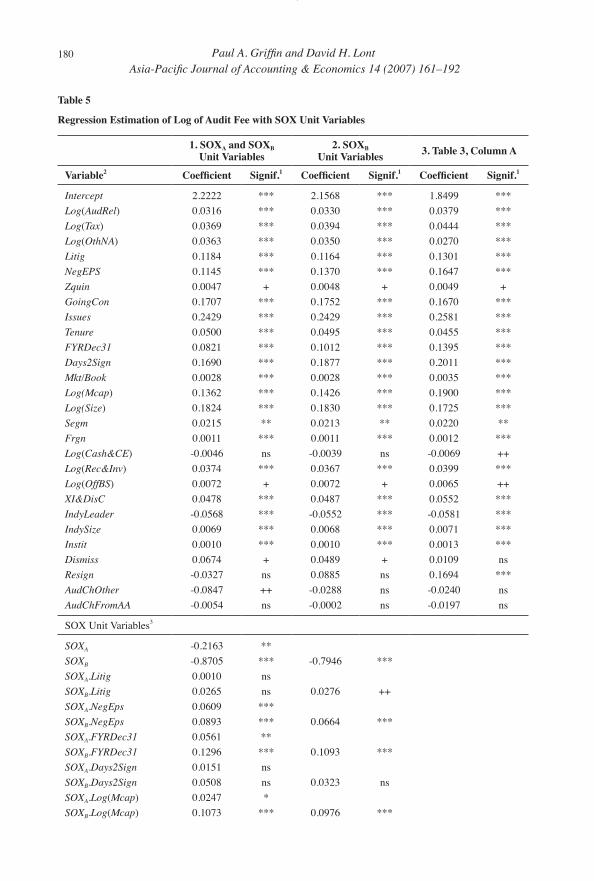
The third phase of the analysis examines differences in the impact of SOX on audit fees conditional on the timing of the different provisions, in particular, the earlier section 302 provisions and the later section 404 provisions. The results from model 3 are summarized in table 5. As before, the fiscal periods are partitioned following the passage of the Act into SOXA and SOXB sub-periods. Model 3 is then used to test whether the effects of the audit risk and audit effort proxies on residual audit fees differ on the basis of the two sub-periods. Regression 1 includes unit variables for SOXA and SOXB and interacts these variables with each of the audit risk and audit effort proxies. Regression 2 includes unit variables for SOXB only. Table 5 reports, also, the results of model 1 from table 3 for comparison purposes since model 1 and model 3 differ only in that model 1 excludes the SOX interaction variables.
The first regression in table 5 (regression 1) shows significant incremental effects for audit risk proxy SOXANegEPS (η12=0.061) and SOXBNegEPS (η12=0.089) but not for SOXALitig (η11=0.001) or SOXBLitig (η11=0.027). This regression also shows significant incremental effects for the audit effort proxies, SOXAFYRDec31 (η21=0.056) and SOXB FYRDec31 (η21=0.130), and SOXALog(MCap) (η23=0.025) and SOXBLog(MCap) (η23=0.107). Predictably, incrementally significant coefficients are also documented for SOXAResign (η32=0.202), SOXBResign (η32=0.229), and SOXBDismiss (η31=-0.117) but not for SOXADismiss (η31=-0.045). Regression 2 shows similar results for the SOXB coefficients. Both audit risk proxies are positive and significant (η11=0.028 and η12=0.066) and two of the three audit effort proxies are positive and significant (η21=0.109 and η23=0.098). Also, SOXBDismiss is significant (η31=-0.101), but SOXBResign is not significant (η32=0.111). Finally, it is observed that the coefficients for regressions 1 and 2 are qualitatively similar to those of regression 3. In other words, the addition of the SOX variables in model 3 has only limited effect on the estimation of the control variable coefficients, presumably because of an absence of significant collinearity among the SOX and control variables (see, also, section 4.5).
05_Griffin Lont.indd 179 8/29/07 11:00:08 AM
Paul A. Griffin and David H. Lont Asia-Pacific Journal of Accounting & Economics 14 (2007) 161–192
180
Table 5
Regression Estimation of Log of Audit Fee with SOX Unit Variables
1. SOXA and SOXBUnit Variables
2. SOXBUnit Variables 3. Table 3, Column A
Variable2 Coefficient Signif.1 Coefficient Signif.1 Coefficient Signif.1
Intercept 2.2222 *** 2.1568 *** 1.8499 ***Log(AudRel) 0.0316 *** 0.0330 *** 0.0379 ***Log(Tax) 0.0369 *** 0.0394 *** 0.0444 ***Log(OthNA) 0.0363 *** 0.0350 *** 0.0270 ***Litig 0.1184 *** 0.1164 *** 0.1301 ***NegEPS 0.1145 *** 0.1370 *** 0.1647 ***Zquin 0.0047 + 0.0048 + 0.0049 +GoingCon 0.1707 *** 0.1752 *** 0.1670 ***Issues 0.2429 *** 0.2429 *** 0.2581 ***Tenure 0.0500 *** 0.0495 *** 0.0455 ***FYRDec31 0.0821 *** 0.1012 *** 0.1395 ***Days2Sign 0.1690 *** 0.1877 *** 0.2011 ***Mkt/Book 0.0028 *** 0.0028 *** 0.0035 ***Log(Mcap) 0.1362 *** 0.1426 *** 0.1900 ***Log(Size) 0.1824 *** 0.1830 *** 0.1725 ***Segm 0.0215 ** 0.0213 ** 0.0220 **Frgn 0.0011 *** 0.0011 *** 0.0012 ***Log(Cash&CE) -0.0046 ns -0.0039 ns -0.0069 ++Log(Rec&Inv) 0.0374 *** 0.0367 *** 0.0399 ***Log(OffBS) 0.0072 + 0.0072 + 0.0065 ++XI&DisC 0.0478 *** 0.0487 *** 0.0552 ***IndyLeader -0.0568 *** -0.0552 *** -0.0581 ***IndySize 0.0069 *** 0.0068 *** 0.0071 ***Instit 0.0010 *** 0.0010 *** 0.0013 ***Dismiss 0.0674 + 0.0489 + 0.0109 nsResign -0.0327 ns 0.0885 ns 0.1694 ***AudChOther -0.0847 ++ -0.0288 ns -0.0240 nsAudChFromAA -0.0054 ns -0.0002 ns -0.0197 ns
SOX Unit Variables3
SOXA -0.2163 **SOXB -0.8705 *** -0.7946 ***SOXA.Litig 0.0010 nsSOXB.Litig 0.0265 ns 0.0276 ++SOXA.NegEps 0.0609 ***SOXB.NegEps 0.0893 *** 0.0664 ***SOXA.FYRDec31 0.0561 **SOXB.FYRDec31 0.1296 *** 0.1093 ***SOXA.Days2Sign 0.0151 nsSOXB.Days2Sign 0.0508 ns 0.0323 nsSOXA.Log(Mcap) 0.0247 *SOXB.Log(Mcap) 0.1073 *** 0.0976 ***
05_Griffin Lont.indd 180 8/29/07 11:00:09 AM
Paul A. Griffin and David H. Lont Asia-Pacific Journal of Accounting & Economics 14 (2007) 161–192
181
SOXA.Dismiss -0.0454 nsSOXA.Resign 0.2019 ++SOXA.AudChOther 0.0882 nsSOXB.Dismiss -0.1170 ** -0.1009 ***SOXB.Resign 0.2291 + 0.1111 nsSOXB.AudChOther 0.0632 ns 0.0077 nsAdjusted R2 66.66% 66.54% 65.10%No. of observations 20,731 20,731 20,731
Notes1 Tests of significance of coefficients: ***=less than .0001; ** =less than .001, *=less than .01, + =less than
.05, ++ =less than .10, and ns=not significant. Tests are relative to a zero regression coefficient.2 Audit fee data are for Big 4/5 non-auditor change companies and Big 4/5 lateral auditor change companies
only. The dependent variable is log of audit fee.3 SOXA is a unit variable that equals one for observations after July 25, 2002 and before April 1, 2003,
otherwise zero. SOXB is a dummy variable that equals one for observations after April 1, 2003, otherwise zero. See table 3 for definitions of the other independent variables.
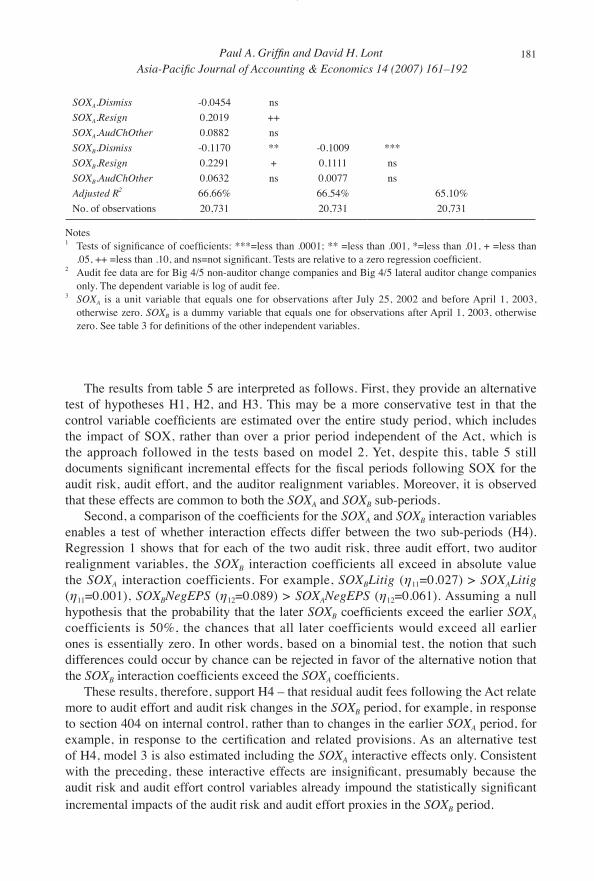
The results from table 5 are interpreted as follows. First, they provide an alternative test of hypotheses H1, H2, and H3. This may be a more conservative test in that the control variable coefficients are estimated over the entire study period, which includes the impact of SOX, rather than over a prior period independent of the Act, which is the approach followed in the tests based on model 2. Yet, despite this, table 5 still documents significant incremental effects for the fiscal periods following SOX for the audit risk, audit effort, and the auditor realignment variables. Moreover, it is observed that these effects are common to both the SOXA and SOXB sub-periods.
Second, a comparison of the coefficients for the SOXA and SOXB interaction variables enables a test of whether interaction effects differ between the two sub-periods (H4). Regression 1 shows that for each of the two audit risk, three audit effort, two auditor realignment variables, the SOXB interaction coefficients all exceed in absolute value the SOXA interaction coefficients. For example, SOXBLitig (η11=0.027) > SOXALitig (η11=0.001), SOXBNegEPS (η12=0.089) > SOXANegEPS (η12=0.061). Assuming a null hypothesis that the probability that the later SOXB coefficients exceed the earlier SOXA coefficients is 50%, the chances that all later coefficients would exceed all earlier ones is essentially zero. In other words, based on a binomial test, the notion that such differences could occur by chance can be rejected in favor of the alternative notion that the SOXB interaction coefficients exceed the SOXA coefficients.
These results, therefore, support H4 – that residual audit fees following the Act relate more to audit effort and audit risk changes in the SOXB period, for example, in response to section 404 on internal control, rather than to changes in the earlier SOXA period, for example, in response to the certification and related provisions. As an alternative test of H4, model 3 is also estimated including the SOXA interactive effects only. Consistent with the preceding, these interactive effects are insignificant, presumably because the audit risk and audit effort control variables already impound the statistically significant incremental impacts of the audit risk and audit effort proxies in the SOXB period.
05_Griffin Lont.indd 181 8/29/07 11:00:10 AM

Paul A. Griffin and David H. Lont Asia-Pacific Journal of Accounting & Economics 14 (2007) 161–192
182
4.4. Dollar Impact of Residual Audit Fees
The results thus far, in logarithmic form, may not be readily interpretable. This section calculates the dollar equivalent of the log of residual audit fees and compares this amount with pre-SOX audit fees, based on average audit fees in the fiscal year prior to residual fees. Mean and median residual audit fees (over the same set of companies) are calculated for fiscal year ends from (a) the passage of SOX to December 31, 2002, 2003, and 2004 and (b) April 1, 2003 to December 31, 2003 and 2004 (the SOXB sub-period only). These residual amounts are compared with the mean and median actual change in audit fees from fiscal years 2001 or 2002 to 2004. These latter calculations provide a benchmark to assess how much of the actual change in audit fees following SOX is a residual based on an audit fee model.
Table 6 summarizes the results. Panel A reports a mean residual audit fee per company, from July 25, 2002 (SOX passage) to December 31, 2004, of US$1,127,709, of which US$566,343 occurs prior to 2004. PWC (Price Waterhouse Coopers) shows the largest mean and median residuals of US$1,600,341 and US$403,677, respectively. These are well in excess of the other Big 4 firms. The medians are less because of a small number of outlier companies with large fees. Similar results are observed when the residual fees are from April 1, 2003 (the SOXB period). Panels C and D report that the mean and median residual fees to December 31, 2004 are US$967,195 and US$275,763, respectively.
Table 6Mean and Median Residual Audit Fees Following SOX, in Dollars
Fiscal Year Andersen Deloitte &Touche
Ernst &Young KPMG PWC Grand
Mean
A: Mean Unexpected Increase in Audit Fee, in dollars, from July 25, 20022
2002 289,962 477,267 366,163 351,883 572,747 431,3592003 na 586,760 467,464 449,621 765,303 566,3432004 na 1,178,257 881,069 865,627 1,600,341 1,127,709Pre-SOX base1 583,680 788,444 555,465 531,750 928,411 700,515Ratio of 2004 to Pre-SOX
na 1.49 1.59 1.63 1.72 1.61
Ratio of Actual 2004-2001 to 2001
na 1.39 1.88 1.93 1.50 1.71
B: Median Unexpected Increase in Audit Fee, in dollars, from July 25, 20022
2002 (13,454) 41,311 66,822 25,464 67,657 46,3942003 na 77,343 122,759 57,919 114,244 97,6482004 na 287,394 358,875 220,929 403,677 319,547Pre-SOX base1 245,000 257,650 250,630 201,000 295,000 250,000Ratio of 2004 to Pre-SOX
na 1.12 1.43 1.10 1.37 1.28
Ratio of Actual 2004-2001 to 2001
na 1.70 2.02 2.24 2.16 2.00
05_Griffin Lont.indd 182 8/29/07 11:00:10 AM

Paul A. Griffin and David H. Lont Asia-Pacific Journal of Accounting & Economics 14 (2007) 161–192
183
C: Mean Unexpected Increase in Audit Fee, in dollars, from April 1, 20033
2003 na 590,923 434,706 427,918 750,295 549,2032004 na 1,013,663 718,827 710,650 1,440,043 967,195Pre-SOX base1 na 1,037,369 841,830 775,730 1,125,642 940,533Ratio of 2004 to Pre-SOX
na 0.98 0.85 0.92 1.28 1.03
Ratio of Actual 2004-2002 to 2002
na 0.81 0.83 0.91 1.01 0.93
D: Median Unexpected Increase in Audit Fee, in dollars, from April 1, 20033
2003 na 59,024 95,232 39,448 93,573 76,4202004 na 247,748 311,349 192,833 354,600 275,763Pre-SOX base1 na 352,000 347,000 262,300 366,000 335,000Ratio of 2004 to Pre-SOX
na 0.70 0.90 0.74 0.97 0.82
Ratio of Actual 2004-2002 to 2002
na 1.01 1.19 1.56 1.42 1.24
Notes 1 Pre-SOX base is the mean/median audit fees calculated over 12 months prior to July 25, 2002 or April 1,
2003. Audit fee data are for Big 4/5 non-auditor change and Big 4/5 lateral auditor change companies only.2 Residual audit fees based on regression coefficients estimated over January 1, 2000 to July 25, 2002 (table 3,
column 3). Statistics based on firms with common audit fee observations in 2001 through 2004.3 Residual audit fees based on regression coefficients estimated over January 1, 2000 to April 1, 2003 (table 3,
column 2). Statistics based on firms with common audit fee observations in 2002 through 2004.
These data also allow a comparison of the mean (median) residual fees in the later SOXB period. For example, whereas the mean and median fee residuals in such period are US$967,195 and US$275,763, respectively, the mean and median residuals in the earlier SOXA period are US$160,514 (US$1,127,709 – US$967,195) (panels A and C) and US$44,184 (US$319,547 – US$275,363) (panels B and D). The residual audit fees earned in the earlier period are, thus, clearly much less that those earned in the later period.
Finally, table 6 reports the ratio of the 2004 mean (median) residual fee relative to a pre-SOX base and the ratio of actual mean (median) fee audit fee increase relative to actual 2001. This latter calculation requires no prediction of audit fees in the absence of the Act. The following is observed. Panels A and C show mean residual audit fees of 1.61 (1.03) times the pre-SOX base versus an actual increase in mean fees of 1.71 (0.93) times 2001. Panel B, on the other hand, shows median residual audit fees of 1.28 (0.82) times the pre-SOX base versus an actual increase in median fees of 2.00 (1.24) times 2001 fees. Hence, based on mean audit fees, the dollar increases in audit fees from 2001 are not substantially different from dollar equivalent residuals from the models. On the other hand, the dollar equivalent median residuals are substantially smaller, in part, because they reduce the effects of outliers from the analysis. This suggests that while the increases in mean dollar-equivalent audit fees from the regressions are similar to the actual fee increases, these amounts appear to be influenced by a few large audit fee observations that skew the results. This is not the case with the logarithmic regressions, however, on which we base our tests of hypotheses.
05_Griffin Lont.indd 183 8/29/07 11:00:10 AM
Paul A. Griffin and David H. Lont Asia-Pacific Journal of Accounting & Economics 14 (2007) 161–192
184
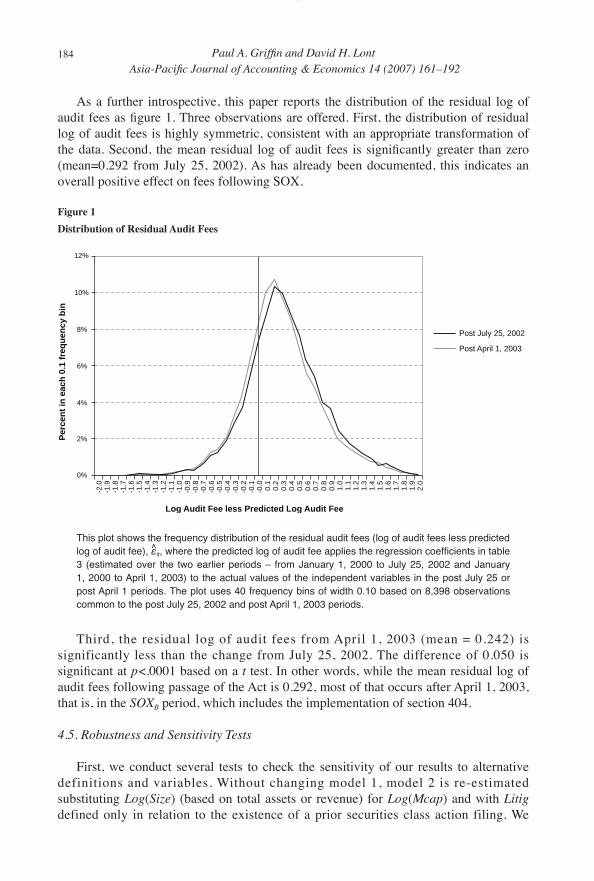
As a further introspective, this paper reports the distribution of the residual log of audit fees as figure 1. Three observations are offered. First, the distribution of residual log of audit fees is highly symmetric, consistent with an appropriate transformation of the data. Second, the mean residual log of audit fees is significantly greater than zero (mean=0.292 from July 25, 2002). As has already been documented, this indicates an overall positive effect on fees following SOX.
Figure 1Distribution of Residual Audit Fees
-2.0
-1.9
-1.8
-1.7
-1.6
-1.5
-1.4
-1.3
-1.2
-1.1
-1.0
-0.9
-0.8
-0.7
-0.6
-0.5
-0.4
-0.3
-0.2
-0.1
-0.0
0.1
0.2
0.3
0.4
0.5
0.6
0.7
0.8
0.9
1.0
1.1
1.2
1.3
1.4
1.5
1.6
1.7
1.8
1.9
2.0
12%
10%
8%
6%
4%
2%
0%
Post July 25, 2002
Post April 1, 2003
Log Audit Fee less Predicted Log Audit Fee
Per
cen
t in
eac
h 0
.1 f
req
uen
cy b
in
This plot shows the frequency distribution of the residual audit fees (log of audit fees less predicted log of audit fee), ε̂it, where the predicted log of audit fee applies the regression coefficients in table 3 (estimated over the two earlier periods – from January 1, 2000 to July 25, 2002 and January 1, 2000 to April 1, 2003) to the actual values of the independent variables in the post July 25 or post April 1 periods. The plot uses 40 frequency bins of width 0.10 based on 8,398 observations common to the post July 25, 2002 and post April 1, 2003 periods.
Third, the residual log of audit fees from April 1, 2003 (mean = 0.242) is significantly less than the change from July 25, 2002. The difference of 0.050 is significant at p<.0001 based on a t test. In other words, while the mean residual log of audit fees following passage of the Act is 0.292, most of that occurs after April 1, 2003, that is, in the SOXB period, which includes the implementation of section 404.
4.5. Robustness and Sensitivity Tests
First, we conduct several tests to check the sensitivity of our results to alternative definitions and variables. Without changing model 1, model 2 is re-estimated substituting Log(Size) (based on total assets or revenue) for Log(Mcap) and with Litig defined only in relation to the existence of a prior securities class action filing. We
05_Griffin Lont.indd 184 8/29/07 11:00:11 AM

Paul A. Griffin and David H. Lont Asia-Pacific Journal of Accounting & Economics 14 (2007) 161–192
185
also move the cut-off date for the SOXA and SOXB sub-periods to June 5, 2003 (date of SEC Release 33-8238). The signs of the audit risk, effort, and realignment coefficients in table 4 do not change appreciably when we make these changes. The variables and definitions applied in table 4 exhibit a modestly higher explanatory power than the alternatives.
Model 1 is also re-estimated excluding those variables whose sign and significance are not consistent across the three regression periods as shown in table 3 (e.g., Segm, Frgn, Insit, Mkt/Book), thereby re-estimating residual audit fees following SOX, that is, the dependent variable in model 2. The signs of the audit risk, effort, and realignment coefficients in table 4 do not change qualitatively when a reduced-form model is used. We are cautious, though, about removing too many variables from model 1 as this could transfer to residual audit fees the impact of certain “normal” audit risk or audit effort variables that might mistakenly be interpreted to reflect incremental post-SOX audit risk or audit effort. For example, if the auditor realignment variables were to be excluded from model 1, then the coefficients for such in model 2 would capture both pre- and post-SOX effects. Model 2 is also estimated based on positive residual audit fees only, in light of the possibility that some firms experiencing negative residual fees may be affected by other (unknown) factors correlated with the independent variables in the model, and this could bias our results. These unreported results are not appreciably different from those in table 4, which are based on positive and negative residual audit fees.
Second, as a check on reliability, model 2 is estimated over an earlier, pre-SOX period – from July 26, 2001 to July 25, 2002. If the effects of SOX vary positively with additional litigation risk and audit effort in the post-SOX period, as is hypothesized in H1 and H2, then those variables should be less positive or insignificant when model 2 is applied to a pre-SOX period. To test this notion, model 1 is estimated based on audit fee data through July 25, 2001. Audit fees are then predicted for the period July 26, 2001 to July 25, 2002 (the pre-SOX period) conditional on the actual values of the independent variables. Unreported results indicate that the effects of our audit effort and litigation proxies are both smaller and/or insignificant in the pre-SOX period. This lends credence to the use of our audit risk and audit effort proxies.
Third, as a potential additional factor to explain residual audit fees following SOX, it is examined whether audit fee effort might be moderated in those situations where the audit firm receives additional compensation from audit-related fees. This is examined in two ways. First, we partition the sample on the basis of high and low audit-related fees in the post-SOX period and estimate model 2 for each partition. It is found that the audit effort coefficients in model 2 are qualitatively unchanged for both the high and low partitions. Second, model 2 is estimated with log of audit-related fees in the post-SOX period as an additional independent variable. This version of Model 2 is used to test whether the audit effort coefficients in model 2 are less positive or insignificant to the extent that residual audit fees are explained more by audit-related fees and less by audit effort and/or litigation risk factors. It is found that the audit effort and litigation risk coefficients in model 2 including log of audit-related fee as an additional variable are qualitatively the same as those reported in table 4. These results suggest that additional audit-related fees paid to an audit firm in the post-SOX period (e.g., for internal control
05_Griffin Lont.indd 185 8/29/07 11:00:11 AM

Paul A. Griffin and David H. Lont Asia-Pacific Journal of Accounting & Economics 14 (2007) 161–192
186
design) do not change the reliability of our findings regarding the influence of audit effort and litigation risk as two significant drivers of residual audit fees following the passage of SOX.
Fourth, this paper evaluates the possibility that collinearity among the independent variables in models 1 and 3 may threaten the tests of hypotheses. The steps outlined in Judge et al. (1988) and others are followed to examine such possibility. As expected, several of the variables in those models (e.g., firm size and market capitalization) are highly correlated. However, none of the individual regression coefficients in models 1 or 3 is of the opposite sign from what is predicted or unexpectedly insignificant, which are two indications of non-substantial collinearity. A more formal test is also conducted by calculating the variance inflation factor associated with each of the highly correlated independent variables in models 1 or 3 (where corr.(xi,xj) >.4). According to Neter et al. (1990) and others, a variance inflation factor of greater than ten is evidence of substantial collinearity. Unreported tests reveal a maximum variance inflation factor of less than three.
Finally, it is noted that the regression models thus far use OLS to estimate the coefficients, which assumes that the off-diagonal covariances are zero. This may not be literally true, however, because of industry factors and pooling over time. This paper, therefore, reviews the results when the coefficients in tables 3, 4, and 5 are estimated using generalized least squares (GLS software from SAS Institute, Inc.). The results are qualitatively unchanged, in that the same audit risk, effort, and realignment variables that are significant in model 2 under OLS estimation are also significant under GLS estimation.
5. Summary and Conclusions
This paper examines the impact of the passage of SOX on audit fees controlling for those determinants that could be reasonably expected to influence fees in the absence of the Act. The sample includes all companies audited by a Big 4/5 auditor over 2000-2004. While, not surprisingly, the study finds that audit fees have increased following SOX, this paper quantifies these amounts and relates them to the earlier and later provisions of the Act with controls for other factors. For example, the study documents a mean residual audit fee in response to the earlier section 302 certification and disclosure provisions of US$160,514 per company. This pales by comparison to a higher mean residual audit fee associated with the later section 404 internal control provisions of US$967,195 per company. This paper also tests and documents significant positive relations between residual audit fees following SOX and proxies for incremental audit risk and audit effort, two key factors that our theory predicts explain residual audit fees. Auditor realignments following SOX further explain residual audit fees. Lastly, it is documented that residual audit fees are more associated with incremental audit risk and audit effort in the later (internal control) period rather than the earlier (certification and disclosure) period.
This paper contributes to the literature by testing hypotheses about why audit fees have increased in response to SOX. The results suggest two key reasons – first, that
05_Griffin Lont.indd 186 8/29/07 11:00:11 AM

Paul A. Griffin and David H. Lont Asia-Pacific Journal of Accounting & Economics 14 (2007) 161–192
187
changes in audit risk thresholds following SOX prompted auditors to increase audit fees to compensate for higher expected losses. Such audit fee increases are consistent with risk sharing and price protection on the part of the auditor in response to the additional risk imposed by SOX for faulty financial statements and deficient controls. The finding that residual audit fees increase in association with higher rates of auditor resignation is a further manifestation of this view. The theory and results support a second reason for an increase in audit fees following the Act – that SOX simply required auditors to apply more time and resources to examine and evaluate a costlier accounting and disclosure system. Without risk sharing, shareholders bear these costs directly as a loss of equity value.
While it is shown that both factors significantly explain residual audit fees, this paper is unable to discern quantitatively whether one factor dominates the other. However, both factors appear to drive the overall fee increases, and these increases, of course, have not been inconsequential. For example, relative to 2001 audit fees, it is calculated that companies in our sample paid their auditors from 2002 to 2004 aggregate additional audit fees of slightly more than US$8 billion. Importantly, also, most of this, as these models show, cannot be readily explained by variables that would have increased fees in those years in the counterfactual situation, that is, in the absence of the Act. While changes in audit risk and effort and auditor realignments suggest key reasons for the fee increases, and these are consistent with our theory, an examination of other possible considerations must be left to future research. For example, auditing fees should diminish in the future if the higher fees observed reflect in part the cost of reviewing and documenting internal controls for the first time.8 Auditing fees could also diminish because more auditing may lead to better governance, which in turn may induce a decrease in audit and control risk. Finally, it is cautioned that this paper is unable to discern the exact counterfactual situation for empirical analysis other than by the use of models to predict audit fees but for the Act. Model structure and coefficients based on data prior to SOX, for example, may be inappropriate for the later periods and, if based on the entire period, run the risk of over-fitting, thereby blurring the effects to be identified at the outset.
Appendix 1
Prior Research on Audit Fee Determinants in Model 1
# Determinant inModel 11
Exp.Sign Examples of Prior Research.2
1 Log(AudRel) + Simunic (1984), Palmrose (1986b), Turpen (1990), Davis et al. (1993), Parkash and Venable (1993), O’Keefe et al. (1994), Frankel et al. (2002), Whisenant et al. (2003). Some are total non-audit fees; others split between tax and other non-audit fees.
2 Log(Tax) + Palmrose (1986b), Davis et al. (1993), O’Keefe et al. (1994).
8 Preliminary survey data suggest a drop in fees from 2004 to 2005 of between 13% and 30-43% (Committee on Capital Markets Regulation 2006).
05_Griffin Lont.indd 187 8/29/07 11:00:11 AM

Paul A. Griffin and David H. Lont Asia-Pacific Journal of Accounting & Economics 14 (2007) 161–192
188
3 Log(OthNA) + Hoitash et al. (2005).4 Litig + Lys and Watts (1994), Simunic and Stein (1996), Gul and Tsui (1997).
Litig (prior securities litigation) not studied separately.5 NegEPS + Simunic (1980), Francis (1984), Craswell and Francis (1999),
Whisenant et al. (2003), Hay et al. (2006) (39 studies).6 Zquin + Stice (1991), Whisenant et al. (2003).7 GoingCon + Simunic (1980), Palmrose (1986), Francis and Simon (1987), Simon
and Francis (1988), Turpen (1990), Simunic and Stein (1996), Hay et al. (2006) (46 studies).
8 Issues + Hertz (2006), Raghunandan and Rama (2006).9 Tenure Simunic (1980), Beck et al. (1988), Stice (1991), Copley et al. (1994).10 FYRDec31 + Palmrose (1986a), Palmrose (1989), Craswell and Francis (1999),
Francis and Wang (2005), Hay et al. (2006) (32 studies).11 Days2Sign + Gul (1999), Whisenant et al. (2003), Ettredge et al. (2006).12 Mkt/Book + Whisenant et al. (2003).13 Log(Mcap) + Stice (1991).14 Log(Size) + Simunic (1980), Francis (1984), Palmrose (1986a), Hay et al. (2006)
(87 studies).15 Segm + Simunic (1980), Francis and Simon (1987), Hay et al. (2006)
(7 studies).16 Frgn + Simunic (1980), Francis and Simon (1987), Craswell et al. (1995).17 Log(Cash&CE) – Whisenant et al. (2003), Francis and Wang (2005) (liquidity
measures).18 Log(Rec&Inv) + Simunic (1980), Francis and Simon (1987), Hay et al. (2006)
(43 studies).19 Log(OffBS) + Not studied separately.20 XI&DisC + Whisenant et al. (2003).21 IndyLeader – Eichenseher and Danos (1981), Palmrose (1984), Craswell et al.
(1995), Asthana et al. (2004).22 IndySize + Market share proxy, Asthana et al. (2004).23 Instit + Whisenant et al. (2003), Asthana et al. (2004).24.1 Dismiss – Ettredge and Greenberg (1990), Turpen (1990).24.2 Resign + Sankaraguruswamy and Whisenant (2004).24.3 AudChOther ? Not studied separately.24.4 AudChFromAA ? Asthana et al. (2004).
Notes1 Table 3 states the definitions of these variables.2 This appendix identifies selected studies that analyze and offer evidence in support of the predicted relation
between the audit fee determinants in model 1 and the log of audit fees. We recognize more than 25 years of literature on the subject. We also recognize that the particular empirical definitions used in the earlier literature may vary from those used in model 1. Hay et al. (2006) use a meta analysis to identify variables common to this literature. Other reviews include Yardley et al. (1992), Turpen (1995), and Simunic and Stein (1996).
05_Griffin Lont.indd 188 8/29/07 11:00:12 AM

Paul A. Griffin and David H. Lont Asia-Pacific Journal of Accounting & Economics 14 (2007) 161–192
189
References
Asthana, S., S. Balsam, and S. Kim, 2004, “The effect of Enron, Andersen, and Sarbanes-Oxley on the market for audit services,” http://ssrn.com/abstract=560963, June.
Beck, P., T. Frecka, and I. Solomon, 1988, “An empirical analysis of the relationship between MAS involvement and auditor tenure: Implications for auditor independence,” Journal of Accounting Literature 7, 65–84.
Brambor, T., W. Clark, and M. Golder, 2006, “Understanding interaction models: Improving empirical analyses,” Political Analysis 14, 63-82.
Butler, H., and L. Ribstein, 2006, The Sarbanes-Oxley debacle: How to fix it and what we’ve learned, American Enterprise Institute, March 13.
Chung, H., and S. Kallapur, 2003, “Client importance, non-audit services, and abnormal accruals,” The Accounting Review 78(4), 931-955.
Committee on Capital Markets Regulation, 2006, Interim Report of the Committee on Capital Markets Regulation, Washington D.C., November 30.
Committee on Financial Services, 2005, The Impact of the Sarbanes-Oxley Act, Transcript of the Hearing Before the Committee on Financial Services, U. S. House of Representatives, April 21.
Copley, P., M. Doucet, and K. Gaver, 1994, “A simultaneous equations analysis of quality control review outcomes and engagement fees for audits of recipients of federal financial assistance,” The Accounting Review 69, 244-256.
Craswell, A., and J. Francis, 1999, “Pricing initial audit engagements: A test of competing theories,” The Accounting Review 74, 201-216.
Craswell, A., J. Francis, and S. Taylor, 1995, “Auditor brand name reputations and industry specializations,” Journal of Accounting & Economics 20, 297-322.
Davis, L., D. Riechiute, and G. Trompeter, 1993, “Audit effort, audit fees, and the provision of nonaudit services to audit clients,” The Accounting Review 68, 135-150.
DeFond, M., M. Ettredge, and D. Smith, 1997, “An investigation of auditor resignations,” Research in Accounting Regulation 11, 25-46.
Eichenseher, J., and P. Danos, 1981, “The analysis of industry-specific auditorc oncentration: Towards an explanatory model,” The Accounting Review 56, 479-492
Ettredge, M., and R. Greenberg, 1990, “Determinants of fee cutting on initial audit engagements,” Journal of Accounting Research 28, 198-210.
Ettredge, M., C. Li, and S. Sholtz, 2006, Auditor fees and auditor realignments in the SOX era, Working paper, University of Kansas, January.
Ettredge, M., J. Heintz, C. Li, and S. Scholz, 2006, Auditor realignments accompanying implementation of SOX 404 reporting requirements, September, Available at ssrn.com/abstract=874836.
Francis, J., 1984, “The effect of audit firm size on audit prices: A study of the Australian market,” Journal of Accounting and Economics 6, 133-151.
Francis, J., and D. T. Simon, 1987, “A test of audit pricing in the small-client segment of the U.S. audit market,” The Accounting Review 62, 145-157.
05_Griffin Lont.indd 189 8/29/07 11:00:12 AM

Paul A. Griffin and David H. Lont Asia-Pacific Journal of Accounting & Economics 14 (2007) 161–192
190
Francis, J., and D. Wang, 2005, “Impact of the SEC’s public fee disclosure requirement on subsequent period fees and implications for market efficiency,” Auditing: A Journal of Practice & Theory 24, 45-160.
Frankel, R., M. Johnson, and K. Nelson, 2002, “The relation between auditors’ fees for nonaudit services and earnings management,” The Accounting Review 77, 71-105.
Gul. F., 1999, “Audit prices, product differentiation and economic equilibrium,” Auditing: A Journal of Practice & Theory 18, 90-100.
Gul, F., and J. Tsui, 1997, “A test of the free cash flow and debt monitoring hypothesis: Evidence from audit pricing,” Journal of Accounting and Economics 24, 219-237.
Hay, D., W. Knechel, and N. Wong, 2006, “Audit fees: A meta-analysis of the effect of supply and demand attributes,” Contemporary Accounting Research 23, 141-191.
Hertz, K., 2006, The impact of SOX on auditor resignations and dismissals, Auditing Section 2006 Midyear Conference, Los Angeles, January 12-14.
Hoitash, R., A. Markelevich, and C. Barragato, 2005, Auditor fees, abnormal fees and audit quality before and after the Sarbanes-Oxley act, Working paper, Suffolk University, February.
Judge, G. G., R. Hill, W. Griffiths, H. Lütkepohl, and T. Lee, 1988, Introduction to the Theory and Practice of Econometrics (2nd ed.), New York, John Wiley & Sons.
Kinney, W., Z. Palmrose, and S. Scholz, 2004, “Auditor independence, non-audit services, and restatements: Was the U.S. Government right?” Journal of Accounting Research 42, 561-588.
Krishnan, J., and J. Krishnan, 1997, “Litigation risk and auditor resignations,” The Accounting Review 72, 539-560.
Larcker, D., and S. Richardson, 2004, “Fees paid to audit firms, accrual choices, and corporate governance,” Journal of Accounting Research 42, 625-658.
Lys, T., and R. Watts, 1994, “Lawsuits against auditors,” Journal of Accounting Research 32 (Supplement), 65-93.
Neter, J., W. Wasserman, and M. Kutner, 1990, Applied Linear Statistical Models (3rd ed.), Homewood, Ill., Richard D. Irwin.
O’Keefe. T., D. Simunic, and M. Stein, 1994, “The production of audit services: Evidence from a major public accounting firm,” Journal of Accounting Research 32, 241-261.
Palmrose Z., 1984, “The demand for quality-differentiated audit services in an agency cost setting: An empirical investigation”, Sixth Symposium on Auditing Research, edited by A. Abdel-khalik and I. Solomon, 229-252, Champaign, University of Illinois.
Palmrose Z., 1986a, “Audit Fees and Auditor Size: Further Evidence,” Journal of Accounting Research 24, 97-110.
Palmrose, Z., 1986b, “The effect of nonaudit services on the pricing of audit services: Further evidence,” Journal of Accounting Research 24, 405-411.
Palmrose, Z., 1989, “The relation of audit contract type to audit fees and hours,” The Accounting Review 64, 488-499.
Parkash, M., and C Venable, 1993, “Auditee incentives for auditor independence: The case of nonaudit services,” The Accounting Review 68, 113-133.
05_Griffin Lont.indd 190 8/29/07 11:00:12 AM

Paul A. Griffin and David H. Lont Asia-Pacific Journal of Accounting & Economics 14 (2007) 161–192
191
Public Company Accounting Oversight Board, 2004, Auditing Standard No. 2, An Audit of Internal Control Over Financial Reporting Performed in Conjunction With an Audit of Financial Statements, PCAOB Release 2004-001, March 9.
Raghunandan, K., and D. Rama, 2006, “SOX Section 404 material weakness disclosures and audit fees,” Auditing: A Journal of Practice & Theory 25, 99-115.
Sankaraguruswamy, S., and J. Whisenant, 2004, “An empirical analysis of voluntarily supplied client-auditor realignment reasons,” Auditing: A Journal of Practice & Theory 23, 107-121.
SEC Release 2002-37, 2002, SEC Announces Actions for Issuers In Light of Indictment of Arthur Andersen LLP, March 14.
SEC Release 33-8124, 2002, Certification of Disclosure in Companies’ Quarterly and Annual Reports, August 28, 2002 (effective date, August 29, 2002).
SEC Release 33-8176, 2003, Conditions for Use of Non-GAAP Financial Measures, January 22 (effective date, March 28, 2003).
SEC Release 33-8182, 2003, Disclosure in Management’s Discussion and Analysis about Off-Balance Sheet Arrangements and Aggregate Contractual Obligations, January 28 (effective date, April 7, 2003).
SEC Release 33-8183, 2003, Strengthening the Commission’s Requirements Regarding Auditor Independence, January 28 (effective date, May 6, 2003).
SEC Release 33-8238, 2003, Management’s Report on Internal Control over Financial Reporting and Certification of Disclosure in Exchange Act Periodic Reports, June 5 (effective date, August 14, 2003).
SEC Release 33-8392, 2004, Management’s Report on Internal Control over Financial Reporting and Certification of Disclosure in Exchange Act Periodic Reports, February 24 (effective date, August 14, 2004).
SEC Release 33-8400, 2004, Additional Form 8-K Disclosure Requirements and Acceleration of Filing Date, March 16 (effective date, August 14, 2004).
SEC Staff Accounting Bulletin No. 104, 2003, Revenue recognition, December 17.Seetharaman, A., F. Gul, and S. Lynn, 2002, “Litigation risk and audit fees: Evidence
from UK firms cross-listed on US markets,” Journal of Accounting and Economics 33, 91–115.
Simon, D., and J. Francis, 1988, “The effects of auditor change on audit fees: Tests of price cutting and price recovery,” The Accounting Review 63, 255-69.
Simunic, D., 1980, “The pricing of audit services: Theory and evidence,” Journal of Accounting Research 18, 161-190.
Simunic, D., 1984, “Auditing, consulting, and auditor independence,” Journal of Accounting Research 22, 679-702.
Simunic, D., and M. Stein, 1996, “The impact of litigation risk on audit pricing: A review of the economics and the evidence,” Auditing: A Journal of Practice & Theory 15, 119-134.
Statement on Auditing Standards No. 99, 2002, Consideration of Fraud in a Financial Statement Audit, American Institute of Certified Public Accountants, October.
Stice, J., 1991, “Using financial and market information to identify pre-engagement factors associated with lawsuits against auditors,” The Accounting Review 66, 516-33.
05_Griffin Lont.indd 191 8/29/07 11:00:12 AM
Paul A. Griffin and David H. Lont Asia-Pacific Journal of Accounting & Economics 14 (2007) 161–192
192
Turpen, R., 1990, “Differential pricing on auditors’ initial engagements: Further evidence,” Auditing: A Journal of Practice & Theory 9, 60-76.
Turpen, R., 1995, “Audit fees: What research tells us,” CPA Journal 65, 54-57.Whisenant, S., S. Sankaraguruswamy, and K. Raghunandan, 2003, “Evidence on the
joint determination of audit and non-audit fees,” Journal of Accounting Research 41, 721-744.
Yardley, J., L. Kauffman, D. Albrecht, and T. Cairney, 1992, “Supplier behavior in the audit market,” Journal of Accounting Literature 11, 151-185.
05_Griffin Lont.indd 192 8/29/07 11:00:12 AM