Embed Size (px)
Citation preview
Audit Fees, Asymmetric Information, and DefaultRisk: Evidence from the Syndicated Loan Market
Pinar UysalBoston College∗
Lewis W. GaulOffice of the Comptroller of the Currency †‡
Preliminary Draft
July 1, 2008
Abstract
In this paper, we examine whether greater auditing fees are associatedwith credit risk and asymmetric information problems caused by potentialfinancial statement errors. We suggest that an increase in the demand(supply) of auditing services, holding all else constant, is associated with adecrease (increase) in asymmetric information and credit risk. Using dataon auditing fees and terms of syndicated loans, we present evidence thatgreater audit fees are associated with syndicated loans with lower interestrates, shorter maturities, and more lenders, which we interpret as consistentwith auditing fees reducing credit risk and/or asymmetric information.
∗Department of Economics, Boston College, [email protected]†The opinions in this paper are those of the author and do not necessarily reflect those of the
Office of the Comptroller of the Currency or the Treasury Department.‡Please direct any comments to Lewis Gaul, Financial Economist, Office of the Comptroller
of the Currency, 250 E. St., SW. Washington DC 20219, [email protected] or (202)-874-4799.
1
1 Introduction
In the syndicated loan market, potential financial statement errors are an asym-
metric information problem. Meanwhile, several studies suggest that equilibrium
audit fees are associated with potential accounting error. Using data on audit fees
and the terms of syndicated loan, we examine whether audit fees are related to
asymmetric information problems in the syndicated loan market.
Potential accounting errors reduce the informativeness of firms’ financial state-
ments and create greater uncertainty for outside investors regarding firms’ true
characteristics. In addition, since firms’ insiders likely have better information re-
garding firms characteristics compared to what outside investors could infer from
even the most accurate financial statements, potential accounting errors exacer-
bate already existing asymmetric information problems between firms’ insiders and
outsiders. The Securities and Exchange Act of 1934 mandates that all publicly
traded firms have their financial statements audited by an independent external
auditor. These mandatory audits were intended to reduce asymmetric informa-
tion problems between firms’ insiders and outside parties by verifying that finan-
cial statements are accurate, in the sense that the statements adhere to generally
accepted accounting principles (GAAP).
While all publicly traded firms are required to have their financial statements
audited, firms are given discretion in determining the quality and quantity of
auditing services purchased. In other words, firms are free to determine their
individual demand for auditing services beyond a minimum.1 Firms may purchase
a greater amount of auditing services beyond the minimum amount to further
improve the accuracy of financial statements, providing the following benefits:
(1) further reducing asymmetric information problems with outside parties; and
(2) lowering the expected losses in future cash flows associated with potential
accounting errors.2 Hence, in a market for auditing services, where equilibrium
fees are determined by both supply and demand forces, an increase in equilibrium
auditing fees due to a shift in the demand curve for auditing services should be
associated with these two benefits.
1For example, when verifying the value of a firm’s assets, auditors may value a sample per-centage of firms’ assets, rather all of the assets; however, firms can request that auditors samplea larger percentage of assets in order to increase confidence in the valuation of assets stated intheir public financial statements.
2According to Graham et al. (2007) an accounting error lowers firms’ expected future cashflows because: (1) accounting errors generally increase profit expectations; (2) legal liabilitiesreduce future cash flows; (3) and damaged reputations cause customers and suppliers to contractwith the firm on less favorable terms.
2

While firms are free to choose their own demand for auditing services, auditing
firms are also allowed to individually choose their supply functions for auditing
services, which of course, are determined by the costs of supplying an audit. The
costs of supplying auditing services include both the costs of physically perform-
ing the audit and the expected future legal liabilities associated with an audit.
Typically, legal liability ensues when auditing clients experience financial distress
and their investors claim to have been mislead by errors in accounting statements.
Auditors can be held individually liable if plaintiffs, usually investors, can prove re-
liance on erroneous financial statements, and that auditors did not provide audits
consistent with generally accepted auditing standards (GAAS), and may suffer
joint liability with audited firms’ management if accounting records fail to adhere
to generally accepted accounting principles (GAAP) (Dye (1993)). Since expected
litigation costs are derived from the likelihood of an accounting error, an increase
in auditing fees due to a shift in the supply curve for auditing services should be
associated with an increase in asymmetric information and credit risk.
In the syndicated loan market, audited financial statements play a crucial role
by influencing the extent of asymmetric information problems (see Simons (1993),
Preece and Mullineaux (1996), Dennis and Mullineaux (2000), Jones, Lang, and
Nigro (2000), Lee and Mullineaux (2004), Panyagometh and Roberts (2002), Esty
and Megginson (2003), and Sufi (2007). In a typical syndicated loan, a lead bank
negotiates the non-price terms of a loan contract (loan amount, maturity length,
collateral, covenants, performance pricing etc.) with a borrower for an agreed
upon range of interest rates. Subsequently, the lead bank uses the negotiated loan
contract terms to solicit a group of participant lenders willing to provide a portion
of the loans funding. Because the syndicated loan market contains borrowers suf-
fering in varying degrees from asymmetric information problems, more accurate
financial statements, providing more precise signals regarding borrowers observ-
able risk characteristics, marginally mitigate asymmetric information problems
between borrowers and lenders. In addition, more accurate financial statements
reduce a borrowers’ default risk, as a result of the decline in the expected losses
in future cash flows due to accounting errors.
In addition, because lead banks origination activities are unobservable to out-
siders, lead banks face asymmetric information problems when soliciting partic-
pants. They face adverse selection problems because lead banks have incentives
to syndicate their riskiest loans, and moral hazard problems because lead banks
have reduced incentives to monitor borrowers ex-post performance because they do
3
not retain full ownership of syndicated loans. More accurate financial statements
help reveal borrowers types and alleviate the asymmetric information problems
between lead banks and potential participants, thereby facilitating formation of
loan syndicates.
In this paper, we examine whether variation in equilibrium auditing fees paid
by auditing firms are marginally related to asymmetric information problems
and/or default risk in the syndicated loan market. We base our examination on
the theory that an increase in auditing fees due to a shift in the demand (supply)
curve for auditing services is associated with a decrease (increase) in asymmet-
ric information problems and default risk. Our empirical tests are based on the
previous theoretical literature discussing the impact of asymmetric information
on debt contract terms, which predict that borrowers facing greater asymmetric
information problems and default risk receive loans: (1) with higher interest rates
(Diamond (1984)); (2) that are more difficult to sell (Leland and Pyle (1977),
Diamond (1984), Holmstrom and Tirole (1997); (3) and loans with shorter matu-
rities (Flannery (1986), Diamond (1991)). Combining data on audit fees from the
Audit Analytics database and data on the price and non-price terms of syndicated
loan contracts from the DEALSCAN database, we test the hypothesis that if an
increase in auditing fees is associated with an increase (decrease) in asymmetric
information and credit risk, then: (1) the interest spread on a syndicated loan
should be positively (negatively) associated with auditing fees; (2) the number
of lenders in a syndicate should be negatively (positively) associated with audit-
ing fees; and (3) the maturity length of a syndicated loan should be negatively
(positively) associated with auditing fees.
A complication with empirically testing our hypothesis is that equilibrium au-
diting fees may be endogenous to syndicated loan contract terms, correlated with
unobserved and omitted control variables, and/or measured with error. In order
to overcome these complications, we undertake our analysis with a generalized
method of moments (GMM) instrumental variable estimator. We use proxies for
the size of firms inventory and accounts receivables as instruments for auditing
fees. We choose these instruments because they are likely to be a primary deter-
minant of auditing fees since they are larger in size, easier to be manipulated and
more exposed to fraud than other types of transactions, and hence require more
attention (Simunic (1980)). In addition, we suggest these instruments are appro-
priate because accounts receivables and inventories are (1) not endogenous to loan
contract terms; (2) uncorrelated with relevant omitted variables, (3) uncorrelated
4
with measurement error in auditing fees; and (4) we perceive no strong theoretical
argument as to why audit fees should instead be used as explanatory variables for
loan terms.
We find that audit fees are associated with syndicated loans with lower interest
rates, shorter maturity lengths, and a greater number of lenders. We interpret our
results as supporting the assertion that an increase in equilibrium auditing fees is
associated with a decrease in asymmetric information problems and credit risk in
the syndicated loan market.
Our results are important for several reasons. First, the only study examin-
ing the implications of accounting errors or financial statement accuracy for debt
contracting is Graham, Li, and Qiu (2007); however, these authors examine the
implications of realized accounting errors for debt contracting; rather, our study
examines the impact of potential accounting errors for debt contacting. These
authors present results that realized accounting errors are associated with less
favorable loan contract terms because accounting errors increase asymmetric in-
formation problems and credit (default) risk. Moreover, our study is the first
examining the empirical implications of audit fees for debt contracting.
The second reason our results are important because the syndicated loan mar-
ket is the primary source of corporate financing for large publicly traded cor-
porations, and our results provide additional insights regarding the impact of
asymmetric information in this market.
The third reason our results are important is that our results suggest that
auditing services do mitigate asymmetric information problems with outside in-
vestors, as was intended with the Securities and Exchange Act of 1934. In addition,
several observers have raised concerns that greater audit fees are no more than
auditees paying to get away with accounting malfeasance, but our results suggest
that lenders in the syndicated loan market interpret auditing fees as mitigating
asymmetric information problems and credit risk.
Our results contribute to several literatures. First, our results contribute the
literature regarding the determinants of auditing fees. A implication of the theo-
ries by Simunic (1980) is that expected litigation costs are a primary determinant
of auditing fees. In Simunic’s model, expected litigation costs determine both the
supply and demand for auditing services. Venkataraman, Weber, and Willenborg
(2005) provide empirical evidence that auditing fees are increasing in litigation
risks associated with IPO’s. Taken together, these studies suggest that auditing
fees primarily reflect compensation for the costs of providing audits without pro-
5
viding an strong role for the benefits that audits provide in reducing asymmetric
information. Dye (1993) provides a model where the supply of auditing services
depends on expected litigation costs resulting from accounting errors; however, the
demand for auditing services depends on the benefits of more accurate informa-
tion regarding auditees’ profitability. Dye’s theory introduces a role for auditing
services to mitigate asymmetric information problems. Carcello, Neal, and Riley
(2002) present empirical evidence supporting Dye’s assertion that the benefits of
more accurate accounting statements partially determine auditing fees. The au-
thors’ results indicate that audit fees are greater for better boards of governors,
and suggest their results imply that audit fees are increasing in benefits of more
reliable accounting records. We find that the relationship between audit fees and
syndicated loan terms is consistent with a reduction in asymmetric information.
We suggest that greater audit fees are associated with a reduction in asymmetric
information, and that increases in equilibrium audit fees are dominated by shifts
in the demand for auditing services. Our results contribute to the literature re-
garding audit fee determination by providing additional empirical evidence that
demand for better information is a partial determinant of auditing fees. We note
our results do not indicate that supply side influences do not influence equilib-
rium audit fees. Our results are only consistent with the assertion that demand
influences dominate variation in equilibrium auditing fees.
Our results contribute to the literature regarding the influence of asymmetric
information problems and credit risk for the terms of syndicated loan contract
terms. Diamond (1984) all presents a model where the cost of bank loan financ-
ing is increasing the amount of resources lenders allocate to monitoring borrowers
to overcome asymmetric information problems. Our results are consistent with
the assertion that audit fees reduce asymmetric information, thereby reducing the
amount of resources lenders must allocate to overcoming asymmetric information
problems. Sufi (2007) provides evidence consistent with the theory of Holmstrom
and Tirole (1997) that lead banks retain a larger ownership share and form syndi-
cates with greater ownership concentration when borrowers require more monitor-
ing. Ivashina (2008) provides evidence consistent with the implication of model
of Leland and Pyle (1977) that the cost of loan financing is decreasing in the
ownership share retained by lead banks in syndicated loans. Our results build
upon their results by suggesting banks are more easily able to transfer ownership
of syndicated loans to more uninformed lenders when borrowers purchase publicly
available information that mitigates asymmetric information problems. We inter-
6
pret this result as further evidence that asymmetric information problems reduce
the liquidity of banks loans. Diamond (1991) and Flannery (1986) present theories
where least risky borrowers take out short term debt in the presence of asymmet-
ric information problems. Our contribute to this literature by suggesting that an
increase in audit fees which decrease asymmetric information and/or credit risk
are associated with shorter maturity loans.
Additionally, our results contribute to the literature regarding the incentives
to produce information. Several studies provide theoretical justifications regard-
ing barriers to information production about firms’ creditworthiness. Hirschleifer
(1971) suggests that agents producing information may have a hard time credibly
convincing other users that they have produced valuable information. Grossman
and Stiglitz (1980) argue that it may not be economically rational to produce
information if the producer cannot be certain that their information cannot be
resold or transferred without their approval, thereby diminishing the returns to
information production. Our results are consistent with the rationale that firms
find it beneficial to pay for the production of information that can be used by
anyone at zero cost, and that lenders in the syndicated loan market find this
information credible.
2 Theoretical Background
Previous research examining the the determinants of audit fees suggests that equi-
librium audit fees may be either negatively or positively associated with the like-
lihood of an accounting error (Simunic (1980), Dye (1993)). These models assert
that the supply of auditing services is determined by the expected litigation costs
associated with providing an audit, and that demand for auditing services depend
on the benefits of more accurate financial statements, which include a decline in
asymmetric information between firms and outsiders, and a decline in expected
profit losses due to accounting errors.3Therefore, if an increase in equilibrium au-
diting fees is due to an increase in the demand (supply) for auditing services, then
an increase in auditing fees should be associated with a decrease (increase) in the
likelihood of an accounting error.
3While we are unaware of any theoretical model explicitly incorporating the benefits of adecline in expected profit losses due to accounting errors Graham et al. (2007) argue that financialrestatements are usually associated with a decline in firms’ market value due to: (1) downwardrevisions in earnings expectations; (2) expected litigation costs; (3) changes in the terms of tradewith outside parties (i.e. less favorable conditions negotiated with suppliers.
7
Borrowers’ financial statements provide a noisy signal regarding borrowers’
characteristics. Holding all else constant, when financial statements errors are
more (less) likely, asymmetric information problems are more (less) severe. For
example, adverse selection problems typically arise in the corporate loan mar-
ket because the riskiest borrowers are willing to pay the highest interest rates,
and lenders cannot ascertain the true riskiness of a borrower ex-ante; moral haz-
ard problems arise because lenders cannot be sure that borrowers will take actions
against their interest ex-post. Accounting records with a greater amount of poten-
tial errors, holding all else constant, make it more difficult to distinguish borrowers
riskiness ex-ante and the likelihood of moral hazard problems may potentially arise
ex-post. In addition, when accounting errors are more likely, borrowers expect fu-
ture profitability decreases, which would cause an increase in a borrowers default
risk Graham et al. (2007).
Given that potential accounting errors present an asymmetric information
problem and additional credit risk, and that auditing fees should be related to
the likelihood of potential accounting errors; we can develop several empirical pre-
dictions regarding the association between audit fees and the terms of syndicated
loan contracts based on the literature discussing the impact of asymmetric in-
formation and credit risk on debt contracting. These studies provide predictions
regarding the impact of asymmetric information and credit risk for the price and
non-price terms of loan contracts.
The literature on loan contacting predicts that greater asymmetric information
and default risk is associated with greater loan interest rates. In the theories of
Diamond (1984) and Boyd and Prescott (1986), lenders must exert more effort
monitoring borrowers suffering from more asymmetric information problems and
default risk, which raises the cost of loan financing.
Several studies suggest that more asymmetric information and default risk
should be associated with smaller lending syndicates. Bolton and Scharfstein
(1996) present a model where lenders form smaller lending syndicates when default
risk is greater in order to reduce bankruptcy costs, because it is easier to negotiate
a resolution with fewer lenders. In addition, models by Leland and Pyle (1977)
and Holmstrom and Tirole (1997) imply that lenders originating loans will retain
a greater ownership stake in a loan to signal the quality of the loan and commit
to monitoring the borrower to overcome asymmetric information problems. Sufi
(2007) provides empirical evidence that lead lenders in syndicates retain greater
ownership stakes in syndicated loans, form smaller syndicates, and form more
8
concentrated syndicates for borrowers suffering from more asymmetric information
problems.
Two different studies provide empirical predictions regarding the impact of de-
fault risk and asymmetric information for the maturity of debt financing. Flannery
(1986) presents a model where more creditworthy borrowers will issue short term
debt, when issuing debt requires the payment of transaction costs. An implication
of Flannery (1986) is that borrowers signal their private information regarding
credit quality by issuing short term with significant transaction costs. We specu-
late that paying greater audit fees in order to close the information gap between
the borrower and lender may be a type of transaction costs Flannery describes.
Diamond (1991) presents a model where borrowers with both low and high credit
quality will issue short term debt and borrowers with moderate credit risk will
issue long term debt. In Diamond’s model, lenders infer a borrowers credit risk
through observable risk proxies, where a audit fees may be an obserable proxy
for risk. Because our study focuses on borrowers with high or moderate levels
of credit quality, we predict that borrowers with greater credit quality and fewer
asymmetric information problems should borrower at shorter maturities.
Based upon the preceeding discussion, we have three empirically testable pre-
dictions. If an increase in equilibrium audit fees is associated with an increase
(decrease) in asymmetric information, then:
• audit fees are negatively (positively) associated with loan interest rates
• audit fees are positively (negatively) associated with the number of lenders
in a syndicated loan
• audit fees are negatively (positively) associated with a the maturity of a
syndicated loan
3 Empirical Model and Sample Selection
We begin constructing our data sample with the Audit Analytics database; a
database containing detailed audit information for over 15,000 corporations filing
public financial statements with the Securities and Exchange Commission (SEC).
From this database, we gather data on firms’ audit fees and non-audi fees. Audit
fees include the cost of performing the audit; non-audit fees include fees for other
ancillary consulting services provided by auditors such as consulting services. We
then merge the audit analytics database with the Loan Pricing Corporation’s
9
DEALSCAN database; a database containing information regarding the price and
non-price terms for loans to large corporations.4 We keep all observations from
the merged Audit Analytics-DEALSCAN database with accompanying financial
statement data from COMPUSTAT and stock price data from the Center for
Research in Securities Prices (CRSP) database. The unit of observation in our
database is a loan facility obtained by a firm in a given fiscal year; the final sample
contains observations on 4196 loan facilities merged to the aforementioned data
sets. The final database contains 4196 observations spanning the years 2000-2007.
We are limited to this time span because the Audit Analytics database does not
provide audit information prior to 2000. In addition, we note that the data from
Audit Analytics, COMPUSTAT and CRSP data is lagged one fiscal year prior to
the beginning of the loan facility to ensure that the information was available to
the lender when negotiating loan contract terms.
Our empirical exercise use the data sample to estimate the following model
Yi,t,l = β′Xi,t,l + δ′Xl + εi,t + γt + ωi (1)
Equation (1) presents the models describing the loan interest rate spread, the
number of lenders, and the maturity length. The interest rate spread is calculated
as the All-In-Drawn Spread from the DEALSCAN database, which is loan interest
rate spread over LIBOR in basis points, the number of lenders is calculated as the
log of 1+ number of lenders, and the maturity length is the log of the loans
maturity length in days. We relate the dependent variables to several standard
proxies for asymmetric information and credit risk problems and audit fees. In
equation (1) the subscript i denotes each firm, the subscript t denotes the year,
and the subscript l denotes each loan. The variable Y denotes the dependent
variables, which includes either the interest rate spread, the number of lenders
or the maturity length, and the matrix X includes the set of observable risk
chracteristics. The error term is composed of three components: (1) ωi, which is
the firm specific error term; γt, the year specific error term, ;and εi,t, a white noise
error term.
We calculate two separate proxies for the audit fee: (1) total audit fees divided
4We gather the following loan information from the DEALSCAN database: the loan interestrate; he number of lenders; the loan amount, whether the loan is secured or unsecured, whetherthe loan has financial or general covenants; whether the loan has performance pricing; the type ofloan (i.e loan commitment, term loan); the loan purpose; the loan seniority; and the distributionmethod (i.e. syndicated loan, sole lender loan)
10
by lagged total assets; (2) total audit fees plus non-audit fees divided by lagged
total assets. We use the second measure to capture the possibility that firms’
compensate their auditors for their auditing activities by purchasing addition non-
audit related consulting services. For example, several studies suggest that firms
may compensate auditing firms’ for bearing additional litigation risk by purchasing
additional consulting services.
The observable risk characteristics in equation (1) are intended to capture
banks pricing of asymmetric information and credit risks. Proxies for observable
risk characteristics that are intended to capture lenders attempt to account for
risks associated with asymmetric information problems and are standard in the
literature; these variables include: a proxy for the firms’ size (log of total assets),
the leverage ratio (the book value of debt divided by the book value of assets),
research and development (research and development expense divided by total as-
sets), the current ratio, the quick ratio, Tobin’s average Q (the market value of
equity plus the book value of debt divided by total assets), cumulative monthly
stock returns from the previous fiscal year, the standard deviation of monthly
stock returns from the previous fiscal year.5 In addition, we construct a proxy for
the firms’ S&P domestic issuer rating, which takes on 23 values, where the debt
rating is more favorable for greater values of this indicator. Typically asymmetric
information problems and credit risk is thought to be decreasing in a firms’ debt
rating, total assets, current assets, the quick ratio, EBITDA, cumulative stock re-
turns, and Tobin’s Q; and a firms leverage ratio, short term debt, and research and
development spending are usually associated with greater asymmetric information
and credit risk problems.
The non-price loan terms capture how lenders use loan features to mitigate
asymmetric information and control problems (Strahan (1999)). These include an
indicator for whether or not the loan is secured, the log of the maturity length
of the loan in days, the log of the size of the loan, a dummy variable indicating
whether the loan has financial covenants, and dummy variable indicating whether
the loan has general covenants. In addition, we construct indicators for the loan
type and purpose.
Our main objective is to obtain empirical estimate of a causal relationship
between audit fees and corporate loan interest rate spreads and the number of
lenders; however, this is complicated by the possibility that audit fees may be
5Other studies examining the empirical determinants of loan contact terms include Careyet al. (1998), Hubbard, Kuttner, and Palia (2002), Gunner (2006) and Qian and Strahan (2007).Specific construction of each variable is standard in the literature and included in the appendix.
11
correlated with unobserved information determining interest rate spreads and/or
the number of lenders for the following reasons: (1) audit fees may be endogenous
to future corporate loan interest rate spreads; (2) an inaccurate proxy for audit
costs may lead to an attenuation bias; (3) audit fees may be uncorrelated with an
another omitted or unobservable variable that determines interest rate spreads.
Therefore, we use a two-stage GMM approach to identify the exogenous influence
of audit fees for interest rate spreads.
To identify the exogenous influence of audit fees on bank loan interest rate
spreads and on the number of lenders with a two-step GMM model, we need in-
strumental variables that are correlated with audit fees, but not correlated with
the unobservables in either equation. We rely on the theory of Simunic (1980)
which implies that audit fees are a function of the cost of performing an audit
and the expected litigation costs associated with audit liability. Several studies
suggest that auditing liability is greatest when an audited firm defaults on an debt
obligations, often leaving the auditing firm as the only entity with funds to reim-
burse creditors, which may suggest several proxies for default risk may be suitable
instrumental variables for audit fees However, since we are modeling interest rate
spreads, any proxy for default risk is better suited explanatory variable for inter-
est rate spreads. Consequently, must derive our instrumental variables for audit
fees from variables that are likely to determine audit fees, but not determine loan
interest rate spreads.
We derive our first instrumental variables from Simunic’s implication that audit
fees depend on the cost of allocating resources to perform the audit. Studies by
() suggest that audit fees are increasing in the amount of firm’s inventory and
accounts receivables. A typical task in auditing financial statements is verifying
the value of firms’ inventory and accounts receivables. Typically, a firm will select
a certain percentage of inventories and accounts receivables to verify. This implies
that an increase in the amount of inventories and accounts receivables should
require an increase in the amount of resources allocated to performing the audit.
In addition, it is unlikely that the size of inventories or accounts receivables should
contain any significant information for loan interest rate spreads or be correlated
with any unobservable variables determining interest rate spreads. Moreover, it is
unlikely that the size of inventories or accounts receivables should be endogenous
to future loan interest rate spreads.
12
4 Estimation Results
Our main estimation results are presented in in Table 4, where we use a two-
step GMM estimator with standard errors robust to heteroskedasticity. All three
models also control for industry, loan type and year effects. As explained in the
empirical model section we use accounts receivable and inventories as exogenous
instruments for audit fees.
In column (1) the dependent variable is the All-In-Drawn Spread. The results
indicate that the audit fees have a negative and statistically significant association
with loan interest rate spreads. In addition, we note that audit fees retain sig-
nificant explanatory power for loan spreads after controlling for firms’ observable
risk characteristics and non-price loan terms. This is important because more
accurate financial statements may only influence loan terms through the weights
banks place on information contained in the statements. However, this result im-
plies that audit fees may be associated with a reduction in asymmetric information
and credit risk beyond the information contained in financial statement data. This
negative association shows that firms are willing to pay higher audit fees in order
to get a better price on the loan. Holding all else constant, more precise financial
statements are associated with lower monitoring costs and higher expected future
profitability, which result in lower premium on the interest rate spread.
Looking at the risk characteristics we see that firms’ observable risk charac-
teristics have explanatory power for loan spreads. Loan interest rate spreads are
decreasing in firm total assets, research and development spending, current assets,
and EBITDA, which are all variables typically associated with lower asymmetric
information or credit risk, while leverage, generally associated with greater asym-
metric information and default risk is positively associated loan spreads. Dividends
are positively associated with loan spreads. The stock price based observable risk
characteristic, the stock return volatility, capturing greater uncertainty and asym-
metric information, is positively associated loan interest rate spreads. A better
debt rating, which indicates a greater ability and willingness to repay debt, which
reduces asymmetric information, also results in lower interest rate spreads. For
the non-price loan terms, an increase in the number of lenders and having per-
formance pricing is negatively associated with loan spreads, while the presence of
financial covenants are positively associated with loan spreads. These results are
all consistent with the previous literature examining the empirical determinants
of loan spreads. In addition, we note that the results for the additional explana-
tory variables are generally consistent with the argument that greater asymmetric
13
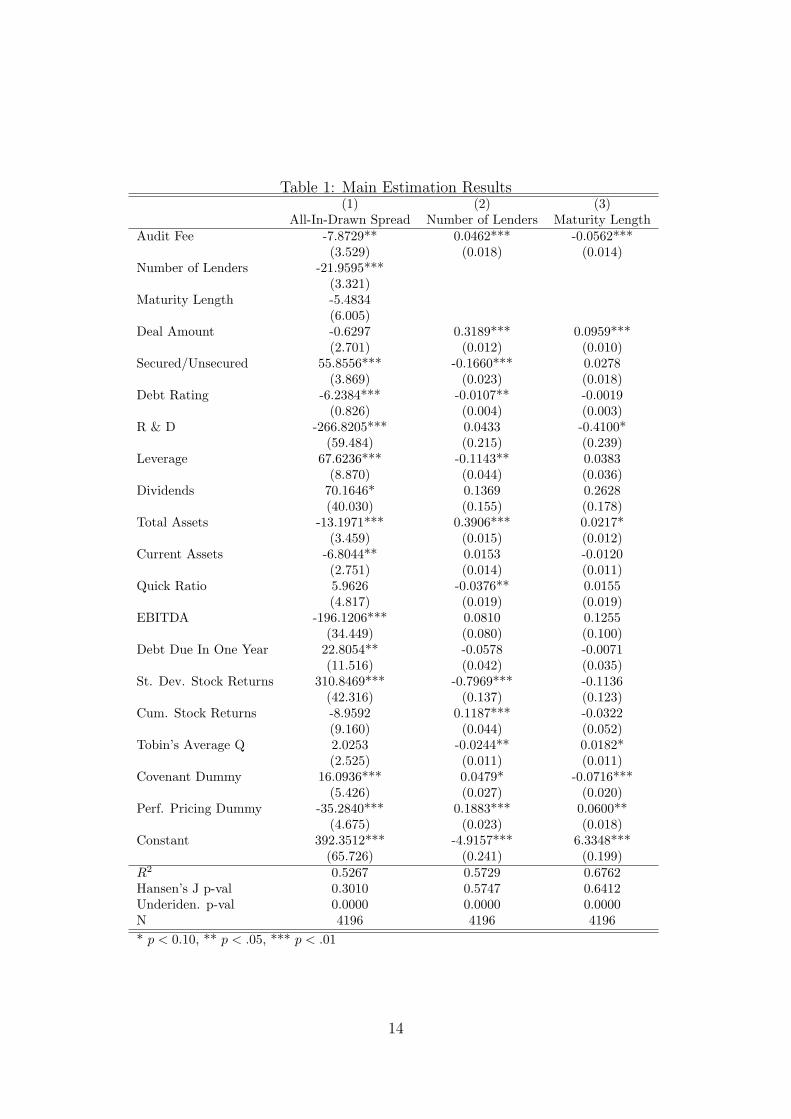
Table 1: Main Estimation Results(1) (2) (3)
All-In-Drawn Spread Number of Lenders Maturity LengthAudit Fee -7.8729** 0.0462*** -0.0562***
(3.529) (0.018) (0.014)Number of Lenders -21.9595***
(3.321)Maturity Length -5.4834
(6.005)Deal Amount -0.6297 0.3189*** 0.0959***
(2.701) (0.012) (0.010)Secured/Unsecured 55.8556*** -0.1660*** 0.0278
(3.869) (0.023) (0.018)Debt Rating -6.2384*** -0.0107** -0.0019
(0.826) (0.004) (0.003)R & D -266.8205*** 0.0433 -0.4100*
(59.484) (0.215) (0.239)Leverage 67.6236*** -0.1143** 0.0383
(8.870) (0.044) (0.036)Dividends 70.1646* 0.1369 0.2628
(40.030) (0.155) (0.178)Total Assets -13.1971*** 0.3906*** 0.0217*
(3.459) (0.015) (0.012)Current Assets -6.8044** 0.0153 -0.0120
(2.751) (0.014) (0.011)Quick Ratio 5.9626 -0.0376** 0.0155
(4.817) (0.019) (0.019)EBITDA -196.1206*** 0.0810 0.1255
(34.449) (0.080) (0.100)Debt Due In One Year 22.8054** -0.0578 -0.0071
(11.516) (0.042) (0.035)St. Dev. Stock Returns 310.8469*** -0.7969*** -0.1136
(42.316) (0.137) (0.123)Cum. Stock Returns -8.9592 0.1187*** -0.0322
(9.160) (0.044) (0.052)Tobin’s Average Q 2.0253 -0.0244** 0.0182*
(2.525) (0.011) (0.011)Covenant Dummy 16.0936*** 0.0479* -0.0716***
(5.426) (0.027) (0.020)Perf. Pricing Dummy -35.2840*** 0.1883*** 0.0600**
(4.675) (0.023) (0.018)Constant 392.3512*** -4.9157*** 6.3348***
(65.726) (0.241) (0.199)R2 0.5267 0.5729 0.6762Hansen’s J p-val 0.3010 0.5747 0.6412Underiden. p-val 0.0000 0.0000 0.0000N 4196 4196 4196* p < 0.10, ** p < .05, *** p < .01
14
information problems are associated with greater loan interest rate spreads.
Examining the non-price terms of loans, the positive correlation between the
Secured / Unsecured dummy and the spread suggests that firms that pay higher
interest rates are in a way forced to get secured loans, which is consistent with
Strahan (1999). Likewise, the positive association between the Financial Covenant
dummy and the interest rate suggests that firms that pay higher interest rates are
also faced with more restrictions, which is consistent with Graham et al. (2007).
Performance Pricing Dummy is related negatively to the interest spread, which
is also shown by Graham et al. (2007). There is a significant negative relation
between the number of lenders and the all-in-drawn spread which has been shown
in the literature before (Strahan (1999)). Finally, even though Maturity Length
and the Deal Amount have negative coefficients, they are not significant.
In column (2) we have the number of lenders as our dependent variable, and
the coefficient on the audit fee is positive and statistically significant at any level.
The number of lenders is positively related with the Audit Fee, consistent with the
assertion that firms that pay higher audit fees have less asymmetric information
and/or lower credit risk, and can borrow from syndicates that have more lenders.
Examining the results for the observable risk chracteristics, several observanle
risk chracteristics are associated with the number of lenders. Total assets and
borrowers stock returns, generally associated with fewer asymmetric information
problems and credit risk are positively associated with the number of lenders.
Leverage and the standard deviation, associated with greater asymmetric infor-
mation problems and credit risk, is negatively associated with the number of
lenders. Interestingly, serveal observable risk characteristics have puzzling associ-
ations with the number of lenders. Firms with better debt ratings, greater quick
ratios, and greater values of Tobin’s Q have fewer lenders. The non-price loan
terms also have explanatory power for the number of lenders. The presence of
covenants and performance pricing is positively associated with the number of
lenders, while secured loans have fewer lenders. Overall, these results suggest that
standard proxies for reduced asymmetric information and/or credit risk problems
do necessarily result in a greater amount of lenders.
In column (3), we find a negative and significant relation between the audit
fee and the maturity length, which is consistent with Diamond (1991) and Flan-
nery (1986) where borrowers with high credit quality will issue short term debt.
Audit fees may be similar to the transaction costs positied by Flannery (1986) or
an observable signal credit use to determine borrowers riskiness as suggested by
15
Diamond (1991).
Many observable risk characteristics do not appear to have explanatory power
for loan maturity. Total Assets is positively related to maturity length and Re-
search and Development Expense is negatively related to the maturity length.
The size of the deal and performance Pricing are positively associated with loan
maturities, and covenants are negatively associated with loan maturities. Overall,
these results are not directly consistent with the argument that fewer asymmetric
information problems or lower credit risk is associated with longer loan maturi-
ties. However, this may be expected as there is conflicting evidence from previous
research regarding the association between loan maturity and asymmetric infor-
mation problems and credit risks.
It is important to note that our main equation suffers from an endogeneity
problem, and thus we need to make sure that our two-step GMM estimation is
properly specified, i.e. our model has to be identified and our instruments have
to be uncorrelated with all unobservables, but have to explain the variation audit
fees6. For all of the regressions, the underidentification test results suggest that
our models are identified. Likewise all the Hansen’s J-tests fail to reject the
null hypothesis that accounts receivable and inventories are valid instruments,
i.e. uncorrelated with the error term, and are correctly excluded from the main
equation.
To sum up, our main estimation results support the view that, the availability
of more accurate publicly available information as proxied by a higher audit fee
implies a decrease in monitoring costs, which is reflected as a lower interest rate
on the loan. Furthermore, since borrowers’ asymmetric information problem is
mitigated, there will be an increase in the ability of an informed lender to transfer
ownership of a loan to uninformed lenders which increases the syndicate size. Our
results are consistent with the rationale that firms find it beneficial to pay for
the production of information that can be used by anyone at zero cost, and that
lenders in the syndicated loan market find this information credible. We inter-
pret our results as suggesting that borrowers find it economically advantageous to
substitute banks’ monitoring with information production by auditing firms.
As alternative estimating procedures, we replicate our analysis with a two-step
GMM estimator with heteroskedasticity robust errors that are also clustered by
firm, deal amount and deal active date, standard two stage least squares (2SLS),
and ordinary least squares (OLS), again controlling for industry, loan type and
6First stage regression results are provided in the appendix
16

year effects in appendix, in Tables (2), (3), and (4). We report the main estimation
results in the first column of each table to make comparison easier. With two-step
GMM/clustered errors, and with 2SLS our models are identified and instrument
are valid as can be seen from the Hansen’s J and underidentification tests. Our
main results do not change, firms that pay higher audit fees, pay lower interest
rates, have syndicates with more lenders and can get shorter maturity loans. The
magnitude of the coefficients and the standard errors are fairly close for 2SLS and
two-step GMM estimations.
The results for the OLS regressions are somewhat different from the two-step
procedures, especially for the all-in-drawn spread equation. The dramatic differ-
ence is caused by the endogeneity between audit fees and the interest rate spread
that is unaccounted for in the OLS regression. The estimated relation between
the all-in-drawn spread and the audit fee in the OLS regression is positive. Also,
some of the regressors such as dividends, total assets, and current assets are no
longer significant. We see significance losses also in the other equations; Quick
ratio, Tobin’s Average Q in the number of lenders equation, and Research and
Development Expenditure and Dividends in the maturity length equation.
5 Conclusion
In this paper we examine whether equilibrium audit fees are associated with asym-
metric information and credit risk in the syndicated loan market. We posit that
if an increase in audit fees is associated with an increase in the demand (sup-
ply) of auditing services, then an increase in auditing fees is associated a decrease
(increase) in asymmetric information and credit risk. we present evidence that
greater audit fees are associated with syndicated loans with lower interest rates,
shorter maturities, and more lenders, which we interpret as consistent with audit-
ing fees reducing credit risk and/or asymmetric information. Our results suggest
that audits provided by independent auditing firms reduce asymmetric informa-
tion problems as intended by the Securities and Exchange Act of 1934.
17
References
Carcello, J., Hermanson, D., Neal, T., Riley, R.J., 2002. Board characteristics andaudit fees. Contemporary Accounting Research 19(3), 365–384.
Carey, M., Post, M., Sharpe, S.A., 1998. Does corporate lending by banks and fi-nancial companies differ? evidence on specialization in private debt contracting.The Journal of Finance 53(3).
Dennis, S., Mullineaux, D., 2000. Syndicated loans. Journal of Financial Interme-diation 9, 404–426.
Diamond, D., 1984. Financial intermediation and delegated monitoring. Reviewof Economic Studies 51, 393–414.
Diamond, D., 1991. Monitoring and reputation: The choice between bank loansand privately-placed debt. Journal of Political Economy 99, 689–721.
Dye, R.A., 1993. Discussion: Limiting auditors’ liability. Journal of Economicsand Management Strategy 2(3), 435–443.
Esty, B., Megginson, W., 2003. Creditor rights, enforcement and debt ownershipstructure. Journal of Financial and Quantitative Analysis 38, 37–59.
Flannery, M., 1986. Asymmetric information and risky debt maturity choice. TheJournal of Finance 41, 18–38.
Francis, J., Philbrick, D., Schipper, K., 1994. Shareholder litigation and corporatedisclosures. Journal of Accounting Research 32, 137–164.
Gorton, G., Pennacchi, G., 1990. Financial intermediaries and liquidity creation.The Journal of Finance 45(1), 49–71.
Gorton, G., Pennacchi, G., 1995. Banks and loan sales: Marketing non-marketableassets. The Journal of Finance 35, 389–411.
Graham, J.R., Li, S., Qiu, J., 2007. Corporate misreporting and bank loan con-tracting. NBER Working Paper (13708).
Griffin, P., Lont, D., Sun, Y., 2008. Corporate goverenance and audit fees: Evi-dence of counterveiling relations. Working Paper .
Grossman, S., Stiglitz, J., 1980. On the impossibility of informationally efficientmarkets. American Economic Review 70(3), 393–408.
Holmstrom, B., Tirole, J., 1997. Financial intermediation, loanable funds, and thereal sector. Quarterly Journal of Economics 112, 663–691.
Hubbard, R.G., Kuttner, K., Palia, D., 2002. Are there bank effects in borrow-ers’ costs of funds?: Evidence from a matched sample of borrowers and banks.Journal of Business 75(4), 559–581.
18
Ivashina, V., 2008. Asymmetric information effects on syndicated loan rates. Har-vard Business School Working Paper .
Jones, J., Lang, W., Nigro, P., 2000. Recent trends in bank loan syndications:Evidence for 1995 to 1999. Office of the Comptroller of the Currency WorkingPaper .
Karpoff, J.M., Lee, D.S., Martin, G.S., 2006. The cost to firms of cooking thebooks. Journal of Financial and Quantitative Analysis, Forthcoming .
Lee, S., Mullineaux, D., 2004. Monitoring, financial distress, and the structure ofcommercial lending syndicates. Financial Management 33(3).
Leland, H., Pyle, D., 1977. Informational asymmetries, financial structure, andfinancial intermediation. The Journal of Finance 32(2), 371–387.
Panyagometh, K., Roberts, G., 2002. Private information, incentive conflicts, anddeterminants of loan syndications. York University Working Paper 20, 577–593.
Preece, D., Mullineaux, D., 1996. Monitoring, loan renegotiability, and firm value:The role of lending syndicates. Journal of Banking and Finance 20, 577–593.
Qian, J., Strahan, P.E., 2007. How law and institutions shape financial contracts:The case of bank loans. The Journal of Finance 62(6), 2803–2834.
Simons, K., 1993. Why do banks syndicate loans? New England Economic Review, 45–52.
Simunic, D., 1980. The pricing of audit services: Theory and evidence. Journal ofAccounting Research 18(1), 161–190.
Simunic, D., 1984. Auditing, consulting, and auditor independence. Journal ofAccounting Research 22(2), 679–702.
Strahan, P.E., 1999. Borrower risk and the price and nonprice terms of bank loans.Working Paper .
Sufi, A., 2007. Information asymmetry and financing arrangements: Evidence fromsyndicated loans. The Journal of Finance 62(2), 629–668.
Tsui, J., Jaggi, B., Gul, F., 2001. Ceo domination, growth opportunities and theirimpact on audit fees. Journal of Accounting, Auditing and Finance , 189–208.
Venkataraman, R., Weber, J., Willenborg, M., 2005. Litigation risk, audit feesand audit quality: initial public offerings as a natural experiment. University ofMinnesota, Working Paper .
19

Appendix A: Additional Tables
Table 2: Summary StatisticsVariable Mean Std. Dev. Min. Max.
All-In-Drawn Spread 161.119 133.311 10 1180Audit Fee 1.571 2.583 0 73.34Number of Lenders 2.04 0.761 0.693 4.779Maturity Length 7.107 0.627 3.332 8.896Inventory 0.145 0.147 0 1.163Accounts Receivable 0.175 0.125 0 1.372Deal Amount 12.19 1.023 7.443 15.697Debt Rating 8.391 7.414 0 23R & D 0.02 0.055 0 1.792Leverage 0.323 0.241 0 3.113Dividends 0.015 0.06 0 1.805Total Assets 7.221 1.736 1.973 12.012Current Assets 1.851 1.247 0.114 21.689Quick Ratio 0.847 0.975 0.014 20.21EBITDA 0.101 0.119 -2.682 0.791Debt Due In One Year 0.103 0.18 0 1St. Dev. Stock Returns 0.114 0.073 0.004 0.724Cum. Stock Returns 1.044 0.205 0.356 4.525Tobin’s Average Q 1.5 1.882 0.021 36.181Covenant Dummy 0.741 0.438 0 1Perf. Pricing Dummy 0.539 0.499 0 1Secured/Unsecured 0.437 0.496 0 1Secured Dummy 0.668 0.471 0 1Debt Rating Dummy 0.594 0.491 0 1R & D Dummy 0.569 0.495 0 1
N 4196
20
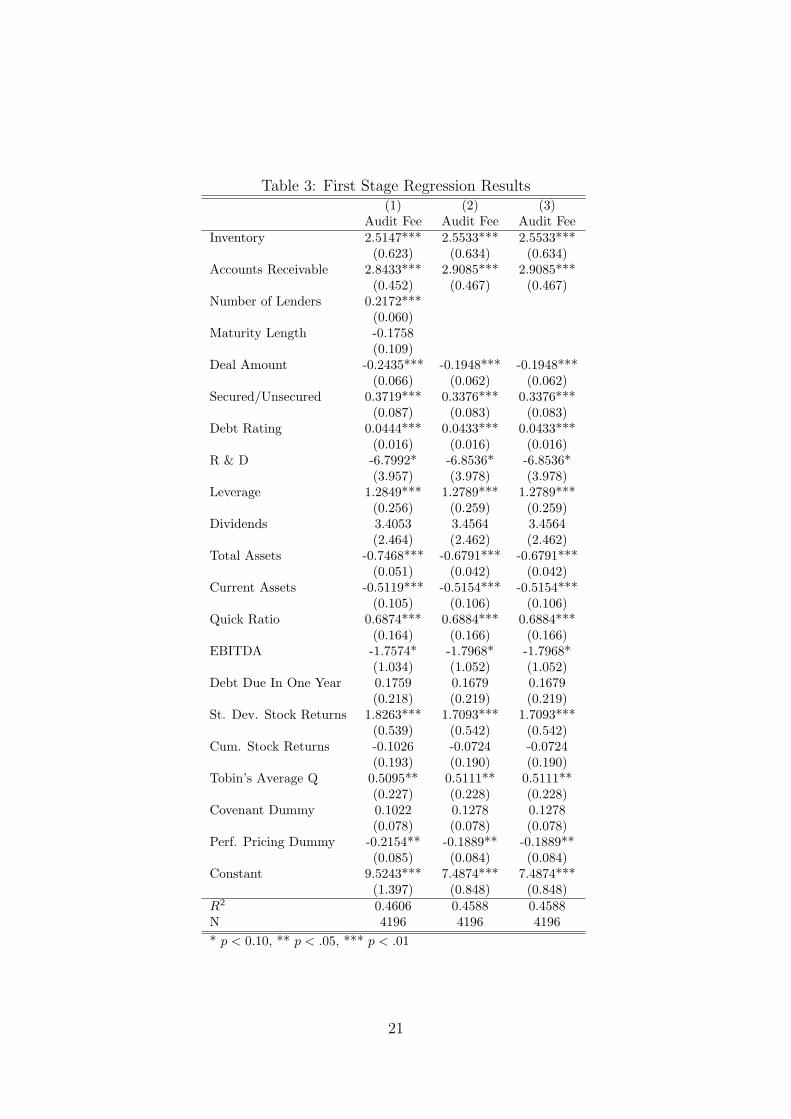
Table 3: First Stage Regression Results(1) (2) (3)
Audit Fee Audit Fee Audit FeeInventory 2.5147*** 2.5533*** 2.5533***
(0.623) (0.634) (0.634)Accounts Receivable 2.8433*** 2.9085*** 2.9085***
(0.452) (0.467) (0.467)Number of Lenders 0.2172***
(0.060)Maturity Length -0.1758
(0.109)Deal Amount -0.2435*** -0.1948*** -0.1948***
(0.066) (0.062) (0.062)Secured/Unsecured 0.3719*** 0.3376*** 0.3376***
(0.087) (0.083) (0.083)Debt Rating 0.0444*** 0.0433*** 0.0433***
(0.016) (0.016) (0.016)R & D -6.7992* -6.8536* -6.8536*
(3.957) (3.978) (3.978)Leverage 1.2849*** 1.2789*** 1.2789***
(0.256) (0.259) (0.259)Dividends 3.4053 3.4564 3.4564
(2.464) (2.462) (2.462)Total Assets -0.7468*** -0.6791*** -0.6791***
(0.051) (0.042) (0.042)Current Assets -0.5119*** -0.5154*** -0.5154***
(0.105) (0.106) (0.106)Quick Ratio 0.6874*** 0.6884*** 0.6884***
(0.164) (0.166) (0.166)EBITDA -1.7574* -1.7968* -1.7968*
(1.034) (1.052) (1.052)Debt Due In One Year 0.1759 0.1679 0.1679
(0.218) (0.219) (0.219)St. Dev. Stock Returns 1.8263*** 1.7093*** 1.7093***
(0.539) (0.542) (0.542)Cum. Stock Returns -0.1026 -0.0724 -0.0724
(0.193) (0.190) (0.190)Tobin’s Average Q 0.5095** 0.5111** 0.5111**
(0.227) (0.228) (0.228)Covenant Dummy 0.1022 0.1278 0.1278
(0.078) (0.078) (0.078)Perf. Pricing Dummy -0.2154** -0.1889** -0.1889**
(0.085) (0.084) (0.084)Constant 9.5243*** 7.4874*** 7.4874***
(1.397) (0.848) (0.848)R2 0.4606 0.4588 0.4588N 4196 4196 4196* p < 0.10, ** p < .05, *** p < .01
21
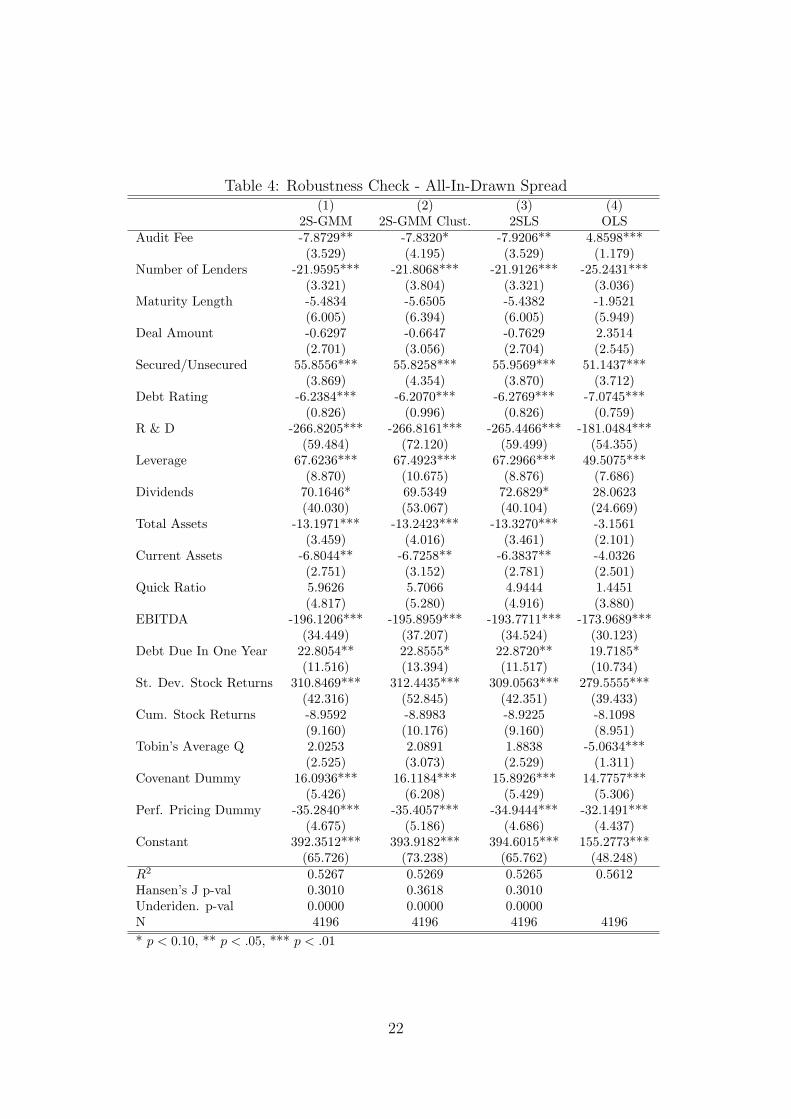
Table 4: Robustness Check - All-In-Drawn Spread(1) (2) (3) (4)
2S-GMM 2S-GMM Clust. 2SLS OLSAudit Fee -7.8729** -7.8320* -7.9206** 4.8598***
(3.529) (4.195) (3.529) (1.179)Number of Lenders -21.9595*** -21.8068*** -21.9126*** -25.2431***
(3.321) (3.804) (3.321) (3.036)Maturity Length -5.4834 -5.6505 -5.4382 -1.9521
(6.005) (6.394) (6.005) (5.949)Deal Amount -0.6297 -0.6647 -0.7629 2.3514
(2.701) (3.056) (2.704) (2.545)Secured/Unsecured 55.8556*** 55.8258*** 55.9569*** 51.1437***
(3.869) (4.354) (3.870) (3.712)Debt Rating -6.2384*** -6.2070*** -6.2769*** -7.0745***
(0.826) (0.996) (0.826) (0.759)R & D -266.8205*** -266.8161*** -265.4466*** -181.0484***
(59.484) (72.120) (59.499) (54.355)Leverage 67.6236*** 67.4923*** 67.2966*** 49.5075***
(8.870) (10.675) (8.876) (7.686)Dividends 70.1646* 69.5349 72.6829* 28.0623
(40.030) (53.067) (40.104) (24.669)Total Assets -13.1971*** -13.2423*** -13.3270*** -3.1561
(3.459) (4.016) (3.461) (2.101)Current Assets -6.8044** -6.7258** -6.3837** -4.0326
(2.751) (3.152) (2.781) (2.501)Quick Ratio 5.9626 5.7066 4.9444 1.4451
(4.817) (5.280) (4.916) (3.880)EBITDA -196.1206*** -195.8959*** -193.7711*** -173.9689***
(34.449) (37.207) (34.524) (30.123)Debt Due In One Year 22.8054** 22.8555* 22.8720** 19.7185*
(11.516) (13.394) (11.517) (10.734)St. Dev. Stock Returns 310.8469*** 312.4435*** 309.0563*** 279.5555***
(42.316) (52.845) (42.351) (39.433)Cum. Stock Returns -8.9592 -8.8983 -8.9225 -8.1098
(9.160) (10.176) (9.160) (8.951)Tobin’s Average Q 2.0253 2.0891 1.8838 -5.0634***
(2.525) (3.073) (2.529) (1.311)Covenant Dummy 16.0936*** 16.1184*** 15.8926*** 14.7757***
(5.426) (6.208) (5.429) (5.306)Perf. Pricing Dummy -35.2840*** -35.4057*** -34.9444*** -32.1491***
(4.675) (5.186) (4.686) (4.437)Constant 392.3512*** 393.9182*** 394.6015*** 155.2773***
(65.726) (73.238) (65.762) (48.248)R2 0.5267 0.5269 0.5265 0.5612Hansen’s J p-val 0.3010 0.3618 0.3010Underiden. p-val 0.0000 0.0000 0.0000N 4196 4196 4196 4196* p < 0.10, ** p < .05, *** p < .01
22
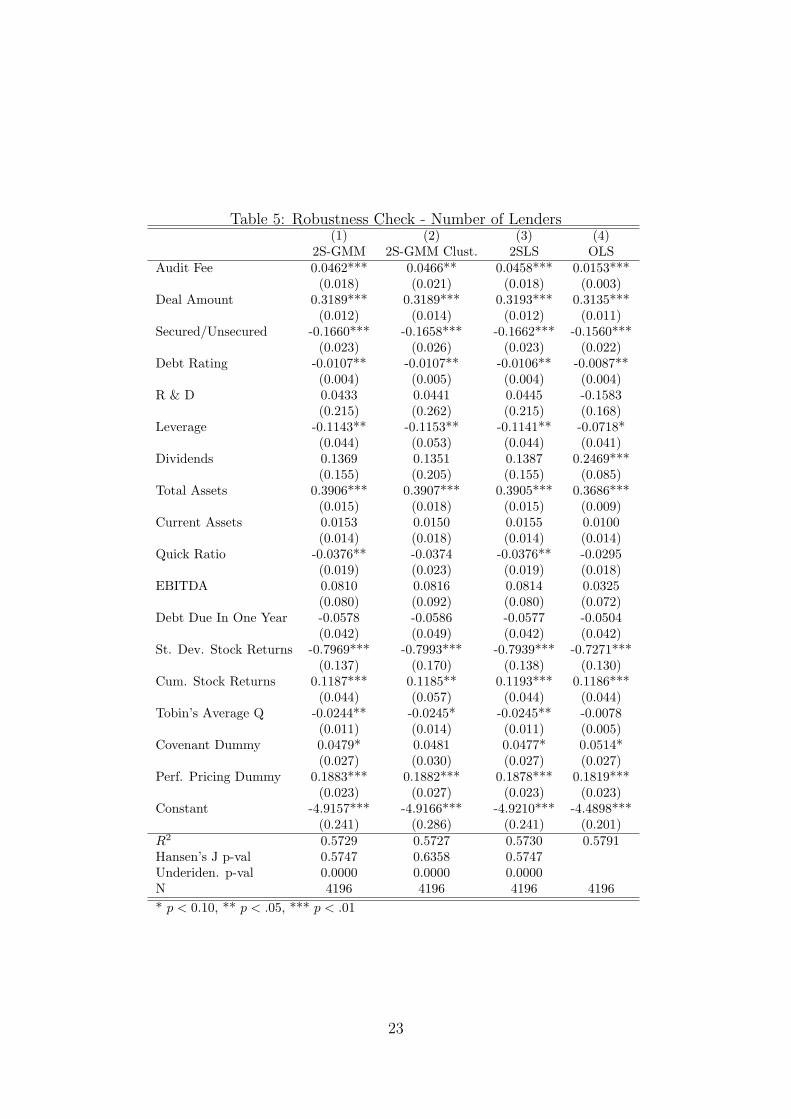
Table 5: Robustness Check - Number of Lenders(1) (2) (3) (4)
2S-GMM 2S-GMM Clust. 2SLS OLSAudit Fee 0.0462*** 0.0466** 0.0458*** 0.0153***
(0.018) (0.021) (0.018) (0.003)Deal Amount 0.3189*** 0.3189*** 0.3193*** 0.3135***
(0.012) (0.014) (0.012) (0.011)Secured/Unsecured -0.1660*** -0.1658*** -0.1662*** -0.1560***
(0.023) (0.026) (0.023) (0.022)Debt Rating -0.0107** -0.0107** -0.0106** -0.0087**
(0.004) (0.005) (0.004) (0.004)R & D 0.0433 0.0441 0.0445 -0.1583
(0.215) (0.262) (0.215) (0.168)Leverage -0.1143** -0.1153** -0.1141** -0.0718*
(0.044) (0.053) (0.044) (0.041)Dividends 0.1369 0.1351 0.1387 0.2469***
(0.155) (0.205) (0.155) (0.085)Total Assets 0.3906*** 0.3907*** 0.3905*** 0.3686***
(0.015) (0.018) (0.015) (0.009)Current Assets 0.0153 0.0150 0.0155 0.0100
(0.014) (0.018) (0.014) (0.014)Quick Ratio -0.0376** -0.0374 -0.0376** -0.0295
(0.019) (0.023) (0.019) (0.018)EBITDA 0.0810 0.0816 0.0814 0.0325
(0.080) (0.092) (0.080) (0.072)Debt Due In One Year -0.0578 -0.0586 -0.0577 -0.0504
(0.042) (0.049) (0.042) (0.042)St. Dev. Stock Returns -0.7969*** -0.7993*** -0.7939*** -0.7271***
(0.137) (0.170) (0.138) (0.130)Cum. Stock Returns 0.1187*** 0.1185** 0.1193*** 0.1186***
(0.044) (0.057) (0.044) (0.044)Tobin’s Average Q -0.0244** -0.0245* -0.0245** -0.0078
(0.011) (0.014) (0.011) (0.005)Covenant Dummy 0.0479* 0.0481 0.0477* 0.0514*
(0.027) (0.030) (0.027) (0.027)Perf. Pricing Dummy 0.1883*** 0.1882*** 0.1878*** 0.1819***
(0.023) (0.027) (0.023) (0.023)Constant -4.9157*** -4.9166*** -4.9210*** -4.4898***
(0.241) (0.286) (0.241) (0.201)R2 0.5729 0.5727 0.5730 0.5791Hansen’s J p-val 0.5747 0.6358 0.5747Underiden. p-val 0.0000 0.0000 0.0000N 4196 4196 4196 4196* p < 0.10, ** p < .05, *** p < .01
23
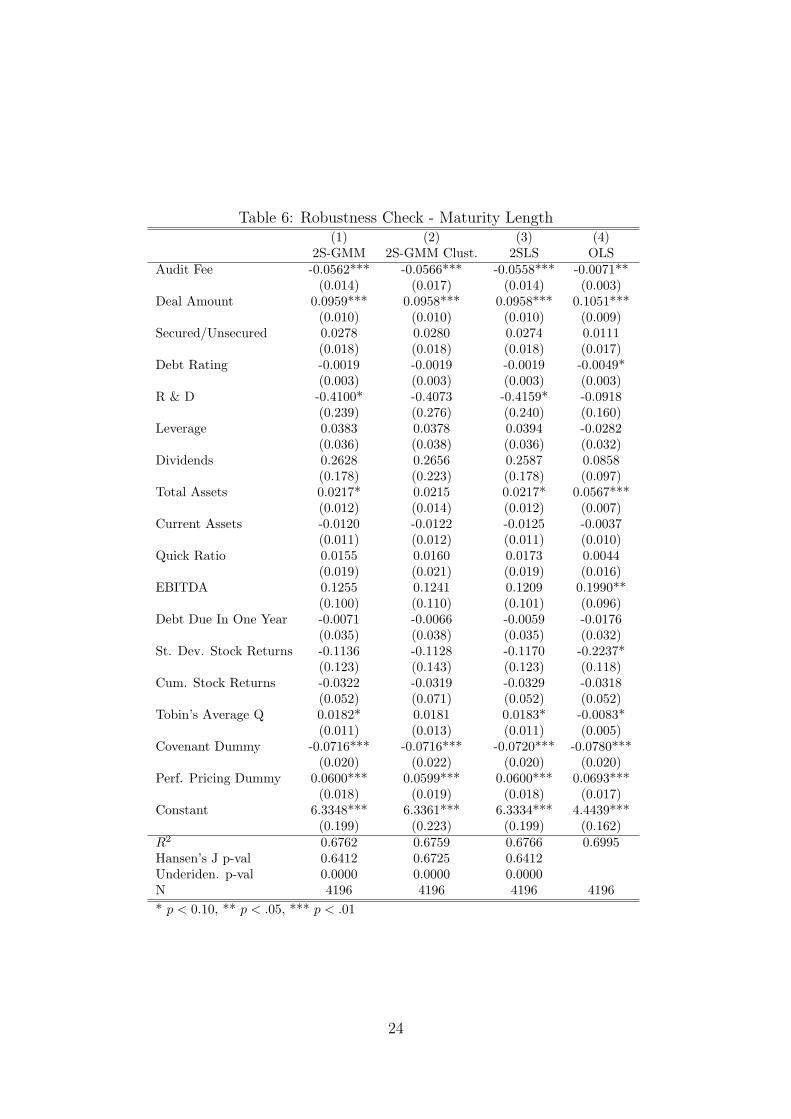
Table 6: Robustness Check - Maturity Length(1) (2) (3) (4)
2S-GMM 2S-GMM Clust. 2SLS OLSAudit Fee -0.0562*** -0.0566*** -0.0558*** -0.0071**
(0.014) (0.017) (0.014) (0.003)Deal Amount 0.0959*** 0.0958*** 0.0958*** 0.1051***
(0.010) (0.010) (0.010) (0.009)Secured/Unsecured 0.0278 0.0280 0.0274 0.0111
(0.018) (0.018) (0.018) (0.017)Debt Rating -0.0019 -0.0019 -0.0019 -0.0049*
(0.003) (0.003) (0.003) (0.003)R & D -0.4100* -0.4073 -0.4159* -0.0918
(0.239) (0.276) (0.240) (0.160)Leverage 0.0383 0.0378 0.0394 -0.0282
(0.036) (0.038) (0.036) (0.032)Dividends 0.2628 0.2656 0.2587 0.0858
(0.178) (0.223) (0.178) (0.097)Total Assets 0.0217* 0.0215 0.0217* 0.0567***
(0.012) (0.014) (0.012) (0.007)Current Assets -0.0120 -0.0122 -0.0125 -0.0037
(0.011) (0.012) (0.011) (0.010)Quick Ratio 0.0155 0.0160 0.0173 0.0044
(0.019) (0.021) (0.019) (0.016)EBITDA 0.1255 0.1241 0.1209 0.1990**
(0.100) (0.110) (0.101) (0.096)Debt Due In One Year -0.0071 -0.0066 -0.0059 -0.0176
(0.035) (0.038) (0.035) (0.032)St. Dev. Stock Returns -0.1136 -0.1128 -0.1170 -0.2237*
(0.123) (0.143) (0.123) (0.118)Cum. Stock Returns -0.0322 -0.0319 -0.0329 -0.0318
(0.052) (0.071) (0.052) (0.052)Tobin’s Average Q 0.0182* 0.0181 0.0183* -0.0083*
(0.011) (0.013) (0.011) (0.005)Covenant Dummy -0.0716*** -0.0716*** -0.0720*** -0.0780***
(0.020) (0.022) (0.020) (0.020)Perf. Pricing Dummy 0.0600*** 0.0599*** 0.0600*** 0.0693***
(0.018) (0.019) (0.018) (0.017)Constant 6.3348*** 6.3361*** 6.3334*** 4.4439***
(0.199) (0.223) (0.199) (0.162)R2 0.6762 0.6759 0.6766 0.6995Hansen’s J p-val 0.6412 0.6725 0.6412Underiden. p-val 0.0000 0.0000 0.0000N 4196 4196 4196 4196* p < 0.10, ** p < .05, *** p < .01
24