Embed Size (px)
Citation preview
University of RichmondUR Scholarship Repository
Accounting Faculty Publications Accounting
2018
The Association Between Audit Fees andAccounting Restatement Resulting fromAccounting Fraud and Clerical ErrorsDaniel Gyung PaikUniversity of Richmond, [email protected]
Taewoo Kim
Kip Krumwiede
Brandon B. Lee
Follow this and additional works at: https://scholarship.richmond.edu/accounting-faculty-publications
Part of the Accounting Commons, and the Economics Commons
This Article is brought to you for free and open access by the Accounting at UR Scholarship Repository. It has been accepted for inclusion inAccounting Faculty Publications by an authorized administrator of UR Scholarship Repository. For more information, please [email protected].
Recommended CitationPaik, Daniel Gyung, Taewoo Kim, Kip Krumwiede and Brandon B. Lee. “The Association Between Audit Fees and AccountingRestatement Resulting from Accounting Fraud and Clerical Errors.” Journal of Forensic & Investigative Accounting 10, no. 3 (December2018): 332-356.
Journal of Forensic & Investigative Accounting
Volume 10: Issue 3, July–December 2018
332
*The authors are, respectively, Professor at University of Richmond, Professor at California State University-San Bernardino, Director
of Research at IMA (Institute of Management Accountants), and Professor at Indiana University Northwest.
The Association Between Audit Fees and Accounting Restatement Resulting from Accounting Fraud and Clerical
Errors
Daniel Gyung Paik
Taewoo Kim
Kip Krumwiede
Brandon B. Lee*
Introduction
Restatements of financial reporting arise from many sources including changes in accounting rules, changes in reporting
entity, accounting errors, and fraud (or “irregularities”).1 Theory predicts that audit effort (measured by audit fees) and
financial report restatements should be negatively associated because more audit effort means that auditors should be more
likely to find errors or other issues that could lead to later restatement (Shibano 1990; Matsumura and Tucker, 1992; Lobo
and Zhao, 2013). However, other studies have found either a positive association or no association between audit fees and
subsequent restatements (Kinney et al., 2004; Stanley and DeZoort, 2007; Cao et al., 2012; Hribar, Kravet, and Wilson,
2014). There is an ongoing inconsistency between the theory and empirical findings in this area (Lobo and Zhao, 2013).
In this study, we investigate the relationship between audit fees and two specific types of restatements: those caused by
either fraud or errors. Whereas errors are unintentional misapplications of GAAP, or mistakes in data analysis, fraud is
intentional and deliberate misreporting. Prior research provides evidence that investors differentiate between errors and
irregularities (e.g., Palmrose, et al., 2004) and market reaction is greater to irregularities than to errors.
In prior audit fee studies, auditors’ effort is often estimated by audit fees (Hribar et al., 2014; Lobo and Zhao, 2013). Low-
fee audits may represent a lower level of auditor effort, which can likely lead to a higher probability of restatements. Auditors
also face far more severe penalties, such as litigation and a negative effect on their reputation, after fraud restatements than
after error restatements. As such, auditors face very different situations when auditing firms that eventually end up requiring
a restatement due to irregularities, versus those in which honest mistakes were made. In the case of potential irregularities,
auditors are more likely to discover weaknesses in internal controls or overly aggressive accounting choices and will
accordingly increase their audit testing, leading to higher audit fees (Hennes et al., 2008). In error restatement scenarios,
such errors were unintentional and because the original financial statements received a clean audit opinion, it seems less
likely that the auditing firm will detect situations that will require additional testing.
Hribar, Kravet, and Wilson (2014) find that unexplained audit fees (UAF) are a valid measure for accounting quality (AQ)
and as a predictor of restatements due to fraud.2 As accounting quality decreases, both UAF and the probability of fraud
restatements increase. Based on Hribar et al. (2014), we expect that UAF will be significantly higher for firms that make
restatements due to fraudulent reporting than firms that do not make restatements. These higher costs are the result of
auditors having to exert additional efforts to assess weak internal controls and are also compensation for increased exposure
to legal liability. Consistent with Hribar et al. (2014), our results provide strong evidence that fraud-related restatement
firms pay significantly higher audit fees during the reporting period being restated than non-fraud firms.
Hribar et al. (2014) did not include restatements due to errors in their study. In contrast to our fraud restatement expectation,
we expect that UAF for firms restating their financial statements due to unintentional accounting errors will be significantly
1 In this study, “fraud” is used interchangeably with “(intentional) irregularity” or “deliberate misreporting,” while “(clerical) errors” is
used interchangeably with “mistakes in data analyses.” 2 Accounting quality is defined as qualitative characteristics of financial information or quality of financial statements (Barth et al.,
2008; Hribar et al., 2014).
Journal of Forensic & Investigative Accounting
Volume 10: Issue 3, July–December 2018
333
lower than those for non-restatement firms. The rationale for this expectation is twofold. First, audit fees have increased
significantly in the years following the Sarbanes-Oxley Act of 2002 due to increased scrutiny of internal controls (Ghosh
and Pawlewicz, 2009; Chasan, 2015). As a result, firms are more likely to shop around for affordable audit fees. Those who
have successfully negotiated lower audit fees may be more likely to receive lower quality audits that fail to find and correct
accounting errors that will be subsequently restated. Second, previous studies suggest that audit fees and financial report
restatements are negatively associated (Shibano, 1990; Matsumura and Tucker, 1992; Lobo and Zhao, 2013). The theory is
that higher audit effort increases the likelihood that auditors will detect errors and thus reduces the likelihood of restatements
due to errors.
However, our results show that audit fees for firms restating due to accounting errors are significantly higher during the
reporting period than audit fees for firms without restatements. One explanation for these results is that auditors assess a
greater inherent risk of misstatement due to both errors and frauds. As a result, they increase substantive testing to minimize
detection risk, and therefore charge higher fees, even for error restatement firms.
We provide additional analysis on the relationship between total fees, which include audit fees and non-audit service fees,
and restatements due to fraud and clerical errors. The results are consistent with those for audit fees only. We also analyze
the relationship between non-audit fees only and restatements due to fraud and clerical errors. The results indicate that
neither of the associations is significant. Further, additional analyses using only post-SOX period data provide consistent
results, although the positive association between audit fees and fraud is not statistically significant during the post-SOX
(2003 to 2013) period. However, the positive association between audit fees and errors is consistently statistically
significant. Finally, the results hold consistent, even after controlling for internal control quality.
This study contributes to the literature relating to audit fees as a measure of accounting quality and predictor of restatement
of financial reports. Prior research suggests that unexplained audit fees are a predictor of restatements due to fraud. We find
that unexplained audit fees can also be used as a predictor of restatements due to accounting errors, even in the post-SOX
era and after controlling for previously identified predictors and internal control quality.
Prior Research and Hypotheses
Audit Fees
Theory predicts that audit effort (measured by audit fees) and financial report restatements should be negatively associated
because more audit effort means that auditors should be more likely to find errors or other issues that could lead to later
restatement (Shibano, 1990; Matsumura and Tucker, 1992; Lobo and Zhao, 2013). However, many studies have found either
a positive association or no association between audit fees and subsequent restatements (Kinney et al., 2004; Stanley and
DeZoort, 2007; Cao et al., 2012, Hribar, Kravet, and Wilson, 2014). Lobo and Zhao (2013) respond to this inconsistency
by correcting for two factors that have biased the results. After controlling for pre-audit misstatement risk using Dechow et
al.’s (2011) predicted probability of misstatement, and excluding unaudited reports (i.e., interim quarterly reports), they find
a negative association between audit effort (i.e., audit fees) and annual report restatements. Internal control is expected to
be significantly associated with audit fees because the audit process should be adjusted according to the auditors’ assessment
of the client firm’s internal control environment. Hogan and Wilkins (2008) investigate the relationship between audit fees
and internal control deficiencies to determine whether audit firms exert more effort during their audits of client firms with
internal control deficiencies. They find that, on average, a thirty-five percent increment in audit fees when there are
disclosures of internal control deficiencies. The lack of strong internal controls is a potential factor leading to financial
reporting restatements. Both non-intentional clerical accounting errors and intentional fraud are more likely to occur in
environments with weak internal controls.
Irregularities vs. Errors
Financial reporting restatements can be classified as being either accounting errors (unintentional misapplications of GAAP)
or irregularities (intentional misreporting). Hennes et al. (2008) point out the importance of distinguishing errors from
irregularities in restatement research. They define accounting irregularities as occurring when independent investigations
are undertaken by “the SEC, the Attorney General’s Office, or by the company’s Board.” Based on this indicator of
irregularities, they find that restatements result more from non-intentional errors than from intentional irregularities.
However, the consequences of fraud are much higher than those for errors. Their results show that CEO/CFO turnover rates
are higher for firms that report restatements because of intentional irregularities. Market reaction to restatements due to
Journal of Forensic & Investigative Accounting
Volume 10: Issue 3, July–December 2018
334
irregularities was minus fourteen percent versus minus two percent for errors. And almost all cases of post-restatement
replacement of the CEO/CFO occurred after restatements due to fraud.
Auditors may face very different situations when auditing a firm that will eventually report a restatement due to
irregularities, versus one where honest mistakes were made. For example, in 2003, a Big Four auditing firm (Ernst and
Young) was completing an audit of LeNature, Inc., a large beverage producer located in LaTrobe, Pennsylvania, USA. The
audit partner in charge asked the CFO if he was aware of, or suspected, any fraudulent activity within the organization. The
CFO replied candidly that he doubted the reported sales revenue. The CEO, Gregory Podlucky, would not provide key
documents to support the recorded sales figures. After considering this information and additional testing of the company’s
internal control system and documentation, the accounting firm reported its findings to the Board, which appointed an
outside law firm to investigate. Ultimately, it was discovered that Podlucky had been engaging in a massive “Ponzi scheme”
fraud over a five-year period that totaled over $700 million. Several internal control weaknesses were discovered, including
a serious lack of segregation of duties. The CEO had been maintaining two sets of books and had total control over detailed
financial records. As an example, for one year, reported sales were $287 million, whereas actual sales were less than forty
million dollars. Ultimately, Podlucky was sentenced to twenty years in prison and fined $661 million. Several other
executives and family members also were convicted and sentenced to jail.3
Hennes et al. (2008) cite examples of accounting restatements due to errors. In 2005, the CECO Environmental Corporation
restated its financial statements because management detected an error in spreadsheets aggregating small project balances
that the company used to recognize revenue. Another example is Applebee’s International, which restated its financial
statements to correct its accounting treatment for leases, after the SEC clarified its position on the treatment of certain lease
features. Many other companies in the restaurant and retail industries also corrected their accounting treatment for leases.
In both cases, there was no evidence that the restatement was due to overly aggressive accounting choices, neither to
deliberate misreporting. Possibly, the audit firms in these engagements detected the possibility of these errors, and
accordingly increased their risk assessments and testing. However, because the errors were unintentional and the original
financial statements received a clean audit opinion, it is also possible that the audit firms did not detect any issues that
required additional testing.
Financial reporting fraud is an extreme case of earnings management. Caramanis and Lennox (2008) investigate the
relationship between audit effort and earnings management (income-increasing and income-decreasing). They conduct
research based on a sample of 9,738 audits in Greece, from 1992–2002. They find that the audit effort is negatively
correlated to the reporting of aggressively high earnings, based on an abnormal accruals measure. In other words, lower
audit efforts are likely to allow managers to overstate company earnings more aggressively to meet or beat a firm’s internal,
or external, reporting goals, such as analysts’ forecasts.
As a similar line of research, Hribar et al. (2014) use audit fees to measure accounting reporting quality. They argue that
audit fees charged by the auditor provide, to some extent, a measure of the auditor’s evaluation of accounting quality.
Therefore, the unexplained audit fees can capture accounting quality. Their results show that unexplained audit fees are
negatively related to quality accounting practices. They further provide evidence that this audit fee-based measure of
accounting quality is associated with other empirical measures of accounting quality and predicts fraud and restatements,
even after controlling for other accounting quality measures.
In 2002, the U.S. Congress passed the Sarbanes-Oxley Act to improve the accuracy and reliability of corporate disclosures.4
Blankley, Hurtt, and MacGregor (2012) use a logit model to investigate the association between audit fees and the likelihood
of subsequent restatements in general, using a sample of post-SOX data. They find a negative relationship between audit
fees charged during the years prior to the filing of restatements and subsequent restatements. Their results validate a
reasonable prediction that, on average, as audit firms charge higher audit fees which are likely to be related to increased
3 See Mark Kirschner v. K&L Gates LLP, et al., Superior Court of Pennsylvania, 46 a.3d 737 (2012), 2012 PA Super 102, July 19,
2012. Retrieved from www.leagle.com/decision/In%20PACO%2020120514405 on Feb. 20, 2015. Also, CNS News, “Ex-Pa. Soft-
drink CEO Gets 20 Years in Prison,” October 23, 2011. Retrieved from http://cnsnews.com/ex-pa-soft-drink-ceo-gets-20-years-prison
on Feb. 20, 2015. 4 The Senate and House of Representatives of the United States of America (U.S. Congress) (2002), “Sarbanes-Oxley Act of 2002,”
Public Law 107-204, 107th Congress.
Journal of Forensic & Investigative Accounting
Volume 10: Issue 3, July–December 2018
335
audit work performed, the likelihood of future restatements (in general) are thus reduced (Lobo and Zhao, 2013). Both
papers used restatements in general and did not segment them by reason for restatement.
Hypotheses
For each engagement, auditors are required by Public Company Accounting Oversight Board (PCAOB) Auditing Standard
No. 8 to assess the inherent risk (misstatement due to error or fraud), control risk (misstatement that could not be prevented
or detected by the company’s internal controls), and detection risk (misstatement that could not be detected by the
substantive procedures performed) and plan their work accordingly. The higher the inherent and control risks, the more
testing auditors will have to do, more experienced staff will have to be assigned, and higher fees will be charged as a
premium for the higher audit risk (Hribar et al., 2014; Bell, Landsman, and Shackleford ,2001). Hogan and Wilkins (2008)
find evidence that additional audit fees are paid when internal control deficiencies are disclosed, which suggests that
restatement firms are likely to pay additional audit fees. Further, a lack of strong internal controls increases the possible
causes for financial reporting restatements.
Moreover, when a client firm is found to have intentionally manipulated earnings, it is detrimental to the auditors’ reputation
and leads to potential auditor litigation (Heninger, 2001; Palmrose, 1988). Prior research (Caramanis and Lennox, 2008;
DeFond and Jiambalvo, 1993; and Kinney and Martin, 1994) has found that auditors tend to disagree more with clients
about accounting choices that increase reported earnings. As a result, auditors will increase audit tests and efforts when they
suspect income-increasing earnings management, likely leading to increased audit fees. Because income-increasing earnings
manipulation is a form of intentional accounting fraud, we expect a positive relationship between audit fees and subsequent
restatements due to fraud.
Further, Hribar et al. (2014) find that unexplained higher audit fees charged are associated with client firm’s lower
accounting quality and are predictive of subsequent restatements due to fraud. Their finding is also consistent with previous
auditing research, which suggests that audit fees are positively correlated with lower accounting quality, as measured by
discretionary accruals and poor internal controls (e.g., Gul et al., 2003; Hogan and Wilkins, 2008).
In summary, a lack of strong internal controls, auditors’ concern about income-increasing earnings manipulation, and lower
accounting quality can all lead to higher audit fees and make it more likely that subsequent restatements due to fraud will
occur. Thus, we expect a positive relationship between audit fees and subsequent restatements due to fraud.
Hypothesis 1: Firms who make accounting restatements due to financial reporting fraud pay higher audit fees during
the reporting period restated than non-restatement firms.
This study also investigates whether UAF are associated with restatements due to errors. After the Sarbanes-Oxley Act
(hereafter SOX) (2002), audit fees increased sharply, due to the additional audit requirements related to the assessment of
internal controls and auditors expected legal liability (Ghosh and Pawlewicz, 2009). Total audit fees increased 103% for the
S&P 500 companies between 2001 and 2004 (Ciesielski and Weirich, 2009). According to a recent study, nearly three out
of four organizations have spent considerably more to strengthen their internal controls in 2015 as auditors seek to provide
better evidence the internal controls are working (Chasan, 2015). Hence, firms have more motivation to shop around for the
most affordable auditor.
Hribar et al. (2014) did not include restatements due to errors in their study. In contrast to our fraud restatement expectation,
we expect that UAF for firms restating their financial statements due to unintentional accounting errors will be significantly
lower than those for non-restatement firms. First, audit fees have increased significantly in the years following the Sarbanes-
Oxley Act of 2002 due to increased scrutiny of internal controls (Ghosh and Pawlewicz, 2009; Chasan, 2015). As a result,
firms are more likely to shop around for affordable audit fees which could lead to lower quality audits. Second, previous
studies suggest that higher audit fees lead to higher quality audits that make it more likely auditors will detect errors and
thus decrease the likelihood of restatements due to errors.
Of course, there are risks associated with low-cost audits. The quality of audits being undertaken is likely to be prejudiced
by resource constraints and could provide more opportunity for unethical practices. A failure by auditors to detect and
prevent all material fraud and subsequent restatements will lead to negative market reactions and litigation against auditors.
Because the consequences are far more severe for fraud restatements than those for error restatements, auditors have more
motivation to increase their substantive testing for fraud than for errors.
Journal of Forensic & Investigative Accounting
Volume 10: Issue 3, July–December 2018
336
We expect that audit fees for firms restating due to unintentional accounting errors will be significantly lower than audit
fees for non-error firms. Firms that have successfully negotiated lower audit fees are more likely to receive lower quality
audits that fail to find and correct accounting errors that must be subsequently restated. Auditors are less likely to add
additional tests as fraud indicators (e.g., income increasing earnings management practices) are less likely to exist.
Therefore, when audit fees are set low, auditors are not as likely to exert sufficient effort and audit tests to detect financial
reporting errors. The low unexplained audit fees become an indicator of lower quality accounting and a decreased chance
of auditors catching clerical accounting errors during their audits.
Further, we expect that restatements due to errors will follow the traditional theory that higher audit effort increases the
likelihood that auditors will detect errors, thus decreasing the likelihood of restatements due to errors. Previous studies
suggest that audit fees and financial report restatements are in general are negatively associated (Shibano, 1990; Matsumura
and Tucker, 1992; Lobo and Zhao, 2013). As accounting errors are supposed to be unintentional, more “eyes” on the
reporting should lead to fewer errors in the final financial reports. For these reasons, we propose our second hypothesis.
Hypothesis 2: Firms who make accounting restatements due to clerical financial reporting errors pay lower audit fees
during the reporting period restated than non-restatement firms.
Sample and Research Design
Sample
We construct samples of non-restatement firms and restatement firms using Audit Analytics and Compustat databases for
the period of 1999 through to 2013. Specifically, audit fee data and non-reliance (fraud and clerical error) data are obtained
from Audit Analytics. The Audit Analytics Non-Reliance database contains detailed information about firms’ restatements
that were reported due to fraud or clerical errors.5 This database also includes the data about the duration of restatement
periods. Next Audit Analytics and Compustat databases were linked to obtain accounting information for these restatement
and non-restatement firms. When linking Audit Analytics non-reliance data to Compustat, the data is screened so that the
filing dates of reporting non-reliance (fraud or error) information to the SEC happen after the fiscal year-end dates of
restatement periods.
Using this sample, we examine the association between audit fees and restatements due to clerical errors and fraud while
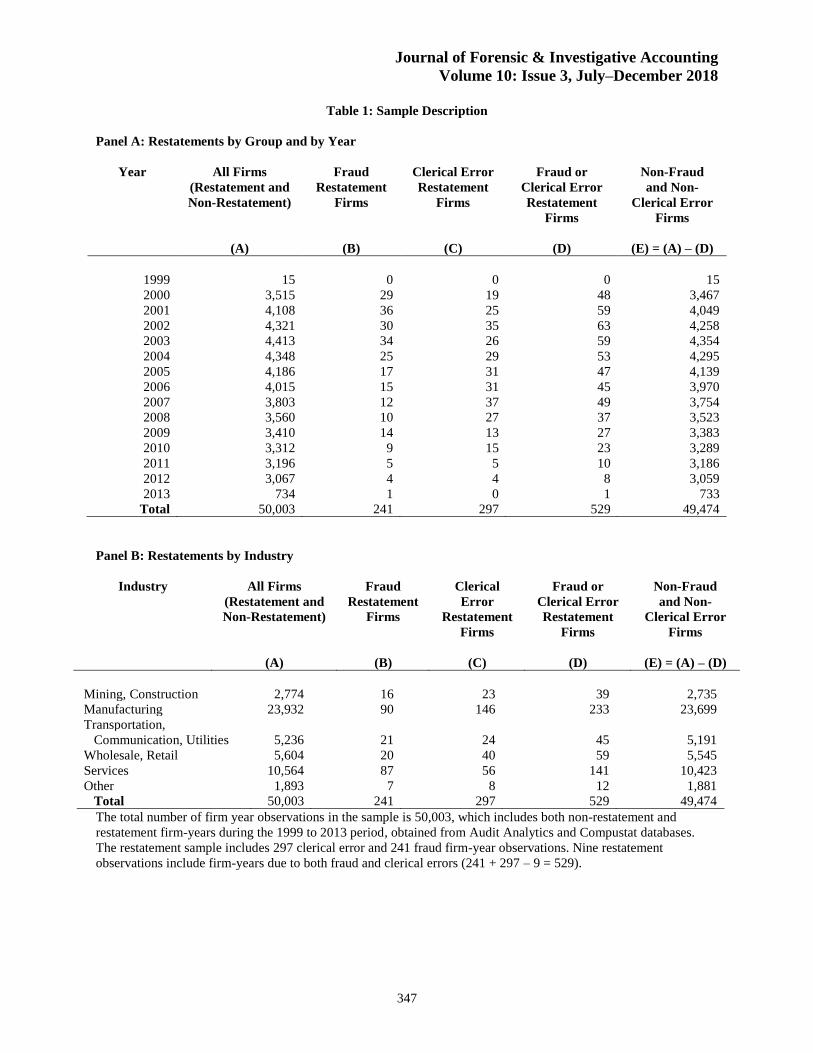
controlling for other factors that may affect audit fees. Panel A in Table 1 presents the sample description in terms of
restatements by group and year. The number of clerical error firm-year observations is 297, whilst the number of fraud firm-
year observations is 241. The total number of firm year observations is 50,003, which includes both non-restatement and
restatement firm-years during the 1999 to 2013 period. Panel B in Table 1 shows the distribution of restatements due to
fraud or clerical errors across industries. Following prior restatement studies (Blankley et al., 2012), we exclude firms in
the financial service industry (SIC 6000-6999) in our sample. [see Table 1, pg 347]
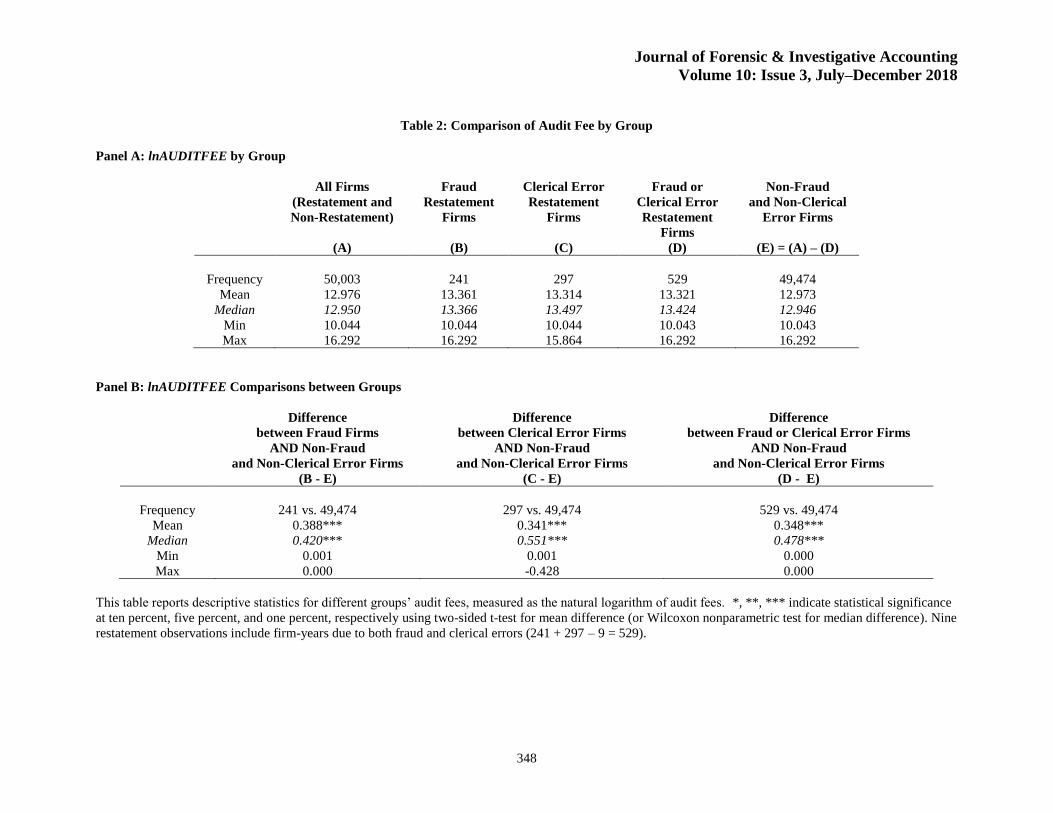
Table 2 reports descriptive statistics for different groups’ audit fees, measured as the natural logarithm of audit fees. The
results show that the audit fees paid by firms that make restatements due to fraud tend to be higher than those of non-fraud
and non-clerical error restatement firms. The mean natural log value of audit fees for fraud firms is 13.361, which is higher
than the mean for non-fraud and non-clerical error firms of 12.973 (see Table 2, Panel A). The mean difference of 0.388 is
statistically significant at the one percent level, using a two-sided t-test (p < 0.01; see Table 2, Panel B). Furthermore, the
median difference of 0.420 is statistically significant at the one percent level, using a Wilcoxon z-test.
In addition, firms that make restatements due to clerical accounting errors pay higher audit fees (mean 13.314) than firms
that do not make fraud or error restatements (mean 12.973). As shown in Table 2, Panel B, the mean (median) difference of
0.341 (0.551) is statistically significant at the one percent level using a two-sided t-test (Wilcoxon z-test). [see Table 2, pg
348]
5 In Audit Analytics Non-Reliance Restatements database, we used the variable “restatement-fraud (#32)” to obtain our sample
restatement firms due to frauds. To obtain sample restatement firms due to clerical errors, we used the variable “restatement-clerical
error (#25).”
Journal of Forensic & Investigative Accounting
Volume 10: Issue 3, July–December 2018
337
Audit Fee Model
To test Hypotheses 1 and 2, we run a regression model using the entire non-restatement and restatement (due to fraud and
clerical errors) sample. The dependent variable of the model is the natural logarithm of audit fees, and the independent
variables include two indicator (dichotomous) variables: FRAUD (equals one if the firm’s restatement involves fraud,
otherwise zero) and ERROR (equals one if the firm’s restatement involves unintentional errors, otherwise zero). As
discussed in the hypotheses section, we predict the sign of the coefficient of FRAUD variable will be positive and the sign
of the coefficient of ERROR variable will be negative. To test for the effect of fraud or errors on audit fees (Hypotheses 1
and 2), the following audit fee model is estimated:
lnAUDITFEE = β0 + β1FRAUD + β2ERROR + β3lnSIZE + β4lnSEGMENT
+ β5FOREIGN + β6INHERENT + β7QUICKRATIO + β8DEBT + β9ROA
+ β10LOSS + β11OPINION+ β12BIG4 + β13TENURE + ɛ (A)
where,
lnAUDITFEE = the natural logarithm of the audit fee
FRAUD = an indicator variable which is equal to one, if a firm belongs to the fraud
restatement sample, or is zero otherwise
ERROR = an indicator variable which is equal to one if a firm belongs to the clerical error
restatement sample or zero otherwise
lnSIZE = the natural logarithm of total assets
lnSEGMENT = the natural logarithm of the number of business segments
FOREIGN = an indicator variable which is equal to one if a firm has foreign currency
translation adjustments. This variable indicates firms with international
operations
INHERENT = inventory and receivables divided by total assets
QUICKRATIO = the ratio of current assets minus inventories to current liabilities
DEBT = long-term debt divided by total assets
ROA = income before extraordinary items, divided by lagged total assets
LOSS = is equal to one, if a firm reports net losses
OPINION = is equal to one, if a firm has nonstandard audit reports
BIG4 = is equal to one, if a firm uses Big 4/5/6/8 auditors
TENURE = is equal to one, if a firm has an auditor tenure of two or less years
Model (A) includes several control variables that previous studies have found to be associated with audit fees. These control
variables are related to either client attributes (client size, client complexity, etc.), or auditor attributes (Big Four, auditor
tenure, etc.). Previous research found that client size is the most dominant determinant of audit fees (e.g., Simunic,1980;
Whisenant, Sankaraguruswamy, and Raghunandan, 2003; Hay, Knechel, and Wong, 2006). Client SIZE is measured as the
natural logarithm of total assets and is expected to be positively related with audit fees.
Simunic (1980), Hackenbrack and Knechel (1997), and Hay et al. (2006) have found that the more complex the client's
business, the higher the audit fees. The two most common proxies for client complexity are the number of business segments
and the existence of foreign subsidiaries. SEGMENT is measured as the natural logarithm of the number of business
segments and is predicted to have a positive relationship with audit fees. FOREIGN indicates whether or not a firm has
international operations. FOREIGN is a dichotomous variable equal to one if a firm has foreign currency translation
adjustments and has an expected positive association with audit fees.
Previous research suggests that audit fees are positively associated with the level of inherent risk (e.g., Simunic, 1980;
Newton and Ashton, 1989; Stice, 1991). Following previous studies, inherent risk (INHERENT) is measured as the sum of
inventory and receivables, divided by total assets, and is expected to have a positive association with audit fees. In addition,
previous studies (e.g., Simunic, 1980; Hay et al., 2006) have found that client’s leverage and profitability, which are
measures of the risk of client failure, are significantly associated with audit fees. Consistent with previous research,
QUICKRATIO is defined as the ratio of current assets minus inventories to current liabilities. DEBT measures the debt ratio
and is computed by dividing long-term debt by total assets. Both the quick ratio and debt ratio are predicted to have negative
relationships with audit fees. Client profitability is measured with the two most common measures suggested by previous
Journal of Forensic & Investigative Accounting
Volume 10: Issue 3, July–December 2018
338
studies. ROA is measured as income before extraordinary items, divided by lagged total assets. ROA is expected to have a
negative association with audit fees. LOSS is an indicator (0,1) variable equal to one if a firm reports a net loss. The expected
association between audit fees and LOSS is positive.
The last three control variables in Model (A) are indicator (0,1) variables related to auditor attributes. OPINION is equal to
one if a firm has a non-standard audit report. Audit quality is measured with the variable, BIG4, which is equal to one if a
client firm uses Big Four auditors. Previous studies strongly support a positive association between Big Four auditors and
audit fees.6 Lastly, TENURE is equal to one if a client has an auditor tenure of two or less years. Because a client may
change its auditor to obtain a reduced audit fee from a new audit firm, the predicted associated between audit fees and
TENURE is negative.
Results
Univariate Results
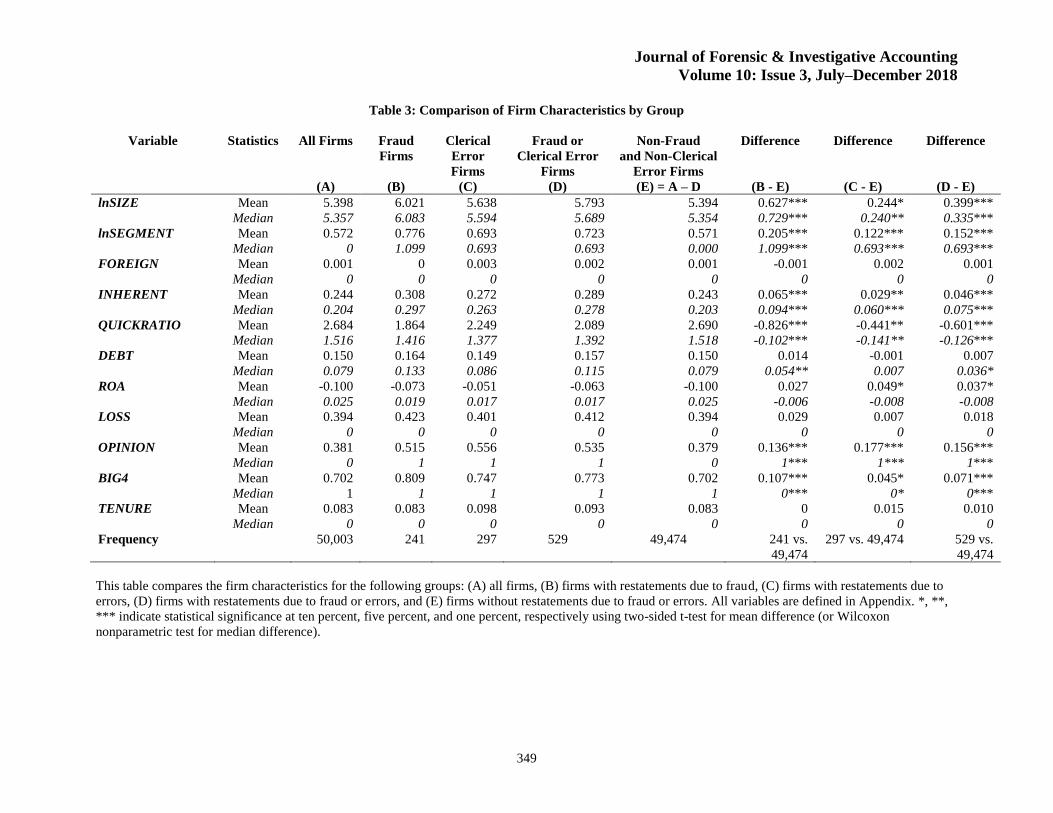
In Table 3, the firm-specific characteristics of Fraud restatement and Error restatement sample firms are reported using
univariate comparisons. As shown, fraud restatement firms are significantly larger than non-fraud and non-clerical-error
firms. Additionally, the size of clerical-error firms is significantly larger than that of non-fraud and non-clerical-error firms.
[see Table 3, pg 349]
Regarding the client’s business complexity, the comparison results indicate that both fraud and error restatement firms have
a significantly greater number of business segments (lnSEGMENT) than non-fraud & non-clerical-error firms. These results
provide evidence that firm size and complexity are likely to be associated with fraud and clerical-error restatements.
However, there is no statistically significant difference for the FOREIGN variable between groups. The results also indicate
that fraud (clerical-error) restatement firms have a significantly higher inherent risk than non-fraud and non-clerical-error
firms.
For the client’s leverage and profitability, the results show that fraud and clerical-error restatement firms have significantly
lower quick ratios than non-fraud and non-clerical-error firms. Although there is no statistically significant difference in
means for DEBT between groups, the median DEBT for fraud restatement firms is significantly higher than the median
DEBT of non-fraud and non-clerical-error firms. Regarding firm profitability, neither the mean nor median ROA for fraud
or clerical-error restatement firms are significantly different from that of the mean ROA of non-fraud and non-clerical-error
firms. The results also show that LOSS is not statistically significantly different between groups.
Comparisons of the three indicator variables related to auditor attributes show that both fraud and clerical-error restatement
firms have significantly more audit problems (OPINION) than non-fraud and non-clerical error firms. They are also more
likely have been audited more frequently by BIG4 auditors than non-fraud and non-clerical error firms. However, TENURE
is not statistically significantly different between groups. In sum, these univariate comparison results suggest that significant
differences exist between fraud and error restatement firms and non-restatement firms in various audit-firm and client
characteristics.
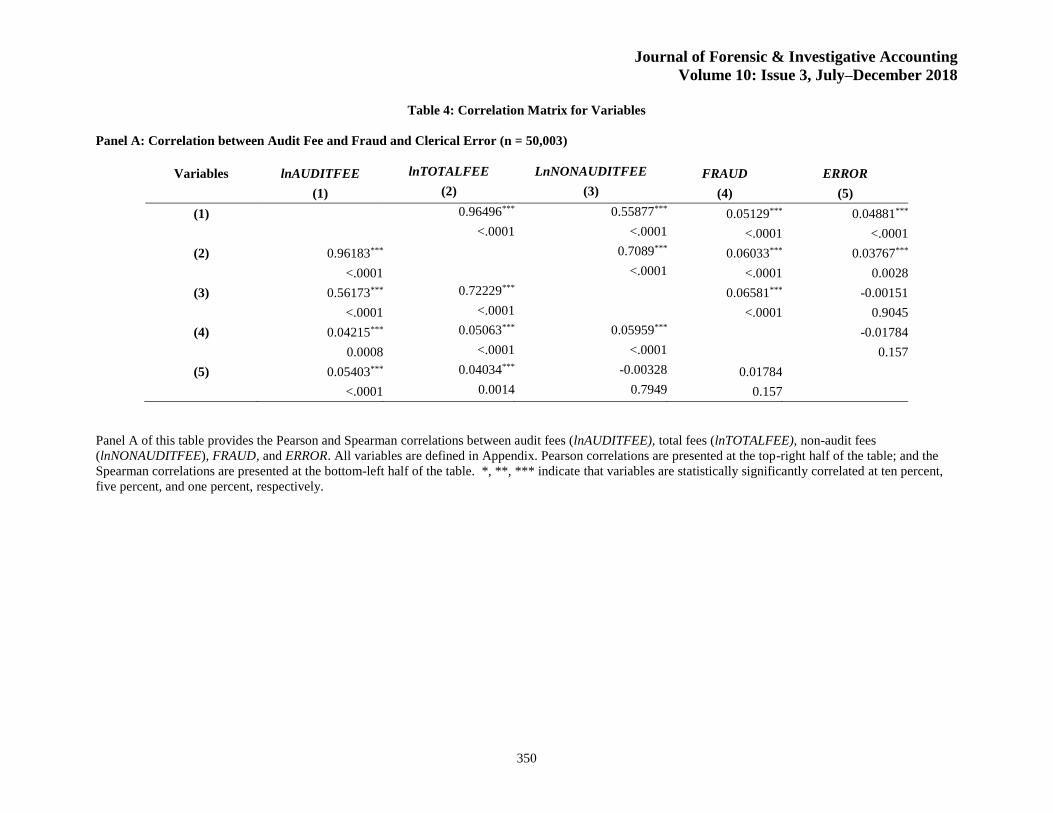
Panel A, shown in Table 4, presents the results of the Pearson and Spearman correlation analyses between our key variables
of interest. As hypothesized, FRAUD has a statistically significant positive relation to audit fees (lnAUDITFEE) (p < 0.0001,
two-sided t-test). Unlike our prediction, however, ERROR has also a positive correlation to lnAUDITFEE. FRAUD also has
a significant correlation with total fees (lnTOTALFEE) and non-audit service fees (lnNONAUDITFEE). In contrast, clerical
errors (ERROR) are significantly correlated with audit fees and total fees but are not statistically significantly correlated
with non-audit service fees. [see Table 4, pg 350]
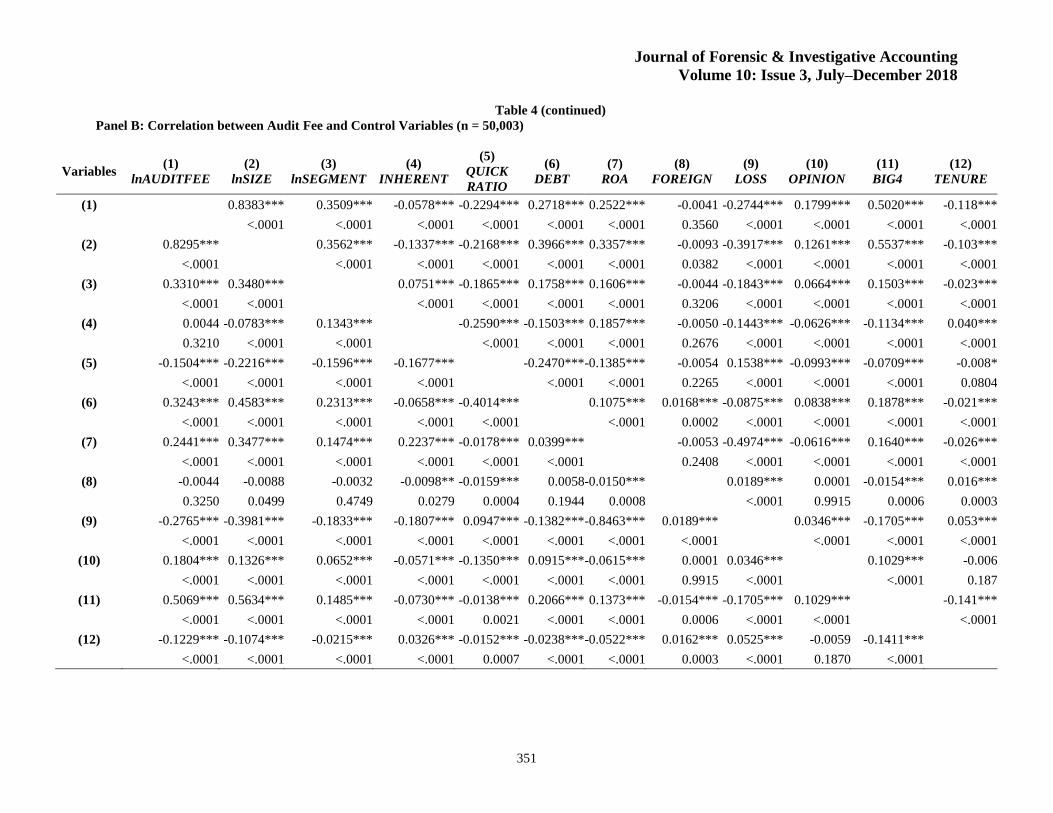
In Panel B of Table 4, the Pearson correlations (presented at the upper-right) report that the audit fee variable, lnAUDITFEE,
is significantly and positively related to lnSIZE, lnSEGMENT, DEBT, ROA, OPINION, and BIG4. In contrast, audit fee is
significantly and negatively related to INHERENT, QUICKRATIO, LOSS, and TENURE. The Spearman correlations
(presented at the lower-left) report consistent results with the Pearson correlations, except that the significant negative
correlation between lnAUDITFEE and INHERENT does not exist. Taken together, the Table 4 results are consistent with
the argument that restatements due to fraud and errors, in addition to other factors, are significantly associated with the level
6 Such studies include Simunic (1980), DeFond et al. (2000), Whisenant et al. (2003), Chaney et al. (2004), and Lawrence, Minutti-
Meza, and Zhang (2011). For an extensive review of this literature, see Hay et al. (2006).
Journal of Forensic & Investigative Accounting
Volume 10: Issue 3, July–December 2018
339
of audit fees. Therefore, to investigate the true relationship between audit fee and restatements due to fraud and errors, we
must control for variation in these other confounding auditor and client characteristics.
Multivariate Results
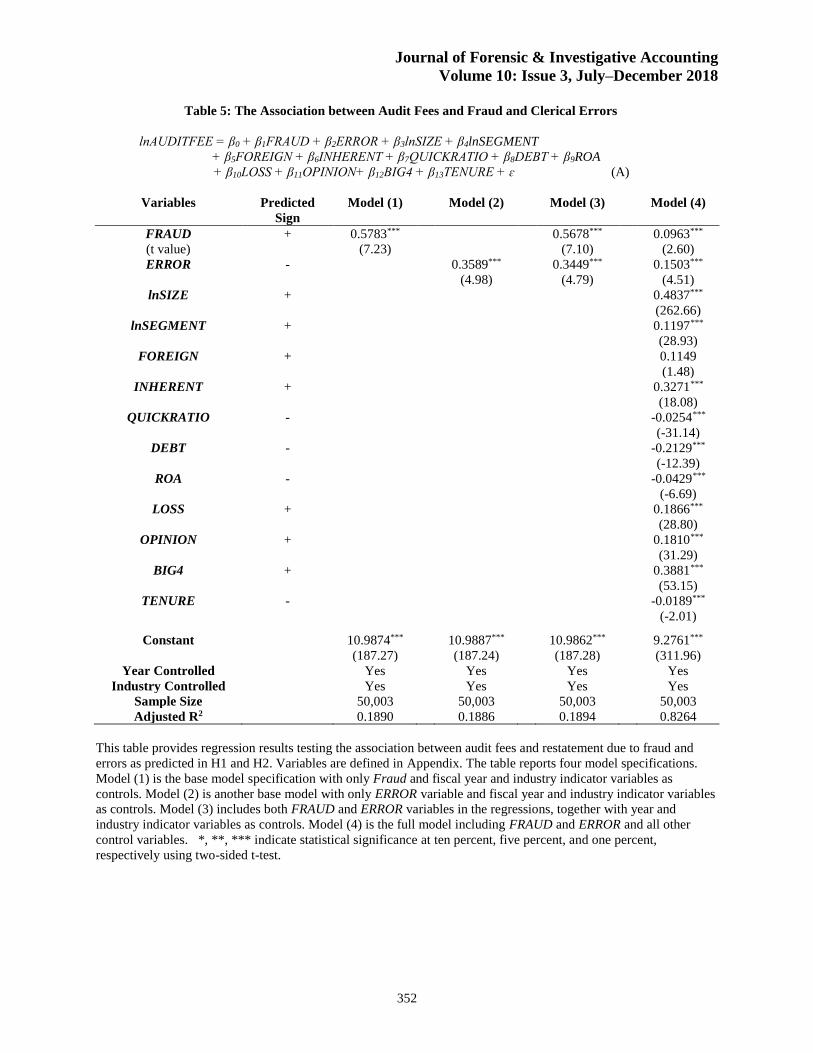
Table 5 presents the primary multivariate results, using the regression Model (A) to test the association between audit fees
and restatements due to fraud and errors as predicted in H1 and H2. We report four model specifications in Table 5. Model
(1) is a base model specification, with only Fraud plus fiscal year and industry controls variables. The coefficient for
FRAUD is positive at 0.5783, which means that higher audit fees are charged during the restatement periods when audit
client firms commit financial statement fraud. The t-statistic of 7.23 indicates that this estimated coefficient is statistically
significant at the 0.01 level (two-sided t-test), and the adjusted-R2 is 0.189. [see Table 5, pg 352]
Model (2) in Table 5 is another base model, with only ERROR plus fiscal year and industry indicator variables as controls.
Contrary to our prediction in H2, the results report that the coefficient for ERROR is also positive (0.3589) and statistically
significant at the 0.01 level (two-sided t-test) and the adjusted-R2 of Model (2) is 0.1886. This positive coefficient on ERROR
means that higher audit fees are also charged during restatement periods caused by clerical errors. Model (3) includes both
FRAUD and ERROR variables in the regressions, together with year and industry indicator variables as controls. The signs
on the two variables of our interest, FRAUD and ERROR, are unchanged and remain significantly positive.
Model (4) is the full model including the two variables of interest, FRAUD and ERROR, plus all other control variables.
The overall Adjusted-R2 of Model (4) increases to 0.8264, which indicates that the model explains almost eighty-three
percent of the variation in audit fees. Except for FOREIGN, the coefficients of all control variables in Model (4) have the
expected signs and are statistically significant. Also, the coefficient BIG4 is 0.3881 (t-value = 53.15) and the coefficient
TENURE is -0.0189 (t-value = -2.01). These results suggest that audit fees are positively associated with audit quality and
that a client is likely to change its auditor to obtain a reduced audit fee from a new audit firm (i.e., evidence of audit fee
‘low-balling’).
FRAUD has a positive coefficient of 0.0963, which is lower than the base models but still statistically significant at the one
percent level (t-value of 2.60), supporting H1. This result indicates that firms that restate their financial statements due to
accounting fraud are more likely to have paid higher audit fees during the reporting period being restated than non-
restatement firms.
The ERROR variable is found to have a positive coefficient of 0.1503 (p < 0.01), thus failing to support H2. Hypothesis 2
predicts that when audit fees are low, auditors less likely to exert sufficient efforts to detect clerical financial reporting errors
during their audits. However, the results in Table 5 indicate that firms that make restatements due to clerical accounting
errors have paid higher audit fees during restatement periods. Perhaps auditors charge higher audit fees because these clients
also exhibit a weak internal control environment during the restatement periods. This possibility is addressed later.
Restatements and Total Fees
We conducted additional analyses to investigate the association between total fees and fraud and clerical errors. Total fees
include audit fees and non-audit service fees, such as fees for consulting services offered to the client firm. Non-audit service
fees have garnered the recent attention of researchers (e.g., Feldmann and Read, 2010), as well as that of legislators (U.S.
Senate, 2002), as the receipt of non-audit service fees may create the economic bond between the auditor and the client and
weaken auditor independence. However, several critics have argued that what matters most are the total fees that an audit
firm receives from its client, including both audit and non-audit fees (Blay and Geiger, 2013; Kinney and Libby, 2002; SEC,
2000a and 2000b).
Research of non-audit fees has shown mixed results in explaining audit fees. Several previous studies (e.g., Bell, Landsman,
and Shackelford, 2001; Davis, Ricchiute, and Trompeter, 1993; and Simunic, 1984) provide evidence that a significant
association exists between audit and non-audit fees, which suggests that non-audit fees influence audit fees, and vice versa.
On the other hand, Whisenant, Sankaraguruswamy, and Raghunandan (2003) and Dhaliwal, Gleason, Heitzman, and
Melendrez (2008) find no association between audit and non-audit fees.
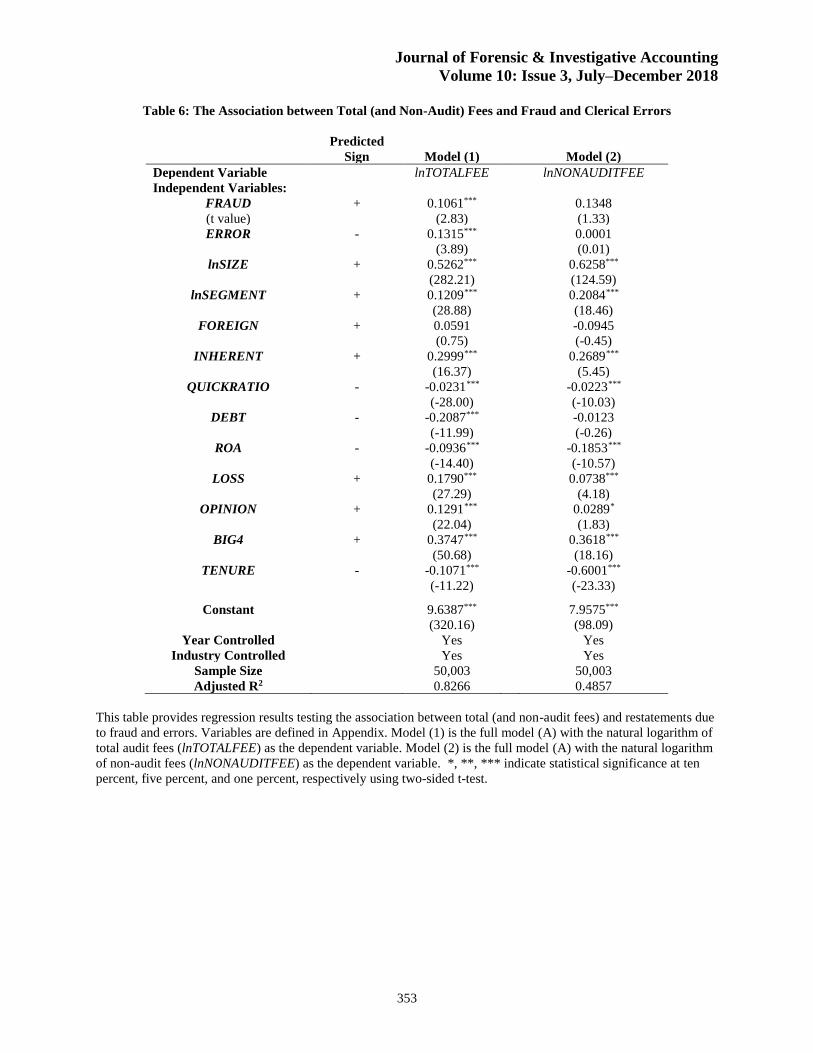
The results using total fees are presented in Table 6. We report two model specifications with total fees (lnTOTALFEE) and
non-audit fees (lnNON-AUDITFEE) (e.g., consulting fees) as the dependent variables. Model (1) incorporates all other
control variables with the two variables that interest us, FRAUD and ERROR, with lnTOTALFEE as the dependent variable.
Journal of Forensic & Investigative Accounting
Volume 10: Issue 3, July–December 2018
340
As shown, the results are consistent with the findings reported for Model (4) in Table 5, indicating that firms that restate
their financial statements due to both fraud and clerical errors have paid higher total fees (audit plus non-audit service fees)
during restatement periods. [see Table 6, pg 353]
In Table 6, Model (2) has the same independent variables as Model (1) but the dependent variable is lnNON-AUDITFEE to
investigate the association between non-audit service fees and restatements due to fraud and clerical errors. Koh, Rajgopal,
and Srinivasan (2013), using non-audit service fee data from 1978 to 1980, find evidence that non-audit services provided
by audit firms are related to improved earnings and audit quality, resulting from the spillover effect of enhanced knowledge
gained by delivering both audit and non-audit services. The results of Model (2) presented in Table 6 indicate the signs on
FRAUD and ERROR are positive but not statistically significant.
Overall, the results reported in Table 6 of a significantly positive relationship between combined audit and non-audit fees
and subsequent restatements, taken together with the non-significant relationship between non-audit fees and restatements,
indicate that the enhanced knowledge spillover effect of increased non-audit fees (such as consulting fees) do not prevent
subsequent financial restatements.
Impact of Sarbanes Oxley (SOX) Act
The Sarbanes Oxley (SOX) Act in 2002 has significantly altered the audit process, which potentially affects audit fees. In
Table 7, results are reported using the regression Model (A) for only the post-SOX period. The number of firm-years used
for the analyses reduced from 50,003 observations for full sample years (1999–2013) to 38,044 for the post-SOX sample
years (2003–2013). The adjusted-R2 of Model (1) of 0.8315 indicates that the model still explains over eighty-three percent
of audit fees even when only using the sample data from the post-SOX period. However, the coefficient of FRAUD, 0.0747,
is positive but smaller than the coefficient obtained using full sample years as reported in Table 5 (0.0963, t-value = 2.60).
Moreover, this positive coefficient of FRAUD is only marginally statistically significant (t-value = 1.59; one-sided p-value
= 0.0554) but is nevertheless still consistent with H1. [see Table 7, pg 354]
In contrast, the coefficient of ERROR is 0.1542, which is significantly positive (t-value = 4.03; two-sided p-value < 0.01).
The magnitude of this coefficient is comparable to the size of the ERROR coefficient of 0.1503 (t-value = 4.51, and p <
0.01) obtained using the full sample years reported in Table 5. In summary, these results are consistent with the main
findings reported in Table 5 that audit fees are positively associated with restatements caused by both fraud and clerical
errors.
In Table 7, the results of the regression Models (2) and (3) are reported with total fees and non-audit service fees as the
dependent variables, respectively, and using only post-SOX period data (2003–2013). In Model (2), the adjusted-R2 of the
model with total fees as the dependent variable is 0.8375. FRAUD has a statistically significantly positive coefficient of
0.1131 (t-value = 2.43, p < 0.05), which indicates that total fees (audit fees and non-audit fees) paid by firms during the
restatement years are higher than those for non-restatement firms. Also, ERROR has a positive coefficient of 0.1209 and is
significant at the one percent level (t-value = 3.18). These results are consistent with the findings for total fees as reported
in Table 6 using the entire sample years (1999–2013), indicating that firms that restate their financial statements due to
accounting fraud or clerical errors have paid higher total fees (the sum of audit and non-audit service fees) during the
restatement periods.
As reported in Table 7, Model (3), we find that non-audit service fees are not significantly related to FRAUD and ERROR,
using only post-SOX data. These results are consistent with the findings reported in Table 6 using the entire sample for
1999–2013. In summary, the results reported in Table 7 provide evidence that firms that restate their financial statements
due to accounting fraud or clerical errors in the post-SOX era have paid higher audit fees and total fees during the restatement
periods.
Internal Control Environment
The results in Tables 5, 6, and 7 indicate that firms that make restatements due to clerical accounting errors have paid higher
audit fees during restatement periods. Perhaps auditors charge higher audit fees because these clients also exhibit a weak
internal control environment during the restatement periods. To address this possibility, we conducted additional analysis
that incorporates a “weak internal controls” (WEAKIC) variable in the model. As directed by Section 404 of the Sarbanes-
Oxley Act of 2002, companies are required to include a report of the company's internal control over financial reporting in
their annual reports. WEAKIC is measured as an indicator (0,1) variable equal to one if the firm’s internal control report has
Journal of Forensic & Investigative Accounting
Volume 10: Issue 3, July–December 2018
341
a qualified opinion. Table 8 presents the results of the additional analysis. In Models (1) and (2), the overall Adjusted-R2 is
0.7706, which is slightly smaller, primarily because the “weak internal control (WEAKIC)” variable has only 20,773
observations. The results reported in Table 8 for Models (1) and (2) strengthen our main findings of a positive relationship
between audit fees with restatements due to fraud and error because it shows the results are robust to the inclusion of the
variable capturing weak internal control environment. [see Table 8, pg 355]
Unexplained FRAUD and Unexplained ERROR
Lastly, in addition to using our main Model (A) to test H1 and H2, we develop an alternative two-stage model to test our
two hypotheses. The results of this analysis are presented in Table 9. In the first stage of the two-stage model, we use a logit
model with FRAUD and ERROR as the dependent variables, and all other control variables in Model (A) are incorporated
as control variables in the model. We obtain the error terms from the first-stage logit model and use them as the two
independent variables of interest, Unexplained FRAUD and Unexplained ERROR, in the second-stage OLS model. These
two new variables are designed to capture the unexplained portion of FRAUD and ERROR by other control variables. [see
Table 9, pg 356]
The results in Table 9, Model (3) indicate that Unexplained FRAUD has a statistically significant positive coefficient of
0.1392 (t-value = 2.28, p < 0.05) when the dependent variable is audit fees. Likewise, Unexplained ERROR has a positive
coefficient of 0.0813, and is also statistically significant (t-value = 1.97, p < .05). These results are consistent with our main
findings reported in Tables 5 and 6, which indicates that firms that restate their financial statements due to accounting fraud
or clerical errors have paid higher audit fees and total fees during the restatement periods.
Conclusion
In this study, we find evidence that the relationship between audit fees and restatements of financial statements does not
always follow theory. Specifically, we find that restatements due to errors (i.e., unintentional misapplications of GAAP or
mistakes in data analysis) and those due to frauds (i.e., intentional and deliberate misreporting), both have higher ex ante
unexplained audit fees during the restatement period than firms without fraud or error restatements. Prior research findings
have been inconsistent regarding the relationship between fees and restatements—some finding a positive relationship and
some finding a negative relationship. This study is unique in that it focuses on restatements caused by fraud and by errors.
It also considers auditors’ and managers’ behavior regarding the economic bonding of auditors with clients and managers’
attempts to lower audit fees.
These fraud-related restatement results are consistent with our prediction that fraud-related restatement companies tend to
pay significantly higher audit fees during the restatement periods. Lower accounting quality leads to higher unexplained
audit fees and also increases the risk of fraud restatements. It is also consistent with the idea that firms with weak internal
control environments will require additional audit steps and also increases the risk of fraud restatements. This finding is
also consistent with Hribar, Kravet, and Wilson (2014) who find that unexplained audit fees (UAF) are a valid measure for
accounting quality and as a predictor of restatements due to fraud.
However, the unintentional error-related restatement results are not consistent with our prediction that error-related
restatement companies tend to pay significantly lower audit fees during the restatement periods. Our findings indicate that
higher audit fees are also charged to firms who make clerical errors during restatement years (when errors are produced).
One potential explanation for this result is that auditors may also require additional audit steps for companies that have weak
internal controls. However, in additional testing we found the results were robust even when including a variable
representing a weak internal control environment.
Today’s firms have increasing motivation to shop around for the most affordable auditor as total audit fees and internal
controls costs continue to rise. Although client firms may shop around for the lowest audit fees to control costs, auditors
may be so concerned about their reputation and potential audit litigation that they are unwilling to lower their audit quality
standards to attract new clients. Therefore, this “shop around” strategy may only be financially beneficial for those firms
with adequate internal controls in place, good accounting quality, and lower inherent risk of errors.
The findings of our study seem to contradict the findings of Blankley, Hurtt, and MacGregor (2012), which found a negative
relationship between audit fees charged during the years prior to the filing of restatements and the likelihood of subsequent
restatements in general using post-SOX data set. Blankley et al. (2012) suggest that higher audit fees lead to more audit
work performed, which reduces the likelihood of future restatements. That reasoning seems rational. But then why do we
Journal of Forensic & Investigative Accounting
Volume 10: Issue 3, July–December 2018
342
find exactly the opposite? It is important to understand the different research designs between the two studies. First, we use
a sample of firms that announced restatements caused only by managers’ intentional frauds or unintentional clerical errors,
whereas Blankley et al. (2012) considered all restatements (e.g., those due to new accounting standard requirements, etc.).
Second, they use only firms audited by Big N firms whereas we use an indicator variable to control for variation due to
having a Big N auditor (which are known to charge higher fees). Third, Blankley et al. (2012) also exclude firms that
changed auditors to “avoid the potential problems associated with lowballing to gain new clients and to eliminate the
possibility of a differential response to reporting policies between the predecessor and the successor auditors.” We include
these firms and use a variable “TENURE” to indicate auditor tenure of two years or less. Fourth, their sample period begins
in the year SOX was passed in 2002 and extends through 2009. Our post-SOX sample period runs from 2003–2013.
In the model that we use for further additional analyses, we control for weak internal control quality. Our results accordingly
indicate that auditors charge higher audit fees in consideration of weak internal control when they perform audits during
restatement years. However, charging higher audit fees does not prevent subsequent material restatements from occurring.
This evidence provides a challenge for auditors to consider developing and pursuing specific audit tasks and skills to identify
clients’ forensic accounting behavior leading to subsequent fraud and error findings.
Our finding of a positive relationship between audit fees and subsequent fraud-related and error-related restatements, after
controlling for internal control quality, is consistent with the results of both Blay and Geiger (2013) and Stanley and DeZoort
(2007). Audit failure and subsequent restatement is likely to be the result of weakened auditor independence. In this setting,
the economic bonding of auditors with clients reduces auditors’ independence to employ the adequate expert skepticism,
which is needed to judge situations objectively, based on the correct interpretation of audit evidence.
Journal of Forensic & Investigative Accounting
Volume 10: Issue 3, July–December 2018
343
Appendix: Variable Definitions
lnAUDITFEE = the natural logarithm of the audit fee;
lnTOTALFEE = the natural logarithm of the total fee;
lnNONAUDITFEE = the natural logarithm of the non-audit service fee;
FRAUD = an indicator variable which is equal to one, if a firm belongs to the fraud
restatement sample, or is zero otherwise;
ERROR = an indicator variable which is equal to one if a firm belongs to the clerical
error restatement sample or zero otherwise;
lnSIZE = the natural logarithm of total assets;
lnSEGMENT = the natural logarithm of the number of business segments;
FOREIGN = an indicator variable which is equal to one if a firm has foreign currency
translation adjustments. This variable indicates firms with international
operations;
INHERENT = inventory and receivables divided by total assets;
QUICKRATIO = the ratio of current assets minus inventories to current liabilities;
DEBT = long-term debt divided by total assets;
ROA = income before extraordinary items, divided by lagged total assets
LOSS = is equal to one, if a firm reports net losses;
OPINION = is equal to one, if a firm has nonstandard audit reports;
BIG4 = is equal to one, if a firm uses Big 4/5/6/8 auditors;
TENURE = is equal to one, if a firm has an auditor tenure of two or less years;
WEAKIC
= is equal to one, if a firm has nonstandard report of internal control over
financial reporting.
Journal of Forensic & Investigative Accounting
Volume 10: Issue 3, July–December 2018
344
References
Barth, M. E., Landsman, W. R., and Lang, M. H. (2008). International accounting standards and accounting quality.
Journal of Accounting Research 46(3), 467–498.
Bell, T. B., Landsman, W. R., and Shackelford, D.A. (2001). Auditors’ perceived business risk and audit fees: Analysis
and evidence. Journal of Accounting Research 39 (1), 35–43.
Blankely, A, Hurtt, D. N., and MacGregor, J. E. (2012). Abnormal audit fees and restatements. Auditing: A Journal of
Practice and Theory 31 (1), 79–96.
Blay, A. D. and Geiger, M. A. (2013). Auditor fees and auditor independence: Evidence from going concern reporting
decisions. Contemporary Accounting Research 30 (2), 579–606.
Cao, Y., Myers, L. A., and Omer, T. C. (2012). Does company reputation matter for financial reporting quality? Evidence
from restatements. Contemporary Accounting Research 29 (3), 956–990.
Caramanis, C. and Lennox, C. (2008). Audit effort and earnings management. Journal of Accounting and Economics
45(1), 116–138.
Chaney P. K., Jeter, D. C., and Shivakumar, L. (2004). Self‐selection of auditors and audit pricing in private firms. The
Accounting Review 79 (1), 51–72.
Chasan, E. (2015). Fees rise as internal controls draw auditor focus. The Wall Street Journal. (March 19). Accessed online
on May 25, 2015 at http://blogs.wsj.com/cfo/2015/05/19/fees-rise-as-internal-controls-draw-auditor-focus
Ciesielski, J. T. and Weirich, T. R. (2009). Current SEC/PCAOB accounting and auditing issues. Journal of Corporate
Accounting 20 (4), 41–47.
Davis, L. R., Ricchiute, D. N., and Trompeter, G. (1993). Audit effort, audit fees, and the provision of non-audit services
to audit clients. The Accounting Review 68 (1), 135–150.
Dechow P. M., Ge, W., Larson, C. R., and Sloan, R. G. (2011). Predicting material accounting misstatements.
Contemporary Accounting Research 28 (1), 17–82.
DeFond, M. and Jiambalvo, J. (1993). Factors related to auditor‐client disagreements over income‐increasing accounting
methods. Contemporary Accounting Research 9(2), 415–431.
DeFond M. L., Francis, J. R., and Wong, T. J. (2000). Auditor industry specialization and market segmentation: Evidence
from Hong Kong. Auditing: A Journal of Practice and Theory 19 (1), 49–66.
Dhaliwal, D. S., Gleason, C. A., Heitzman, S., and Melendrez, K. (2008). Auditor fees and cost of debt. Journal of
Accounting, Auditing, and Finance 23 (1), 1–22.
Feldmann, D. A. and Read, W. J. (2010). Auditor conservatism after Enron. Auditing: A Journal of Practice and Theory
29(1), 267–278.
Ghosh, A., and Pawlewicz, R. (2009). Recent trends in audit and non–audit fees. Auditing: A Journal of Practice and
Theory 28(2), 171–197.
Gul, F. A., Chen, C., and Tsui, J. (2003). Discretionary accounting accruals, managers’ incentives, and audit fees.
Contemporary Accounting Research 20 (3), 441–464.
Hackenbrack K. and Knechel, W. R. (1997). Resource allocation decisions in audit engagements. Contemporary
Accounting Research 14 (3), 481–499.
Hay, D. C., Knechel, W. R., and Wong, N. (2006). Audit fees: A meta–analysis of the effect of supply and demand
attributes. Contemporary Accounting Research 23, 141–191.
Heninger, W. G. (2001). The association between auditor litigation and abnormal accruals. The Accounting Review, 76(1),
111–126.
Journal of Forensic & Investigative Accounting
Volume 10: Issue 3, July–December 2018
345
Hennes, K., Leone, A., and Miller, B. (2008). The importance of distinguishing errors from irregularities in restatement
research: The case of restatements and CEO/CFO turnover. The Accounting Review 83(6), 1487–1519.
Hogan, C. E. and Wilkins, M. S. (2008). Evidence on the audit risk model: Do auditors increase audit fees in the presence
of internal control deficiencies? Contemporary Accounting Research 25, 219–242.
Hribar, P., Kravet, T., and Wilson, R. (2014). A new measure of accounting quality. Review of Accounting Studies 19 (1),
506–538.
Kinney, W. R. and Martin, R. D. (1994). Does auditing reduce bias in financial reporting? A review of audit–related
adjustment studies. Auditing–a Journal of Practice and Theory 13(1), 149–156.
Kinney, W. R., and Libby, R. (2002). Discussion of the relation between auditors’ fees for non–audit services and
earnings management. The Accounting Review 77 (Supplement), 107–14.
Kinney, W. R., Palmrose, Z. V., and Scholz, S. (2004). Auditor independence, non-audit services, and restatements: Was
the U.S. government right? Journal of Accounting Research 42 (3), 561–588.
Koh, K., Rajgopal, S., and Srinivasan, S. (2013). Non–audit services and financial reporting quality: Evidence from 1978
to 1980. Review of Accounting Studies 18, 1–33.
Lawrence A., Minutti–Meza, M., and Zhang, P. (2011). Can Big Four versus non–Big Four differences in audit-quality
proxies be attributed to client characteristics? The Accounting Review 86 (1), 259–286.
Lobo, G. J., and Zhao, Y. (2013). Relation between audit effort and financial report misstatements: Evidence from
quarterly and annual restatements. The Accounting Review 88 (4), 1385–1412.
Matsumura, E. M., and Tucker, R. (1992). Fraud detection: A theoretical foundation. The Accounting Review 67 (4), 753–
782.
Newton, J. D. and Ashton, R. H. (1989). The association between audit technology and audit delay. Auditing–a Journal of
Practice and Theory 8, 22–37.
Palmrose, Z. V. (1988). An analysis of auditor litigation and audit service quality. Accounting Review 63 (1), 55–73.
Palmrose, Z. V., Richardson, V. J. and Scholz, S. (2004). Determinants of the market reactions to restatement
announcements. Journal of Accounting and Economics 37, 59–89.
Sarbanes–Oxley Act (SOX). (2002). The Public Company Accounting Reform and Investor Protection Act. Pub. L. 107–
204, 116 stat. 745. Washington, DC: Government Printing Office.
Securities and Exchange Commission (SEC). (2000a). Proposed rule: Revision of the Commission’s auditor independence
requirements. Release Nos. 33–7870; 34-42994. Washington, DC: SEC.
Securities and Exchange Commission (SEC). (2000b). Revision of the Commission’s auditor independence requirements.
Release Nos. 33–7919; 34-43602. Washington, DC: SEC.
Shibano, T. (1990). Assessing audit risk from errors and irregularities. Journal of Accounting Research 28 (3), 110–140.
Simunic, D. A. (1980). The pricing of audit services: Theory and evidence. Journal of Accounting Research 18 (1), 161–
190.
Simunic, D. A. (1984). Auditing, consulting, and auditor independence. Journal of Accounting Research 22 (2), 679–702.
Stanley, J. D. and DeZoort, F. T. (2007). Audit firm tenure and financial restatements: An analysis of industry
specialization and fee effects. Journal of Accounting and Public Policy 26, 131–159.
Stice, J. D. (1991). Using financial and market information to identify pre–engagement factors associated with lawsuits
against auditors. The Accounting Review 66(3), 516–533.
U.S. Senate. 2002. Oversight Hearing on Accounting and Investor Protection Issues Raised by Enron and Other Public
Companies. U.S. Senate Committee on Banking, Housing and Urban Affairs (February 12, 26, and 27; March 5,
6, and 14, 2002). Washington, DC: U.S. Senate.
Journal of Forensic & Investigative Accounting
Volume 10: Issue 3, July–December 2018
346
Whisenant, S., Sankaraguruswamy, S., and Raghunandan, K. (2003). Evidence on the joint determination of audit and
non–audit fees. Journal of Accounting Research 41 (4),721–44.
Journal of Forensic & Investigative Accounting
Volume 10: Issue 3, July–December 2018
347
Table 1: Sample Description
Panel A: Restatements by Group and by Year
Year All Firms
(Restatement and
Non-Restatement)
Fraud
Restatement
Firms
Clerical Error
Restatement
Firms
Fraud or
Clerical Error
Restatement
Firms
Non-Fraud
and Non-
Clerical Error
Firms
(A) (B) (C) (D) (E) = (A) – (D)
1999 15 0 0 0 15
2000 3,515 29 19 48 3,467
2001 4,108 36 25 59 4,049
2002 4,321 30 35 63 4,258
2003 4,413 34 26 59 4,354
2004 4,348 25 29 53 4,295
2005 4,186 17 31 47 4,139
2006 4,015 15 31 45 3,970
2007 3,803 12 37 49 3,754
2008 3,560 10 27 37 3,523
2009 3,410 14 13 27 3,383
2010 3,312 9 15 23 3,289
2011 3,196 5 5 10 3,186
2012 3,067 4 4 8 3,059
2013 734 1 0 1 733
Total 50,003 241 297 529 49,474
Panel B: Restatements by Industry
Industry All Firms
(Restatement and
Non-Restatement)
Fraud
Restatement
Firms
Clerical
Error
Restatement
Firms
Fraud or
Clerical Error
Restatement
Firms
Non-Fraud
and Non-
Clerical Error
Firms
(A) (B) (C) (D) (E) = (A) – (D)
Mining, Construction 2,774 16 23 39 2,735
Manufacturing 23,932 90 146 233 23,699
Transportation,
Communication, Utilities 5,236 21 24 45 5,191
Wholesale, Retail 5,604 20 40 59 5,545
Services 10,564 87 56 141 10,423
Other 1,893 7 8 12 1,881
Total 50,003 241 297 529 49,474
The total number of firm year observations in the sample is 50,003, which includes both non-restatement and
restatement firm-years during the 1999 to 2013 period, obtained from Audit Analytics and Compustat databases.
The restatement sample includes 297 clerical error and 241 fraud firm-year observations. Nine restatement
observations include firm-years due to both fraud and clerical errors (241 + 297 – 9 = 529).
Journal of Forensic & Investigative Accounting
Volume 10: Issue 3, July–December 2018
348
Table 2: Comparison of Audit Fee by Group
Panel A: lnAUDITFEE by Group
All Firms
(Restatement and
Non-Restatement)
Fraud
Restatement
Firms
Clerical Error
Restatement
Firms
Fraud or
Clerical Error
Restatement
Firms
Non-Fraud
and Non-Clerical
Error Firms
(A) (B) (C) (D) (E) = (A) – (D)
Frequency 50,003 241 297 529 49,474
Mean 12.976 13.361 13.314 13.321 12.973
Median 12.950 13.366 13.497 13.424 12.946
Min 10.044 10.044 10.044 10.043 10.043
Max 16.292 16.292 15.864 16.292 16.292
Panel B: lnAUDITFEE Comparisons between Groups
Difference
between Fraud Firms
AND Non-Fraud
and Non-Clerical Error Firms
Difference
between Clerical Error Firms
AND Non-Fraud
and Non-Clerical Error Firms
Difference
between Fraud or Clerical Error Firms
AND Non-Fraud
and Non-Clerical Error Firms
(B - E) (C - E) (D - E)
Frequency 241 vs. 49,474 297 vs. 49,474 529 vs. 49,474
Mean 0.388*** 0.341*** 0.348***
Median 0.420*** 0.551*** 0.478***
Min 0.001 0.001 0.000
Max 0.000 -0.428 0.000
This table reports descriptive statistics for different groups’ audit fees, measured as the natural logarithm of audit fees. *, **, *** indicate statistical significance
at ten percent, five percent, and one percent, respectively using two-sided t-test for mean difference (or Wilcoxon nonparametric test for median difference). Nine
restatement observations include firm-years due to both fraud and clerical errors (241 + 297 – 9 = 529).
Journal of Forensic & Investigative Accounting
Volume 10: Issue 3, July–December 2018
349
Table 3: Comparison of Firm Characteristics by Group
Variable Statistics All Firms
Fraud
Firms
Clerical
Error
Firms
Fraud or
Clerical Error
Firms
Non-Fraud
and Non-Clerical
Error Firms
Difference
Difference
Difference
(A) (B) (C) (D) (E) = A – D (B - E) (C - E) (D - E)
lnSIZE Mean 5.398 6.021 5.638 5.793 5.394 0.627*** 0.244* 0.399***
Median 5.357 6.083 5.594 5.689 5.354 0.729*** 0.240** 0.335***
lnSEGMENT Mean 0.572 0.776 0.693 0.723 0.571 0.205*** 0.122*** 0.152***
Median 0 1.099 0.693 0.693 0.000 1.099*** 0.693*** 0.693***
FOREIGN Mean 0.001 0 0.003 0.002 0.001 -0.001 0.002 0.001
Median 0 0 0 0 0 0 0 0
INHERENT Mean 0.244 0.308 0.272 0.289 0.243 0.065*** 0.029** 0.046***
Median 0.204 0.297 0.263 0.278 0.203 0.094*** 0.060*** 0.075***
QUICKRATIO Mean 2.684 1.864 2.249 2.089 2.690 -0.826*** -0.441** -0.601***
Median 1.516 1.416 1.377 1.392 1.518 -0.102*** -0.141** -0.126***
DEBT Mean 0.150 0.164 0.149 0.157 0.150 0.014 -0.001 0.007
Median 0.079 0.133 0.086 0.115 0.079 0.054** 0.007 0.036*
ROA Mean -0.100 -0.073 -0.051 -0.063 -0.100 0.027 0.049* 0.037*
Median 0.025 0.019 0.017 0.017 0.025 -0.006 -0.008 -0.008
LOSS Mean 0.394 0.423 0.401 0.412 0.394 0.029 0.007 0.018
Median 0 0 0 0 0 0 0 0
OPINION Mean 0.381 0.515 0.556 0.535 0.379 0.136*** 0.177*** 0.156***
Median 0 1 1 1 0 1*** 1*** 1***
BIG4 Mean 0.702 0.809 0.747 0.773 0.702 0.107*** 0.045* 0.071***
Median 1 1 1 1 1 0*** 0* 0***
TENURE Mean 0.083 0.083 0.098 0.093 0.083 0 0.015 0.010
Median 0 0 0 0 0 0 0 0
Frequency 50,003 241 297 529 49,474 241 vs.
49,474
297 vs. 49,474 529 vs.
49,474
This table compares the firm characteristics for the following groups: (A) all firms, (B) firms with restatements due to fraud, (C) firms with restatements due to
errors, (D) firms with restatements due to fraud or errors, and (E) firms without restatements due to fraud or errors. All variables are defined in Appendix. *, **,
*** indicate statistical significance at ten percent, five percent, and one percent, respectively using two-sided t-test for mean difference (or Wilcoxon
nonparametric test for median difference).
Journal of Forensic & Investigative Accounting
Volume 10: Issue 3, July–December 2018
350
Table 4: Correlation Matrix for Variables
Panel A: Correlation between Audit Fee and Fraud and Clerical Error (n = 50,003)
Variables lnAUDITFEE lnTOTALFEE LnNONAUDITFEE FRAUD ERROR
(1) (2) (3) (4) (5)
(1) 0.96496*** 0.55877*** 0.05129*** 0.04881***
<.0001 <.0001 <.0001 <.0001
(2) 0.96183*** 0.7089*** 0.06033*** 0.03767***
<.0001 <.0001 <.0001 0.0028
(3) 0.56173*** 0.72229*** 0.06581*** -0.00151
<.0001 <.0001 <.0001 0.9045
(4) 0.04215*** 0.05063*** 0.05959*** -0.01784
0.0008 <.0001 <.0001 0.157
(5) 0.05403*** 0.04034*** -0.00328 0.01784
<.0001 0.0014 0.7949 0.157
Panel A of this table provides the Pearson and Spearman correlations between audit fees (lnAUDITFEE), total fees (lnTOTALFEE), non-audit fees
(lnNONAUDITFEE), FRAUD, and ERROR. All variables are defined in Appendix. Pearson correlations are presented at the top-right half of the table; and the
Spearman correlations are presented at the bottom-left half of the table. *, **, *** indicate that variables are statistically significantly correlated at ten percent,
five percent, and one percent, respectively.
Journal of Forensic & Investigative Accounting
Volume 10: Issue 3, July–December 2018
351
Table 4 (continued)
Panel B: Correlation between Audit Fee and Control Variables (n = 50,003)
Variables (1)
lnAUDITFEE
(2)
lnSIZE
(3)
lnSEGMENT
(4)
INHERENT
(5)
QUICK
RATIO
(6)
DEBT
(7)
ROA
(8)
FOREIGN
(9)
LOSS
(10)
OPINION
(11)
BIG4
(12)
TENURE
(1) 0.8383*** 0.3509*** -0.0578*** -0.2294*** 0.2718*** 0.2522*** -0.0041 -0.2744*** 0.1799*** 0.5020*** -0.118***
<.0001 <.0001 <.0001 <.0001 <.0001 <.0001 0.3560 <.0001 <.0001 <.0001 <.0001
(2) 0.8295*** 0.3562*** -0.1337*** -0.2168*** 0.3966*** 0.3357*** -0.0093 -0.3917*** 0.1261*** 0.5537*** -0.103***
<.0001 <.0001 <.0001 <.0001 <.0001 <.0001 0.0382 <.0001 <.0001 <.0001 <.0001
(3) 0.3310*** 0.3480*** 0.0751*** -0.1865*** 0.1758*** 0.1606*** -0.0044 -0.1843*** 0.0664*** 0.1503*** -0.023***
<.0001 <.0001 <.0001 <.0001 <.0001 <.0001 0.3206 <.0001 <.0001 <.0001 <.0001
(4) 0.0044 -0.0783*** 0.1343*** -0.2590*** -0.1503*** 0.1857*** -0.0050 -0.1443*** -0.0626*** -0.1134*** 0.040***
0.3210 <.0001 <.0001 <.0001 <.0001 <.0001 0.2676 <.0001 <.0001 <.0001 <.0001
(5) -0.1504*** -0.2216*** -0.1596*** -0.1677*** -0.2470*** -0.1385*** -0.0054 0.1538*** -0.0993*** -0.0709*** -0.008*
<.0001 <.0001 <.0001 <.0001 <.0001 <.0001 0.2265 <.0001 <.0001 <.0001 0.0804
(6) 0.3243*** 0.4583*** 0.2313*** -0.0658*** -0.4014*** 0.1075*** 0.0168*** -0.0875*** 0.0838*** 0.1878*** -0.021***
<.0001 <.0001 <.0001 <.0001 <.0001 <.0001 0.0002 <.0001 <.0001 <.0001 <.0001
(7) 0.2441*** 0.3477*** 0.1474*** 0.2237*** -0.0178*** 0.0399*** -0.0053 -0.4974*** -0.0616*** 0.1640*** -0.026***
<.0001 <.0001 <.0001 <.0001 <.0001 <.0001 0.2408 <.0001 <.0001 <.0001 <.0001
(8) -0.0044 -0.0088 -0.0032 -0.0098** -0.0159*** 0.0058 -0.0150*** 0.0189*** 0.0001 -0.0154*** 0.016***
0.3250 0.0499 0.4749 0.0279 0.0004 0.1944 0.0008 <.0001 0.9915 0.0006 0.0003
(9) -0.2765*** -0.3981*** -0.1833*** -0.1807*** 0.0947*** -0.1382*** -0.8463*** 0.0189*** 0.0346*** -0.1705*** 0.053***
<.0001 <.0001 <.0001 <.0001 <.0001 <.0001 <.0001 <.0001 <.0001 <.0001 <.0001
(10) 0.1804*** 0.1326*** 0.0652*** -0.0571*** -0.1350*** 0.0915*** -0.0615*** 0.0001 0.0346*** 0.1029*** -0.006
<.0001 <.0001 <.0001 <.0001 <.0001 <.0001 <.0001 0.9915 <.0001 <.0001 0.187
(11) 0.5069*** 0.5634*** 0.1485*** -0.0730*** -0.0138*** 0.2066*** 0.1373*** -0.0154*** -0.1705*** 0.1029*** -0.141***
<.0001 <.0001 <.0001 <.0001 0.0021 <.0001 <.0001 0.0006 <.0001 <.0001 <.0001
(12) -0.1229*** -0.1074*** -0.0215*** 0.0326*** -0.0152*** -0.0238*** -0.0522*** 0.0162*** 0.0525*** -0.0059 -0.1411***
<.0001 <.0001 <.0001 <.0001 0.0007 <.0001 <.0001 0.0003 <.0001 0.1870 <.0001
Journal of Forensic & Investigative Accounting
Volume 10: Issue 3, July–December 2018
352
Table 5: The Association between Audit Fees and Fraud and Clerical Errors
lnAUDITFEE = β0 + β1FRAUD + β2ERROR + β3lnSIZE + β4lnSEGMENT
+ β5FOREIGN + β6INHERENT + β7QUICKRATIO + β8DEBT + β9ROA
+ β10LOSS + β11OPINION+ β12BIG4 + β13TENURE + ɛ (A)
Variables Predicted
Sign
Model (1) Model (2) Model (3) Model (4)
FRAUD + 0.5783*** 0.5678*** 0.0963***
(t value) (7.23) (7.10) (2.60)
ERROR - 0.3589*** 0.3449*** 0.1503***
(4.98) (4.79) (4.51)
lnSIZE + 0.4837***
(262.66)
lnSEGMENT + 0.1197***
(28.93)
FOREIGN + 0.1149
(1.48)
INHERENT + 0.3271***
(18.08)
QUICKRATIO - -0.0254***
(-31.14)
DEBT - -0.2129***
(-12.39)
ROA - -0.0429***
(-6.69)
LOSS + 0.1866***
(28.80)
OPINION + 0.1810***
(31.29)
BIG4 + 0.3881***
(53.15)
TENURE - -0.0189***
(-2.01)
Constant
10.9874***
10.9887***
10.9862***
9.2761***
(187.27) (187.24) (187.28) (311.96)
Year Controlled Yes Yes Yes Yes
Industry Controlled Yes Yes Yes Yes
Sample Size 50,003 50,003 50,003 50,003
Adjusted R2 0.1890 0.1886 0.1894 0.8264
This table provides regression results testing the association between audit fees and restatement due to fraud and
errors as predicted in H1 and H2. Variables are defined in Appendix. The table reports four model specifications.
Model (1) is the base model specification with only Fraud and fiscal year and industry indicator variables as
controls. Model (2) is another base model with only ERROR variable and fiscal year and industry indicator variables
as controls. Model (3) includes both FRAUD and ERROR variables in the regressions, together with year and
industry indicator variables as controls. Model (4) is the full model including FRAUD and ERROR and all other
control variables. *, **, *** indicate statistical significance at ten percent, five percent, and one percent,
respectively using two-sided t-test.
Journal of Forensic & Investigative Accounting
Volume 10: Issue 3, July–December 2018
353
Table 6: The Association between Total (and Non-Audit) Fees and Fraud and Clerical Errors
Predicted
Sign Model (1) Model (2)
Dependent Variable lnTOTALFEE lnNONAUDITFEE
Independent Variables:
FRAUD + 0.1061*** 0.1348
(t value) (2.83) (1.33)
ERROR - 0.1315*** 0.0001
(3.89) (0.01)
lnSIZE + 0.5262*** 0.6258***
(282.21) (124.59)
lnSEGMENT + 0.1209*** 0.2084***
(28.88) (18.46)
FOREIGN + 0.0591 -0.0945
(0.75) (-0.45)
INHERENT + 0.2999*** 0.2689***
(16.37) (5.45)
QUICKRATIO - -0.0231*** -0.0223***
(-28.00) (-10.03)
DEBT - -0.2087*** -0.0123
(-11.99) (-0.26)
ROA - -0.0936*** -0.1853***
(-14.40) (-10.57)
LOSS + 0.1790*** 0.0738***
(27.29) (4.18)
OPINION + 0.1291*** 0.0289*
(22.04) (1.83)
BIG4 + 0.3747*** 0.3618***
(50.68) (18.16)
TENURE - -0.1071*** -0.6001***
(-11.22) (-23.33)
Constant
9.6387***
7.9575***
(320.16) (98.09)
Year Controlled Yes Yes
Industry Controlled Yes Yes
Sample Size 50,003 50,003
Adjusted R2 0.8266 0.4857
This table provides regression results testing the association between total (and non-audit fees) and restatements due
to fraud and errors. Variables are defined in Appendix. Model (1) is the full model (A) with the natural logarithm of
total audit fees (lnTOTALFEE) as the dependent variable. Model (2) is the full model (A) with the natural logarithm
of non-audit fees (lnNONAUDITFEE) as the dependent variable. *, **, *** indicate statistical significance at ten
percent, five percent, and one percent, respectively using two-sided t-test.
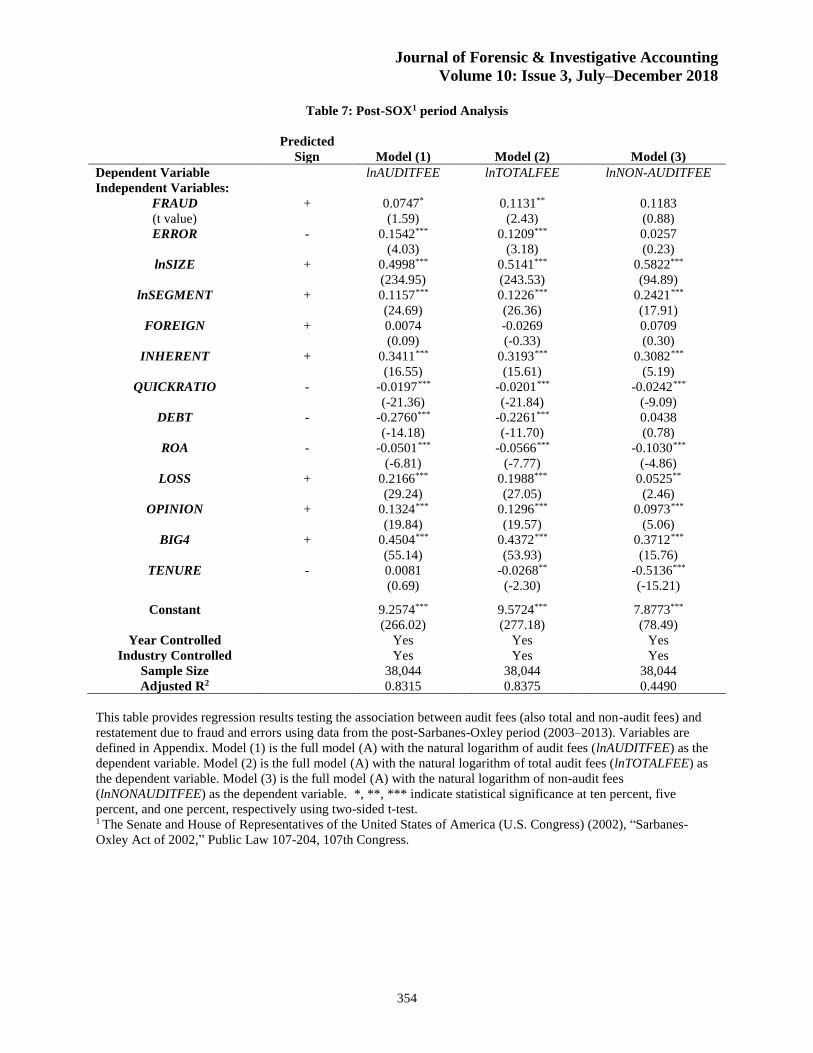
Journal of Forensic & Investigative Accounting
Volume 10: Issue 3, July–December 2018
354
Table 7: Post-SOX1 period Analysis
Predicted
Sign Model (1) Model (2) Model (3)
Dependent Variable lnAUDITFEE lnTOTALFEE lnNON-AUDITFEE
Independent Variables:
FRAUD + 0.0747* 0.1131** 0.1183
(t value) (1.59) (2.43) (0.88)
ERROR - 0.1542*** 0.1209*** 0.0257
(4.03) (3.18) (0.23)
lnSIZE + 0.4998*** 0.5141*** 0.5822***
(234.95) (243.53) (94.89)
lnSEGMENT + 0.1157*** 0.1226*** 0.2421***
(24.69) (26.36) (17.91)
FOREIGN + 0.0074 -0.0269 0.0709
(0.09) (-0.33) (0.30)
INHERENT + 0.3411*** 0.3193*** 0.3082***
(16.55) (15.61) (5.19)
QUICKRATIO - -0.0197*** -0.0201*** -0.0242***
(-21.36) (-21.84) (-9.09)
DEBT - -0.2760*** -0.2261*** 0.0438
(-14.18) (-11.70) (0.78)
ROA - -0.0501*** -0.0566*** -0.1030***
(-6.81) (-7.77) (-4.86)
LOSS + 0.2166*** 0.1988*** 0.0525**
(29.24) (27.05) (2.46)
OPINION + 0.1324*** 0.1296*** 0.0973***
(19.84) (19.57) (5.06)
BIG4 + 0.4504*** 0.4372*** 0.3712***
(55.14) (53.93) (15.76)
TENURE - 0.0081 -0.0268** -0.5136***
(0.69) (-2.30) (-15.21)
Constant
9.2574***
9.5724***
7.8773***
(266.02) (277.18) (78.49)
Year Controlled Yes Yes Yes
Industry Controlled Yes Yes Yes
Sample Size 38,044 38,044 38,044
Adjusted R2 0.8315 0.8375 0.4490
This table provides regression results testing the association between audit fees (also total and non-audit fees) and
restatement due to fraud and errors using data from the post-Sarbanes-Oxley period (2003–2013). Variables are
defined in Appendix. Model (1) is the full model (A) with the natural logarithm of audit fees (lnAUDITFEE) as the
dependent variable. Model (2) is the full model (A) with the natural logarithm of total audit fees (lnTOTALFEE) as
the dependent variable. Model (3) is the full model (A) with the natural logarithm of non-audit fees
(lnNONAUDITFEE) as the dependent variable. *, **, *** indicate statistical significance at ten percent, five
percent, and one percent, respectively using two-sided t-test. 1 The Senate and House of Representatives of the United States of America (U.S. Congress) (2002), “Sarbanes-
Oxley Act of 2002,” Public Law 107-204, 107th Congress.
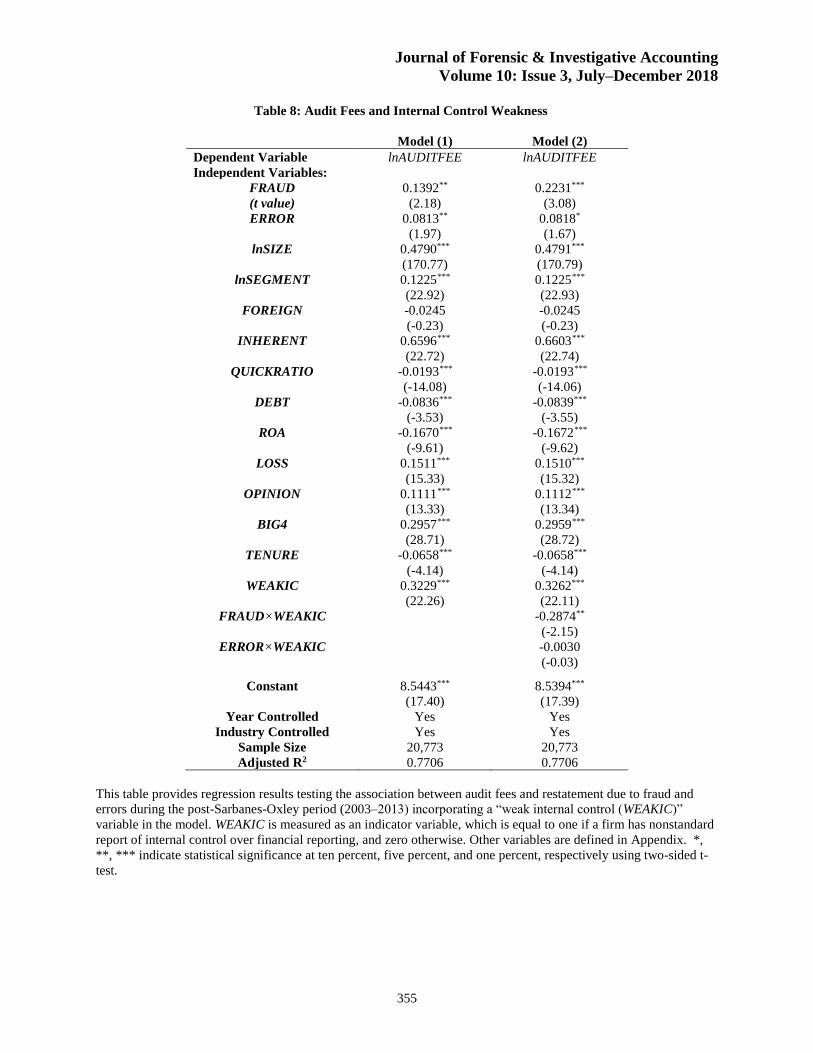
Journal of Forensic & Investigative Accounting
Volume 10: Issue 3, July–December 2018
355
Table 8: Audit Fees and Internal Control Weakness
Model (1) Model (2)
Dependent Variable lnAUDITFEE lnAUDITFEE
Independent Variables:
FRAUD 0.1392** 0.2231***
(t value) (2.18) (3.08)
ERROR 0.0813** 0.0818*
(1.97) (1.67)
lnSIZE 0.4790*** 0.4791***
(170.77) (170.79)
lnSEGMENT 0.1225*** 0.1225***
(22.92) (22.93)
FOREIGN -0.0245 -0.0245
(-0.23) (-0.23)
INHERENT 0.6596*** 0.6603***
(22.72) (22.74)
QUICKRATIO -0.0193*** -0.0193***
(-14.08) (-14.06)
DEBT -0.0836*** -0.0839***
(-3.53) (-3.55)
ROA -0.1670*** -0.1672***
(-9.61) (-9.62)
LOSS 0.1511*** 0.1510***
(15.33) (15.32)
OPINION 0.1111*** 0.1112***
(13.33) (13.34)
BIG4 0.2957*** 0.2959***
(28.71) (28.72)
TENURE -0.0658*** -0.0658***
(-4.14) (-4.14)
WEAKIC 0.3229*** 0.3262***
(22.26) (22.11)
FRAUD×WEAKIC -0.2874**
(-2.15)
ERROR×WEAKIC -0.0030
(-0.03)
Constant 8.5443*** 8.5394***
(17.40) (17.39)
Year Controlled Yes Yes
Industry Controlled Yes Yes
Sample Size 20,773 20,773
Adjusted R2 0.7706 0.7706
This table provides regression results testing the association between audit fees and restatement due to fraud and
errors during the post-Sarbanes-Oxley period (2003–2013) incorporating a “weak internal control (WEAKIC)”
variable in the model. WEAKIC is measured as an indicator variable, which is equal to one if a firm has nonstandard
report of internal control over financial reporting, and zero otherwise. Other variables are defined in Appendix. *,
**, *** indicate statistical significance at ten percent, five percent, and one percent, respectively using two-sided t-
test.
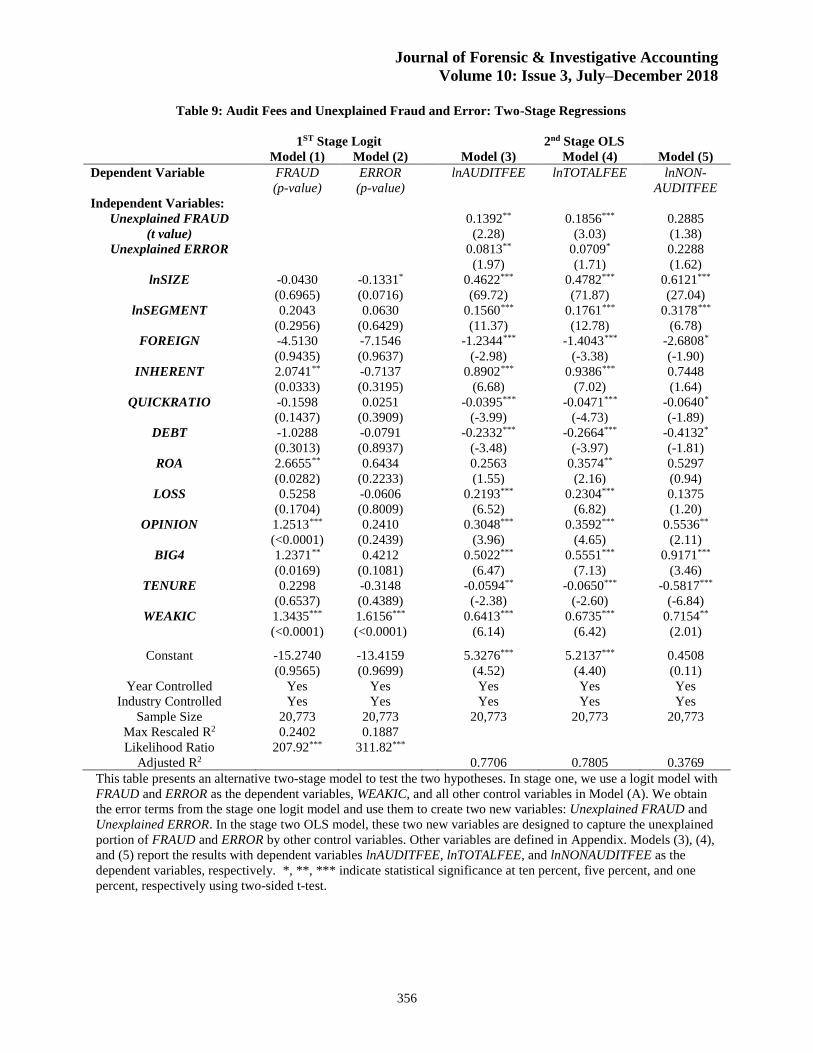
Journal of Forensic & Investigative Accounting
Volume 10: Issue 3, July–December 2018
356
Table 9: Audit Fees and Unexplained Fraud and Error: Two-Stage Regressions
1ST Stage Logit 2nd Stage OLS
Model (1) Model (2) Model (3) Model (4) Model (5)
Dependent Variable FRAUD
(p-value)
ERROR
(p-value)
lnAUDITFEE lnTOTALFEE lnNON-
AUDITFEE
Independent Variables:
Unexplained FRAUD 0.1392** 0.1856*** 0.2885
(t value) (2.28) (3.03) (1.38)
Unexplained ERROR 0.0813** 0.0709* 0.2288
(1.97) (1.71) (1.62)
lnSIZE -0.0430 -0.1331* 0.4622*** 0.4782*** 0.6121***
(0.6965) (0.0716) (69.72) (71.87) (27.04)
lnSEGMENT 0.2043 0.0630 0.1560*** 0.1761*** 0.3178***
(0.2956) (0.6429) (11.37) (12.78) (6.78)
FOREIGN -4.5130 -7.1546 -1.2344*** -1.4043*** -2.6808*
(0.9435) (0.9637) (-2.98) (-3.38) (-1.90)
INHERENT 2.0741** -0.7137 0.8902*** 0.9386*** 0.7448
(0.0333) (0.3195) (6.68) (7.02) (1.64)
QUICKRATIO -0.1598 0.0251 -0.0395*** -0.0471*** -0.0640*
(0.1437) (0.3909) (-3.99) (-4.73) (-1.89)
DEBT -1.0288 -0.0791 -0.2332*** -0.2664*** -0.4132*
(0.3013) (0.8937) (-3.48) (-3.97) (-1.81)
ROA 2.6655** 0.6434 0.2563 0.3574** 0.5297
(0.0282) (0.2233) (1.55) (2.16) (0.94)
LOSS 0.5258 -0.0606 0.2193*** 0.2304*** 0.1375
(0.1704) (0.8009) (6.52) (6.82) (1.20)
OPINION 1.2513*** 0.2410 0.3048*** 0.3592*** 0.5536**
(<0.0001) (0.2439) (3.96) (4.65) (2.11)
BIG4 1.2371** 0.4212 0.5022*** 0.5551*** 0.9171***
(0.0169) (0.1081) (6.47) (7.13) (3.46)
TENURE 0.2298 -0.3148 -0.0594** -0.0650*** -0.5817***
(0.6537) (0.4389) (-2.38) (-2.60) (-6.84)
WEAKIC 1.3435*** 1.6156*** 0.6413*** 0.6735*** 0.7154**
(<0.0001) (<0.0001) (6.14) (6.42) (2.01)
Constant -15.2740 -13.4159
5.3276*** 5.2137*** 0.4508
(0.9565) (0.9699) (4.52) (4.40) (0.11)
Year Controlled Yes Yes Yes Yes Yes
Industry Controlled Yes Yes Yes Yes Yes
Sample Size 20,773 20,773 20,773 20,773 20,773
Max Rescaled R2 0.2402 0.1887
Likelihood Ratio 207.92*** 311.82***
Adjusted R2 0.7706 0.7805 0.3769
This table presents an alternative two-stage model to test the two hypotheses. In stage one, we use a logit model with
FRAUD and ERROR as the dependent variables, WEAKIC, and all other control variables in Model (A). We obtain
the error terms from the stage one logit model and use them to create two new variables: Unexplained FRAUD and
Unexplained ERROR. In the stage two OLS model, these two new variables are designed to capture the unexplained
portion of FRAUD and ERROR by other control variables. Other variables are defined in Appendix. Models (3), (4),
and (5) report the results with dependent variables lnAUDITFEE, lnTOTALFEE, and lnNONAUDITFEE as the
dependent variables, respectively. *, **, *** indicate statistical significance at ten percent, five percent, and one
percent, respectively using two-sided t-test.