Embed Size (px)
Citation preview
Hazard Identification and Risk Assessment Workbook
Emergency Management Ontario 2012

Introduction Why Should I Have a HIRA?
One of the core challenges faced by emergency managers is how to prevent, mitigate, prepare, respond and recover from different types of hazards.
Several questions must be asked when faced with this challenge:
• What hazards exist in or near my community?• How frequently do these hazards occur?• How much damage can they cause?• Which hazards pose the greatest threat?
This Hazard Identification and Risk Assessment (HIRA) workbook can help guide you in answering these questions.
A HIRA can:
• Help you to prepare for the worst and/or most likely hazards.• Save time by isolating any hazards which can not affect your community.• Allows for the creation of emergency plans, exercises and training based on the
most likely and/or highest risk scenarios.• Helps your program to become proactive rather than just reactive.
What is a HIRA?
A HIRA is a risk assessment tool that can be used to assess which hazards pose the greatest risk in terms of how likely they are to occur and how great their potential impact may be. It is not intended to be used as a prediction tool to determine which hazard will cause the next emergency.
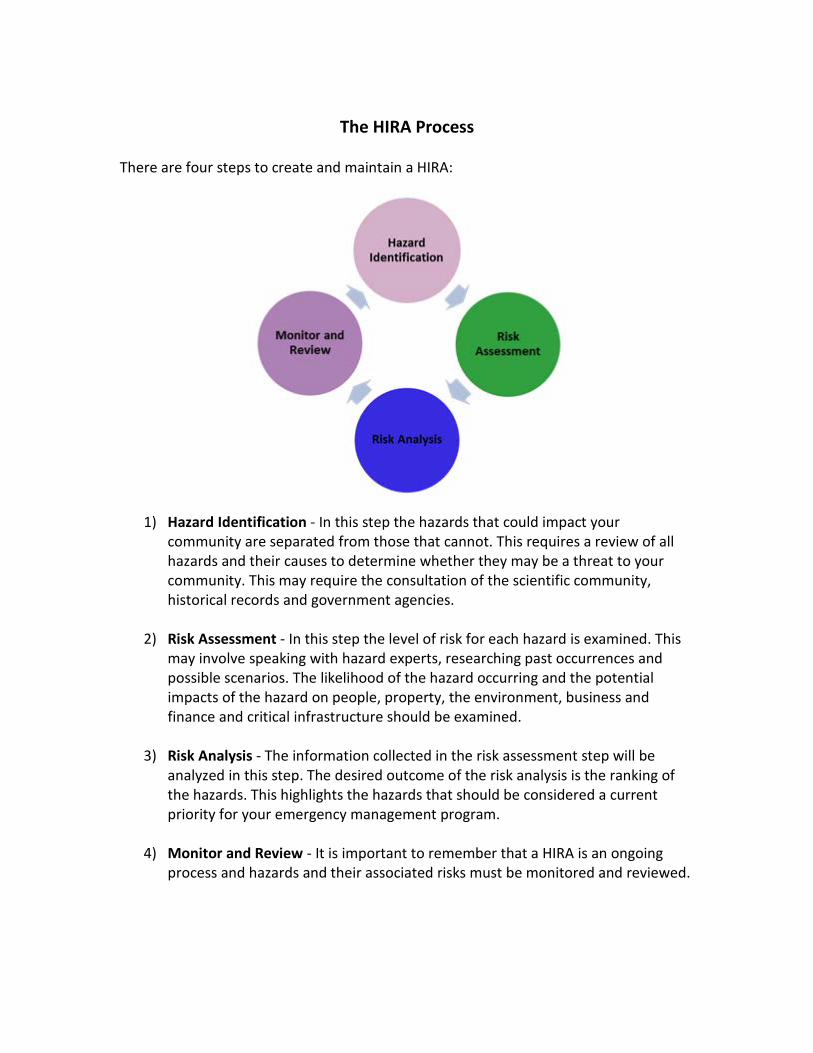
The HIRA Process
There are four steps to create and maintain a HIRA:
1) Hazard Identification - In this step the hazards that could impact your
community are separated from those that cannot. This requires a review of all hazards and their causes to determine whether they may be a threat to your community. This may require the consultation of the scientific community, historical records and government agencies.
2) Risk Assessment - In this step the level of risk for each hazard is examined. This
may involve speaking with hazard experts, researching past occurrences and possible scenarios. The likelihood of the hazard occurring and the potential impacts of the hazard on people, property, the environment, business and finance and critical infrastructure should be examined.
3) Risk Analysis - The information collected in the risk assessment step will be analyzed in this step. The desired outcome of the risk analysis is the ranking of the hazards. This highlights the hazards that should be considered a current priority for your emergency management program.
4) Monitor and Review - It is important to remember that a HIRA is an ongoing
process and hazards and their associated risks must be monitored and reviewed.

Step One: Hazard Identification Worksheet The list below is a starting point in identifying hazards. Check all that apply.
Natural Hazards Agricultural and Food Emergency - Farm Animal Disease - Food Emergency - Plant Disease and Pest Infestation Drinking Water Emergency Drought/Low Water Earthquake Erosion Extreme Temperatures - Heat Wave - Cold Wave Flood - Riverine Flood - Seiche - Storm Surge - Urban Flood Fog Forest/Wildland Fire Freezing Rain Geomagnetic Storm Hail Human Health Emergency - Epidemic - Pandemic Hurricane Land Subsidence Landslide Lightning Natural Space Object Crash Snowstorm/Blizzard Tornado Windstorm
Technological Hazards Building/Structural Collapse Critical Infrastructure Failure Dam Failure Energy Emergency (Supply) Explosion/Fire Hazardous Materials Incident/Spills - Fixed Site Incident - Transportation Incident Human-Made Space Object Crash Mine Emergency Nuclear Facility Emergency Oil/Natural Gas Emergency Radiological Emergency Transportation Emergency - Air Emergency - Marine Emergency - Rail Emergency - Road Emergency Human-Caused Hazards Civil Disorder Cyber Attack Sabotage Special Event Terrorism/CBRNE War and International Emergency
Other: Other: Other: Other: Other: Other: Other:
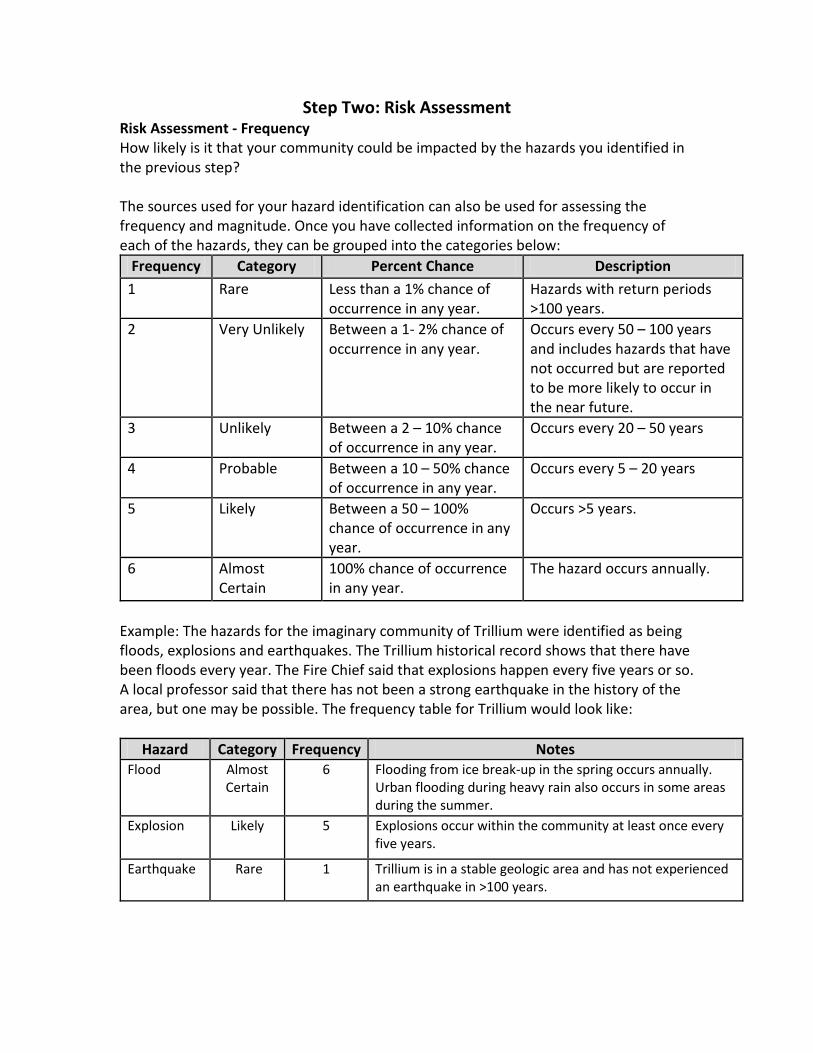
Step Two: Risk Assessment Risk Assessment - Frequency How likely is it that your community could be impacted by the hazards you identified in the previous step? The sources used for your hazard identification can also be used for assessing the frequency and magnitude. Once you have collected information on the frequency of each of the hazards, they can be grouped into the categories below:
Frequency Category Percent Chance Description 1 Rare Less than a 1% chance of
occurrence in any year. Hazards with return periods >100 years.
2 Very Unlikely Between a 1- 2% chance of occurrence in any year.
Occurs every 50 – 100 years and includes hazards that have not occurred but are reported to be more likely to occur in the near future.
3 Unlikely Between a 2 – 10% chance of occurrence in any year.
Occurs every 20 – 50 years
4 Probable Between a 10 – 50% chance of occurrence in any year.
Occurs every 5 – 20 years
5 Likely Between a 50 – 100% chance of occurrence in any year.
Occurs >5 years.
6 Almost Certain
100% chance of occurrence in any year.
The hazard occurs annually.
Example: The hazards for the imaginary community of Trillium were identified as being floods, explosions and earthquakes. The Trillium historical record shows that there have been floods every year. The Fire Chief said that explosions happen every five years or so. A local professor said that there has not been a strong earthquake in the history of the area, but one may be possible. The frequency table for Trillium would look like:
Hazard Category Frequency Notes Flood Almost
Certain 6 Flooding from ice break-up in the spring occurs annually.
Urban flooding during heavy rain also occurs in some areas during the summer.
Explosion Likely 5 Explosions occur within the community at least once every five years.
Earthquake Rare 1 Trillium is in a stable geologic area and has not experienced an earthquake in >100 years.
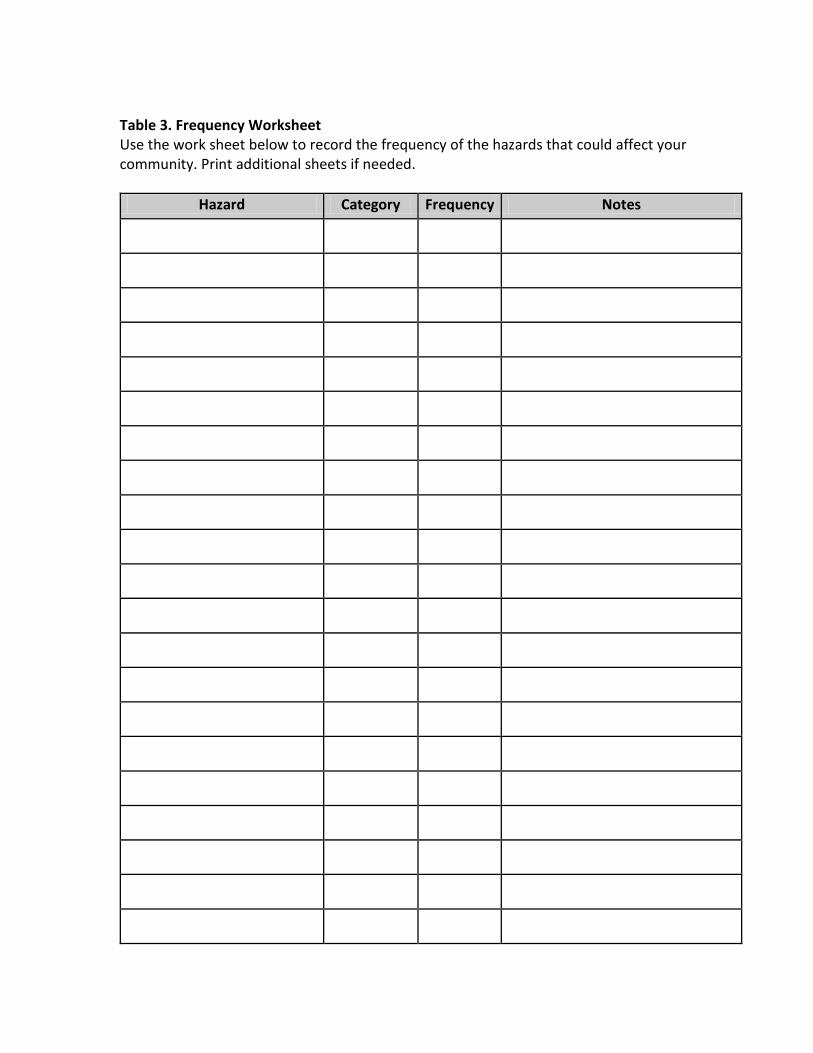
Table 3. Frequency Worksheet Use the work sheet below to record the frequency of the hazards that could affect your community. Print additional sheets if needed.
Hazard Category Frequency Notes

Risk Assessment – Consequence Consequence is divided into six categories based on recommended practices: Social Impacts - The direct negative consequences of a hazard on the physical health of people. Property Damage - The direct negative consequences of a hazard on buildings, structures and other forms of property, such as crops. Critical Infrastructure Service Disruptions/Impact - The negative consequences of a hazard on the interdependent, interactive, interconnected networks of institutions, services, systems and processes that meet vital human needs, sustain the economy, protect public safety and security, and maintain continuity of and confidence in government. Environmental Damage - The negative consequences of a hazard on the environment, including the soil, water, air and/or plants and animals. Business/Financial Impact - The negative economic consequences of a hazard. Psychosocial Impacts - The negative response of community or a subset of the community to a hazard caused by their perception of risk. This includes human responses such as self-evacuation, mass panic and other potential undesirable responses. The total consequence value can be obtained by adding the values obtained from each of the sub variables. Note: The social impacts sub variable is further divided into the fatality rate, injury rate and evacuation rate. Since human impacts are often the most ‘jarring’ result of an emergency and have an unquantifiable impact on the community, social impact was intentionally weighted higher than the other sub variables. The magnitude categories in this HIRA methodology are a scale of impact, rather than a prioritization. The same value in two categories does not mean that the consequences of the two are equal and interchangeable.
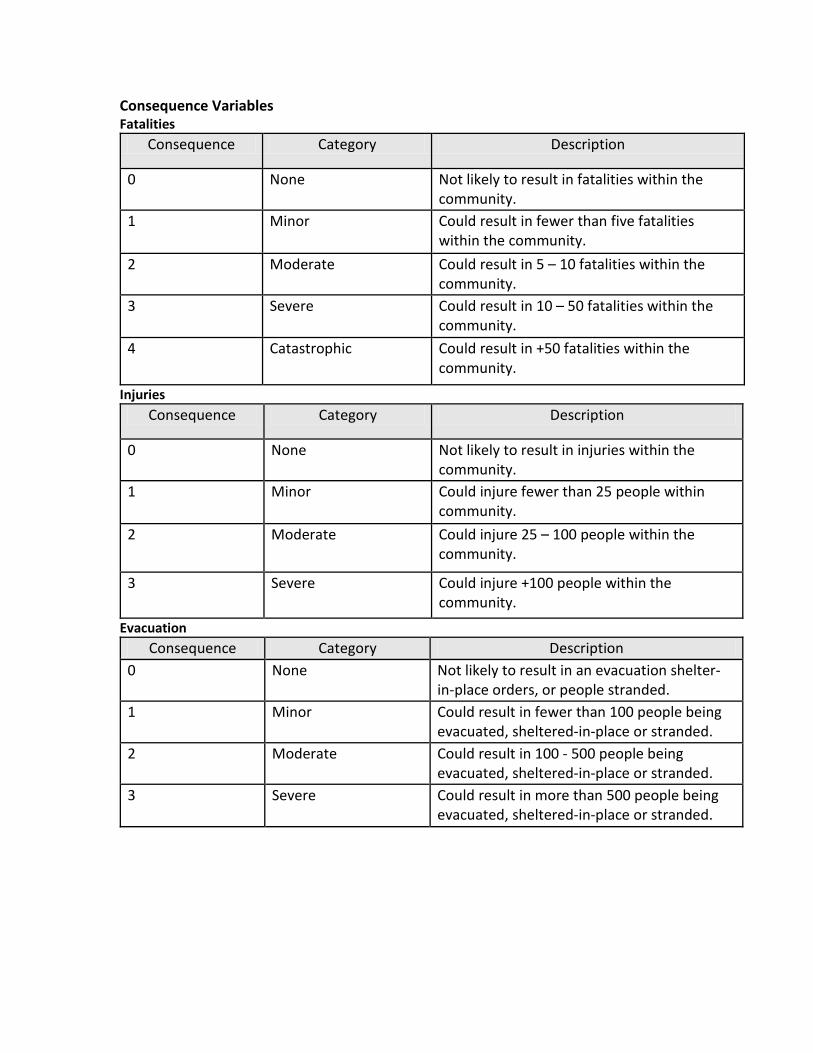
Consequence Variables Fatalities
Consequence Category Description
0 None Not likely to result in fatalities within the community.
1 Minor Could result in fewer than five fatalities within the community.
2 Moderate Could result in 5 – 10 fatalities within the community.
3 Severe Could result in 10 – 50 fatalities within the community.
4 Catastrophic Could result in +50 fatalities within the community.
Injuries Consequence Category Description
0 None Not likely to result in injuries within the community.
1 Minor Could injure fewer than 25 people within community.
2 Moderate Could injure 25 – 100 people within the community.
3 Severe Could injure +100 people within the community.
Evacuation Consequence Category Description
0 None Not likely to result in an evacuation shelter-in-place orders, or people stranded.
1 Minor Could result in fewer than 100 people being evacuated, sheltered-in-place or stranded.
2 Moderate Could result in 100 - 500 people being evacuated, sheltered-in-place or stranded.
3 Severe Could result in more than 500 people being evacuated, sheltered-in-place or stranded.
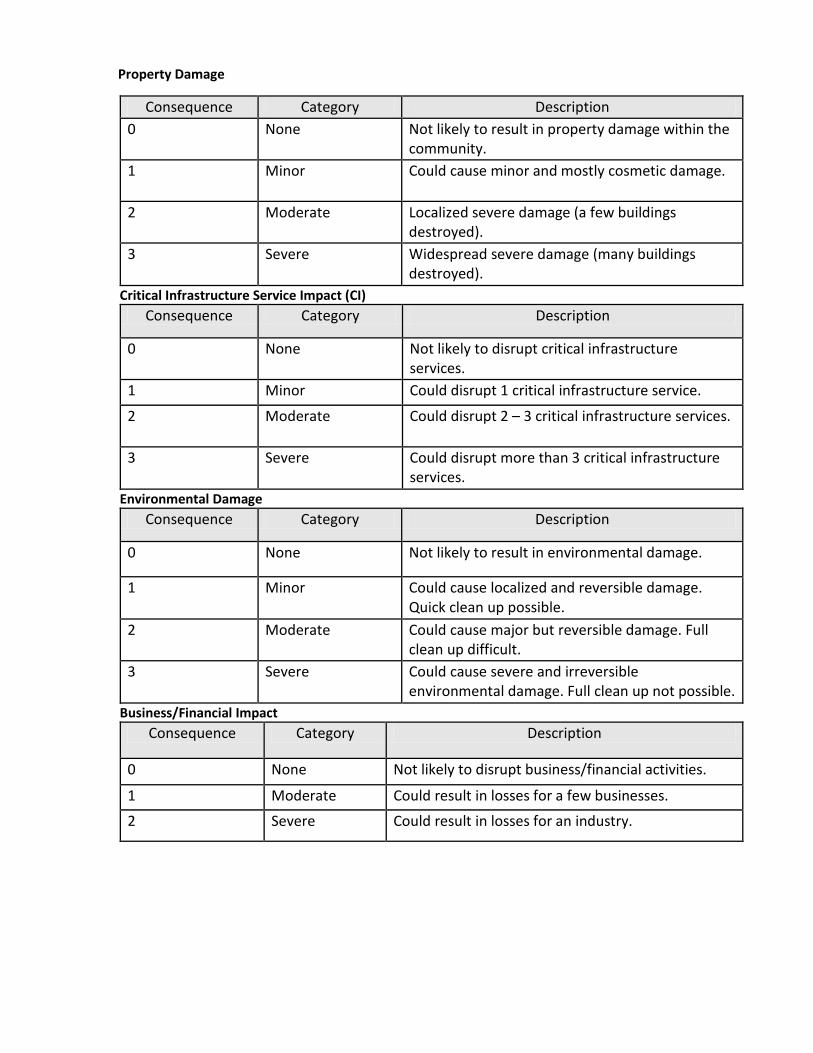
Property Damage
Consequence Category Description 0 None Not likely to result in property damage within the
community. 1 Minor Could cause minor and mostly cosmetic damage.
2 Moderate Localized severe damage (a few buildings destroyed).
3 Severe Widespread severe damage (many buildings destroyed).
Critical Infrastructure Service Impact (CI) Consequence Category Description
0 None Not likely to disrupt critical infrastructure services.
1 Minor Could disrupt 1 critical infrastructure service.
2 Moderate Could disrupt 2 – 3 critical infrastructure services.
3 Severe Could disrupt more than 3 critical infrastructure services.
Environmental Damage Consequence Category Description
0 None Not likely to result in environmental damage.
1 Minor Could cause localized and reversible damage. Quick clean up possible.
2 Moderate Could cause major but reversible damage. Full clean up difficult.
3 Severe Could cause severe and irreversible environmental damage. Full clean up not possible.
Business/Financial Impact Consequence Category Description
0 None Not likely to disrupt business/financial activities.
1 Moderate Could result in losses for a few businesses.
2 Severe Could result in losses for an industry.
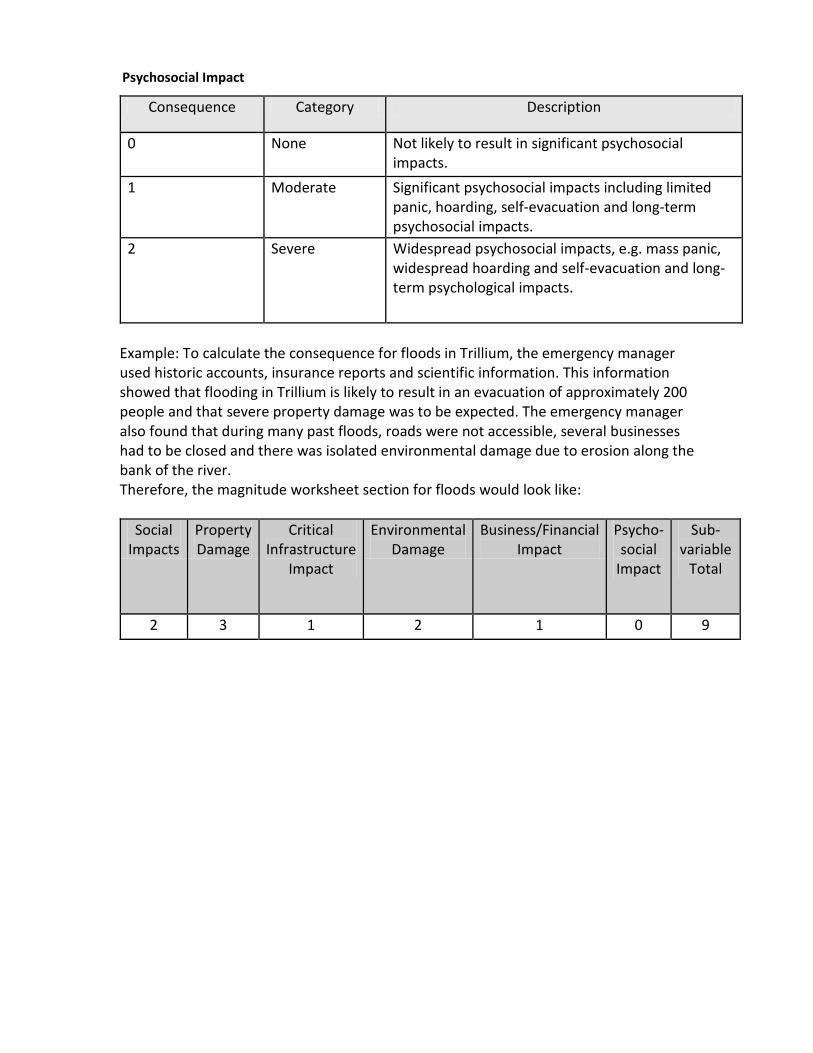
Psychosocial Impact
Consequence Category Description
0 None Not likely to result in significant psychosocial impacts.
1 Moderate Significant psychosocial impacts including limited panic, hoarding, self-evacuation and long-term psychosocial impacts.
2 Severe Widespread psychosocial impacts, e.g. mass panic, widespread hoarding and self-evacuation and long-term psychological impacts.
Example: To calculate the consequence for floods in Trillium, the emergency manager used historic accounts, insurance reports and scientific information. This information showed that flooding in Trillium is likely to result in an evacuation of approximately 200 people and that severe property damage was to be expected. The emergency manager also found that during many past floods, roads were not accessible, several businesses had to be closed and there was isolated environmental damage due to erosion along the bank of the river. Therefore, the magnitude worksheet section for floods would look like:
Social Impacts
Property Damage
Critical Infrastructure
Impact
Environmental Damage
Business/Financial Impact
Psycho-social
Impact
Sub-variable
Total
2 3 1 2 1 0 9
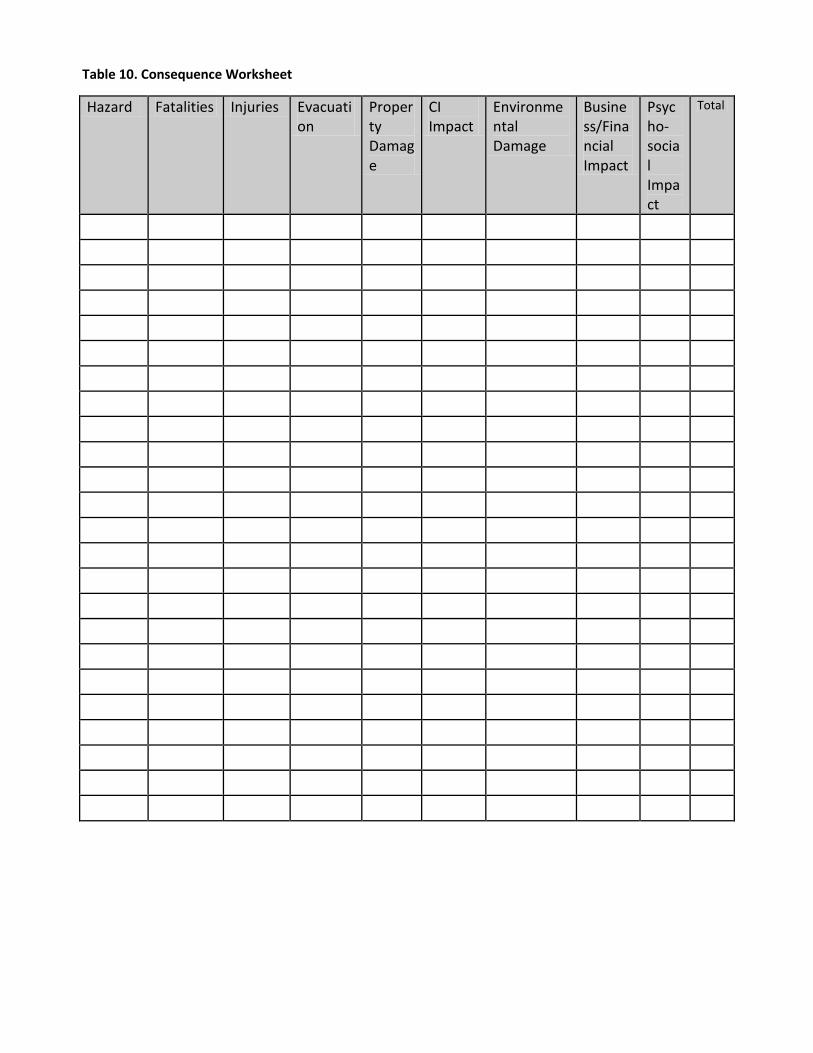
Table 10. Consequence Worksheet
Hazard Fatalities Injuries Evacuation
Property Damage
CI Impact
Environmental Damage
Business/Financial Impact
Psycho- social Impact
Total
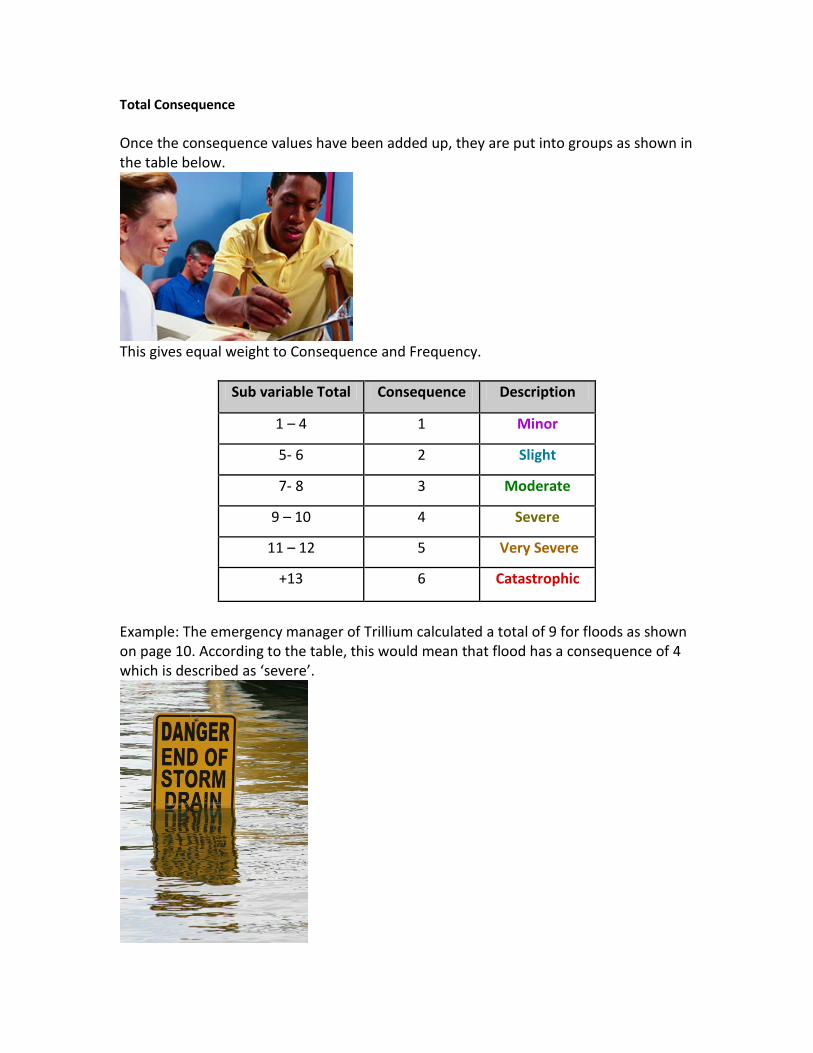
Total Consequence Once the consequence values have been added up, they are put into groups as shown in the table below.
This gives equal weight to Consequence and Frequency.
Sub variable Total Consequence Description
1 – 4 1 Minor
5- 6 2 Slight
7- 8 3 Moderate
9 – 10 4 Severe
11 – 12 5 Very Severe
+13 6 Catastrophic
Example: The emergency manager of Trillium calculated a total of 9 for floods as shown on page 10. According to the table, this would mean that flood has a consequence of 4 which is described as ‘severe’.

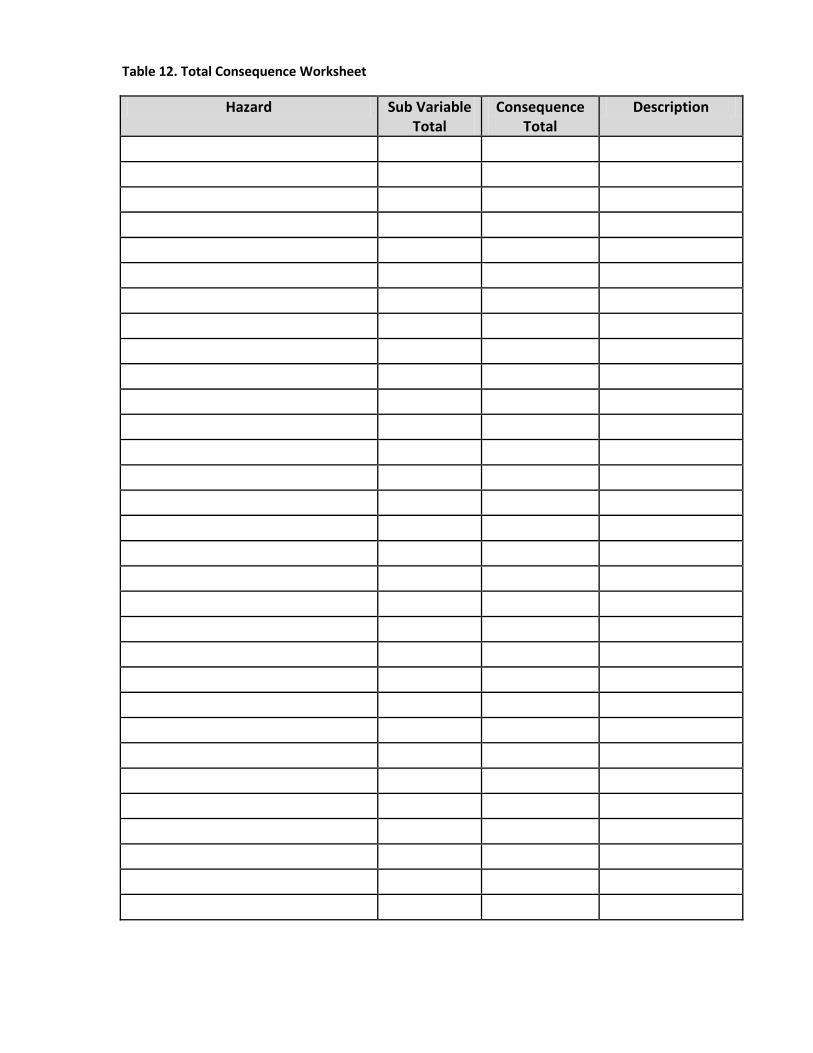
Table 12. Total Consequence Worksheet
Hazard Sub Variable Total
Consequence Total
Description

Changing Risk
The frequency and consequence can be influenced by factors such as mitigation actions and climate change. Changing Risk helps to account for these changes.
Changing Risk = Change in Frequency + Change in Vulnerability
Changing Risk can be calculated by answering the questions below for each hazard:
Change in Frequency 1. Is the number of non-emergency occurrences of the hazard increasing?
2. Is human activity (e.g. population growth, change of drainage patterns) likely tolead to more interaction with the hazard or an increase in frequency?
3. Is there an environmental reason (e.g. climate change) why the frequency of thishazard may increase?
4. Are human factors such as business, financial, international practices more likelyto increase the risk?
If the answer is ‘yes’ to two or more, then the change in frequency = 2 If the answer is ‘yes’ to one or fewer then the change in frequency = 1
Change in Vulnerability 1. Is a large number of the population vulnerable or is the number of people
vulnerable to this hazard increasing?
2. Does critical infrastructure reliance or a ‘just-on-time’ delivery system (e.g.stores not keeping a supply of food and relying on frequent shipments) make thepopulation more vulnerable?
3. Are response agencies not aware of, practiced and prepared to response to thishazard?
Are no prevention/mitigation measures currently in use for this hazard?
If the answer is ‘yes’ to two or more, then the change in vulnerability = 2 If the answer is ‘yes’ to one or fewer then the change in vulnerability = 1

Table 13. Changing Risk Worksheet
Hazard Total Change in Frequency
Total Change in Vulnerability
Changing Risk Total
Step Three: Risk Analysis
Once you have completed the Frequency, Magnitude and Changing Risk Work Sheets, you can now begin to prioritize your hazards by using the HIRA equation:
Risk = Frequency * Consequence * Changing Risk Example: The Emergency Manager of Trillium found a frequency value of 6, a total consequence value of 4 and a changing risk value of 4 for floods. These numbers were entered into the equation and multiplied together. The result was: Flood Risk = 6*4*4 = 96
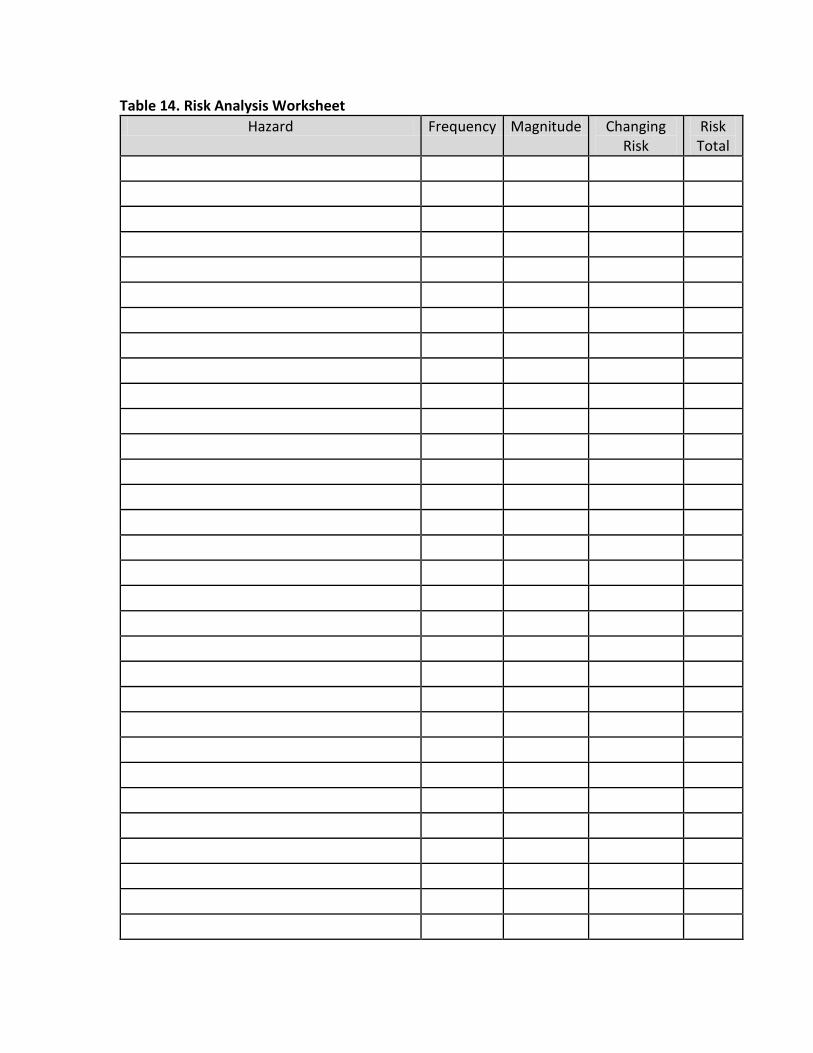
Table 14. Risk Analysis Worksheet Hazard Frequency Magnitude Changing
Risk Risk Total

Table 15. Prioritization Worksheet Once you have calculated the risk for the hazards, you may wish to group them based on their level of risk using the table below. This is particularly useful if you have several hazards with the same risk values.
Level of Risk Description < 10 Very Low
11 - 20 Low
21 - 30 Moderate
31 - 40 High
41 - 50 Very High
>50 Extreme Enter your hazards into the work sheet below according to their risk which you calculated from the Risk Analysis Worksheet.
Level of Risk Description Hazards
>50 Extreme
41 - 50 Very High
31 - 40 High
21 - 30 Moderate
11 - 20 Low
<10 Very Low

Step Four: Monitor and Review Hazards and risks may change over time so it is important to review your HIRA annually. Date of Current HIRA:____________________ Date of Next Revision:____________________
Signature:_______________________________
Next Steps: Vulnerable Groups and Mitigation Actions
Vulnerable Groups
Some people may be more vulnerable to certain hazards than others due to many different reasons such as disabilities, economic status and health and are therefore more likely to suffer from the negative impacts of a hazard. These groups may be more vulnerable to a hazard due to an inability to self-evacuate or to take the proper safety precautions, susceptible to a hazard due to their health, or a lack of access to warnings or other reasons that increase their vulnerability to a specific hazard. Not all people who identify themselves as belong to one of these groups may be at an increased risk during the occurrence of a hazard, it will depend on the individual’s specific situation.
It is important to consider vulnerable groups once the hazards have been identified. Assessing vulnerability is a key consideration in planning and it can assist in mitigation action decision-making. Mitigation Actions Mitigation is defined as “actions taken to reduce the adverse impacts of an emergency or disaster” (EMO, 2011). A HIRA is only one part of a comprehensive emergency management program. Once the risk for each of the hazards is known, it is vital that

attempts be made to reduce their risks, beginning with the hazards identified as having extreme and very high levels of risk.
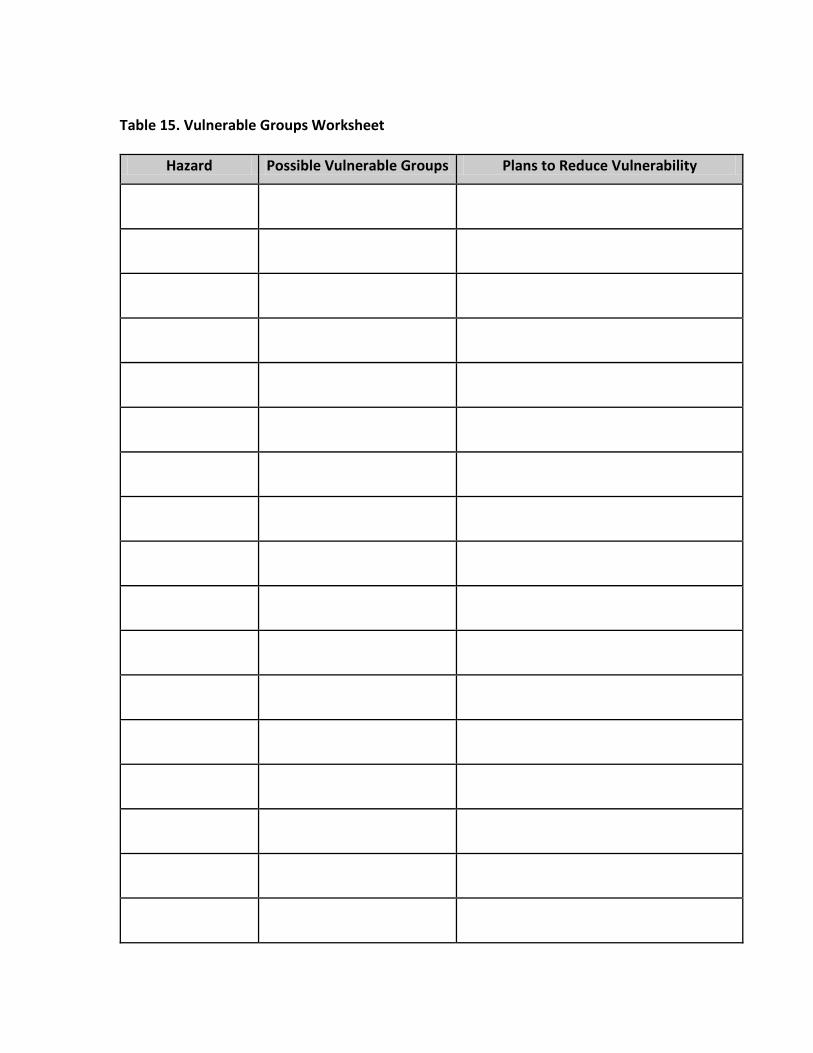
Table 15. Vulnerable Groups Worksheet
Hazard Possible Vulnerable Groups Plans to Reduce Vulnerability

Table 16. Potential Mitigation Actions Worksheet Hazard Action Priority Estimated
Timeline Estimated
Cost Funding Sources
Notes

2012