Embed Size (px)
Citation preview
Alberta Energy and Utilities Board
Statistical Series 2001-98
Alberta’s Reserves 2000 and Supply/Demand Outlook 2001-2010 • Crude Bitumen • Crude Oil • Natural Gas • Ethane and Other Natural Gas
Liquids • Coal • Sulphur
ACKNOWLEDGEMENTS The following EUB staff contributed to this report. Principal Authors: Reserves―Andy Burrowes, Rick Marsh, Nehru Ramdin, Keith Sadler; Supply/Demand―Marie-Anne Kirsch, Abbas Naini, LeMoine Philp, Thorn Walden; Editors: Terry Hurst, Farhood Rahnama, Cal Hill; Data: Lorne Basaraba, Debbie Giles, Gordon Kimber, Shirley McGuffin, Joanne Stenson; Coordinator: Joe MacGillivray; Production: Liz Johnson, Ona Stonkus, Anne Moran, Karen Logan, Rebecca Hirsekorn, Rob deGrace; Communications Advisor: Eileen Kahler. For inquiries regarding reserves, contact Andy Burrowes at (403) 297-8566; for inquiries regarding supply/demand, contact Abbas Naini at (403) 297-3540. ALBERTA ENERGY AND UTILITIES BOARD Statistical Series 2001-98: Alberta’s Reserves 2000 and Supply/Demand Outlook 2001-2010 ISSN 1499-1179 CD-ROM ISSN 1499-1187 Published by Alberta Energy and Utilities Board 640 – 5 Avenue SW Calgary, Alberta T2P 3G4 Telephone: (403) 297-8311 Fax: (403) 297-7040 Web site: <www.eub.gov.ab.ca>

EUB Statistical Series 2001-98: Alberta’s Reserves 2000 and Supply/Demand Outlook / Contents •••• i
Contents Overview ................................................................................................................................................ 1 Figures Alberta’s oil reserves................................................................................................................. 3
Alberta’s total oil supply ........................................................................................................... 4 Marketable gas production and demand.................................................................................... 5
1 Energy Prices and Economic Performance...................................................................................1-1
1.1 Introduction.........................................................................................................................1-1 1.2 Energy and Sulphur Prices ..................................................................................................1-1 1.3 Canadian Economic Performance .......................................................................................1-2 1.4 Alberta Economic Outlook .................................................................................................1-3 1.5 Alberta’s Demographic Outlook .........................................................................................1-3 Tables 1.1 Major assumptions concerning the Canadian economy ..................................................1-3
Figures 1.1 Price of WTI at Chicago ..................................................................................................1-5 1.2 Average price of oil at Alberta wellhead .........................................................................1-5 1.3 Average price of natural gas at plant gate........................................................................1-6
1.4 Alberta GDP growth, unemployment, and inflation rates ...............................................1-6 1.5 Alberta population trends.................................................................................................1-7
2 Crude Bitumen..............................................................................................................................2-1
2.1 Reserves of Crude Bitumen ................................................................................................2-1 2.1.1 Provincial Summary..................................................................................................2-1 2.1.2 Initial in-Place Volumes of Crude Bitumen ..............................................................2-3 2.1.3 Surface-Mineable Crude Bitumen Reserves .............................................................2-4 2.1.4 In Situ Crude Bitumen Reserves ...............................................................................2-5 2.1.5 Ultimate Potential of Crude Bitumen........................................................................2-6
2.2 Supply of and Demand for Crude Bitumen.........................................................................2-6 2.2.1 Crude Bitumen Production........................................................................................2-7
2.2.2 Synthetic Crude Oil Production ................................................................................2-8 2.2.3 Demand for Synthetic Crude Oil and Nonupgraded Bitumen...................................2-9
Tables 2.1 In-place volumes and established reserves of crude bitumen .........................................2-1 2.2 Change in established crude bitumen reserves ...............................................................2-2 2.3 Remaining established mineable crude bitumen reserves in areas under active
development as of December 31, 2000............................................................................2-2 2.4 Established in situ crude bitumen reserves in areas under active development as of December 31, 2000 .................................................................................................2-3 2.5 Initial in-place volumes of crude bitumen .......................................................................2-4
Figures 2.1 Crude oil and crude bitumen reserves in Alberta and Saudi Arabia ..............................2-11 2.2 Crude bitumen resource and reserve categories .............................................................2-12 2.3 Alberta crude bitumen production..................................................................................2-13 2.4 Alberta synthetic crude oil production ...........................................................................2-13 2.5 Alberta demand and exports of crude bitumen and SCO ...............................................2-14
(continued)

ii •••• EUB Statistical Series 2001-98: Alberta’s Reserves 2000 and Supply/Demand Outlook / Contents
3 Crude Oil.......................................................................................................................................3-1 3.1 Reserves of Crude Oil .........................................................................................................3-1
3.1.1 Provincial Summary..................................................................................................3-1 3.1.2 Reserves Growth .......................................................................................................3-1 3.1.3 Pools with Largest Reserve Changes ........................................................................3-2 3.1.4 Distribution of Oil Reserves by Size and Geology ...................................................3-2 3.1.5 Ultimate Potential......................................................................................................3-5
3.2 Supply of and Demand for Crude Oil .................................................................................3-5 3.2.1 Crude Oil Supply.......................................................................................................3-5 3.2.2 Crude Oil Demand ....................................................................................................3-9 3.2.3 Crude Oil and Equivalent Supply..............................................................................3-9
Tables 3.1 Reserve change highlights ...............................................................................................3-1 3.2 Breakdown of changes in crude oil initial established reserves ......................................3-2 3.3 Major oil reserve changes, 2000.......................................................................................3-3 3.4 Distribution of oil reserves by pool size...........................................................................3-5 3.5 Conventional crude oil reserves by recovery mechanism as of December 31, 2000 .......3-6 3.6 Conventional crude oil reserves by geological period as of December 31, 2000.............3-6 3.7 Distribution of conventional oil reserves by formation as of December 31, 2000...........3-7
Figures 3.1 Remaining established reserves of crude oil ..................................................................3-11 3.2 Total conventional crude oil reserves additions and reassessments ...............................3-11 3.3 Light-medium crude oil reserves additions and reassessments ......................................3-12 3.4 Heavy crude oil reserves additions and reassessments...................................................3-12 3.5 Change in reserves by recovery mechanisms .................................................................3-13 3.6 Oil pools by size and discovery year..............................................................................3-13 3.7 Crude oil reserves by recovery mechanisms ..................................................................3-14 3.8 Geological distribution of concentration crude oil reserves...........................................3-14 3.9 Growth of initial established reserves of conventional crude oil ...................................3-15 3.10 Alberta’s remaining established reserves versus cumulative production .....................3-16 3.11 Total conventional crude oil production by drilled year ..............................................3-16 3.12 Alberta crude oil drilling activity .................................................................................3-17 3.13 Alberta daily production of crude oil (actual and forecast)..........................................3-17 3.14 Capacity and location of Alberta refineries..................................................................3-18 3.15 Alberta demand and exports of crude oil .....................................................................3-18 3.16 Alberta supply of crude oil and equivalent...................................................................3-19
4 Natural Gas ...................................................................................................................................4-1
4.1 Reserves of Natural Gas......................................................................................................4-1 4.1.1 Provincial Summary..................................................................................................4-1 4.1.2 Growth of Marketable Gas Reserves.........................................................................4-1 4.1.3 Distribution of Natural Gas Reserves by Pool Size...................................................4-2 4.1.4 Geological Distribution of Reserves .........................................................................4-2 4.1.5 Regional Distribution of Gas Reserves .....................................................................4-2 4.1.6 Reserves of Natural Gas Containing Hydrogen Sulphide .........................................4-6 4.1.7 Reserves of Pools Calculated on an Energy Basis ....................................................4-6 4.1.8 Reserves of Ethane and Other Natural Gas Liquids Included in Gas Reserves ........4-7 4.1.9 Multifield Pools.........................................................................................................4-9 4.1.10 Coal-Bed Methane Reserves ..................................................................................4-9 4.1.11 Ultimate Potential ..................................................................................................4-9
4.2 Supply of Demand for Natural Gas.....................................................................................4-9 4.2.1 Natural Gas Supply ...................................................................................................4-9 4.2.2 Alberta Natural Gas Demand ..................................................................................4-12
(continued)
EUB Statistical Series 2001-98: Alberta’s Reserves 2000 and Supply/Demand Outlook / Contents •••• iii
Tables 4.1 Reserves of marketable gas .............................................................................................4-1 4.2 Major natural gas reserve changes, 2000 ........................................................................4-3 4.3 Distribution of natural gas reserves by pool size, 2000 ...................................................4-5 4.4 Geological distribution of established natural gas reserves, 2000 ...................................4-5 4.5 Distribution of sweet and sour gas reserves, 2000...........................................................4-7 4.6 Distribution of sour gas reserves by H2S content, 2000...................................................4-7 4.7 Reserves of pools calculated on an energy basis, 2000 ...................................................4-8 4.8 Production decline rates for new well connections .......................................................4-10 4.9 Commercial natural gas storage pools as of December 31, 2000 ..................................4-12
Figures 4.1 Annual additions and production of marketable gas ......................................................4-15 4.2 Remaining established natural gas reserves ...................................................................4-15 4.3 Gas pools by size and discovery year.............................................................................4-16 4.4 Geological distribution of marketable gas reserves........................................................4-16 4.5 Regional distribution of reserves....................................................................................4-17 4.6 Remaining marketable reserves of sweet and sour gas ..................................................4-17 4.7 Growth of initial established reserves of marketable gas ...............................................4-18 4.8 Gas ultimate potential.....................................................................................................4-19 4.9 Successful natural gas wells drilled and connected........................................................4-19 4.10 Alberta natural gas drilling activity..............................................................................4-20 4.11 New natural gas well connections ................................................................................4-20 4.12 Maximum day rate of gas well connections .................................................................4-21 4.13 Gas well production by connection year ......................................................................4-21 4.14 Average initial natural gas well productivity in Alberta ..............................................4-22 4.15 Marketable gas production and demand.......................................................................4-22 4.16 Alberta natural gas storage injection/withdrawal volumes...........................................4-23 4.17 Alberta gas demand by sector.......................................................................................4-23
5 Ethane and Other Natural Gas Liquids .........................................................................................5-1 5.1 Reserves ..............................................................................................................................5-1
5.1.1 Reserves of Ethane ....................................................................................................5-1 5.1.2 Reserves of Other Natural Gas Liquids (NGL).........................................................5-2
5.2 Supply of and Demand for Ethane and Other Natural Gas Liquids (NGL) ........................5-4 5.2.1 Supply of Ethane and Other NGL .............................................................................5-4 5.2.2 Demand for Ethane and NGL....................................................................................5-6
Tables 5.1 Ethane reserves (106 m3) in liquefied form as of December 31, 2000..............................5-1 5.2 Remaining ethane reserves as of December 31, 2000 ......................................................5-2 5.3 Major fields with liquid ethane reserves > 3 106 m3 as of December 31, 2000................5-2 5.4 Reserves of NGL (excluding ethane) (106 m3) as of December 31, 2000........................5-3 5.5 Major NGL reserves (excluding ethane) changes (103 m3), 2000....................................5-3 5.6 Remaining established NGL reserves (excluding ethane) (106 m3) as of December 31, 2000................................................................................................5-4 5.7 Ethane extraction volumes at gas plants in Alberta, 2000................................................5-5
Figures 5.1 Schematic of Alberta NGL flows.....................................................................................5-9 5.2 Ethane supply and demand.............................................................................................5-10 5.3 Propane supply and demand (excluding solvent flood volumes) ...................................5-10 5.4 Butanes supply and demand (excluding solvent flood volumes) ...................................5-11 5.5 Pentanes plus supply and demand (excluding solvent flood volumes) ..........................5-11
(continued)
iv •••• EUB Statistical Series 2001-98: Alberta’s Reserves 2000 and Supply/Demand Outlook / Contents
6 Coal...............................................................................................................................................6-1
6.1 Reserves of Coal.....................................................................................................................6-1 6.1.1 Provincial Summary..................................................................................................6-1 6.1.2 Initial in-Place Resources..........................................................................................6-2 6.1.3 Established Reserves .................................................................................................6-2 6.1.4 Ultimate Potential......................................................................................................6-3
6.2 Supply of and Demand for Coal.............................................................................................6-4 6.2.1 Coal Supply ...............................................................................................................6-5 6.2.2 Coal Demand.............................................................................................................6-6
Tables 6.1 Established initial in-place resources and remaining reserves of coal in Alberta as of December 31, 2000 .........................................................................................................6-1 6.2 Established resources and reserves of coal under active development as of December 31, 2000 ..........................................................................................................6-3 6.3 Ultimate in-place resources and ultimate potentials ........................................................6-4 6.4 Alberta coal mines and marketable coal production in 2000...........................................6-5
Figures 6.1 Alberta marketable coal production .................................................................................6-7
7 Sulphur..........................................................................................................................................7-1
7.1 Reserves of Sulphur ............................................................................................................7-1 7.1.1 Provincial Summary..................................................................................................7-1 7.1.2 Sulphur from Natural Gas .........................................................................................7-1 7.1.3 Sulphur from Crude Bitumen....................................................................................7-4 7.1.4 Sulphur from Crude Bitumen Reserves under Active Development ........................7-4
7.2 Supply of and Demand for Sulphur ....................................................................................7-4 7.2.1 Sulphur Supply..........................................................................................................7-4 7.2.2 Sulphur Demand........................................................................................................7-5 7.2.3 Imbalances between Supply and Demand.................................................................7-5
Tables 7.1 Reserves of sulphur (106 t) as of December 31, 2000 ......................................................7-1 7.2 Remaining established reserves of sulphur from natural gas as of December 31, 2000 ..7-2
Figures 7.1 Production and shipments of Alberta sulphur ................................................................7-7
Appendix 1 Terminology........................................................................................................... A1 Appendix 2 Reserves of multifield pools, 2000....................................................................... A13 Appendix 3 Remaining established reserves of natural gas liquids as of December 31, 2000 A17 Appendix 4 Basic Data Tables and Map.................................................................................. A25

EUB Statistical Series 2001-98: Alberta’s Reserves 2000 and Supply/Demand Outlook / Overview •••• 1
Overview
Every year the Alberta Energy and Utilities Board (EUB) issues a reserves report, providing stakeholders with one of the most reliable sources of information on the state of reserves for Alberta’s diverse energy resources—crude bitumen, crude oil, natural gas, natural gas liquids, sulphur, and coal. Providing information to support good decision-making is a key EUB service. Making energy resource data available to everyone involved—the EUB, landowners, communities, industry, government, and interested groups—results in better decisions that affect the development of Alberta’s resources. The EUB’s reserves report is the principal report on Alberta’s reserves. It includes estimates of initial reserves, remaining established reserves (reserves we know we have), and ultimate potential (reserves that are ultimately expected to be recovered). This year’s report, Alberta’s Reserves 2000 and Supply/Demand Outlook 2001-2010, also includes information on the demand for Alberta’s energy resources, as well as a 10-year supply forecast for each of the sectors. Resource supply, costs of development, energy demands, conservation, and social and environmental considerations influence the economic factors that shape the development of Alberta’s energy resources. Higher prices, record drilling activity, and planned investments of billions of dollars for oil sands projects all contributed to the energy development picture in 2000 and shape the forecast for the years to come. This overview provides a brief summary of the EUB’s report on reserves and production for each resource at the end of 2000 and a forecast of resource supply and demand to 2010. The following table summarizes Alberta’s energy reserves at the end of 2000.
Reserves Summary 2000 Crude bitumen Crude oil Natural gas Coal
(million cubic metres)
(billion barrels)
(million cubic metres)
(billion barrels)
(billion cubic metres)
(trillion cubic feet)
(billion tonnes)
(billion tons)
Initial in-place 259 200 1 631 9 586 60.3 7 070 251 94 104 Ultimate potential (recoverable) 50 000 315 3 130 19.7 5 600 200 620 683 Initial established 28 330 178 2 554 16.1 4 064 144 35 39 Cumulative production 520 3.3 2 263 14.2 2 853 101 1.11 1.2 Remaining established 27 810 175 291 1.8 1 211 43 34 37 Annual production 39 0.245 43.5 0.274 140.7 5.0 0.034 0.037
2 •••• EUB Statistical Series 2001-98: Alberta’s Reserves 2000 and Supply/Demand Outlook / Overview
Crude Bitumen and Crude Oil
Crude Bitumen Reserves
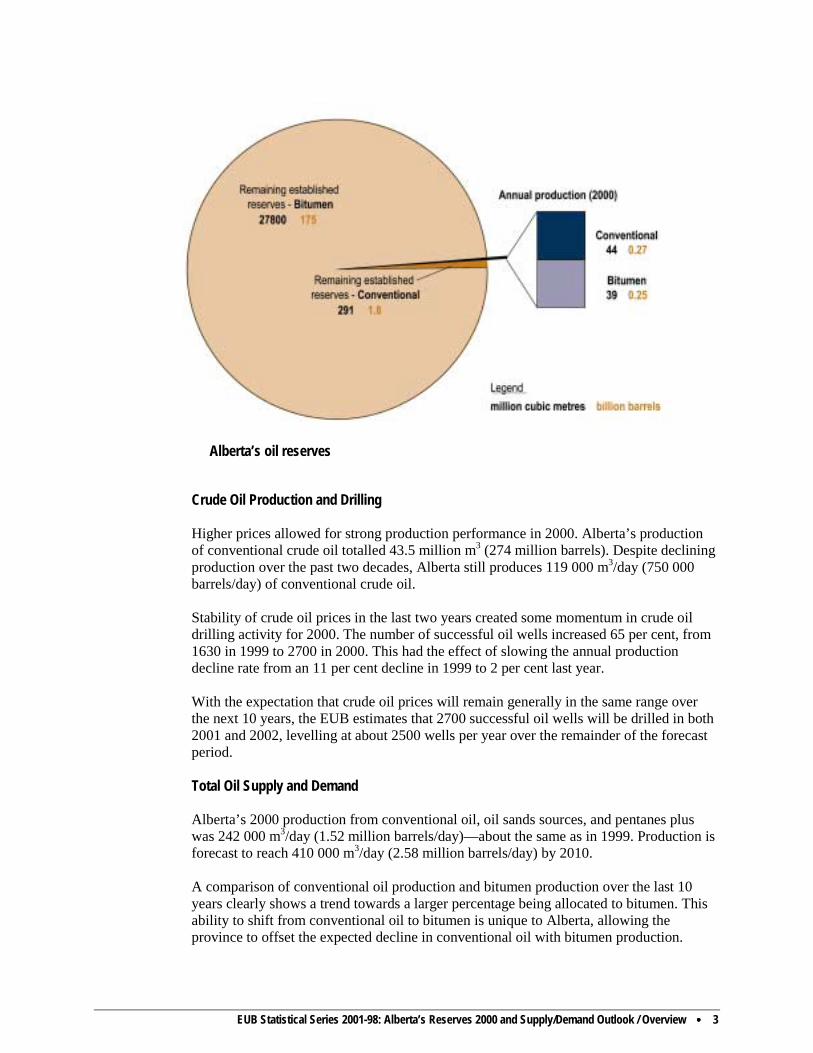
Alberta has the largest oil sands (crude bitumen) resource in the world; approximately 50 billion cubic metres (m3) (315 billion barrels) are considered potentially recoverable under anticipated technology and economic conditions. Recovery is expected to improve with new technologies, such as a special thermal technique called steam-assisted gravity drainage (SAGD). The total in situ and mineable remaining established reserves are 27.8 billion m3 (175 billion barrels). This value is unchanged from 1999. To date, only 1 per cent of the ultimately recoverable crude bitumen resource has been produced. Crude Bitumen Production Production in 2000 was 22 million m3 (138 million barrels) from the mineable area and 17 million m3 (107 million barrels) from the in situ area, totalling 39 million m3 (245 million barrels). Bitumen produced from mining was upgraded, yielding 18.5 million m3 (116 million barrels) of synthetic crude oil (SCO), and in situ production was marketed as crude bitumen. Approximately 40 per cent of Alberta’s crude oil and equivalent (total oil) production for 2000 was from oil sands in the form of SCO and nonupgraded bitumen. Crude Oil Reserves Alberta’s remaining established reserves of conventional crude oil was estimated at 291.4 million m3 (1.8 billion barrels)—a 3.4 per cent reduction from 1999, but a smaller decline than in previous years. Of the 32.7 million m3 (206 million barrels) added to initial established reserves, exploratory and development drilling, along with enhanced recovery methods, added reserves of 22.8 million m3 (143 million barrels). This replaced 53 per cent of 2000 production. Re-evaluation accounted for the other 9.9 million m3 (62 million barrels) addition. Based on its 1988 study, the EUB estimates the ultimate potential recoverable reserves of crude oil at 3130 million m3 (19.7 billion barrels). The EUB believes that this estimate of ultimate potential is still reasonable. Future improvements in technology could improve the current average recovery efficiency of 27 per cent. The following figure shows annual production and remaining established reserves for crude bitumen and crude oil.
EUB Statistical Series 2001-98: Alberta’s Reserves 2000 and Supply/Demand Outlook / Overview •••• 3
Alberta’s oil reserves
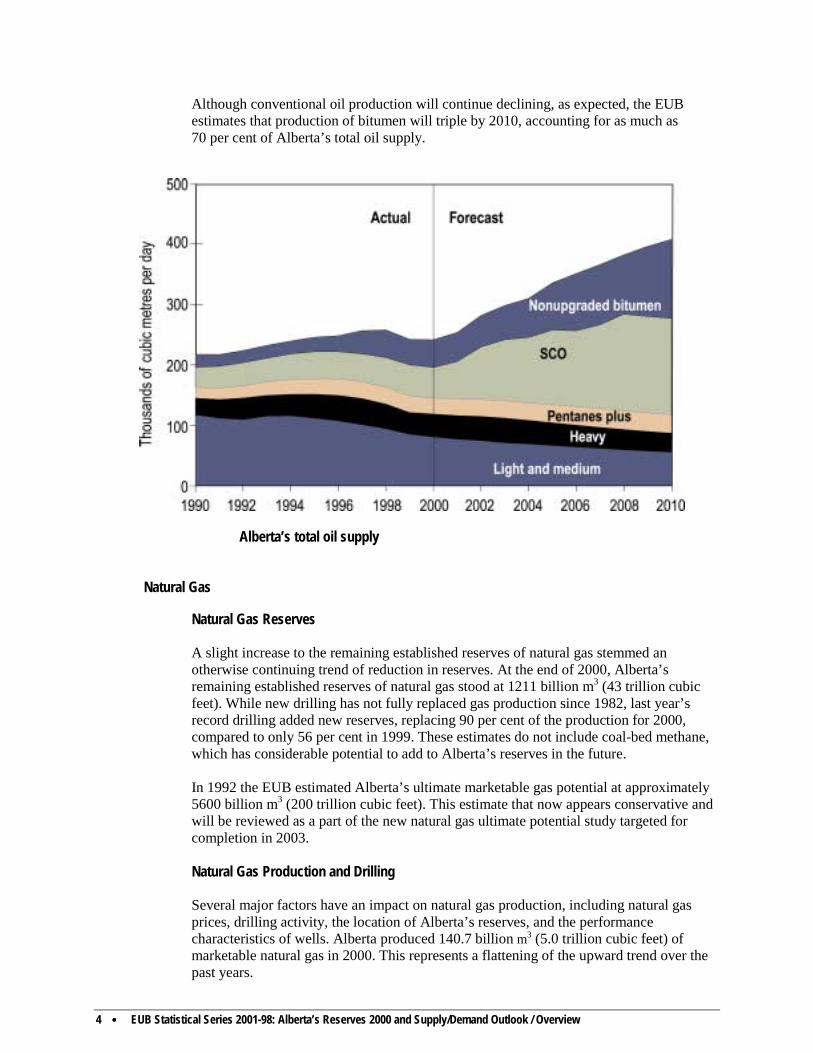
Crude Oil Production and Drilling Higher prices allowed for strong production performance in 2000. Alberta’s production of conventional crude oil totalled 43.5 million m3 (274 million barrels). Despite declining production over the past two decades, Alberta still produces 119 000 m3/day (750 000 barrels/day) of conventional crude oil. Stability of crude oil prices in the last two years created some momentum in crude oil drilling activity for 2000. The number of successful oil wells increased 65 per cent, from 1630 in 1999 to 2700 in 2000. This had the effect of slowing the annual production decline rate from an 11 per cent decline in 1999 to 2 per cent last year. With the expectation that crude oil prices will remain generally in the same range over the next 10 years, the EUB estimates that 2700 successful oil wells will be drilled in both 2001 and 2002, levelling at about 2500 wells per year over the remainder of the forecast period. Total Oil Supply and Demand Alberta’s 2000 production from conventional oil, oil sands sources, and pentanes plus was 242 000 m3/day (1.52 million barrels/day)—about the same as in 1999. Production is forecast to reach 410 000 m3/day (2.58 million barrels/day) by 2010. A comparison of conventional oil production and bitumen production over the last 10 years clearly shows a trend towards a larger percentage being allocated to bitumen. This ability to shift from conventional oil to bitumen is unique to Alberta, allowing the province to offset the expected decline in conventional oil with bitumen production.
4 •••• EUB Statistical Series 2001-98: Alberta’s Reserves 2000 and Supply/Demand Outlook / Overview
Although conventional oil production will continue declining, as expected, the EUB estimates that production of bitumen will triple by 2010, accounting for as much as 70 per cent of Alberta’s total oil supply.
Alberta’s total oil supply
Natural Gas
Natural Gas Reserves A slight increase to the remaining established reserves of natural gas stemmed an otherwise continuing trend of reduction in reserves. At the end of 2000, Alberta’s remaining established reserves of natural gas stood at 1211 billion m3 (43 trillion cubic feet). While new drilling has not fully replaced gas production since 1982, last year’s record drilling added new reserves, replacing 90 per cent of the production for 2000, compared to only 56 per cent in 1999. These estimates do not include coal-bed methane, which has considerable potential to add to Alberta’s reserves in the future. In 1992 the EUB estimated Alberta’s ultimate marketable gas potential at approximately 5600 billion m3 (200 trillion cubic feet). This estimate that now appears conservative and will be reviewed as a part of the new natural gas ultimate potential study targeted for completion in 2003. Natural Gas Production and Drilling Several major factors have an impact on natural gas production, including natural gas prices, drilling activity, the location of Alberta’s reserves, and the performance characteristics of wells. Alberta produced 140.7 billion m3 (5.0 trillion cubic feet) of marketable natural gas in 2000. This represents a flattening of the upward trend over the past years.
EUB Statistical Series 2001-98: Alberta’s Reserves 2000 and Supply/Demand Outlook / Overview •••• 5
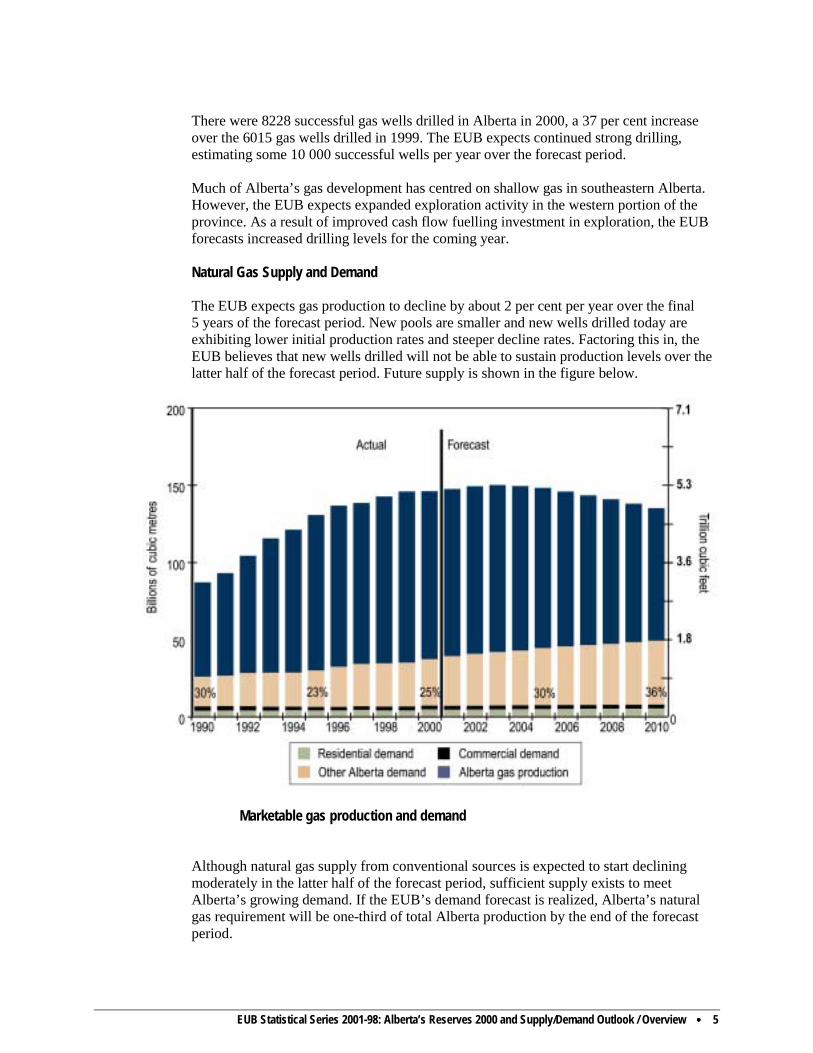
There were 8228 successful gas wells drilled in Alberta in 2000, a 37 per cent increase over the 6015 gas wells drilled in 1999. The EUB expects continued strong drilling, estimating some 10 000 successful wells per year over the forecast period. Much of Alberta’s gas development has centred on shallow gas in southeastern Alberta. However, the EUB expects expanded exploration activity in the western portion of the province. As a result of improved cash flow fuelling investment in exploration, the EUB forecasts increased drilling levels for the coming year. Natural Gas Supply and Demand The EUB expects gas production to decline by about 2 per cent per year over the final 5 years of the forecast period. New pools are smaller and new wells drilled today are exhibiting lower initial production rates and steeper decline rates. Factoring this in, the EUB believes that new wells drilled will not be able to sustain production levels over the latter half of the forecast period. Future supply is shown in the figure below.
Marketable gas production and demand Although natural gas supply from conventional sources is expected to start declining moderately in the latter half of the forecast period, sufficient supply exists to meet Alberta’s growing demand. If the EUB’s demand forecast is realized, Alberta’s natural gas requirement will be one-third of total Alberta production by the end of the forecast period.
6 •••• EUB Statistical Series 2001-98: Alberta’s Reserves 2000 and Supply/Demand Outlook / Overview
As Alberta requirements increase and production declines over time, the volumes available for removal from the province will decline. The EUB’s mandate ensures that the natural gas requirements for Alberta’s core market (defined as residential, commercial, and institutional gas consumers) are met over the long term, before any new gas removal permits are approved. Other potential sources, such as frontier gas and coal-bed methane, offer options for supplementing the supply of conventional gas in the future.
Ethane, Other Natural Gas Liquids, and Sulphur Remaining established reserves of ethane declined slightly to 252 million m3 (1.6 billion barrels) in 2000. The production of specification ethane increased from 11.3 million m3 (71.1 million barrels) in 1999 to 12.8 million m3 (80.5 million barrels) in 2000. The majority of this ethane was used as feedstock for Alberta’s petrochemical industry. The supply of ethane is expected to meet demand over the forecast period. The remaining established reserves of other natural gas liquids (NGLs)—propane, butane, and pentanes plus—increased slightly to 221.9 million m3 (1.4 billion barrels) in 2000. This increase was due mainly to a re-evaluation of NGL reserves in several pools in the province. The supply of propane and butane is expected to meet demand over the forecast period. However, a shortage of pentanes plus as a diluent for heavy oil and nonupgraded bitumen is expected by 2005. Other alternatives will have to be found to replace pentanes plus as a diluent. The remaining established reserves of sulphur is 98 million tonnes from natural gas and upgrading of bitumen from mining areas under active development. Sulphur demand is not expected to increase, and Alberta’s sulphur inventory will continue to grow over the forecast period.
Coal The current estimate for remaining established resources for all types of coal is about 34 billion tonnes. This massive resource continues to help meet the energy needs of Albertans, supplying fuel for about 80 per cent of the province’s electricity generation. Alberta’s coal reserves represent over a thousand years of supply at current production levels. Alberta’s total coal production in 2000 was 34 million tonnes of raw coal. Recent sharp increases in coal prices, due to high oil and gas prices and record high global steel production, improved prospects for Alberta’s low-sulphur coal and created opportunities for extending coal production. Subbituminous coal production is expected to increase in the middle part of the forecast period to meet demand for additional electrical generating capacity.

EUB Statistical Series 2001-98: Alberta’s Reserves 2000 and Supply/Demand Outlook / Economics •••• 1-1
1 Energy Prices and Economic Performance
1.1 Introduction
Alberta’s prosperity as an energy-exporting province, and consequently its own energy supply and demand, are strongly affected by external energy markets. Alberta is Canada’s leading producer of crude oil, bitumen, natural gas, natural gas liquids, sulphur and, in volumetric terms, coal.1 This section describes the outlook for world oil prices, the Canadian economic performance, and the economic and demographic outlooks for Alberta. These factors form the basis for projecting energy supply and demand in Alberta and their impact on resource development.
1.2 Energy and Sulphur Prices
The price of Alberta crude oil is determined by international market forces and is most closely associated with the reference price of West Texas Intermediate (WTI) crude oil, depicted in Figure 1.1. The world oil prices represent crude oil produced by members of the Organization of Petroleum Exporting Countries (OPEC). The North American crude oil price is set in Chicago and is usually US$1.50-$2.00 per barrel higher than the OPEC price, a reflection of shipping costs of OPEC crude to the North American continent. For simplicity, the EUB uses WTI crude prices as a proxy for world oil prices, as it is more relevant to Alberta crude oil markets. The price of WTI crude oil fell to US$10.24 per barrel (US$64/m3) in November 1998 and then recovered to US$25.45 per barrel in September 1999, after major petroleum-exporting countries implemented production cutbacks. Since late 1999, WTI crude oil prices have fluctuated in the range of US$25-$30 per barrel, although occasionally exceeding US$35. However, with the worldwide economic slowdown, it is expected that growth in demand for crude oil will be reduced. The supply of crude oil from non-OPEC countries has also been on the rise due to strong oil prices. The EUB believes that these fundamentals will drive the price of crude oil down if OPEC’s market share is to be maintained. It expects that over the forecast period the price of WTI will gradually stabilize at roughly US$24 per barrel. This price level is sufficient to stimulate exploration outside of the OPEC countries and foster continuing improvements in exploration and recovery technology. The increase in non-OPEC production stimulated by high prices will reduce the OPEC’s power to increase prices without lowering its market share. Wellhead oil prices in Alberta are expected to move in tandem with WTI after adjusting for transportation tariffs, exchange rates, and quality differentials. Since Alberta prices are quoted in Canadian dollars, they will vary inversely with the exchange rate. That is, if the Canadian dollar declined in value relative to the U.S. dollar, then crude oil prices would increase in Canadian dollars. The yearly forecast wellhead price of crude oil in Alberta is shown in both current and constant Canadian dollars in Figure 1.2. Currently, the differentials between light-medium crude, on the one hand, and bitumen or conventional heavy crude, on the other, are exceptionally wide by historical standards. The forecast calls for the bitumen price to revert to 60 per cent of the light-medium price
1 British Columbia produced some 24 million tonnes of high-volatile coal that was shipped to export markets at a
higher price than the Alberta average.
1-2 •••• EUB Statistical Series 2001-98: Alberta’s Reserves 2000 and Supply/Demand Outlook/ Economics
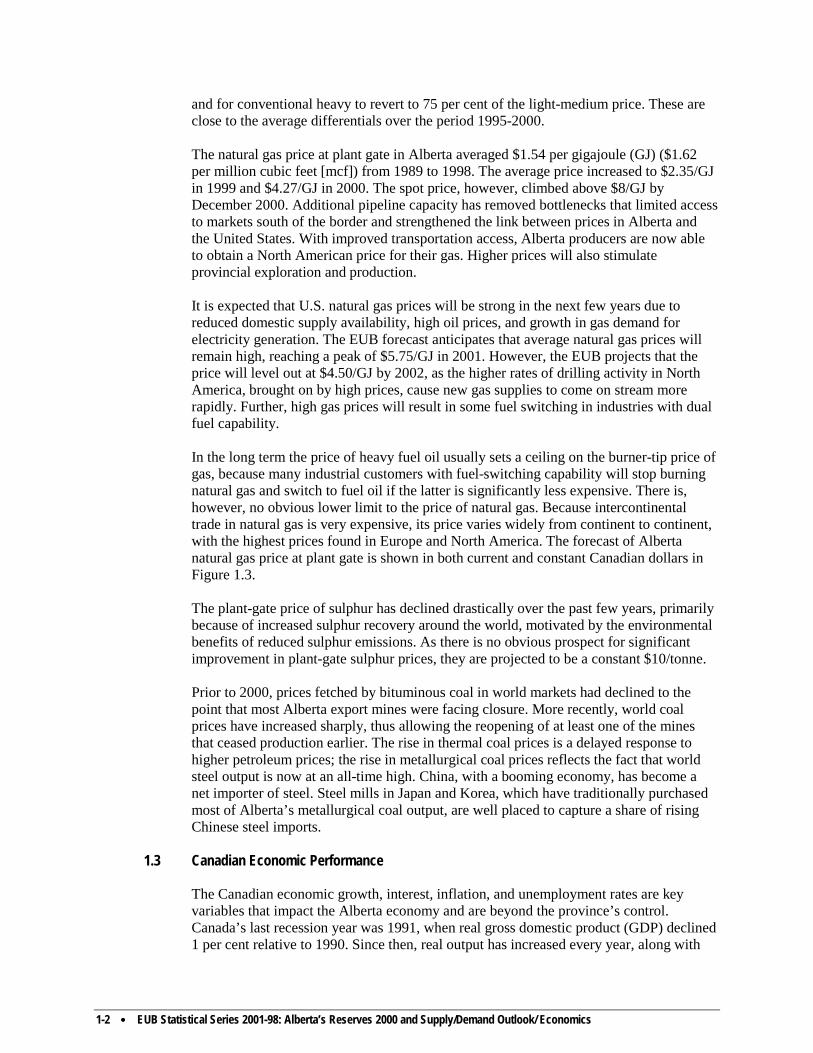
and for conventional heavy to revert to 75 per cent of the light-medium price. These are close to the average differentials over the period 1995-2000. The natural gas price at plant gate in Alberta averaged $1.54 per gigajoule (GJ) ($1.62 per million cubic feet [mcf]) from 1989 to 1998. The average price increased to $2.35/GJ in 1999 and $4.27/GJ in 2000. The spot price, however, climbed above $8/GJ by December 2000. Additional pipeline capacity has removed bottlenecks that limited access to markets south of the border and strengthened the link between prices in Alberta and the United States. With improved transportation access, Alberta producers are now able to obtain a North American price for their gas. Higher prices will also stimulate provincial exploration and production. It is expected that U.S. natural gas prices will be strong in the next few years due to reduced domestic supply availability, high oil prices, and growth in gas demand for electricity generation. The EUB forecast anticipates that average natural gas prices will remain high, reaching a peak of $5.75/GJ in 2001. However, the EUB projects that the price will level out at $4.50/GJ by 2002, as the higher rates of drilling activity in North America, brought on by high prices, cause new gas supplies to come on stream more rapidly. Further, high gas prices will result in some fuel switching in industries with dual fuel capability. In the long term the price of heavy fuel oil usually sets a ceiling on the burner-tip price of gas, because many industrial customers with fuel-switching capability will stop burning natural gas and switch to fuel oil if the latter is significantly less expensive. There is, however, no obvious lower limit to the price of natural gas. Because intercontinental trade in natural gas is very expensive, its price varies widely from continent to continent, with the highest prices found in Europe and North America. The forecast of Alberta natural gas price at plant gate is shown in both current and constant Canadian dollars in Figure 1.3. The plant-gate price of sulphur has declined drastically over the past few years, primarily because of increased sulphur recovery around the world, motivated by the environmental benefits of reduced sulphur emissions. As there is no obvious prospect for significant improvement in plant-gate sulphur prices, they are projected to be a constant $10/tonne. Prior to 2000, prices fetched by bituminous coal in world markets had declined to the point that most Alberta export mines were facing closure. More recently, world coal prices have increased sharply, thus allowing the reopening of at least one of the mines that ceased production earlier. The rise in thermal coal prices is a delayed response to higher petroleum prices; the rise in metallurgical coal prices reflects the fact that world steel output is now at an all-time high. China, with a booming economy, has become a net importer of steel. Steel mills in Japan and Korea, which have traditionally purchased most of Alberta’s metallurgical coal output, are well placed to capture a share of rising Chinese steel imports.
1.3 Canadian Economic Performance The Canadian economic growth, interest, inflation, and unemployment rates are key variables that impact the Alberta economy and are beyond the province’s control. Canada’s last recession year was 1991, when real gross domestic product (GDP) declined 1 per cent relative to 1990. Since then, real output has increased every year, along with
EUB Statistical Series 2001-98: Alberta’s Reserves 2000 and Supply/Demand Outlook / Economics •••• 1-3
real GDP. It is expected that the Canadian economy will grow every year during the forecast period, albeit at a slower pace in 2001. The national unemployment rate fell from 9.7 per cent in 1996 to 7.6 per cent in 1999 and is expected to decline further, levelling off at 5.3 per cent before 2010. Both the prime interest rate on bank loans and the inflation rate as measured by the national consumer price index had been increasing slowly until early in 2001. However, moderation in U.S. economic activity and potential slowdown in the Canadian economy have resulted in lower interest rates on both sides of the border. While the inflation rate is expected to be modestly lower throughout the forecast period, the interest rate is expected to rise slightly by the year 2005 and decline later in the decade. Although the Canadian dollar has depreciated against the U.S. dollar in recent months, a strengthening is expected, because the economic slowdown in Canada is expected to be milder than in the U.S. A lower inflation rate and expected recovery in non-energy commodity prices also tend to improve Canada’s terms of trade. Table 1.1 summarizes trends in national economic variables.
Table 1.1. Major assumptions concerning the Canadian economy (averages over 2000-2010)1
Canadian economic growth rate 2.8% Canadian inflation rate 1.9% Value of Canadian $ in terms of US$ 0.69
1 Source (except for exchange rate): WEFA Group, Canadian Macroeconomic Long-term Forecast and Analysis.
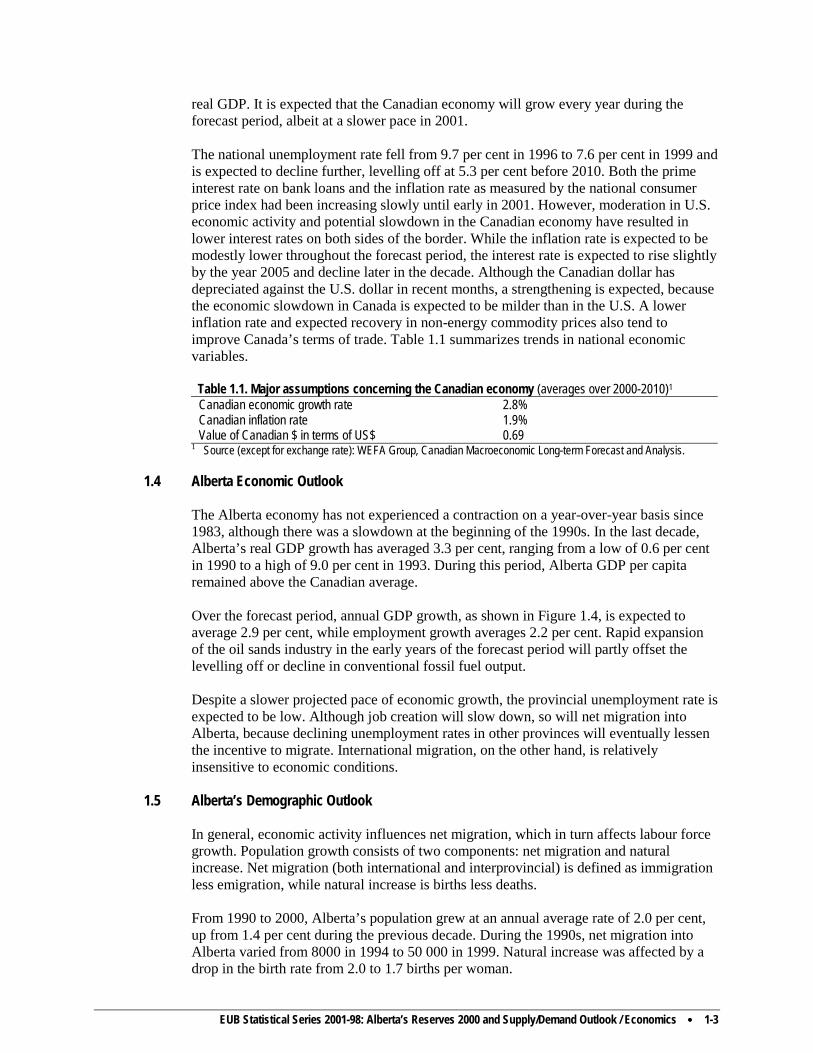
1.4 Alberta Economic Outlook The Alberta economy has not experienced a contraction on a year-over-year basis since 1983, although there was a slowdown at the beginning of the 1990s. In the last decade, Alberta’s real GDP growth has averaged 3.3 per cent, ranging from a low of 0.6 per cent in 1990 to a high of 9.0 per cent in 1993. During this period, Alberta GDP per capita remained above the Canadian average. Over the forecast period, annual GDP growth, as shown in Figure 1.4, is expected to average 2.9 per cent, while employment growth averages 2.2 per cent. Rapid expansion of the oil sands industry in the early years of the forecast period will partly offset the levelling off or decline in conventional fossil fuel output. Despite a slower projected pace of economic growth, the provincial unemployment rate is expected to be low. Although job creation will slow down, so will net migration into Alberta, because declining unemployment rates in other provinces will eventually lessen the incentive to migrate. International migration, on the other hand, is relatively insensitive to economic conditions.
1.5 Alberta’s Demographic Outlook In general, economic activity influences net migration, which in turn affects labour force growth. Population growth consists of two components: net migration and natural increase. Net migration (both international and interprovincial) is defined as immigration less emigration, while natural increase is births less deaths. From 1990 to 2000, Alberta’s population grew at an annual average rate of 2.0 per cent, up from 1.4 per cent during the previous decade. During the 1990s, net migration into Alberta varied from 8000 in 1994 to 50 000 in 1999. Natural increase was affected by a drop in the birth rate from 2.0 to 1.7 births per woman.

1-4 •••• EUB Statistical Series 2001-98: Alberta’s Reserves 2000 and Supply/Demand Outlook/ Economics
Over the forecast period, the Alberta population is projected to increase from 3.0 million in 2000 to 3.6 million in 2010, a yearly increase of 1.9 per cent. Net migration into Alberta is forecast to vary between 19 000 and 49 000. A forecast of population by gender is presented in Figure 1.5.

EUB Statistical Series 2001-98: Alberta’s Reserves 2000 and Supply/Demand Outlook / Economics •••• 1-5
Figure 1.1. Price of WTI at Chicago
Figure 1.2. Average price of oil at Alberta wellhead
1-6 •••• EUB Statistical Series 2001-98: Alberta’s Reserves 2000 and Supply/Demand Outlook/ Economics
Figure 1.3. Average price of natural gas at plant gate
Figure 1.4. Alberta GDP growth, unemployment, and inflation rates

EUB Statistical Series 2001-98: Alberta’s Reserves 2000 and Supply/Demand Outlook / Economics •••• 1-7
Figure 1.5. Alberta population trends
EUB Statistical Series 2001-98: Alberta’s Reserves 2000 and Supply/Demand Outlook / Crude Bitumen •••• 2-1
2 Crude Bitumen
2.1 Reserves of Crude Bitumen 2.1.1 Provincial Summary
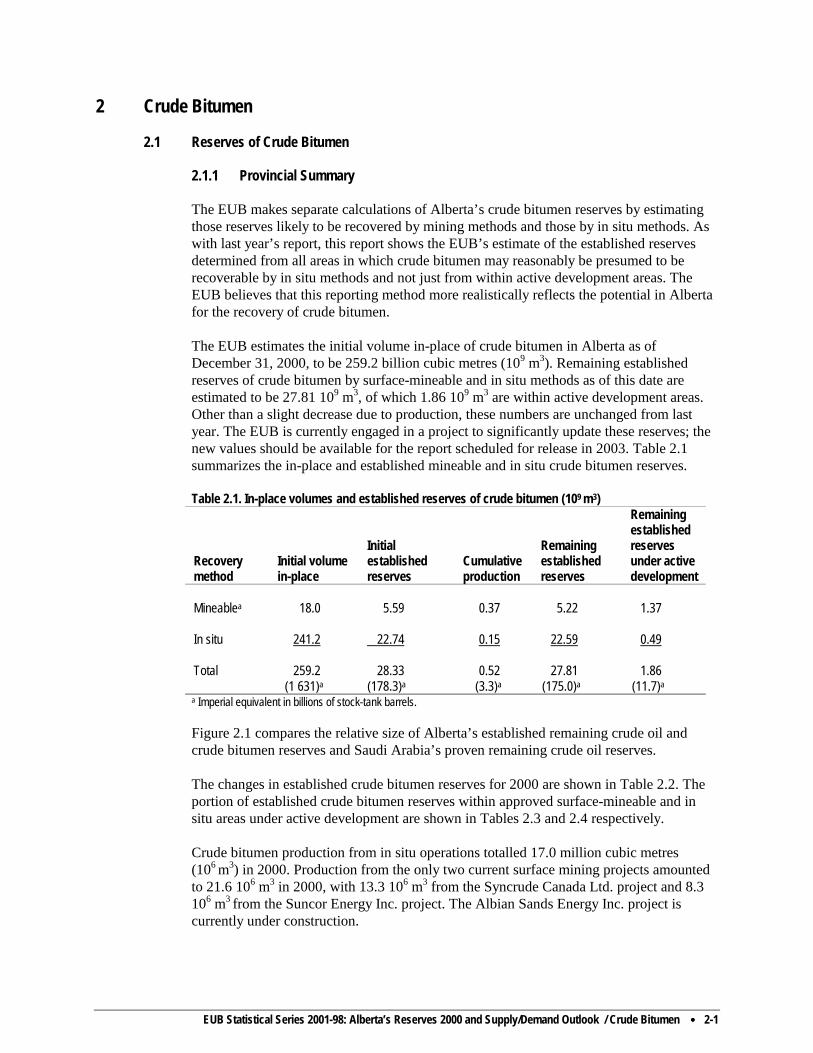
The EUB makes separate calculations of Alberta’s crude bitumen reserves by estimating those reserves likely to be recovered by mining methods and those by in situ methods. As with last year’s report, this report shows the EUB’s estimate of the established reserves determined from all areas in which crude bitumen may reasonably be presumed to be recoverable by in situ methods and not just from within active development areas. The EUB believes that this reporting method more realistically reflects the potential in Alberta for the recovery of crude bitumen. The EUB estimates the initial volume in-place of crude bitumen in Alberta as of December 31, 2000, to be 259.2 billion cubic metres (109 m3). Remaining established reserves of crude bitumen by surface-mineable and in situ methods as of this date are estimated to be 27.81 109 m3, of which 1.86 109 m3 are within active development areas. Other than a slight decrease due to production, these numbers are unchanged from last year. The EUB is currently engaged in a project to significantly update these reserves; the new values should be available for the report scheduled for release in 2003. Table 2.1 summarizes the in-place and established mineable and in situ crude bitumen reserves. Table 2.1. In-place volumes and established reserves of crude bitumen (109 m3) Recovery method
Initial volume in-place
Initial established reserves
Cumulative production
Remaining established reserves
Remaining established reserves under active development
Mineablea
18.0
5.59
0.37
5.22
1.37
In situ
241.2
22.74
0.15
22.59
0.49
Total
259.2
28.33
0.52
27.81
1.86
(1 631)a (178.3)a (3.3)a (175.0)a (11.7)a a Imperial equivalent in billions of stock-tank barrels. Figure 2.1 compares the relative size of Alberta’s established remaining crude oil and crude bitumen reserves and Saudi Arabia’s proven remaining crude oil reserves. The changes in established crude bitumen reserves for 2000 are shown in Table 2.2. The portion of established crude bitumen reserves within approved surface-mineable and in situ areas under active development are shown in Tables 2.3 and 2.4 respectively. Crude bitumen production from in situ operations totalled 17.0 million cubic metres (106 m3) in 2000. Production from the only two current surface mining projects amounted to 21.6 106 m3 in 2000, with 13.3 106 m3 from the Syncrude Canada Ltd. project and 8.3 106 m3 from the Suncor Energy Inc. project. The Albian Sands Energy Inc. project is currently under construction.

2-2 •••• EUB Statistical Series 2001-98: Alberta’s Reserves 2000 and Supply/Demand Outlook / Crude Bitumen
Table 2.2. Change in established crude bitumen reserves (106 m3) 2000 1999 Change Initial established reserves Mineable 5 590 5 590 0 In situ 22 740 22 740 0 Total 28 330 28 330 0 (178 280)a (178 280)a Cumulative production Mineable 371 349 +22 In situ 150 133 +17 Total 521 482 +39 Remaining established reserves Mineable 5 219 5 241 -22 In situ 22 590 22 607 -17 Total 27 809 27 848 -39 (175 000)a (175 240)a aImperial equivalent in millions of stock-tank barrels. Table 2.3. Remaining established mineable crude bitumen reserves in areas under active
development as of December 31, 2000 Initial Initial Remaining mineable established established volume mineable Cumulative mineable Project areaa in-placeb reserveb production reserve Development (ha) (106 m3) (106 m3) (106 m3) (106 m3) Albian Sands 10 096 574 178 0 178 Suncorc 15 370 878 604 136 468 Syncruded 21 672 1 433 959 235 724 Total 47 138 2 885 1 741 371 1 370
aThe project areas correspond to the areas defined in the project approval. bDefinitions are given in Figure 2.2.
cIncludes the Steepbank/Millennium project area. dIncludes the Aurora North project area.
EUB Statistical Series 2001-98: Alberta’s Reserves 2000 and Supply/Demand Outlook / Crude Bitumen •••• 2-3
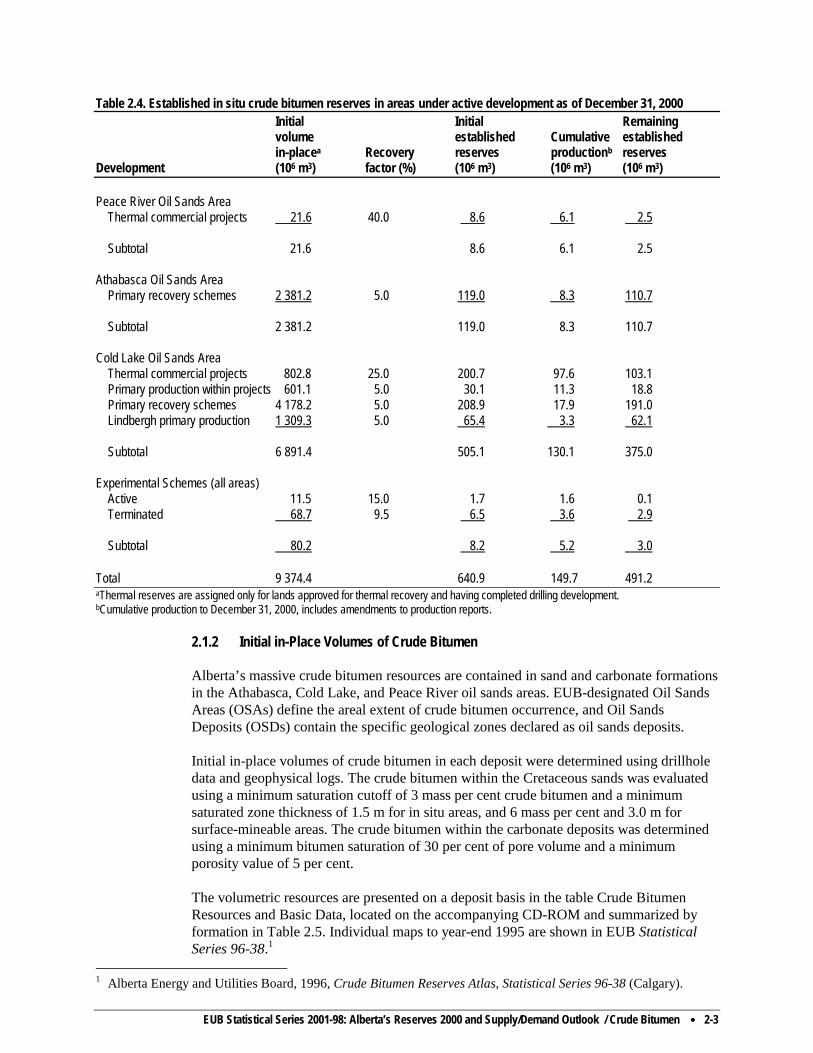
Table 2.4. Established in situ crude bitumen reserves in areas under active development as of December 31, 2000 Initial Initial Remaining volume established Cumulative established in-placea Recovery reserves productionb reserves Development (106 m3) factor (%) (106 m3) (106 m3) (106 m3) Peace River Oil Sands Area Thermal commercial projects 21.6 40.0 8.6 6.1 2.5 Subtotal 21.6 8.6 6.1 2.5 Athabasca Oil Sands Area Primary recovery schemes 2 381.2 5.0 119.0 8.3 110.7 Subtotal 2 381.2 119.0 8.3 110.7 Cold Lake Oil Sands Area Thermal commercial projects 802.8 25.0 200.7 97.6 103.1 Primary production within projects 601.1 5.0 30.1 11.3 18.8 Primary recovery schemes 4 178.2 5.0 208.9 17.9 191.0 Lindbergh primary production 1 309.3 5.0 65.4 3.3 62.1 Subtotal 6 891.4 505.1 130.1 375.0 Experimental Schemes (all areas) Active 11.5 15.0 1.7 1.6 0.1 Terminated 68.7 9.5 6.5 3.6 2.9 Subtotal 80.2 8.2 5.2 3.0 Total 9 374.4 640.9 149.7 491.2 aThermal reserves are assigned only for lands approved for thermal recovery and having completed drilling development. bCumulative production to December 31, 2000, includes amendments to production reports.
2.1.2 Initial in-Place Volumes of Crude Bitumen
Alberta’s massive crude bitumen resources are contained in sand and carbonate formations in the Athabasca, Cold Lake, and Peace River oil sands areas. EUB-designated Oil Sands Areas (OSAs) define the areal extent of crude bitumen occurrence, and Oil Sands Deposits (OSDs) contain the specific geological zones declared as oil sands deposits. Initial in-place volumes of crude bitumen in each deposit were determined using drillhole data and geophysical logs. The crude bitumen within the Cretaceous sands was evaluated using a minimum saturation cutoff of 3 mass per cent crude bitumen and a minimum saturated zone thickness of 1.5 m for in situ areas, and 6 mass per cent and 3.0 m for surface-mineable areas. The crude bitumen within the carbonate deposits was determined using a minimum bitumen saturation of 30 per cent of pore volume and a minimum porosity value of 5 per cent. The volumetric resources are presented on a deposit basis in the table Crude Bitumen Resources and Basic Data, located on the accompanying CD-ROM and summarized by formation in Table 2.5. Individual maps to year-end 1995 are shown in EUB Statistical Series 96-38.1
1 Alberta Energy and Utilities Board, 1996, Crude Bitumen Reserves Atlas, Statistical Series 96-38 (Calgary).

2-4 •••• EUB Statistical Series 2001-98: Alberta’s Reserves 2000 and Supply/Demand Outlook / Crude Bitumen
Table 2.5. Initial in-place volumes of crude bitumen Average bitumen
saturation Oil sands area Oil sands deposit
Initial volume in-place (106 m3)
Area (106 ha)
Average pay thickness ( m)
Mass (%)
Pore volume (%)
Average porosity (%)
Athabasca Grand Rapids 8 678 689 7.2 6.3 56 30 Wabiskaw-McMurray (mineable) 17 998 286 30.5 9.7 69 30 Wabiskaw-McMurray (in situ) 119 234 4 329 19.0 7.9 62 28 Nisku 10 330 499 8.0 5.7 63 21 Grosmont 50 500 4 167 10.4 4.7 68 16 Total 206 740 Cold Lake Grand Rapids 17 304 1 709 5.8 9.5 61 31 Clearwater 11 051 589 15.0 8.9 64 30 Wabiskaw-McMurray 3 592 658 5.8 6.3 54 26 Total 31 947 Peace River Bluesky-Gething 9 926 1 254 8.7 6.4 60 23 Belloy 282 26 8.0 7.8 64 27 Debolt 7 800 328 22.5 5.3 65 19 Shunda 2 510 143 14.0 5.3 52 23 Total 20 518 Grand total 259 205 The Surface Mineable Area (SMA) is an EUB-defined area of 37 townships north of Fort McMurray covering that part of the Athabasca Wabiskaw-McMurray deposit where the total overburden generally does not exceed 75 m. As such, it is presumed that the primary method of recovery will be through the use of surface-mining techniques, unlike the rest of Alberta’s crude bitumen area, where recovery will be through in situ methods. The estimate of the initial volume in-place of crude bitumen within the SMA remains unchanged at 18.0 109 m3. Calculation of in situ resources includes a continuing conversion from the former manual process to an automated mapping and resource evaluation system. As a result, the resources for a number of the pools have been determined from geological maps instead of by the original building-block method. The total initial volume of crude bitumen in-place for the designated deposits as of December 31, 2000, is 241.2 109 m3, unchanged from last year. 2.1.3 Surface-Mineable Crude Bitumen Reserves Potential mineable areas within the SMA were identified using economic strip ratio (ESR) criteria, a minimum saturation cutoff of 7 mass per cent bitumen, and a minimum saturated zone thickness cutoff of 3.0 m. The ESR criteria are fully explained in ERCB Report 79-H, Appendix III.2
2 Energy Resources Conservation Board, 1979, Alsands Fort McMurray Project, ERCB Report 79-H (Calgary).
EUB Statistical Series 2001-98: Alberta’s Reserves 2000 and Supply/Demand Outlook / Crude Bitumen •••• 2-5
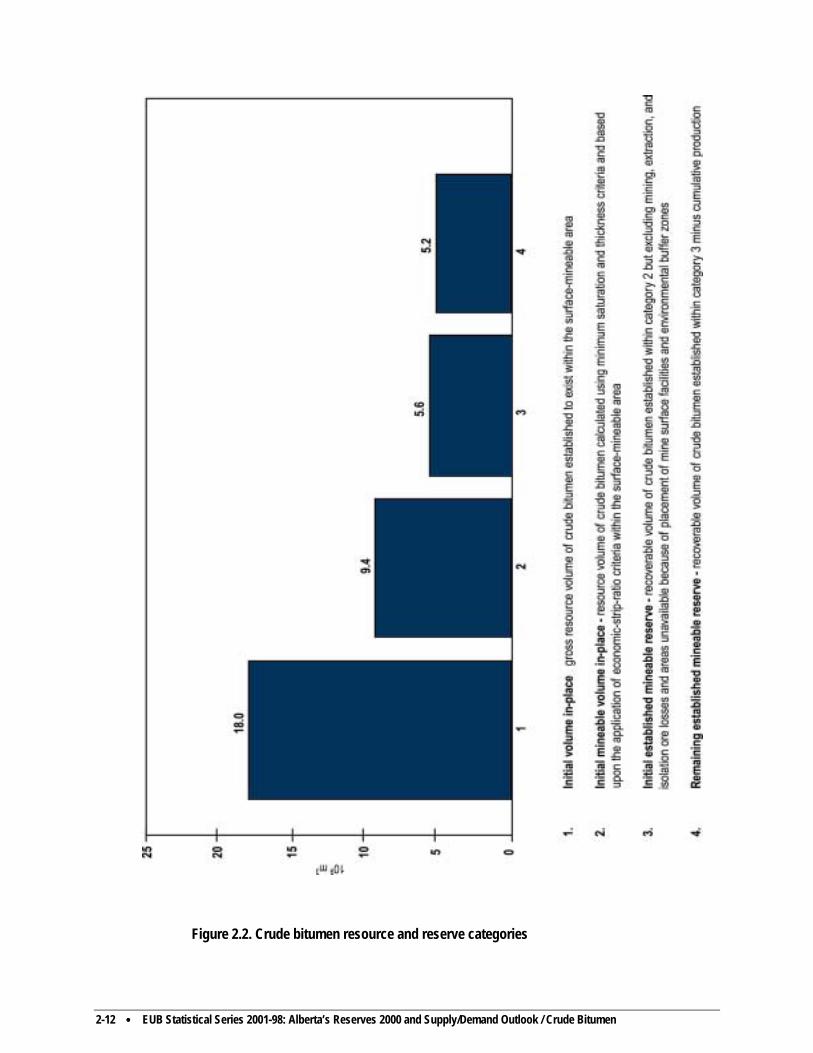
The initial mineable volume in-place of crude bitumen is estimated as of December 31, 2000, to be 9.4 109 m3. Reduction factors were applied to this initial mineable resource volume to determine the established mineable reserve volume. These factors account for ore sterilization due to environmental protection corridors along major rivers (10 per cent), small isolated ore bodies (10 per cent), location of surface facilities (plant sites, tailings ponds, waste dumps) (10 per cent), and mining/extraction losses (18 per cent). The resulting initial established mineable reserve of crude bitumen is estimated to be 5.6 109 m3, unchanged from December 31, 1999. Only a small fraction of the initial established mineable reserve is under active development. Currently, Suncor and Syncrude are the only two producers in the SMA, and the cumulative bitumen production from these projects is 371 106 m3. Albian Sands is presently constructing its Muskeg River Mine, and the reserves for this project are included in Table 2.3. The remaining established mineable crude bitumen reserve as of December 31, 2000, is 5.22 109 m3, slightly lower than last year due to the production of nearly 22 106 m3 in 2000. The crude bitumen reserves categories are presented in Figure 2.2. Table 2.3 shows the remaining established mineable crude bitumen reserves from deposits under active development as of December 31, 2000. 2.1.4 In Situ Crude Bitumen Reserves The EUB has determined an in situ initial established reserve for those areas considered amenable to in situ recovery methods. Reserves attributable to thermal development were determined using a minimum saturation cutoff of 3 mass per cent crude bitumen and a minimum zone thickness of 10.0 m. For primary development, the same saturation cutoff of 3 mass per cent was used, with a minimum zone thickness of 3.0 m. Recovery factors of 20 per cent for thermal development and 5 per cent for primary development were applied to the areas within the cutoffs. The recovery factor for thermal development is lower than some of the active project recovery factors to account for the uncertainty in the recovery processes and the uncertainty of development in the poorer quality resource areas. The EUB’s 2000 estimate of initial established reserves for in situ areas remains unchanged at 22.74 109 m3. This reserve will be significantly refined and the results released in the report scheduled for 2003. Cumulative production within the in situ areas now totals 150 106 m3, of which 130 106 m3 is from the Cold Lake OSA. As a result of the 17 106 m3 production in 2000, remaining established reserves of crude bitumen from in situ areas are now slightly lower, at 22.59 109 m3. Of this total, 69 per cent occurs within the Athabasca OSA, 23 per cent within Cold Lake, and 8 percent within the Peace River OSA. The EUB’s 2000 estimate of the established in situ crude bitumen reserves under active development is shown in Table 2.4. The EUB has assigned initial volumes in-place and initial and remaining established reserves for commercial projects, primary recovery schemes, and active experimental schemes where all or a portion of the wells have been drilled and completed. An aggregate reserve is shown for all active experimental schemes, as well as an estimate of initial volumes in-place and cumulative production. An aggregate
2-6 •••• EUB Statistical Series 2001-98: Alberta’s Reserves 2000 and Supply/Demand Outlook / Crude Bitumen
reserve is also shown for all commercial and primary recovery schemes within a given oil sands deposit and area. The initial established reserves under primary development are based on a 5 per cent average recovery factor. The recovery factors of 40 and 25 per cent for thermal commercial projects in the Peace River and Cold Lake areas respectively reflect the application of various steaming strategies and project designs. That part of the total remaining established reserves of crude bitumen from within active in situ areas is estimated to be 491.2 106 m3, a decrease of 6.9 106 m3 from 1999. 2.1.5 Ultimate Potential of Crude Bitumen The EUB estimates the ultimate in-place volume of crude bitumen to be about 400 109 m3, consisting of 22 109 m3 within the SMA in deposits that may eventually be amenable to surface mining (as well as some limited in situ recovery) and the remainder being deeper deposits that will require the use of in situ recovery or underground mining techniques. Although drilling and log analyses indicate the large ultimate in-place volume, knowledge of variations in quality and the effect of this on recovery potential is still limited. In addition, there has been little experimentation to date to establish the expected recovery factor for some types of resources, particularly carbonates. Therefore, the portions of in-place volumes for the Cretaceous sand and Paleozoic carbonate deposits that will require the use of in situ recovery methods were broken down into established and probable categories, and different recovery factors were applied to each category in establishing the ultimate potential of crude bitumen for the in situ areas. The recovery factors selected reflect the EUB’s current knowledge respecting the quality of the in-place resources, the amount of experimentation done to date to establish recovery techniques, and a projection of future improvements in those techniques. The ultimate potential (which is the portion of ultimate in-place volume that is potentially recoverable) of crude bitumen from Cretaceous sediments by in situ recovery methods is estimated to be 33 109 m3 and from carbonate sediments some 6 109 m3. Nearly 11 109 m3 are expected from within the surface-mineable boundary, with a little more than 10 109 m3 coming from surface mining and about 0.4 109 m3 from in situ methods. For current projects, it is also assumed that tailings ponds and discard sites will either be located on nonmineable areas or be removed from the mineable areas in order to recover underlying economic mineable ore. The total initial ultimate potential crude bitumen is therefore about 50 109 m3.
2.2 Supply of and Demand for Crude Bitumen In this report, crude bitumen refers to total bitumen production; nonupgraded bitumen refers to the portion of crude bitumen production blended with diluent and sent to markets by pipeline; upgraded bitumen production refers to the portion of crude bitumen upgraded to SCO, which is used by refineries as feedstock. This section discusses production and disposition of crude bitumen. It includes crude bitumen production by surface mining and in situ methods, upgrading of bitumen to synthetic crude oil (SCO), and disposition of both SCO and blended bitumen. Upgrading is the term given to a process that converts bitumen and heavy crude oil into SCO, which has a density and viscosity similar to conventional light-medium crude oil. Upgraders chemically add hydrogen to bitumen, subtract carbon from it, or both. In upgrading processes, essentially all the sulphur contained in bitumen, either in elemental
EUB Statistical Series 2001-98: Alberta’s Reserves 2000 and Supply/Demand Outlook / Crude Bitumen •••• 2-7
form or as a constituent of oil sands coke, is removed. Most oil sands coke is stockpiled, with some burned in small quantities to generate electricity. Elemental sulphur is either stockpiled or shipped to facilities that convert it to sulphuric acid for use mainly in the manufacture of fertilizer. Two methods are used for recovery of bitumen, depending on the depth of the deposit. The shallow-depth deposits in Athabasca (Fort McMurray) are currently recovered by surface mining. In this method overburden is removed, oil sands ore is mined, and bitumen is extracted using hot water. Unlike the mineable area of Athabasca, other oil sands deposits are located deeper in the earth. For these deposits, in situ methods have been proven technically feasible. In this method the heat from steam reduces the viscosity of the bitumen, allowing it to be separated from the sand and pumped to the surface. A number of these deposits could be put on production with primary recovery. Bitumen crude must be diluted with some lighter viscosity product in order to be transported in pipelines. Pentanes plus is currently used in Alberta as diluent. Diluent used to transport bitumen to Alberta destinations is usually recycled; however, the volumes used to dilute bitumen to markets outside Alberta are removed from the province. Other products such as naptha, light crude oil, and synthetic oil can also be used as diluent to allow bitumen to meet pipeline specifications. Use of heated and insulated pipelines may decrease the amount of diluent required over time. 2.2.1 Crude Bitumen Production In 2000, Alberta produced 104.8 103 m3/d of crude bitumen, with surface mining accounting for 56 per cent and in situ for 44 per cent. In the same year, nonupgraded bitumen and SCO accounted for 40 per cent of Alberta’s total crude oil and equivalent production. The forecast of crude bitumen and SCO production relies heavily on information provided by project sponsors. Project viability depends largely on the cost of producing and transporting the products and on the price buyers are willing to pay. Other factors that bear on project economics are refining capacity and competition with other supply sources in U.S. and Canadian markets. 2.2.1.1 Mined Crude Bitumen Since 1990, Syncrude and Suncor bitumen production has increased steadily, reaching a level of 59.1 103 m3/d in 2000, with Syncrude accounting for 62 per cent and Suncor for 38 per cent. In projecting the future supply of bitumen from mining, the EUB considered potential production from the existing facilities, as well as supply from future projects. The EUB projects that production from Syncrude will reach 80.0 103 m3/d and Suncor will produce 47.0 103 m3/d by the year 2010. The EUB also considered two new projects in the mineable area. The first is the Albian Sands project, which is currently under construction and is expected to produce bitumen in 2002 and reach full production capacity of 26.0 103
m3/d by 2004. The second is the project proposed by TrueNorth Energy.

2-8 •••• EUB Statistical Series 2001-98: Alberta’s Reserves 2000 and Supply/Demand Outlook / Crude Bitumen
TrueNorth Energy has a plan to develop the Fort Hills Oil Sands Project, with two phases of production. The first is to begin in 2005, reaching full capacity of approximately 15 103 m3/d in 2006. The second phase will begin in 2008, increasing production to over 30 103 m3/d in 2010. TrueNorth Energy would be the first nonintegrated bitumen producer in the oil sands mining business. The bitumen produced, including diluent, will be transported via third-party pipelines to refineries in Canada and the midwest United States. The EUB is aware of other announced projects, but they have not been considered in this forecast because of uncertainties about timing and project scope. If production were to come on stream from these proposed projects, it would be in the latter part of the forecast period. Figure 2.3 shows that total mined bitumen production will increase from 59.1 103 m3/d in 2000 to some 183.1 103 m3/d by 2010, representing an average increase of some 11 per cent per year. 2.2.1.2 In Situ Crude Bitumen In situ crude bitumen production has more than doubled since 1990, reaching a level of 45.8 103 m3/d in 2000. To date, the majority of in situ bitumen has been marketed in nonupgraded form outside of Alberta. However, by the end of the forecast period some 23 per cent of in situ production will be used as bitumen feedstock for SCO production. A small amount of bitumen (5 per cent) is used in Alberta refineries. Similar to surface mining, the future supply of in situ bitumen includes production from existing projects, expansions to existing projects, and development of new projects. In projecting the production from existing and future schemes, the EUB considered all approved projects, projects currently before the EUB, and projects for which it expects applications within the year. For the purposes of this report, it assumed that the existing projects would continue producing at their current production levels over the forecast period. To this projection the EUB has added production of crude bitumen from new and expanded schemes. Production from future crude bitumen projects takes into account past experience, natural gas prices, pipeline availability, and the ability of North American markets to absorb the increased volumes. The EUB also realizes that key forecast factors, such as diluent requirements and price differentials, may delay some projects. Figure 2.3 illustrates that in situ crude bitumen production is expected to rise to 131.0 103 m3/d over the forecast period, representing an average annual increase of some 11 per cent. 2.2.2 Synthetic Crude Oil Production A large portion of Alberta’s bitumen production is upgraded to SCO. The two major upgraders, Suncor and Syncrude, produced 18.2 103 m3/d and 32.6 103 m3/d of SCO respectively in the year 2000. SCO production in Alberta has increased substantially since the commissioning of these two projects. The conversion of crude bitumen to SCO uses different technology at the two existing plants. Therefore the SCO yield through upgrading can vary, depending on the type of technology, the use of products as fuel in the upgrading, the extent of gas liquids recovery, and the extent of residue upgrading. The overall liquid yield factor for the current Suncor delayed coking operation is approximately 0.81, while that for the current fluid coking/hydrocracking operation at Syncrude is 0.85. The proposed overall liquid yield
EUB Statistical Series 2001-98: Alberta’s Reserves 2000 and Supply/Demand Outlook / Crude Bitumen •••• 2-9
factor for the Albian Sands project, via the Shell upgrader using a hydrocracking process, is anticipated to be at or above 0.90. The EUB expects a significant increase in the SCO production over the forecast period, as shown in Figure 2.4. The forecast is based on the projection of production from the existing Suncor and Syncrude plants (including their potential expansions) plus production of SCO from one new project. Suncor’s production of SCO is forecast to reach 63.6 103 m3/d in 2008 and remain at this level to 2010. Suncor has announced its vision to increase its upgraded crude production by • the completion of Project Millennium in 2002, increasing capacity to 35.0 103 m3/d; • the addition of an in situ bitumen recovery operation (Firebag In Situ Oil Sands
Operation), with start-up expected in 2005; • modification of the upgrader (the addition of a vacuum tower) to increase capacity of
SCO by 8.0 103 m3/d starting in 2005; and • the addition of cokers to the upgrading complex, together with associated
hydrotreating, increasing capacity to 63.6 103 m3/d by 2008. Syncrude is expected to reach 72.2 103 m3/d of SCO in 2008 and remain relatively flat through the remainder of the forecast period. Its expansion plan consists of a four-staged project that began in 1996 and is expected to be complete by 2008: • Stage one included the development of the North mine and debottlenecking of the
upgrader, increasing capacity to almost 36.0 103 m3/d in 1999. • Stage two consists of the Aurora Train 1 and additional debottlenecking of the
upgrader at Mildred Lake, resulting in capacity of some 41.0 103 m3/d in 2002. • Stage three will see the upgrader expand and a second train of production at Aurora,
increasing capacity to over 58.0 103 m3/d by 2005. • Stage four includes Aurora Train 3 and further upgrader expansion, with capacity
reaching over 72 103 m3/d by 2008. Over the forecast period, the EUB assumes that Shell Canada will commence production of a new upgrader at Scotford, near Edmonton, with capacity of 23.8 103 m3/d. This upgrader is adjacent to the existing Shell refinery and will upgrade crude bitumen from the Albian Sands project. In 2010, provincial SCO production will reach 159.6 103 m3/d, with Syncrude accounting for 45 per cent, Suncor accounting for 40 per cent, and Shell accounting for 15 per cent of production.
2.2.3 Demand for Synthetic Crude Oil and Nonupgraded Bitumen
SCO has two principal advantages over light crudes: it has very low sulphur content and it produces very little heavy fuel oil. The latter property is particularly desirable in Alberta, where there is virtually no local market for heavy fuel oil. Among the disadvantages of SCO in conventional refineries are low quality of distillate output, the need to limit SCO intake to a fraction of total crude requirements, and the high level of aromatics (benzene) that may have undesirable environmental properties. Overall demand for Alberta SCO and blended bitumen is influenced by many factors, including the price differential between light and heavy crude oil, expansion of refineries

2-10 •••• EUB Statistical Series 2001-98: Alberta’s Reserves 2000 and Supply/Demand Outlook / Crude Bitumen
currently processing SCO and blended bitumen, altering the configuration of current light crude oil refineries, and the availability and price of diluent for shipping blended bitumen. Alberta oil refineries use SCO, bitumen, and other feedstocks to produce a wide variety of refined petroleum products. In 2000, five Alberta refineries with total capacity of 68 103
m3/d used 27.2 103 m3/d of SCO and 2.3 103 m3/d of nonupgraded bitumen. The Alberta refinery demand for SCO represents 53.5 per cent of Alberta SCO production and 5 per cent of nonupgraded bitumen production. It is assumed that over the forecast period no additional refinery capacity will be installed. Figure 2.5 shows that in 2010 Alberta demand for SCO and nonupgraded bitumen is expected to increase to 38.2 103 m3/d and 2.7 103 m3/d respectively. Given the current quality of SCO, western Canada’s nine refineries, with total capacity of 92 103 m3/d, are able to blend up to 30 per cent SCO and a further 4 per cent blended bitumen with crude oil. These refineries receive SCO from both Alberta and Saskatchewan. In eastern Canada, the four Sarnia-area refineries are the sole extraprovincial Canadian market for Alberta SCO. The largest export markets for Alberta SCO and nonupgraded bitumen is the U.S. midwest, with refining capacity of 575 103 m3/d, and the U.S. Rocky Mountain region, with refining capacity of 85.8 103 m3/d. The refineries in these areas are capable of absorbing a substantial increase in supplies of SCO and nonupgraded bitumen from Alberta. Figure 2.5 shows that over the forecast period Alberta exports of SCO will increase from 23.8 103 m3/d to 121.1 103 m3/d and exports of nonupgraded bitumen will increase from 43.5 103 m3/d to 127.9 103 m3/d.

EUB Statistical Series 2001-98: Alberta’s Reserves 2000 and Supply/Demand Outlook / Crude Bitumen •••• 2-11
Figure 2.1. Crude oil and crude bitumen reserves in Alberta and Saudi Arabia
2-12 •••• EUB Statistical Series 2001-98: Alberta’s Reserves 2000 and Supply/Demand Outlook / Crude Bitumen
Figure 2.2. Crude bitumen resource and reserve categories

EUB Statistical Series 2001-98: Alberta’s Reserves 2000 and Supply/Demand Outlook / Crude Bitumen •••• 2-13
Figure 2.3. Alberta crude bitumen production
Figure 2.4. Alberta synthetic crude oil production

2-14 •••• EUB Statistical Series 2001-98: Alberta’s Reserves 2000 and Supply/Demand Outlook / Crude Bitumen
Figure 2.5. Alberta demand and exports of crude bitumen and SCO
EUB Statistical Series 2001-98: Alberta’s Reserves 2000 and Supply/Demand Outlook / Crude Oil •••• 3-1
3 Crude Oil
3.1 Reserves of Crude Oil
3.1.1 Provincial Summary
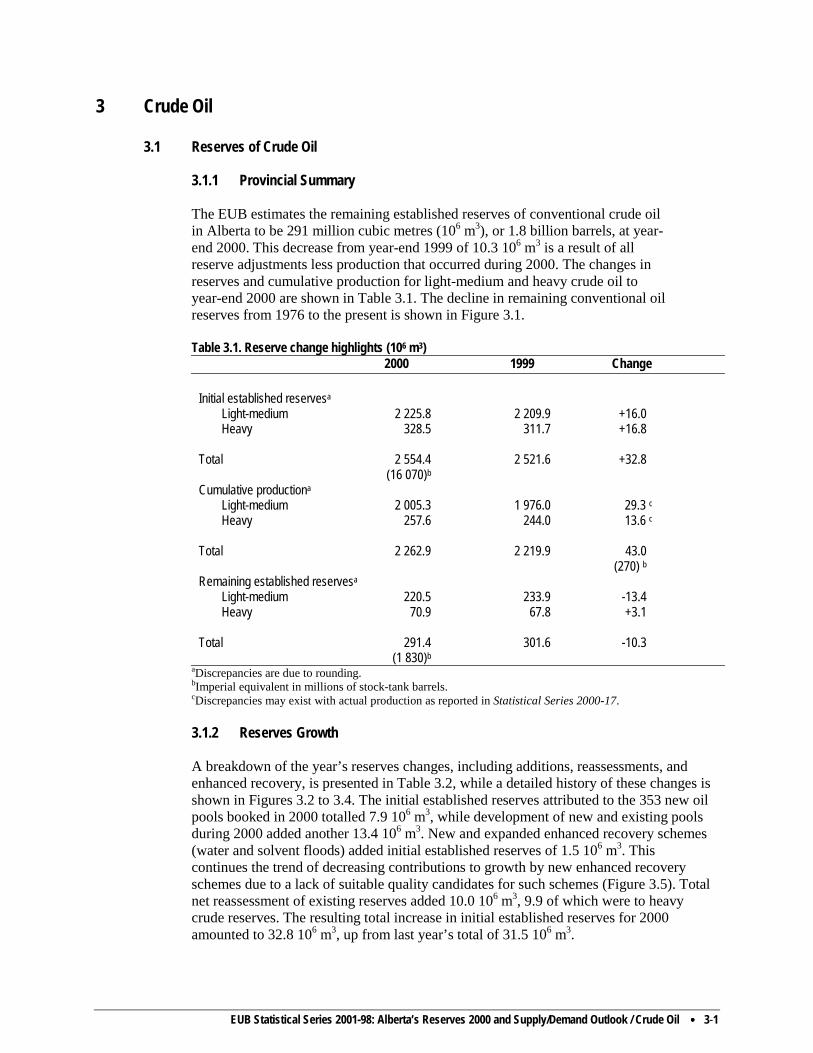
The EUB estimates the remaining established reserves of conventional crude oil in Alberta to be 291 million cubic metres (106 m3), or 1.8 billion barrels, at year-end 2000. This decrease from year-end 1999 of 10.3 106 m3 is a result of all reserve adjustments less production that occurred during 2000. The changes in reserves and cumulative production for light-medium and heavy crude oil to year-end 2000 are shown in Table 3.1. The decline in remaining conventional oil reserves from 1976 to the present is shown in Figure 3.1. Table 3.1. Reserve change highlights (106 m3)
2000 1999 Change Initial established reservesa
Light-medium 2 225.8 2 209.9 +16.0 Heavy 328.5 311.7 +16.8 Total 2 554.4 2 521.6 +32.8 (16 070)b Cumulative productiona Light-medium 2 005.3 1 976.0 29.3 c Heavy 257.6 244.0 13.6 c Total 2 262.9 2 219.9 43.0 (270) b Remaining established reservesa Light-medium 220.5 233.9 -13.4 Heavy 70.9 67.8 +3.1 Total 291.4 301.6 -10.3 (1 830)b
aDiscrepancies are due to rounding. bImperial equivalent in millions of stock-tank barrels. cDiscrepancies may exist with actual production as reported in Statistical Series 2000-17.
3.1.2 Reserves Growth A breakdown of the year’s reserves changes, including additions, reassessments, and enhanced recovery, is presented in Table 3.2, while a detailed history of these changes is shown in Figures 3.2 to 3.4. The initial established reserves attributed to the 353 new oil pools booked in 2000 totalled 7.9 106 m3, while development of new and existing pools during 2000 added another 13.4 106 m3. New and expanded enhanced recovery schemes (water and solvent floods) added initial established reserves of 1.5 106 m3. This continues the trend of decreasing contributions to growth by new enhanced recovery schemes due to a lack of suitable quality candidates for such schemes (Figure 3.5). Total net reassessment of existing reserves added 10.0 106 m3, 9.9 of which were to heavy crude reserves. The resulting total increase in initial established reserves for 2000 amounted to 32.8 106 m3, up from last year’s total of 31.5 106 m3.

3-2 • EUB Statistical Series 2001-98: Alberta’s Reserves 2000 and Supply/Demand Outlook / Crude Oil
Table 3.2. Breakdown of changes in crude oil initial established reserves (106 m3) Light-medium Heavy Total
New discoveries 6.8 1.1 7.9 Development of existing pools 7.8 5.6 13.4 Enhanced recovery (new/expansions) 1.3 0.2 1.5 Reassessment 0.1 9.9 10.0 Total 16.0 16.8 32.8
Reserve additions resulting from drilling and new enhanced recovery schemes totalled 22.8 million cubic metres, up from 14.9 106 m3 in 1999. These additions replaced 53 per cent of Alberta’s 2000 conventional crude oil production of 43.5 106 m3. 3.1.3 Pools with Largest Reserve Changes
Some 1500 oil pools were re-evaluated over the past year, resulting in positive reassessments totalling 33.7 106 m3 and negative reassessments totalling 23.7 106 m3. Established reserves in the Chauvin South MU No. 1 Pool increased by 3337 thousand cubic metres (103 m3) as the result of a reassessment of its waterflood operations. In the commingled Morgan Sparky A, Lloydminster A, Rex A, and Dina B Pool, pool development and higher recovery efficiency increased reserves by 2911 103 m3. Table 3.3 lists those pools having the largest reserve changes in 2000.
3.1.4 Distribution of Oil Reserves by Size and Geology At year-end 2000, oil reserves were assigned to some 7000 light-medium and 2400 heavy crude oil pools in the province. Sixty-one per cent of these pools consist of a single well. The distribution of reserves by pool size shown in Table 3.4 reveals that 90 per cent of the remaining reserves is contained in the largest 14 per cent of pools. Figure 3.6 further illustrates the historical trends in the size of oil pools. The distribution of conventional crude oil reserves by drive mechanism, including their historical average recovery factors, is presented in Table 3.5 and Figure 3.7. Table 3.5 shows that waterflood projects have added 635 106 m3, or 25 per cent of the province’s initial established reserves. Also, pools under solvent flood have realized an average increase in recovery efficiency of 30 per cent over primary depletion.
The distribution of reserves by geological period and by formation, found in Tables 3.6 and 3.7 and graphically represented in Figure 3.8, indicates that the majority of remaining established reserves will be produced from the Lower Cretaceous (33 per cent) and Upper Devonian (23 per cent) Formations.

EUB Statistical Series 2001-98: Alberta’s Reserves 2000 and Supply/Demand Outlook / Crude Oil •••• 3-3
Table 3.3. Major oil reserve changes, 2000 Initial established
reserves (103 m3)
Pool 2000 Change Main reason for change Alderson Arcs D 423 + 300 New waterflood Alderson Lower Mannville C5C 246 +246 New pool Bantry Mannville A 10 870 +1328 Reassessment of primary reserves Bashaw D-2A & D-3A 873 +848 Pools commingled; reassessment of oil in-place Bonnie Glen D-3A 83 000 -300 Reassessment of recovery factor Bow Island Sawtooth U 625 + 268 Reassessment of recovery factor Chauvin Mannville A 1 869 +371 Pool development Chauvin South MU No.1 10 740 +3337 Reassessment of waterflood reserves Cherhill Banff A 3 060 - 505 Reassessment of primary and waterflood reserves Countess Upper Mannville PP 740 - 349 Reassessment of primary and waterflood reserves Enchant Arcs F & G 640 - 270 Reassessment of oil in-place Enchant Arcs J & VV 2 884 +120 Coalesced with Arcs AAA and TT & UU Pools Fenn West D-2 I 514 + 514 New pool Fenn West D-3 H 1 373 + 1373 New pool Garrington Cardium A & B 1 042 + 472 Pool development and reassessment of recovery factor Golden Slave Point A 3 308 + 316 Pool development Grande Prairie Halfway V 621 +355 Recognition of waterflood scheme Hayter Dina Q 1 064 + 564 Reassessment of recovery factor Jenner Upper Mannville A2A 43 - 151 Pool development and reassessment of recovery factor Kakwa Main Cardium A 228 - 171 Reassessment of recovery factor Little Bow Upper Mannville I 1 561 + 422 Reassessment of primary and waterflood reserves Lloydminster Sparky K 3 412 + 966 Pool development and reassessment of recovery factor Marwayne General Petroleum A 356 + 321 Pool development and reassessment of recovery factor Marwayne Sparky C 371 + 343 Pool development Marwayne Sparky D 712 + 258 Pool development Medicine River Jurassic D & GG 4 240 + 834 Pools commingled Morgan Sparky A, Lloyd A, Rex A, Dina B
7 574 +2911 Pool development and reassessment of recovery factor
(continued)

3-4 • EUB Statistical Series 2001-98: Alberta’s Reserves 2000 and Supply/Demand Outlook / Crude Oil
Table 3.3. Major oil reserve changes, 2000 (concluded) Initial established
reserves (103 m3)
Pool 2000 Change Main reason for change Nipisi Gilwood A 58 310 + 770 Reassessment of primary reserves Pembina Belly River FFF, GGG, K2K and S2S
2 471 + 307 New waterflood
Provost Dina L 735 - 246 Reassessment of oil in-place Provost Dina N 2 693 + 385 Reassessment of recovery factor Provost Dina Q 738 + 526 Pool development and reassessment of recovery factor Provost Dina E5E 449 - 158 Reassessment of recovery factor Provost Upper Mannville B 1 485 - 213 Reassessment of recovery factor Provost Upper Mannville BB 2 227 - 1114 Reassessment of recovery factor Provost Upper Mannville T8T 1 183 + 333 Reassessment of recovery factor Provost Upper Mannville U8U 222 - 443 Reassessment of recovery factor Provost Cummings A4A 1 088 + 563 Pool development Rainbow Keg River A 10 740 + 290 Reassessment of solvent flood reserves Rainbow Keg River O 4 179 - 161 Reassessment of solvent flood reserves Rainbow Keg River AA 7 403 - 297 Reassessment of solvent flood reserves Rainbow Keg River I4I 48 - 238 Reassessment of recovery factor Rosevear Bluesky A 446 + 232 Pool development Simonette D-3 D 134 - 133 Reassessment of recovery factor Simonette Beaverhill Lake A 4 829 + 1529 Reassessment of primary and waterflood reserves Strome Ellerslie D 300 - 162 Reassessment of recovery factor Sturgeon Lake South Triassic F 1 097 + 243 Reassessment of recovery factor Wainwright Nisku A & Camrose A
665 - 133 Reassessment of recovery factor
Wimborne D-3 A 4 940 + 260 Reassessment of recovery factor

EUB Statistical Series 2001-98: Alberta’s Reserves 2000 and Supply/Demand Outlook / Crude Oil •••• 3-5
Table 3.4. Distribution of oil reserves by pool size Pool size rangea
Pools
Initial established reserves
Remaining established reserves
(103 m3) No. % 106 m3 % 106 m3 % 1000 or more 286 3 2 121 83 193 66 100-999 1 023 11 316 12 69 24 30-99 1 314 14 72 3 17 6 1-29 6 722 72 45 2 13 4 Total 9 345 100 2 554 100 291 100
aBased on initial established reserves.
3.1.5 Ultimate Potential
The ultimate potential of conventional crude oil was estimated by the EUB in 1994 at 3130 106 m3, reflecting its estimate of geological prospects. Figure 3.9 shows Alberta’s historical and forecast growth of initial established reserves. Figure 3.10 illustrates the historical relationship between remaining reserves and cumulative oil production. It also suggests that the EUB estimate of ultimate potential is still valid. Approximately 72 per cent of the estimated ultimate potential for conventional crude oil has been produced to year-end 2000. Remaining established reserves of 291 106 m3 represent about 10 per cent of the ultimate potential. Known discoveries represent 82 per cent of the ultimate potential, leaving 18 per cent (576 106 m3) of the ultimate potential yet to be discovered. This added to remaining established reserves yields 867 106 m3 of conventional crude oil that will be available for future production. In 2000, both the remaining established reserves and the annual production of crude oil declined. However, there are 576 106 m3 yet to be discovered, which will mitigate the impact of these declines. Additions to existing pools and the discovery of new pools will continue to bring on new reserves and associated production each year. Any future decline in conventional crude oil production within Alberta will be more than offset by increases in crude bitumen and synthetic production, as discussed in Section 2.2.
3.2 Supply of and Demand for Crude Oil
3.2.1 Crude Oil Supply
Over the past several years, production of crude oil, which consists of light-medium and heavy crude oil, has been on decline in Alberta. In 2000, total crude oil production declined to 118.8 103 m3/d. Light-medium crude oil production declined by approximately 4.3 103 m3/d (5 per cent) compared to 1999. However, heavy crude oil production in 2000 increased by 1.9 103 m3/d (5 per cent) over 1999. This resulted in an overall decline in total crude oil production of only 2 per cent from 1999 to 2000, compared to the 11 per cent decline from 1998 to 1999. This reduction in the decline rate reflects industry’s reaction to continued high crude oil prices by increasing oil well drilling and bringing some marginal wells back on production.
In projecting crude oil production over the forecast period, the EUB considered two components: expected crude oil production from existing wells (established reserves) at 2000 year-end and expected production from future wells (new discoveries and

3-6 • EUB Statistical Series 2001-98: Alberta’s Reserves 2000 and Supply/Demand Outlook / Crude Oil
Table 3.5. Conventional crude oil reserves by recovery mechanism as of December 31, 2000
Initial established reserves (106 m3)
Average recovery (%)
Crude oil type and pool type
Initial volume in-place (106 m3)
Primary
Waterflood/gas flood
Solvent flood
Total
Primary
Waterflood/gas flood
Solvent flood
Total
Light-medium Primary depletion 3 762 850 0 0 850 23 - - 23 Waterflood 2 881 436 377 0 813 15 13 - 28 Solvent flood 882 240 159 107 506 27 18 12 57 Gas flood 146 47 10 0 57 32 7 - 39 Heavy Primary depletion 1 533 194 0 0 194 13 - - 13 Waterflood 382 45 89 0 134 12 23 - 35 Total 9 586 1 812 635 107 2 554 27 Percentage of total initial established reserves
71% 25% 4% 100%
Table 3.6. Conventional crude oil reserves by geological period as of December 31, 2000 Initial volume in-
place (106 m3) Initial established
reserves (106 m3) Remaining established
reserves (106 m3)
Average recovery (%) Geological period
Light- medium
Heavy
Light- medium
Heavy
Light- medium
Heavy
Light- medium
Heavy
Cretaceous Upper 2 164 0 353 0 53 - 16 - Lower 1 061 1 687 205 285 32 63 19 17 Jurassic 107 102 21 31 4 4 20 30 Triassic 297 24 62 2 12 0 21 9 Permian 14 0 7 0 1 - 53 Mississippian 599 63 94 7 10 2 16 11 Devonian Upper 2 434 25 1 134 2 71 1 47 10 Middle 948 0 346 0 35 - 36 - Other 47 14 3 0 3 - 6 2 Total 7 671 1 915 2 226 328 221 70 29 17

EUB Statistical Series 2001-98: Alberta’s Reserves 2000 and Supply/Demand Outlook / Crude Oil •••• 3-7
Table 3.7. Distribution of conventional oil reserves by formation as of December 31, 2000 Geological formation
Initial volume in-place (106 m3)
Initial established reserves (106 m3)
Remaining established reserves (106 m3)
Initial volume in-place (%)
Initial established reserves (%)
Remaining established reserves (%)
Upper Cretaceous Belly River 252 34 7 3 1 2 Chinook 5 1 0 0 0 0 Cardium 1 781 299 41 19 12 14 Second White Specks 31 3 1 0 0 0 Doe Creek 73 14 4 1 1 1 Dunvegan 22 2 0 0 0 0 Lower Cretaceous Viking 339 64 6 4 3 2 Upper Mannville 1 521 238 55 16 9 19 Lower Mannville 888 188 35 9 7 12 Jurassic 208 52 8 2 2 3 Triassic 320 64 13 3 3 4 Permian-Belloy 14 7 1 0 0 0 Mississippian Rundle 471 75 7 5 3 2 Pekisko 84 14 2 1 1 1 Banff 107 12 2 1 0 1 Upper Devonian Wabamun 59 6 1 1 0 0 Nisku 441 202 15 5 8 5 Leduc 841 504 16 9 20 5 Beaverhill Lake 968 396 32 10 16 11 Slave Point 150 28 7 2 1 2 Middle Devonian Gilwood 301 130 9 3 5 3 Sulphur Point 9 1 0 0 0 0 Muskeg 52 8 1 1 0 0 Keg River 490 178 21 5 7 7 Keg River SS 44 18 1 0 1 0 Granite Wash 53 12 3 1 0 1

3-8 • EUB Statistical Series 2001-98: Alberta’s Reserves 2000 and Supply/Demand Outlook / Crude Oil
additions). Total production of crude oil is the sum of these two components. In forecasting future production, the EUB considered the crude oil price expectations and its impact on the economics of producing wells.
Crude oil production from existing wells over the period 1994-2000 is depicted in Figure 3.11. As this figure illustrates, wells drilled before 1994 contributed some 49 per cent to production in 2000. To project the expected production from the wells drilled prior to 2001, the EUB considered the following assumptions:
• Production from existing wells in 2001 would be 107.2 103 m3/d. • The rate of decline in currently established reserves is projected to average 15 per
cent.
The annual growth in production is a function of the number of new wells successfully drilled, and the peak production and decline rate of these new wells. With relative stability in crude oil prices over the past two years, crude oil drilling activity has received momentum in 2000. The number of successful oil wells increased from about 1630 in 1999 to 2700 in 2000. With the expectation that the crude oil prices will remain generally in the same range over the forecast period (as described in Section 1.2), the total number of successful oil wells is projected to be 2700 for 2001 and 2002 and then decrease to 2500 wells for the remainder of the forecast period. Figure 3.12 shows the EUB’s crude oil drilling forecast for successful wells. Based on recent historical data, it is assumed that the production rate for new wells will peak at 5.0 m3/d/well, with a subsequent decline rate of 25 per cent per year. This is a decline from an average of 8.0 m3/d/well in the mid 1990s. Over time it is expected that the cumulative production from each years population of new wells will approximate the annual reserve growth from new pools, new EOR schemes and development of existing pools.
Although there was an increase in horizontal drilling in 2000, the number of horizontal wells has not increased appreciably over the past five years. In 2000, some 460 horizontal wells were drilled, representing 17 per cent of the total oil wells drilled. In 2000 there were 2540 active horizontal wells, producing approximately 15 per cent of the total crude oil production. Production from horizontal wells drilled in the past five years peaks at an average rate of 12.0 m3/d.
Light-medium crude oil production, as shown in Figure 3.13, averaged 81.0 103 m3/d in 2000 and is expected to decline to 55.7 103 m3/d by 2010. Although crude oil prices and drilling forecasts are favourable, light crude oil production will continue to decline almost 4 per cent a year, due to the failure of new wells to offset declining production from existing wells. New drilling has been finding smaller reserves over time.
Light/heavy crude oil differentials, which are currently very wide, are expected to narrow over the forecast period, with heavy crude production expected to increase to 41.0 103
m3/d by 2003. However, as shown on Figure 3.13, production will decline to 31.4 103 m3/d by the end of the forecast period. Production of heavy crude oil from new drilling is not expected to offset declining production from existing pools.
The combined forecasts from existing and future wells indicate that crude oil production will decline from 118.8 103 m3/d in 2000 to 87.1 103 m3/d in 2010. In the first two years of the forecast period, reserves growth is expected to be about 25 106 m3/year, followed by 23 106 m3/year for the remainder of the forecast period. By 2010, if crude oil
EUB Statistical Series 2001-98: Alberta’s Reserves 2000 and Supply/Demand Outlook / Crude Oil •••• 3-9
production follows the projection, Alberta will have produced some 84 per cent of the estimated ultimate potential of 3130 106 m3.
3.2.2 Crude Oil Demand
Oil refineries use mainly crude oil, butane, and natural gas as feedstock, along with synthetic crude oil, bitumen, and pentanes plus, to produce a wide variety of refined petroleum products (RPPs). The key determinants of crude oil feedstock requirements for Alberta refineries are domestic demand for RPPs, shipments to other western Canadian provinces, exports to the United States, and competition from other feedstocks. Since Alberta is a “swing” supplier of RPPs within western Canada, a refinery closure or expansion in this market may have a significant impact on the demand for Alberta RPPs and, hence, on Alberta crude oil feedstock requirements.
Figure 3.14 shows the capacity and location of Alberta refineries. In 2000, Alberta refineries with 68 103 m3/d capacity used 35.2 103m3/d of crude oil. Adding the other feedstock requirements indicates that Alberta refineries will operate close to their capacity in 2004, when use of crude oil will peak at 44 103 m3/d. No new refineries are assumed over the forecast period.
Figure 3.15 shows Alberta demand and exports of crude oil.
3.2.3 Crude Oil and Equivalent Supply The growth in supply of non-upgraded bitumen and synthetic crude oil is expected to significantly offset the decline in conventional crude oil. As shown on Figure 3.16, supply from crude oil and equivalent is expected to increase from 242 103 m3/day to 410 103 m3/d over the forecast period.
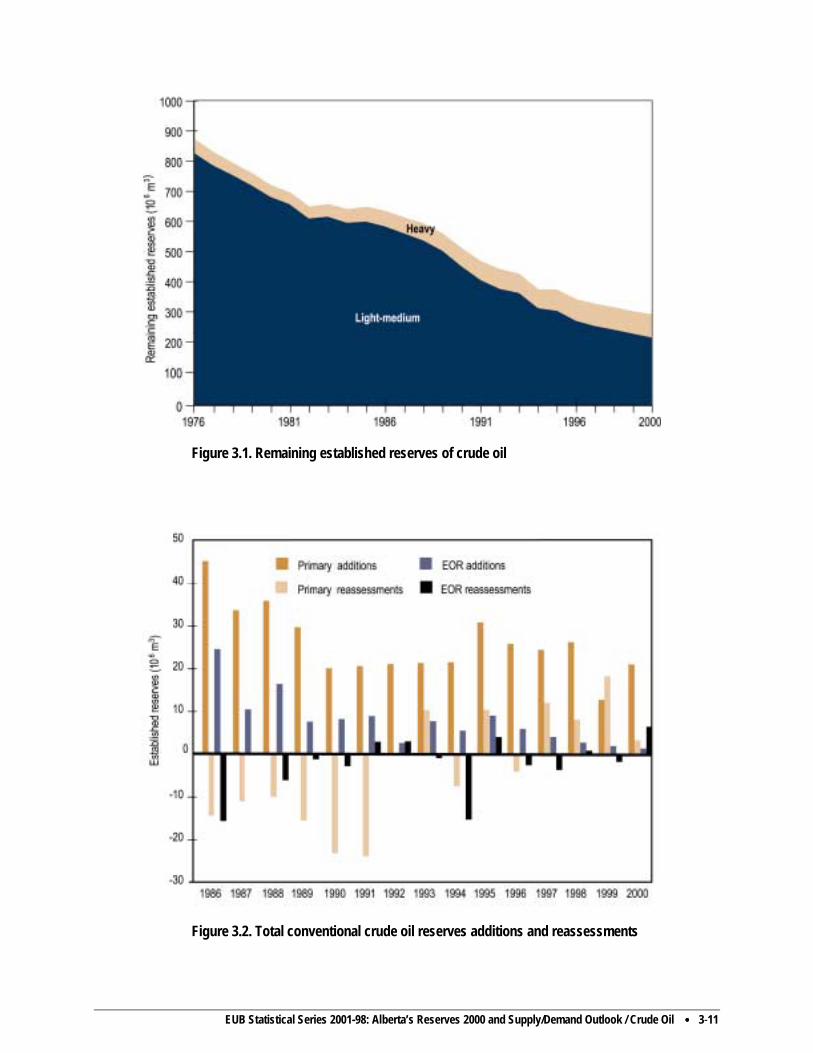
EUB Statistical Series 2001-98: Alberta’s Reserves 2000 and Supply/Demand Outlook / Crude Oil •••• 3-11
Figure 3.1. Remaining established reserves of crude oil
Figure 3.2. Total conventional crude oil reserves additions and reassessments
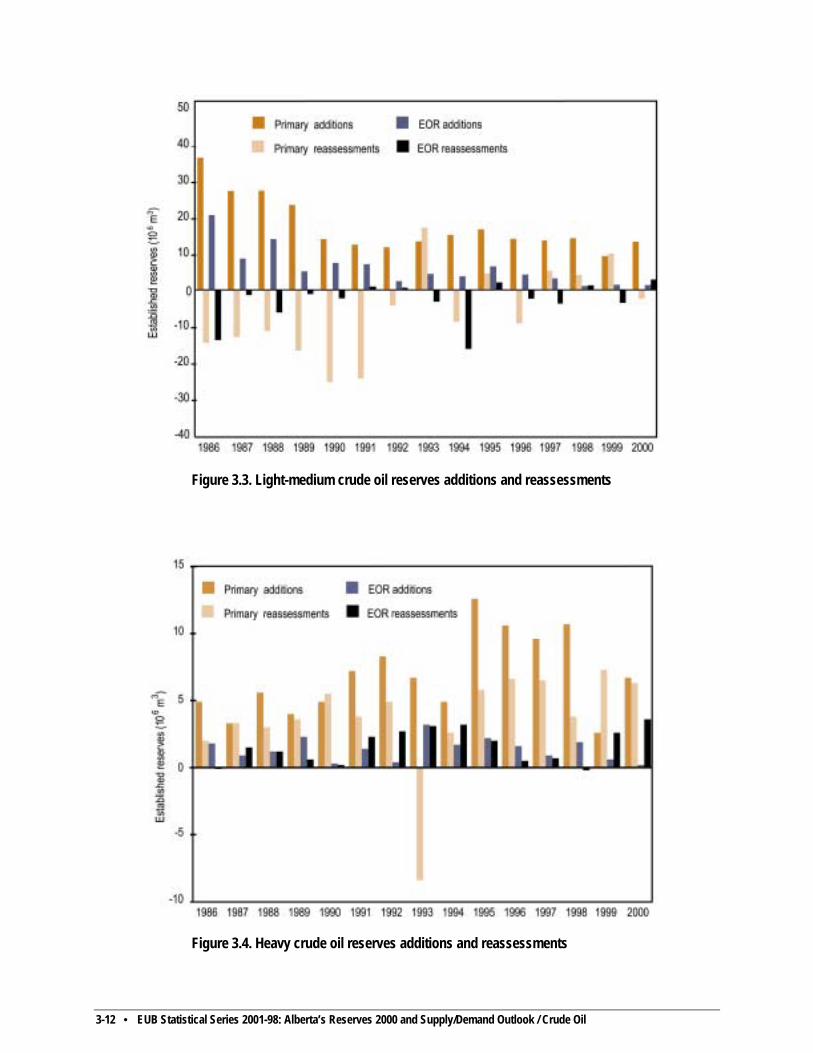
3-12 • EUB Statistical Series 2001-98: Alberta’s Reserves 2000 and Supply/Demand Outlook / Crude Oil
Figure 3.3. Light-medium crude oil reserves additions and reassessments
Figure 3.4. Heavy crude oil reserves additions and reassessments
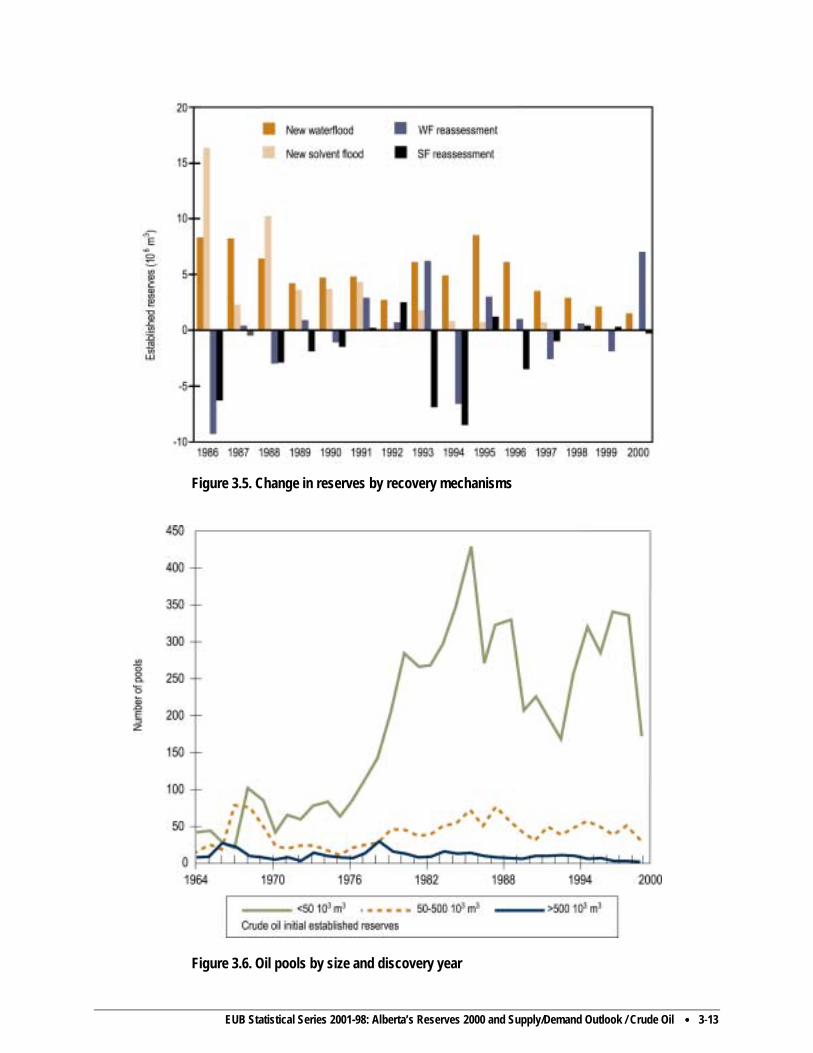
EUB Statistical Series 2001-98: Alberta’s Reserves 2000 and Supply/Demand Outlook / Crude Oil •••• 3-13
Figure 3.5. Change in reserves by recovery mechanisms
Figure 3.6. Oil pools by size and discovery year

3-14 • EUB Statistical Series 2001-98: Alberta’s Reserves 2000 and Supply/Demand Outlook / Crude Oil
Figure 3.7. Crude oil reserves by recovery mechanisms
Figure 3.8. Geological distribution of conventional crude oil reserves

EUB Statistical Series 2001-98: Alberta’s Reserves 2000 and Supply/Demand Outlook / Crude Oil •••• 3-15
Figure 3.9. Growth of initial established reserves of conventional crude oil

3-16 • EUB Statistical Series 2001-98: Alberta’s Reserves 2000 and Supply/Demand Outlook / Crude Oil
Figure 3.10. Alberta’s remaining established oil reserves versus cumulative production
Figure 3.11. Total conventional crude oil production by drilled year

EUB Statistical Series 2001-98: Alberta’s Reserves 2000 and Supply/Demand Outlook / Crude Oil •••• 3-17
Figure 3.12. Alberta crude oil drilling activity
Figure 3.13. Alberta daily production of crude oil (actual and forecast)

3-18 • EUB Statistical Series 2001-98: Alberta’s Reserves 2000 and Supply/Demand Outlook / Crude Oil
Figure 3.14. Capacity and location of Alberta refineries
Figure 3.15. Alberta demand and exports of crude oil

EUB Statistical Series 2001-98: Alberta’s Reserves 2000 and Supply/Demand Outlook / Crude Oil •••• 3-19
Figure 3.16. Alberta supply of crude oil and equivalent
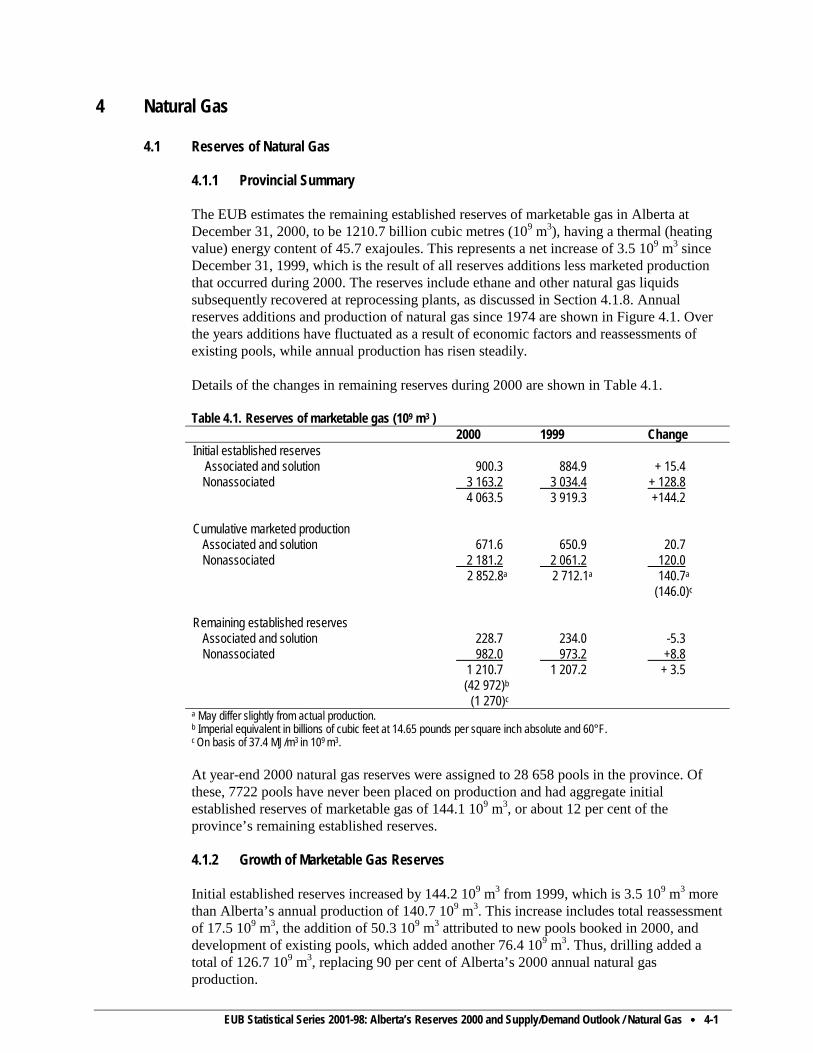
EUB Statistical Series 2001-98: Alberta’s Reserves 2000 and Supply/Demand Outlook / Natural Gas •••• 4-1
4 Natural Gas
4.1 Reserves of Natural Gas
4.1.1 Provincial Summary
The EUB estimates the remaining established reserves of marketable gas in Alberta at December 31, 2000, to be 1210.7 billion cubic metres (109 m3), having a thermal (heating value) energy content of 45.7 exajoules. This represents a net increase of 3.5 109 m3 since December 31, 1999, which is the result of all reserves additions less marketed production that occurred during 2000. The reserves include ethane and other natural gas liquids subsequently recovered at reprocessing plants, as discussed in Section 4.1.8. Annual reserves additions and production of natural gas since 1974 are shown in Figure 4.1. Over the years additions have fluctuated as a result of economic factors and reassessments of existing pools, while annual production has risen steadily. Details of the changes in remaining reserves during 2000 are shown in Table 4.1.
Table 4.1. Reserves of marketable gas (109 m3 ) 2000 1999 Change Initial established reserves Associated and solution
900.3
884.9
+ 15.4
Nonassociated 3 163.2 3 034.4 + 128.8 4 063.5 3 919.3 +144.2 Cumulative marketed production Associated and solution
671.6
650.9
20.7
Nonassociated 2 181.2 2 061.2 120.0 2 852.8a 2 712.1a 140.7a (146.0)c Remaining established reserves Associated and solution
228.7
234.0
-5.3
Nonassociated 982.0 1 210.7
973.2 1 207.2
+8.8 + 3.5
(42 972)b (1 270)c
a May differ slightly from actual production. b Imperial equivalent in billions of cubic feet at 14.65 pounds per square inch absolute and 60°F.
c On basis of 37.4 MJ/m3 in 109 m3.
At year-end 2000 natural gas reserves were assigned to 28 658 pools in the province. Of these, 7722 pools have never been placed on production and had aggregate initial established reserves of marketable gas of 144.1 109 m3, or about 12 per cent of the province’s remaining established reserves. 4.1.2 Growth of Marketable Gas Reserves Initial established reserves increased by 144.2 109 m3 from 1999, which is 3.5 109 m3 more than Alberta’s annual production of 140.7 109 m3. This increase includes total reassessment of 17.5 109 m3, the addition of 50.3 109 m3 attributed to new pools booked in 2000, and development of existing pools, which added another 76.4 109 m3. Thus, drilling added a total of 126.7 109 m3, replacing 90 per cent of Alberta’s 2000 annual natural gas production.
4-2 • EUB Statistical Series 2001-98: Alberta’s Reserves 2000 and Supply/Demand Outlook / Natural Gas
The addition of 17.5 109 m3 from reassessments resulted from the study of some 2500 pools by EUB staff, which yielded positive reassessments totalling 127.5 109 m3 and negative reassessments totalling 110 109 m3. The largest positive reassessment, 42.6 109 m3 (3.5 per cent of total remaining marketable reserves) was in the Southeastern Alberta Gas System. Current remaining marketable gas from the Southeastern Alberta Gas System now stands at approximately 140 109 m3, or 11.6 per cent of the province’s remaining established reserves. A review of 40 pools in the Foothills and Foothills Front areas resulted in downward revisions of 14.5 109 m3. This was due to a reduction in in-place gas reserves and a downward adjustment of recovery factors because of water encroachment. Fields and pools with significant changes are listed in Table 4.2.
Alberta’s remaining established reserves of marketable gas since 1975 are shown in Figure 4.2. A general decline has occurred since 1983.
4.1.3 Distribution of Natural Gas Reserves by Pool Size The distribution of marketable gas reserves by pool size as of December 31, 2000, is shown in Table 4.3. For the purposes of this table, commingled pools are considered as one and the Southeastern Alberta Gas System (MU) is considered on a field basis. The data show that pools with reserves of 300 million cubic metres (106 m3) or more represent 6 per cent of all pools and contain about 45 per cent of the remaining marketable reserves. Figure 4.3 shows natural gas pool size by discovery year since 1951 and illustrates that the vast majority of pools drilled since the mid-1970s contained less than 300 106 m3 of initial established reserves. 4.1.4 Geological Distribution of Reserves The distribution of reserves by geological period and formation is shown in Table 4.4 and Figure 4.4. The Upper and Lower Cretaceous period contains some 64.3 per cent of the province’s remaining established reserves. The formations that contain the most significant volume of natural gas are the Upper Cretaceous Milk River and Medicine Hat Formation, with 11.2 per cent of the province’s remaining reserves; the Lower Cretaceous Mannville Formation, with 34.7 per cent; and the Mississippian Rundle Formation, with 9.3 per cent. 4.1.5 Regional Distribution of Gas Reserves As shown in Table 4.1, the remaining established reserves of marketable gas at December 31, 2000, is 1210.7 109 m3. Section 4.1.11 discusses the ultimate potential of natural gas in Alberta and shows that 1536 109 m3 are yet to be established. The distribution of remaining established and yet-to-be-established reserves are shown in Figure 4.5. Area I includes the Foothills and Foothills Front regions, where natural gas is deep and production rates are relatively high. Areas II and III are classified as the southern and northern plains respectively and include shallow to medium-depth reserves. Although the majority of new gas wells are being drilled in Areas II and III, Alberta natural gas supplies will also depend on significant future reserves being discovered in Area I. The Foothills Front portion accounts for some 82 per cent of the yet-to-be-established reserves in Area 1.

EUB Statistical Series 2001-98: Alberta’s Reserves 2000 and Supply/Demand Outlook / Natural Gas •••• 4-3
Table 4.2. Major natural gas reserve changes, 2000 Initial established
reserves (106 m3)
Pool 2000 Change Main reasons for change Alderson Southeastern Alberta Gas System (MU) 43 767 +10 917 Re-evaluation of initial volume in-place Bantry Southeastern Alberta 24 912 +7 653 Re-evaluation of initial volume in-place Gas System (MU) Benjamin Rundle F 1 224 +1 043 Pool development Blackstone Beaverhill Lake A 15 964 -4 036 Re-evaluation of initial volume in-place Burnt Timber Rundle A & B 12 000 -2 090 Re-evaluation of initial volume in-place and recovery
factor Carrot Creek Viking C 1 037 + 996 Re-evaluation of initial volume in-place Chedderville Leduc D 383 -1 006 Re-evaluation of initial volume in-place Clearwater Rundle A 2 376 -629 Re-evaluation of initial volume in-place Coleman Rundle A & Palliser B 5 628 -1 529 Re-evaluation of initial volume in-place Dunvagen Debolt A,B,C,D & Elkton C 29 544 +1 511 Re-evaluation of initial volume in-place Elmworth Falher B-1 1 804 -846 Re-evaluation of initial volume in-place George 3 003 + 514 Re-evaluation of initial volume in-place Golden Spike D – 3 A 3 543 + 829 Re-evaluation of initial volume in-place Hardy McMurray BB 1 135 + 679 Re-evaluation of initial volume in-place Hussar Belly River HH 474 -571 Re-evaluation of initial volume in-place Jumping Pound Rundle C 11 840 -760 Re-evaluation of initial volume in-place and recovery
factor Knopcik Montney A 4 809 -2 076 Re-evaluation of initial volume in-place and recovery
factor Knopcik Nikanassin D 48 -664 Re-evaluation of initial volume in-place and recovery
factor La Glace Halfway G & Montney B 4 760 +2 004 Pools commingled and re-evaluation of initial volume
in-place Limestone Rundle A & B 10 193 +2 673 Re-evaluation of initial volume in-place Lone Pine Creek Wabamun A 10 665 + 934 Re-evaluation of initial volume in-place Medicine Hat Southeastern Alberta Gas System (MU)
125 238 + 9 724 Re-evaluation of initial volume in-place
(continued)
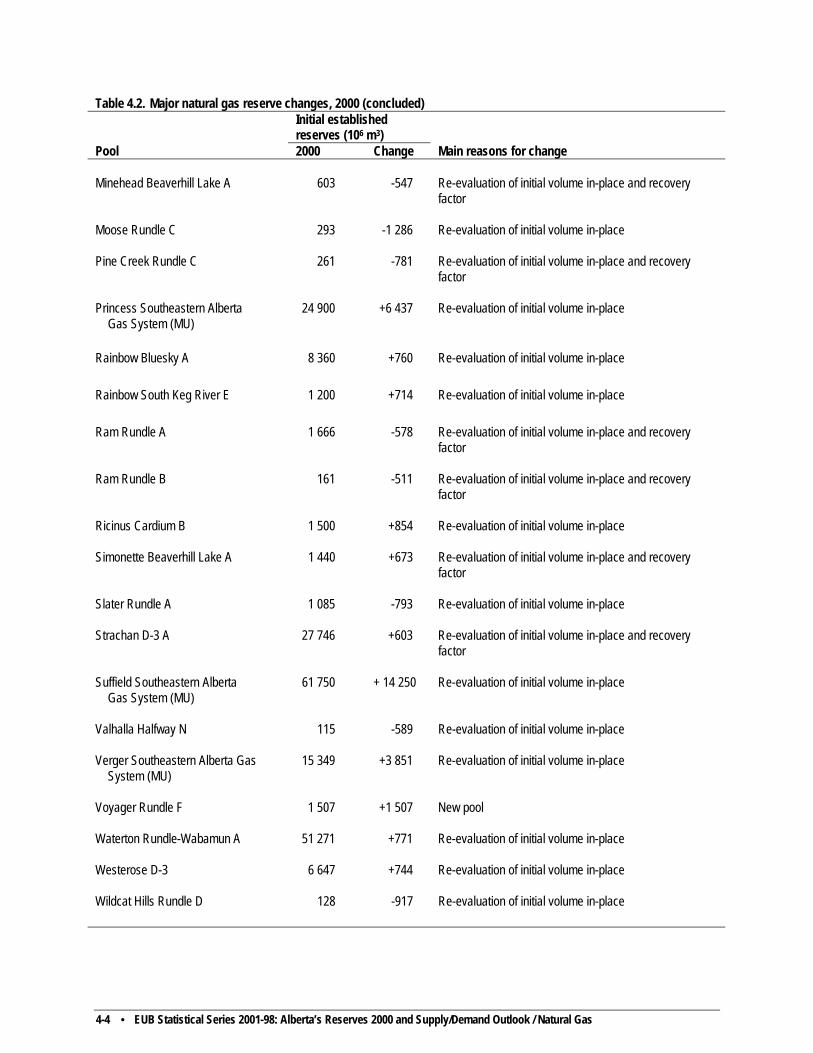
4-4 • EUB Statistical Series 2001-98: Alberta’s Reserves 2000 and Supply/Demand Outlook / Natural Gas
Table 4.2. Major natural gas reserve changes, 2000 (concluded) Initial established
reserves (106 m3)
Pool 2000 Change Main reasons for change Minehead Beaverhill Lake A 603 -547 Re-evaluation of initial volume in-place and recovery
factor Moose Rundle C 293 -1 286 Re-evaluation of initial volume in-place Pine Creek Rundle C 261 -781 Re-evaluation of initial volume in-place and recovery
factor Princess Southeastern Alberta Gas System (MU)
24 900 +6 437 Re-evaluation of initial volume in-place
Rainbow Bluesky A 8 360 +760 Re-evaluation of initial volume in-place Rainbow South Keg River E 1 200 +714 Re-evaluation of initial volume in-place Ram Rundle A 1 666 -578 Re-evaluation of initial volume in-place and recovery
factor Ram Rundle B 161 -511 Re-evaluation of initial volume in-place and recovery
factor Ricinus Cardium B 1 500 +854 Re-evaluation of initial volume in-place Simonette Beaverhill Lake A 1 440 +673 Re-evaluation of initial volume in-place and recovery
factor Slater Rundle A 1 085 -793 Re-evaluation of initial volume in-place Strachan D-3 A 27 746 +603 Re-evaluation of initial volume in-place and recovery
factor Suffield Southeastern Alberta Gas System (MU)
61 750 + 14 250 Re-evaluation of initial volume in-place
Valhalla Halfway N 115 -589 Re-evaluation of initial volume in-place Verger Southeastern Alberta Gas System (MU)
15 349 +3 851 Re-evaluation of initial volume in-place
Voyager Rundle F 1 507 +1 507 New pool Waterton Rundle-Wabamun A 51 271 +771 Re-evaluation of initial volume in-place Westerose D-3 6 647 +744 Re-evaluation of initial volume in-place Wildcat Hills Rundle D 128 -917 Re-evaluation of initial volume in-place

EUB Statistical Series 2001-98: Alberta’s Reserves 2000 and Supply/Demand Outlook / Natural Gas •••• 4-5
Table 4.3. Distribution of natural gas reserves by pool size, 2000 Initial established Remaining established Reserve range Pools marketable reserves marketable reserves (106 m3) # % 109 m3 % 109 m3 % 1500+ 316 1.1 2 264 55.7 316 26.1 300-1499 1 284 4.5 750 18.5 232 19.2 1-299 27 058 94.4 1 050 _25.8 663 54.7 Total 28 658 100.0 4 064 100.0 1 211 100.0
Table 4.4. Geological distribution of established natural gas reserves, 2000 1 2 3 4 5 6 Raw gas Marketable gas Raw gas Marketable gas______ Initial Initial Remaining
volume established established Initial Initial Remaining in-place reserves reserves volume established established
Geological period (109 m3) (109 m3) (109 m3) in-place (%) reserves (%) reserves (%) Upper Cretaceous
Belly River 180 109 49 2.7 2.7 4.0 Milk River & Med Hat 544 355 133 7.7 8.7 11.2 Cardium 445 95 38 6.2 2.3 3.1 Second White Specks 10 6 4 0.1 0.2 0.3 Other 108 61 19 1.5 1.5 1.6
Subtotal 1 287 626 243 18.2 15.4 20.1 Lower Cretaceous
Viking 381 265 64 5.4 6.5 5.3 Basal Colorado 42 34 4 0.6 0.8 0.2 Mannville 1 891 1 239 420 26.8 30.5 34.7 Other 341 142 47 4.8 3.5 _4.0 Subtotal 2 655 1 680 535 37.6 41.3 44.2
Jurassic
Jurassic 92 60 28 1.3 1.5 2.3 Other 49 32 10 0.8 0.8 1.0 Subtotal 141 92 38 2.1 2.3 3.3
Triassic
Triassic 185 115 62 2.8 2.8 5.1 Other 25 17 5 0.4 0.4 0.4 Subtotal 210 132 67 3.2 3.2 5.5
Permian
Belloy 9 6 3 0.1 0.1 0.2 Subtotal 9 6 3 0.1 0.1 0.2
Mississippian
Rundle 899 566 113 12.7 14.0 9.3 Other 299 198 35 4.2 4.9 3.0 Subtotal 1 198 764 148 16.9 18.9 12.3
(continued)

4-6 • EUB Statistical Series 2001-98: Alberta’s Reserves 2000 and Supply/Demand Outlook / Natural Gas
Table 4.4. Geological distribution of established natural gas reserves, 2000 (concluded) 1 2 3 4 5 6 Raw gas Marketable gas Raw gas Marketable gas_____ Initial Initial Remaining
volume established established Initial Initial Remaining in-place reserves reserves volume established established
Geological period (109 m3) (109 m3) (109 m3) in-place (%) reserves (%) reserves (%) Upper Devonian
Wabamun 233 111 30 3.3 2.7 2.5 Nisku 120 56 23 1.7 1.4 2.0 Leduc 472 244 33 6.7 6.0 2.7 Beaverhill Lake 469 209 51 6.6 5.2 4.2 Other 162 92 12 2.3 2.2 1.0 Subtotal 1 456 712 149 20.6 17.5 12.4
Middle Devonian
Sulphur Point 12 8 4 0.2 0.2 0.3 Muskeg 5 2 1 0.1 0.1 0.0 Keg River 61 25 16 0.8 0.6 1.3 Other 32 14 4 0.5 0.3 0.3 Subtotal 110 49 25 1.6 1.2 1.9
Confidentiala
Subtotal 4 3 3 0.1 0.1 0.1 Total 7 070 4 063 1 211 100.00 100.00 100.00
(251 000)a (145 000)a (43 000)a a Imperial equivalent in trillions of cubic feet at 14.65 pounds per square inch absolute and 60°F.
4.1.6 Reserves of Natural Gas Containing Hydrogen Sulphide Natural gas that contains any measurable volume of hydrogen sulphide (H2S) is classified as sour. As of December 31, 2000, sour gas accounted for some 23.5 per cent (285 109 m3) of the province’s total remaining established reserves and about 30 per cent of natural gas marketed in 2000. The provincial average H2S concentration in sour gas is 9.4 per cent. The distribution of established reserves for sweet and sour gas for year-end 2000 is shown in Table 4.5. The remaining marketable reserves from sweet and sour gas since 1984 is shown in Figure 4.6. The distribution of sour gas reserves by H2S content is shown in Table 4.6. 4.1.7 Reserves of Pools Calculated on an Energy Basis
Reserves of major retrograde condensate pools are tabulated both on energy content and on a volumetric basis. Table 4.7 lists the initial energy in-place, the recovery factor, and surface loss factor (both on an energy basis), as well as the initial marketable energy for each pool. The table also lists raw- and marketable-gas heating values used to convert from a volumetric to an energy basis. The volumetric reserves of these pools are included in the Gas Reserves and Basic Data section (spreadsheet on accompanying CD), but with recovery factors and surface loss factors deleted.

EUB Statistical Series 2001-98: Alberta’s Reserves 2000 and Supply/Demand Outlook / Natural Gas •••• 4-7
}
Table 4.5. Distribution of sweet and sour gas reserves, 2000 (106 m3) Raw gas Marketable gas Type of gas
Initial volume in-place
Initial producible
Initial established reserves
Net cumulative production
Remaining established reserves
Sweet Associated 472 374 Solution 751 280 528 371 157
Nonassociated 3 426 2 366 2 196 1 427 769 Subtotal 4 649 3 020 2 724 1 798 926 Sour Associated 430 348 Solution 290 172 373 301 72
Nonassociated 1 701 1 328 967 754 213 Subtotal 2 421 1 848 1 340 1 055 285 Total 7 070 4 868 4 064 2 853 1 211 (251)a (173)a (144)a (101)a (43) Sour gas % of total 34.2 38.0 33.0 37.0 23.5 a Imperial equivalent in billions of cubic feet at 14.65 pounds per square inch absolute and 60˚F.
Table 4.6. Distribution of sour gas reserves by H2S content, 2000 Initial established_reserves (109 m3) Remaining established reserves (109 m3) H2S content in Associated & Associated & raw gas solution Nonassociated solution Nonassociated Total % Less than 2 245 299 50 71 121 42 2.00-9.99 97 352 15 85 100 35 10.00-19.99 19 178 4 27 31 11 20.00-29.99 12 49 3 16 19 7 Over 30 0 89 0 14 14 5 Total 373 967 72 213 285 100 % 28 72 25 75
4.1.8 Reserves of Ethane and Other Natural Gas Liquids Included in Gas Reserves
The remaining established reserves of natural gas discussed in Section 4.1.1 are determined at the field plant gate. A portion of the ethane and other natural gas liquids contained in the marketable gas stream leaving the field plants are extracted downstream at reprocessing plants. It is expected that some 39 109 m3 will be extracted, thereby reducing the remaining established reserves of marketable gas and the thermal energy content from 1211 109 m3 to 1172 109 m3 and from 45.2 to 42.6 exajoules respectively. Reserves of ethane and other natural gas liquids (NGL) are discussed in more detail in Section 5 of this report.
}

4-8 • EUB Statistical Series 2001-98: Alberta’s Reserves 2000 and Supply/Demand Outlook / Natural Gas
Table 4.7 Reserves of pools calculated on an energy basis, 2000 Pool
Raw gas initial volume in-place (106 m3)
Raw gas gross heating value (MJ/m3)
Initial energy in-place (109 MJ)
Recovery factor (fraction)
Fuel and shrinkage (surface loss factor) (fraction)
Initial marketable gas energy (109 MJ)
Marketable gas gross heating value (MJ/m3)
Initial established reserves of marketable gas (106 m3)
Brazeau River Nisku J
557
74.44
41
0.75
0.50
15
41.01
380
Brazeau River Nisku K
1 129
74.17
83
0.75
0.60
25
42.15
596
Brazeau River Nisku M
1 489
76.22
113
0.75
0.60
34
41.36
823
Brazeau River Nisku P
8 663
61.23
530
0.74
0.65
137
40.00
3 435
Brazeau River Nisku S
1 665
54.64
90
0.80
0.57
31
41.38
756
Brazeau River Nisku W
1 895
55.65
105
0.72
0.35
49
41.13
1 200
Caroline Beaverhill Lake A
64 707
49.95
3 232
0.77
0.76
597
36.51
16 360
Carson Creek Beaverhill Lake B
10 941
55.68
609
0.90
0.39
334
41.65
8 030
Harmattan East Rundle
36 252
50.26
1 822
0.85
0.26
1 146
40.93
28 000
Harmattan-Elkton Rundle C
31 326
46.96
1 471
0.90
0.27
966
41.48
23 300
Kakwa A Cardium A
1 120
55.40
62
0.85
0.32
35
42.71
840
Kaybob South Beaverhill Lake A
103 728
52.61
5 457
0.77
0.61
1 638
39.68
41 300
Ricinus Cardium A
8 316
58.59
487
0.85
0.32
281
40.52
6 950
Valhalla Halfway B
6 331
53.89
341
0.80
0.33
182
40.00
4 572
Waterton Rundle-Wabamun A
85 254
48.74a
4 155
0.78
0.35
2 107
41.09
51 271
Wembley Halfway B
5 740
53.89
309
0.80
0.33
165
40.12
4 133
Westerose D-3
4 036
51.55
208
0.90
0.25
140
41.59
3 366
Westpem Nisku E
1 160
66.05
76
0.90
0.54
31
44.76
709
Windfall D-3 A
21 288
53.42
1 137
0.60
0.53
320
42.42
7 560
a Producible raw gas gross heating value is 40.65 MJ/m3.

EUB Statistical Series 2001-98: Alberta’s Reserves 2000 and Supply/Demand Outlook / Natural Gas •••• 4-9
4.1.9 Multifield Pools
Pools that extend over more than one field are classified as multifield pools and are listed in Appendix 2. Each multifield pool shows the individual initial established reserves assigned to each field and the total initial established reserves for the multifield pool.
4.1.10 Coal-Bed Methane Reserves
There has been considerable interest in coal-bed methane in Alberta over the past year. However, the resource remains largely untapped. While the EUB agrees that coal-bed methane holds the potential for significant reserves, there is a lack of information, particularly reservoir and production data, to enable a reasonable reserves assessment. For this reason, the EUB has not conducted an assessment of coal-bed methane reserves for the province.
4.1.11 Ultimate Potential
In 1992 the EUB (then the ERCB) issued ERCB 92-A,1 which presented the results of its detailed review of Alberta’s ultimate potential of marketable gas reserves. This review took into consideration geological prospects, technology, and economics. The EUB adopted an estimate of 5600 109 m3 (200 trillion cubic feet) as Alberta’s ultimate potential for marketable gas. This estimate now appears conservative, and the EUB has undertaken an ultimate potential study targeted for completion in 2003. Figure 4.7 shows the historical and forecast growth in initial established reserves of marketable gas.
As illustrated in Figure 4.8, some 72.6 per cent of the ultimate potential of 5600 109 m3
has been established as of year-end 2000. Of this established reserves, cumulative production of 2852.8 109 m3 represents 51 per cent and the remaining established of 1211 109 m3 represents 21.6 per cent of the ultimate potential. This leaves 27.4 per cent, or some 1536 109 m3, of natural gas yet to be discovered. This number added to the remaining established gas reserves yields 2747 109 m3 of natural gas, or 49 per cent of the total ultimate potential, that will be available for future use.
4.2 Supply of and Demand for Natural Gas
4.2.1 Natural Gas Supply
Alberta produced 146 109 m3 of marketable gas (on the basis of 37.4 megajoules [MJ] per m3) in 2000. New additions to pipeline capacity leaving the province have allowed Alberta to market natural gas throughout North America, leading to the development of a continental marketplace. This has led to a tightening of natural gas supply in the province and an increase in natural gas prices. A considerable amount of drilling has taken place in the past few years, and producers are using strategies such as infill drilling to increase production levels. Major factors affecting natural gas production include natural gas prices, drilling activity, the location of Alberta’s reserves, and the production characteristics of today’s wells.
1 Alberta Energy and Utilities Board, 1992, Ultimate Potential and Supply of Natural Gas in Alberta, Report 92-A
(Calgary)
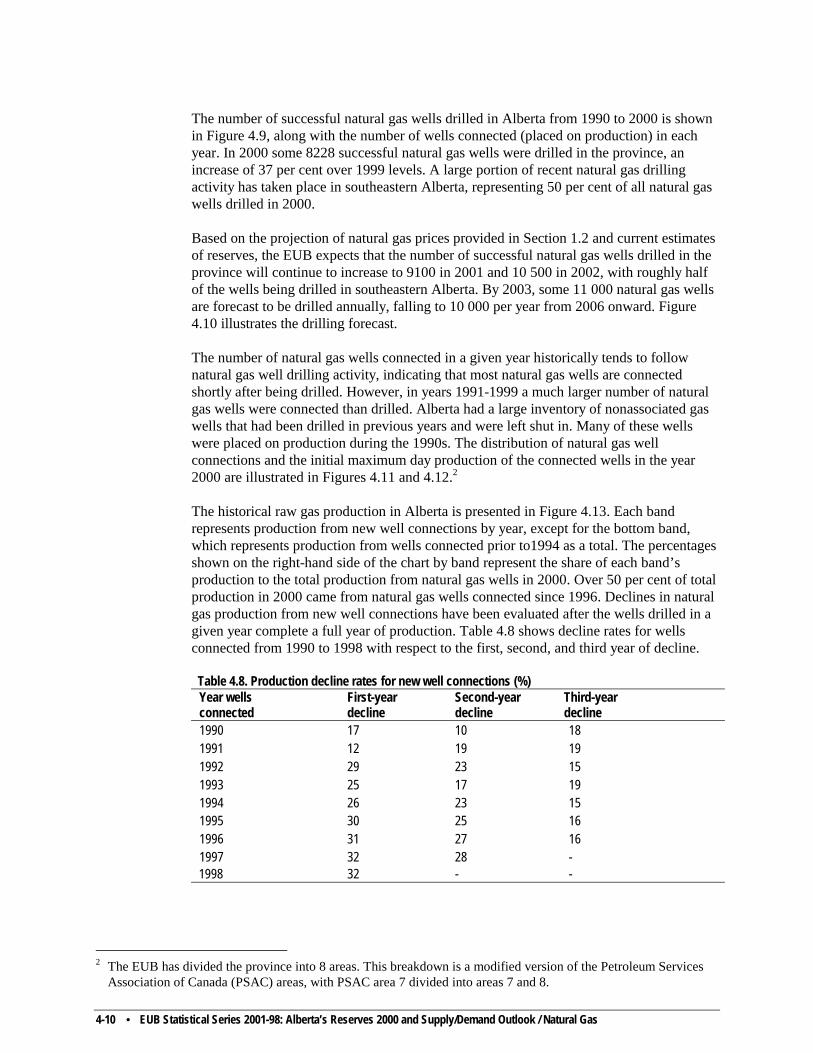
4-10 • EUB Statistical Series 2001-98: Alberta’s Reserves 2000 and Supply/Demand Outlook / Natural Gas
The number of successful natural gas wells drilled in Alberta from 1990 to 2000 is shown in Figure 4.9, along with the number of wells connected (placed on production) in each year. In 2000 some 8228 successful natural gas wells were drilled in the province, an increase of 37 per cent over 1999 levels. A large portion of recent natural gas drilling activity has taken place in southeastern Alberta, representing 50 per cent of all natural gas wells drilled in 2000. Based on the projection of natural gas prices provided in Section 1.2 and current estimates of reserves, the EUB expects that the number of successful natural gas wells drilled in the province will continue to increase to 9100 in 2001 and 10 500 in 2002, with roughly half of the wells being drilled in southeastern Alberta. By 2003, some 11 000 natural gas wells are forecast to be drilled annually, falling to 10 000 per year from 2006 onward. Figure 4.10 illustrates the drilling forecast. The number of natural gas wells connected in a given year historically tends to follow natural gas well drilling activity, indicating that most natural gas wells are connected shortly after being drilled. However, in years 1991-1999 a much larger number of natural gas wells were connected than drilled. Alberta had a large inventory of nonassociated gas wells that had been drilled in previous years and were left shut in. Many of these wells were placed on production during the 1990s. The distribution of natural gas well connections and the initial maximum day production of the connected wells in the year 2000 are illustrated in Figures 4.11 and 4.12.2 The historical raw gas production in Alberta is presented in Figure 4.13. Each band represents production from new well connections by year, except for the bottom band, which represents production from wells connected prior to1994 as a total. The percentages shown on the right-hand side of the chart by band represent the share of each band’s production to the total production from natural gas wells in 2000. Over 50 per cent of total production in 2000 came from natural gas wells connected since 1996. Declines in natural gas production from new well connections have been evaluated after the wells drilled in a given year complete a full year of production. Table 4.8 shows decline rates for wells connected from 1990 to 1998 with respect to the first, second, and third year of decline.
Table 4.8. Production decline rates for new well connections (%) Year wells connected
First-year decline
Second-year decline
Third-year decline
1990 17 10 18 1991 12 19 19 1992 29 23 15 1993 25 17 19 1994 26 23 15 1995 30 25 16 1996 31 27 16 1997 32 28 - 1998 32 - -
2 The EUB has divided the province into 8 areas. This breakdown is a modified version of the Petroleum Services
Association of Canada (PSAC) areas, with PSAC area 7 divided into areas 7 and 8.
EUB Statistical Series 2001-98: Alberta’s Reserves 2000 and Supply/Demand Outlook / Natural Gas •••• 4-11
More recently connected wells are exhibiting much steeper declines in production in the first two years compared to wells connected in the early 1990s. However, by the third year of production the decline rates have not changed significantly over time. The decline rates tend to stabilize at some 16 per cent from the third year forward. Future production is estimated by assuming current decline rates for production from existing wells and adding production from new wells connected during the forecast period. Based on observed performance, existing production is assumed to decline at 16 per cent per year. The projection for new natural gas is based on production from new wells declining at a rate of 30 per cent the first year, 24 per cent the second year, and 16 per cent the third year and thereafter. New well connections today start producing at much lower rates than new wells placed on production in previous years. Figure 4.14 shows the average initial productivities (peak rate) of new wells by connection year. A second average initial productivity for new wells is shown in the figure that excludes southeastern Alberta (Area 3). In 1999, initial rates of wells outside of Area 3 produced at rates 65 per cent higher than the provincial average. To project production, the EUB considered the following assumptions: • The average initial productivity of new natural gas wells in southeastern Alberta will
be 3 103 m3/d in 2001 and will decrease to 1.5 103 m3/d by 2010.
• The average initial productivity of new natural gas wells in the rest of the province will be 12 103 m3/d in 2001 and will decrease to 10 103 m3/d by 2010.
• Consideration was given to the share of production expected to come from areas with
significant remaining and yet-to-be-established reserves (e.g., in the Foothills Front area).
Based on current established and yet-to-be-established reserves and the assumptions described above, the EUB generated the forecast of natural gas production to 2010, as shown in Figure 4.15. The production of natural gas from conventional reserves is expected to increase from 146 109 m3 in 2000 to 150 109 m3 by 2003. Production levels are expected to decline to 135 109 m3 by the end of the forecast period, a decline of 2 per cent per year over the last 5 years of the forecast. At current prices, it is expected that companies will be assessing the potential for coal-bed methane production in Alberta, which may supplement conventional supply during the forecast period. However, due to uncertainty surrounding its potential, no allowance was made for coal-bed methane production over the forecast period. Producers in Alberta are largely drilling for conventional gas strikes in areas where outcome is more certain. By 2010, if natural gas production rates follow the projection, Alberta will have recovered some 76 per cent of the 5600 109 m3 of ultimate potential. This ultimate potential is under review and is targeted for completion in 2003. Commercial natural gas storage is used by the natural gas industry to provide short-term deliverability and is not used in the EUB’s long-term production projection. Several pools in the province are being used for commercial natural gas storage to provide an efficient means of balancing supply with fluctuating market demand. Commercial natural gas storage is defined as the storage of third-party non-native gas and allows marketers to take advantage of seasonal price differences, effect custody transfers, and maintain reliability of
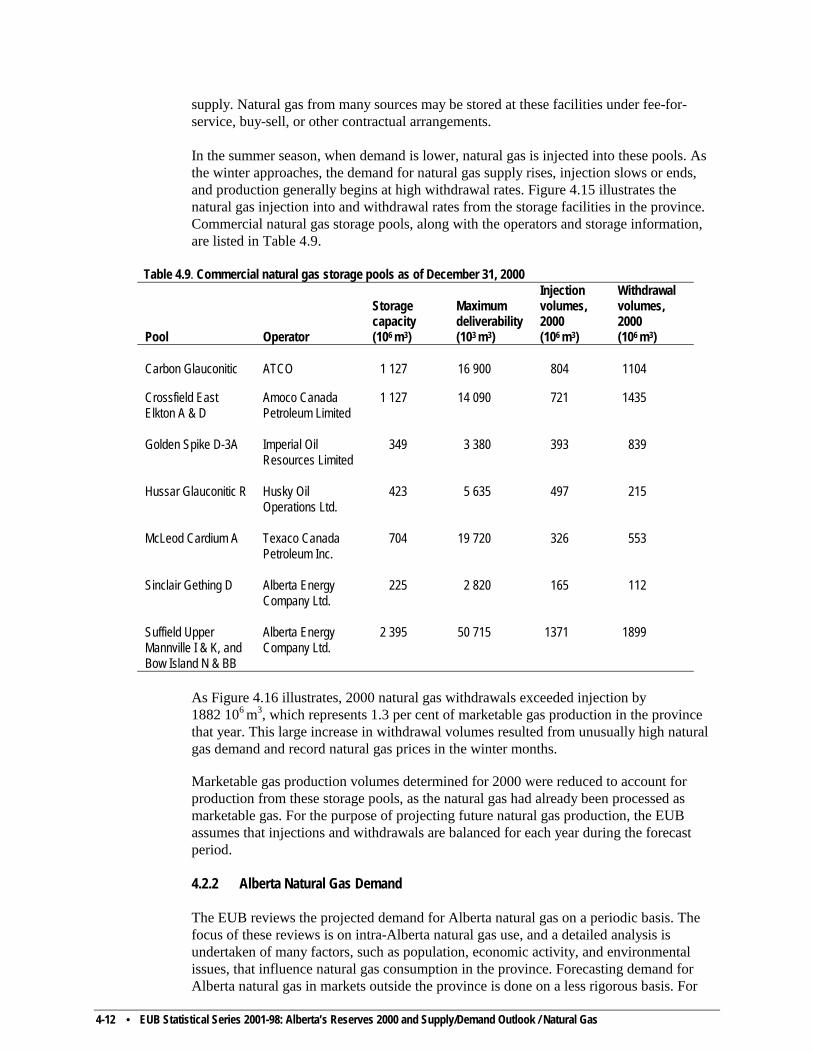
4-12 • EUB Statistical Series 2001-98: Alberta’s Reserves 2000 and Supply/Demand Outlook / Natural Gas
supply. Natural gas from many sources may be stored at these facilities under fee-for-service, buy-sell, or other contractual arrangements. In the summer season, when demand is lower, natural gas is injected into these pools. As the winter approaches, the demand for natural gas supply rises, injection slows or ends, and production generally begins at high withdrawal rates. Figure 4.15 illustrates the natural gas injection into and withdrawal rates from the storage facilities in the province. Commercial natural gas storage pools, along with the operators and storage information, are listed in Table 4.9.
Table 4.9. Commercial natural gas storage pools as of December 31, 2000 Pool
Operator
Storage capacity (106 m3)
Maximum deliverability (103 m3)
Injection volumes, 2000 (106 m3)
Withdrawal volumes, 2000 (106 m3)
Carbon Glauconitic ATCO 1 127 16 900 804 1104
Crossfield East Elkton A & D
Amoco Canada Petroleum Limited
1 127 14 090 721 1435
Golden Spike D-3A Imperial Oil Resources Limited
349 3 380 393 839
Hussar Glauconitic R Husky Oil Operations Ltd.
423 5 635 497 215
McLeod Cardium A Texaco Canada Petroleum Inc.
704 19 720 326 553
Sinclair Gething D Alberta Energy Company Ltd.
225 2 820 165 112
Suffield Upper Mannville I & K, and Bow Island N & BB
Alberta Energy Company Ltd.
2 395 50 715 1371 1899
As Figure 4.16 illustrates, 2000 natural gas withdrawals exceeded injection by 1882 106 m3, which represents 1.3 per cent of marketable gas production in the province that year. This large increase in withdrawal volumes resulted from unusually high natural gas demand and record natural gas prices in the winter months.
Marketable gas production volumes determined for 2000 were reduced to account for production from these storage pools, as the natural gas had already been processed as marketable gas. For the purpose of projecting future natural gas production, the EUB assumes that injections and withdrawals are balanced for each year during the forecast period. 4.2.2 Alberta Natural Gas Demand The EUB reviews the projected demand for Alberta natural gas on a periodic basis. The focus of these reviews is on intra-Alberta natural gas use, and a detailed analysis is undertaken of many factors, such as population, economic activity, and environmental issues, that influence natural gas consumption in the province. Forecasting demand for Alberta natural gas in markets outside the province is done on a less rigorous basis. For
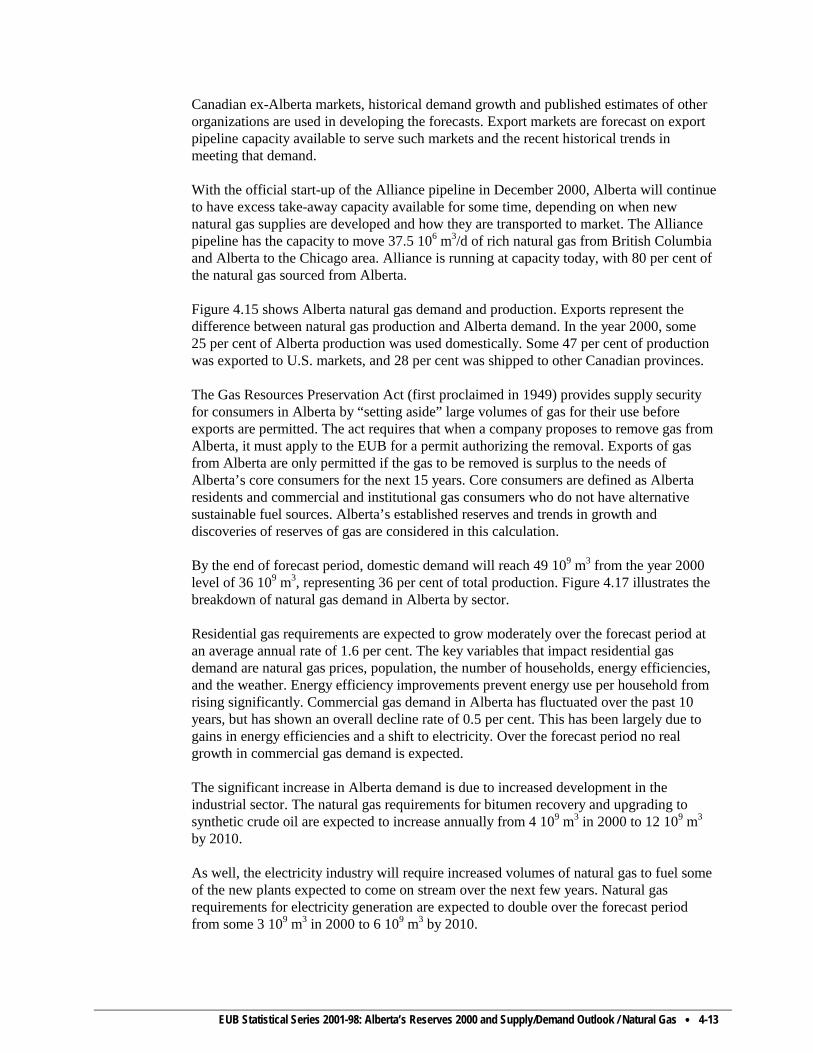
EUB Statistical Series 2001-98: Alberta’s Reserves 2000 and Supply/Demand Outlook / Natural Gas •••• 4-13
Canadian ex-Alberta markets, historical demand growth and published estimates of other organizations are used in developing the forecasts. Export markets are forecast on export pipeline capacity available to serve such markets and the recent historical trends in meeting that demand.
With the official start-up of the Alliance pipeline in December 2000, Alberta will continue to have excess take-away capacity available for some time, depending on when new natural gas supplies are developed and how they are transported to market. The Alliance pipeline has the capacity to move 37.5 106 m3/d of rich natural gas from British Columbia and Alberta to the Chicago area. Alliance is running at capacity today, with 80 per cent of the natural gas sourced from Alberta. Figure 4.15 shows Alberta natural gas demand and production. Exports represent the difference between natural gas production and Alberta demand. In the year 2000, some 25 per cent of Alberta production was used domestically. Some 47 per cent of production was exported to U.S. markets, and 28 per cent was shipped to other Canadian provinces. The Gas Resources Preservation Act (first proclaimed in 1949) provides supply security for consumers in Alberta by “setting aside” large volumes of gas for their use before exports are permitted. The act requires that when a company proposes to remove gas from Alberta, it must apply to the EUB for a permit authorizing the removal. Exports of gas from Alberta are only permitted if the gas to be removed is surplus to the needs of Alberta’s core consumers for the next 15 years. Core consumers are defined as Alberta residents and commercial and institutional gas consumers who do not have alternative sustainable fuel sources. Alberta’s established reserves and trends in growth and discoveries of reserves of gas are considered in this calculation. By the end of forecast period, domestic demand will reach 49 109 m3 from the year 2000 level of 36 109 m3, representing 36 per cent of total production. Figure 4.17 illustrates the breakdown of natural gas demand in Alberta by sector. Residential gas requirements are expected to grow moderately over the forecast period at an average annual rate of 1.6 per cent. The key variables that impact residential gas demand are natural gas prices, population, the number of households, energy efficiencies, and the weather. Energy efficiency improvements prevent energy use per household from rising significantly. Commercial gas demand in Alberta has fluctuated over the past 10 years, but has shown an overall decline rate of 0.5 per cent. This has been largely due to gains in energy efficiencies and a shift to electricity. Over the forecast period no real growth in commercial gas demand is expected. The significant increase in Alberta demand is due to increased development in the industrial sector. The natural gas requirements for bitumen recovery and upgrading to synthetic crude oil are expected to increase annually from 4 109 m3 in 2000 to 12 109 m3 by 2010. As well, the electricity industry will require increased volumes of natural gas to fuel some of the new plants expected to come on stream over the next few years. Natural gas requirements for electricity generation are expected to double over the forecast period from some 3 109 m3 in 2000 to 6 109 m3 by 2010.
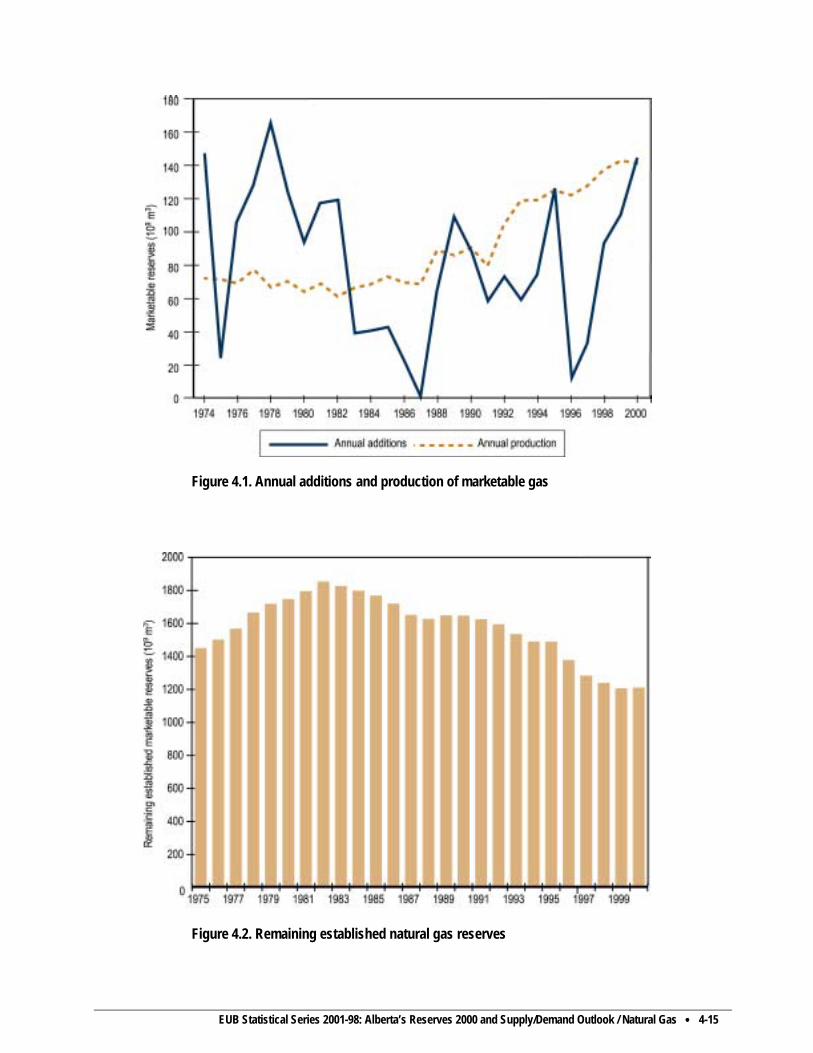
EUB Statistical Series 2001-98: Alberta’s Reserves 2000 and Supply/Demand Outlook / Natural Gas •••• 4-15
Figure 4.1. Annual additions and production of marketable gas
Figure 4.2. Remaining established natural gas reserves
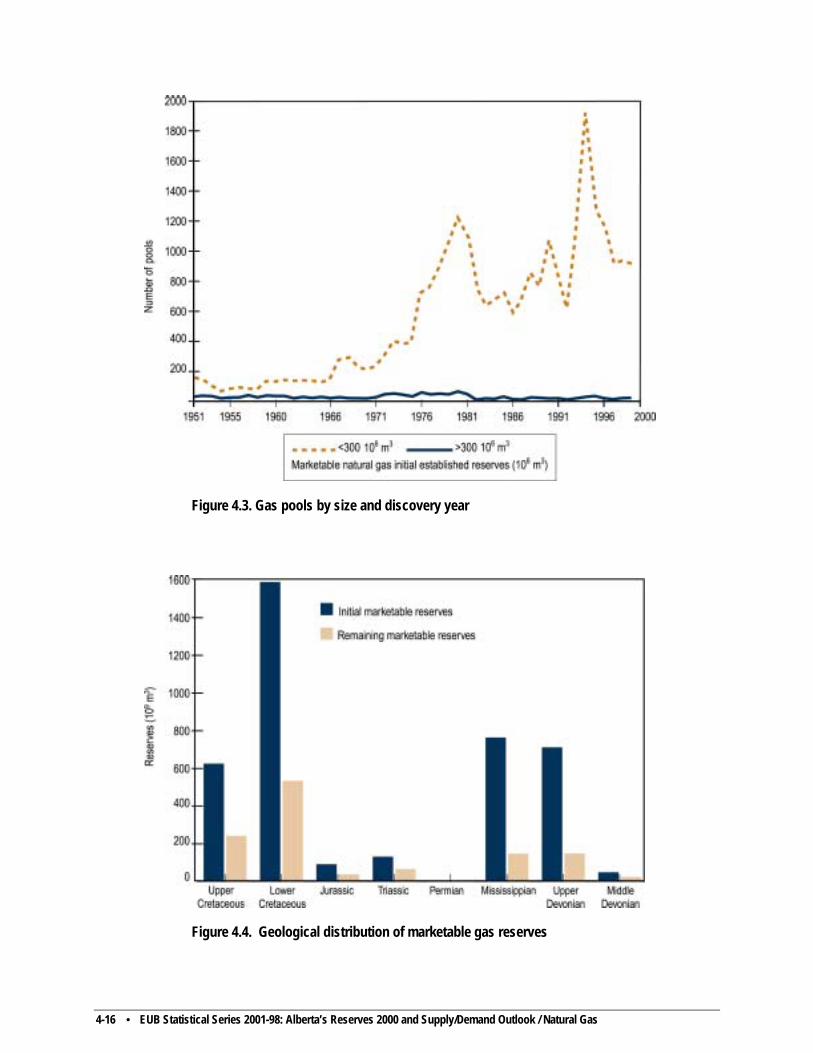
4-16 • EUB Statistical Series 2001-98: Alberta’s Reserves 2000 and Supply/Demand Outlook / Natural Gas
Figure 4.3. Gas pools by size and discovery year
Figure 4.4. Geological distribution of marketable gas reserves
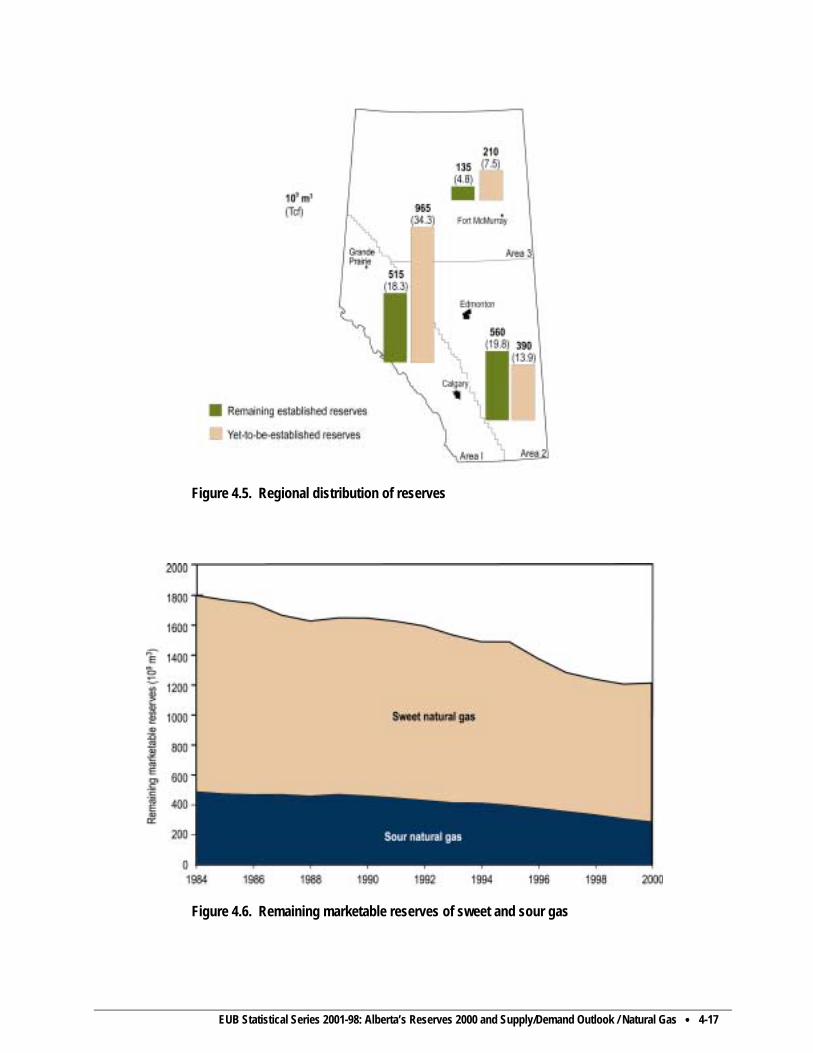
EUB Statistical Series 2001-98: Alberta’s Reserves 2000 and Supply/Demand Outlook / Natural Gas •••• 4-17
Figure 4.5. Regional distribution of reserves
Figure 4.6. Remaining marketable reserves of sweet and sour gas

4-18 • EUB Statistical Series 2001-98: Alberta’s Reserves 2000 and Supply/Demand Outlook / Natural Gas
Figure 4.7. Growth of initial established reserves of marketable gas

EUB Statistical Series 2001-98: Alberta’s Reserves 2000 and Supply/Demand Outlook / Natural Gas •••• 4-19
Figure 4.8. Gas ultimate potential
Figure 4.9. Successful natural gas wells drilled and connected

4-20 • EUB Statistical Series 2001-98: Alberta’s Reserves 2000 and Supply/Demand Outlook / Natural Gas
Figure 4.10. Alberta natural gas drilling activity
Figure 4.11. New natural gas well connections
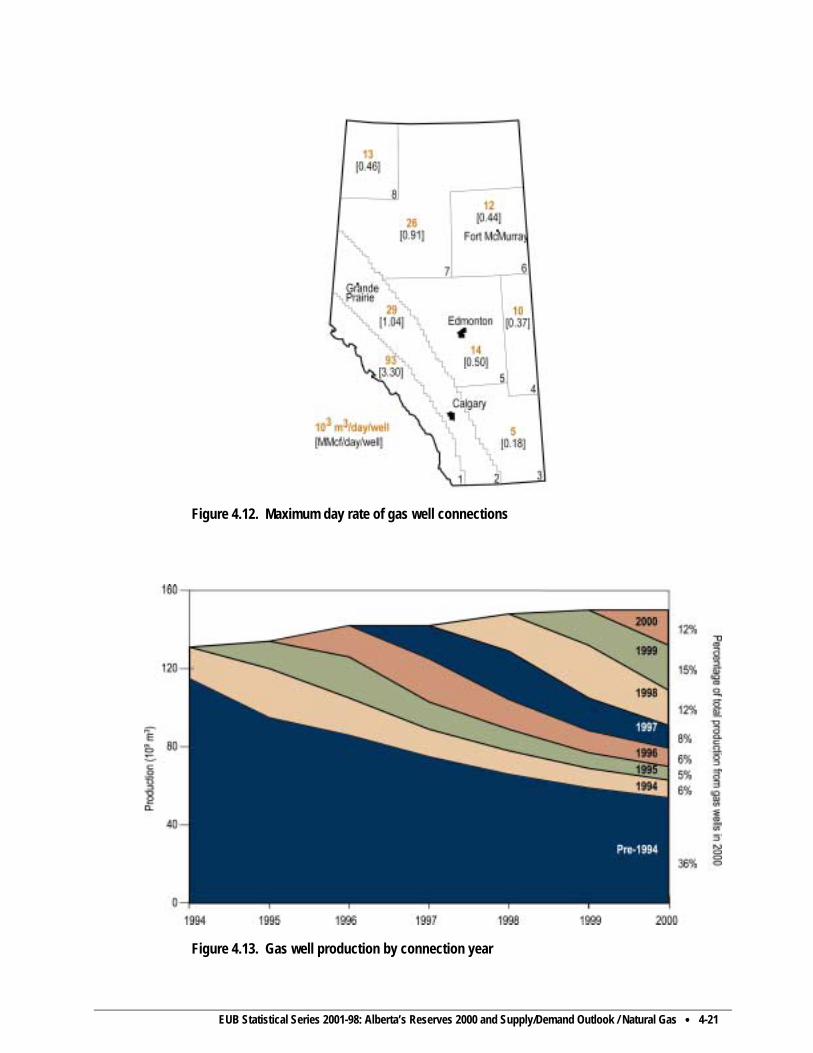
EUB Statistical Series 2001-98: Alberta’s Reserves 2000 and Supply/Demand Outlook / Natural Gas •••• 4-21
Figure 4.12. Maximum day rate of gas well connections
Figure 4.13. Gas well production by connection year
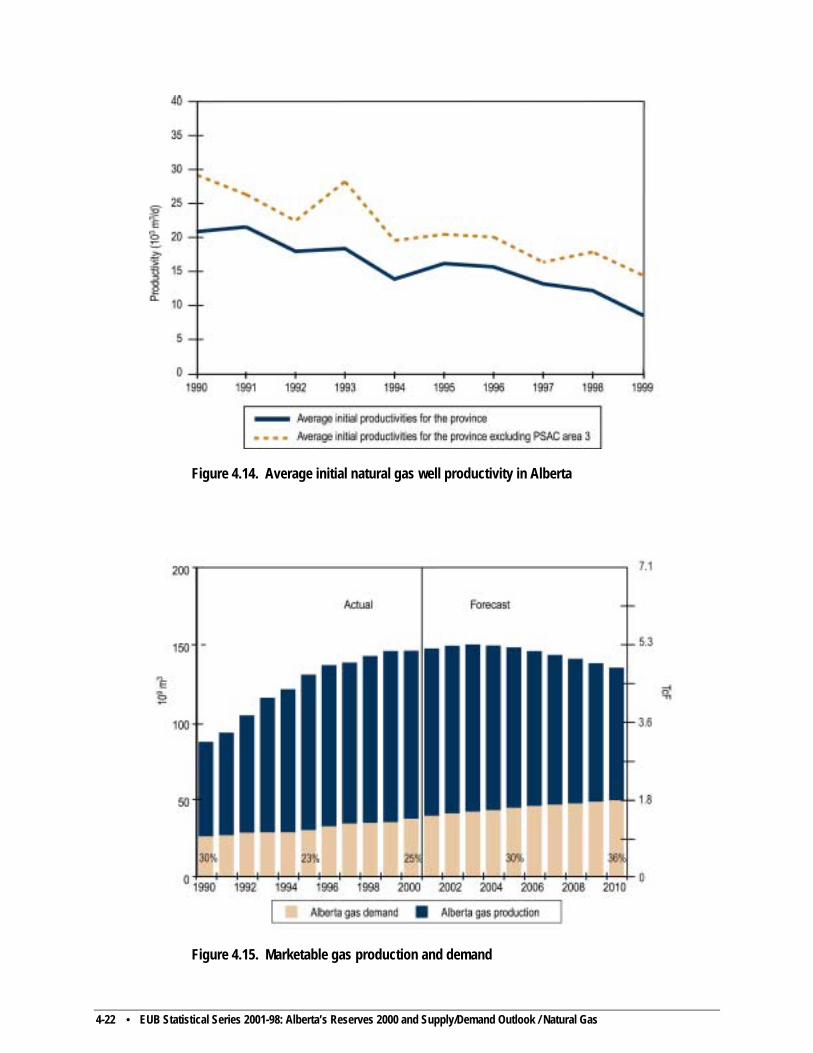
4-22 • EUB Statistical Series 2001-98: Alberta’s Reserves 2000 and Supply/Demand Outlook / Natural Gas
Figure 4.14. Average initial natural gas well productivity in Alberta
Figure 4.15. Marketable gas production and demand

EUB Statistical Series 2001-98: Alberta’s Reserves 2000 and Supply/Demand Outlook / Natural Gas •••• 4-23
Figure 4.16. Alberta natural gas storage injection/withdrawal volumes
Figure 4.17. Alberta gas demand by sector

EUB Statistical Series 2001-98: Alberta’s Reserves 2000 and Supply/Demand Outlook / Ethane and Other Natural Gas Liquids •••• 5-1
5 Ethane and Other Natural Gas Liquids
This section deals with liquids from natural gas classified as ethane and other natural gas liquids (NGL), which are discussed in Sections 5.1.1 and 5.1.2 respectively. The EUB defines ethane as, in addition to its normal scientific meaning, a mixture of ethane that ordinarily may contain some methane or propane. However, the ethane reserves estimated in this report are calculated on the basis of ethane product assumed to be 100 per cent ethane. NGL is defined as propane, butanes, pentanes plus, or a combination of these obtained from the processing of raw gas or condensate.
5.1 Reserves
5.1.1 Reserves of Ethane
This section discusses the total ethane volumes contained in the remaining established reserves of marketable gas discussed in Section 4.1.1. The remaining established reserves of marketable gas are determined at the field plant gate and contain all of the ethane present in the gas with the exception of a portion extracted at field plants with deep-cut facilities. Although the EUB believes that ethane extraction at crude oil refineries and at plants processing synthetic crude oil might become viable in the future, it has not attempted to estimate the prospective reserves from those sources. A file containing each pool’s compositional gas analysis and remaining established reserves of marketable gas was used in preparing the ethane reserve estimates. Where a gas analysis was not available for a particular pool, a field or area average for the zone was used. The EUB estimates the remaining ethane volume from the total remaining established reserves of marketable gas to be 252 million cubic metres (106 m3) in liquefied form or 70.9 billion cubic metres (109 m3) in gaseous form. This estimate includes 28 106 m3 recoverable from the ethane component of the solvent bank injected into several pools throughout the province to enhance oil recovery. Based on the EUB’s estimated ultimate potential of 1030 106 m3, there remains 279 106 m3 yet to be discovered. The overall changes in reserves during the past year are shown in Table 5.1. Table 5.1. Ethane reserves (106 m3) in liquefied form as of December 31, 2000
2000 1999 Change Initial established 758.0 739.0 + 19.0 Actual cumulative production 156.3 143.5 + 12.8 Volume in marketed gas 349.7 339.5 Remaining established 252.0 256.0 -4.0
For individual gas pools, the ethane content of marketable gas in Alberta falls within the range of 0.0025 to 0.20 mole per mole (mol/mol). As shown in Table 5.2, the volume-weighted average ethane content of all remaining established marketable gas was 0.052 mol/mol. This table also gives a breakdown of ethane volumes recoverable from major fields, all other remaining fields, and solvent floods. Fields with liquid ethane reserves greater than 3 106 m3 are classified as major fields and are listed in Table 5.3.
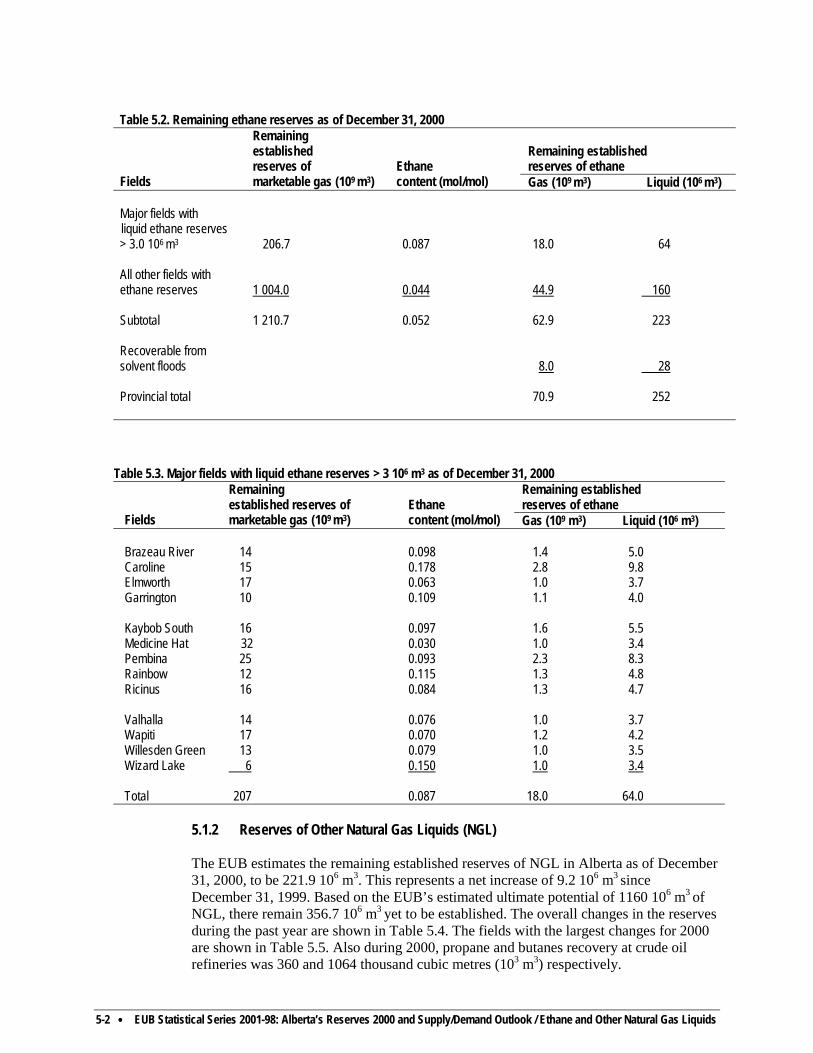
5-2 •••• EUB Statistical Series 2001-98: Alberta’s Reserves 2000 and Supply/Demand Outlook / Ethane and Other Natural Gas Liquids
Table 5.2. Remaining ethane reserves as of December 31, 2000
Remaining established reserves of ethane
Fields
Remaining established reserves of marketable gas (109 m3)
Ethane content (mol/mol) Gas (109 m3) Liquid (106 m3)
Major fields with liquid ethane reserves > 3.0 106 m3
206.7
0.087
18.0
64
All other fields with ethane reserves
1 004.0
0.044
44.9
160
Subtotal 1 210.7 0.052 62.9 223 Recoverable from solvent floods
8.0
28
Provincial total 70.9 252
Table 5.3. Major fields with liquid ethane reserves > 3 106 m3 as of December 31, 2000
Remaining established reserves of ethane
Fields
Remaining established reserves of marketable gas (109 m3)
Ethane content (mol/mol) Gas (109 m3) Liquid (106 m3)
Brazeau River 14 0.098 1.4 5.0 Caroline 15 0.178 2.8 9.8 Elmworth 17 0.063 1.0 3.7 Garrington 10 0.109 1.1 4.0 Kaybob South 16 0.097 1.6 5.5 Medicine Hat 32 0.030 1.0 3.4 Pembina 25 0.093 2.3 8.3 Rainbow 12 0.115 1.3 4.8 Ricinus 16 0.084 1.3 4.7 Valhalla 14 0.076 1.0 3.7 Wapiti 17 0.070 1.2 4.2 Willesden Green 13 0.079 1.0 3.5 Wizard Lake 6 0.150 1.0 3.4 Total 207 0.087 18.0 64.0
5.1.2 Reserves of Other Natural Gas Liquids (NGL)
The EUB estimates the remaining established reserves of NGL in Alberta as of December 31, 2000, to be 221.9 106 m3. This represents a net increase of 9.2 106 m3 since December 31, 1999. Based on the EUB’s estimated ultimate potential of 1160 106 m3 of NGL, there remain 356.7 106 m3 yet to be established. The overall changes in the reserves during the past year are shown in Table 5.4. The fields with the largest changes for 2000 are shown in Table 5.5. Also during 2000, propane and butanes recovery at crude oil refineries was 360 and 1064 thousand cubic metres (103 m3) respectively.
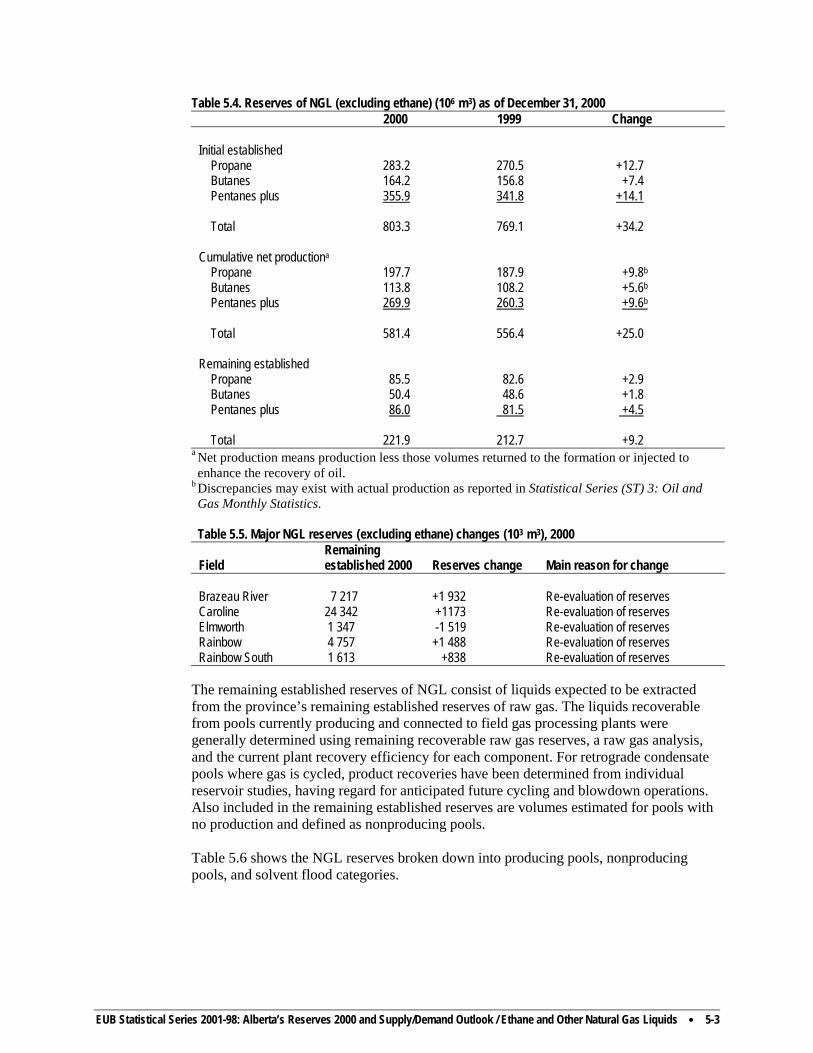
EUB Statistical Series 2001-98: Alberta’s Reserves 2000 and Supply/Demand Outlook / Ethane and Other Natural Gas Liquids •••• 5-3
Table 5.4. Reserves of NGL (excluding ethane) (106 m3) as of December 31, 2000 2000 1999 Change Initial established Propane 283.2 270.5 +12.7 Butanes 164.2 156.8 +7.4 Pentanes plus 355.9 341.8 +14.1 Total 803.3 769.1 +34.2 Cumulative net productiona Propane 197.7 187.9 +9.8b
Butanes 113.8 108.2 +5.6b
Pentanes plus 269.9 260.3 +9.6b
Total 581.4 556.4 +25.0 Remaining established Propane 85.5 82.6 +2.9 Butanes 50.4 48.6 +1.8 Pentanes plus 86.0 81.5 +4.5 Total 221.9 212.7 +9.2
a Net production means production less those volumes returned to the formation or injected to enhance the recovery of oil.
b Discrepancies may exist with actual production as reported in Statistical Series (ST) 3: Oil and Gas Monthly Statistics.
Table 5.5. Major NGL reserves (excluding ethane) changes (103 m3), 2000 Field
Remaining established 2000
Reserves change
Main reason for change
Brazeau River 7 217 +1 932 Re-evaluation of reserves Caroline 24 342 +1173 Re-evaluation of reserves Elmworth 1 347 -1 519 Re-evaluation of reserves Rainbow 4 757 +1 488 Re-evaluation of reserves Rainbow South 1 613 +838 Re-evaluation of reserves
The remaining established reserves of NGL consist of liquids expected to be extracted from the province’s remaining established reserves of raw gas. The liquids recoverable from pools currently producing and connected to field gas processing plants were generally determined using remaining recoverable raw gas reserves, a raw gas analysis, and the current plant recovery efficiency for each component. For retrograde condensate pools where gas is cycled, product recoveries have been determined from individual reservoir studies, having regard for anticipated future cycling and blowdown operations. Also included in the remaining established reserves are volumes estimated for pools with no production and defined as nonproducing pools. Table 5.6 shows the NGL reserves broken down into producing pools, nonproducing pools, and solvent flood categories.

5-4 •••• EUB Statistical Series 2001-98: Alberta’s Reserves 2000 and Supply/Demand Outlook / Ethane and Other Natural Gas Liquids
Table 5.6. Remaining established NGL reserves (excluding ethane) (106 m3) as of December 31, 2000 Propane Butanes Pentanes plus Total Producing pools 71.1 41.6 76.3 189.0 Nonproducing pools 14.3 7.6 9.1 31.0 Solvent floods 0.1 1.2 0.6 1.9 Total 85.5 50.4 86.0 221.9
Natural gas liquids are also recoverable at straddle plants. This volume is estimated by multiplying the remaining marketable gas reserves by the historic ratio of liquid production to marketable gas production. This assumes that the liquid content of marketable gas volume to be processed at straddle plants will remain constant. The EUB believes this approach gives a reasonable indication of the NGL recoverable at these plants. Listed in Appendix 3 are fields containing 800 103 m3 or more of recoverable reserves, while those with less are grouped under confidential and other small reserves categories. The volumes recoverable at straddle plants are not included in the field totals but are shown separately at the end of this table. Note that some fields containing less than 800 103 m3 have been listed individually in this table for historical reasons.
5.2 Supply of and Demand for Ethane and Other Natural Gas Liquids (NGL) 5.2.1 Supply of Ethane and Other NGL Ethane and other NGL are recovered from several sources, including gas processing plants in the field, that extract ethane, propane, butanes, and pentanes plus as products or recover an NGL mix from raw gas production. NGL mixes are sent from these field plants to fractionation plants to recover individual NGL specification products. Straddle plants, usually at border points, recover NGL products from gas that has been processed in the field. To compensate for the liquids removed, lean make-up gas volumes are purchased by the straddle plants and added to the marketable gas stream leaving the plant. Although some pentanes plus is recovered in the field as gas condensate, the majority of the supply is recovered from the processing of natural gas. The Alliance pipeline, placed on-stream in December 2000, moves rich gas with ethane and other NGL in the gas stream until it reaches its destination point near Chicago, Illinois, where ethane and other liquid recovery occurs. The natural gas to be moved on the Alliance pipeline is, however, sent to field processing plants for the removal of H2S and CO2 before entering the pipeline.
The other source of NGL supply is from crude oil refineries, where small volumes of propane and butanes are recovered. Figure 5.1 is a schematic that illustrates the stages involved in processing raw gas and crude oil for the recovery of ethane, propane, butanes, and pentanes plus.
Ethane and other NGL production is a function of marketable gas production, as well as its liquid content, gas plant recovery efficiencies, and prices. High gas prices may cause gas processors to reduce liquid recovery. In this situation gas would be sold for its heating value. To meet demand, ethane extracted at Alberta processing facilities increased from 11.3 106 m3 (31.0 103 m3/d) in 1999 to 12.8 106 m3 (35.1 103 m3/d) in 2000. Table 5.7

EUB Statistical Series 2001-98: Alberta’s Reserves 2000 and Supply/Demand Outlook / Ethane and Other Natural Gas Liquids •••• 5-5
Table 5.7. Ethane extraction volumes at gas plants in Alberta, 2000 Gas plants Volume (106 m3) % of total Field plants 1.3 10 Fractionation plants 3.1 24 Straddle plants _8.4 _66 Total 12.8 100
shows the volumes of specification ethane extracted at the three types of processing facilities during 2000. In 2000 some 59 per cent of potentially recoverable ethane was extracted from natural gas production, while the remainder was left in the gas stream and sold for its heating value. By applying present technology to ethane recovery processes, some 80 per cent of ethane contained in Alberta’s gas production could be recovered at ethane processing facilities. In 2000, Alberta recovered 9.8 106 m3 (26.8 103 m3/d) of propane from natural gas processing and 0.4 106 m3 (1.1 103 m3/d) from crude oil refineries. In the same year, butanes recovery was 5.6 106 m3 (15.3 103 m3/d) from natural gas processing and 1.1 106
m3 (3.0 103 m3/d) from crude oil refineries. In 2000, 9.6 106 m3 (26.3 103 m3/d) of pentanes plus was recovered from Alberta gas. For the purpose of forecasting ethane and other NGL, the richness and gas production volumes from established and new reserves determine future production. The ratio of potentially recoverable ethane, propane, butanes, and pentanes plus production to marketable gas production is 148, 67, 36, and 69 m3 (liquid) per 106 m3 of marketable gas respectively. The NGL content from the new reserves is assumed to be somewhat higher than existing reserves, as a large portion of yet to be discovered gas is in the deeper part of the basin. Ratios of potentially recoverable ethane, propane, butane, and pentanes plus production to marketable gas increase over the forecast period to 170, 74, 43, and 82 m3 (liquid) per 106 m3 of marketable gas by 2010. No attempt has been made to include ethane and other NGL production from the solvent flood bank injected into several pools throughout the province to enhance oil recovery. By 2010 potential ethane supply is forecast to be 63.1 103 m3/d, and annual propane, butane, and pentanes plus recovery will be 27.2 103 m3/d, 16.4 103 m3/d and 30.5 103 m3/d respectively, as shown in Figures 5.2, 5.3, 5.4, and 5.5. It should be noted that high gas prices may cause gas processors to reduce liquid recovery from the volumes forecast. Figure 5.2 shows ethane supply referred to as potential supply as it indicates the volumes of ethane that may be recovered from Alberta natural gas. The historical supply volumes assume the ethane content of marketable gas production in Alberta has been 5.2 per cent and that 80 per cent of ethane could economically be recovered at ethane processing facilities. Approved annual processing plant capacity for ethane recovery in Alberta is currently some 62.3 103 m3/d, and the extraction plant near Chicago that started operations in December 2000 has a design capacity to extract 6.3 103 m3/d. This indicates that the current processing capacity is not a constraint to recovering the volumes forecast.
5-6 •••• EUB Statistical Series 2001-98: Alberta’s Reserves 2000 and Supply/Demand Outlook / Ethane and Other Natural Gas Liquids
5.2.2 Demand for Ethane and NGL Of the ethane extracted in the year 2000, some 89 per cent was used by the Alberta petrochemical industry as feedstock to produce ethylene, while the remainder was exported out of the province. The petrochemical industry in Alberta is the major consumer of ethane recovered from natural gas in the province, with four plants using ethane as feedstock for the production of ethylene. Small volumes of ethane are exported from the province by the Cochin pipeline under removal permits. The Alliance pipeline is moving ethane from the province in the natural gas stream to be recovered in the United States. All of the above requirements for Alberta ethane constitute the demand forecast. As shown in Figure 5.2, total ethane demand is projected to increase from 35.1 103 m3/d in 2000 to 51.8 103 m3/d in 2001 and stay constant thereafter. Alberta demand is projected to increase from 31.2 103 m3/d in 2000 to 42.5 103 m3/d in 2001 and remain at these levels to 2010, representing 80 per cent of total ethane demand. The potential supply exceeds demand for ethane for the entire forecast period. However, supplies will be tighter than they have been historically, due to the large increase in demand brought on by the fourth ethylene plant placed on production in October 2000, and the Alliance pipeline that came on stream in December 2000. The forecast assumes that all four Alberta ethylene plants will run at 90 per cent capacity. Export removals from the province are expected to continue, and the extraction plant near Chicago is expected to run at a 90 per cent load. For purposes of this forecast, it was assumed that no new ethylene plants will be built during the forecast period requiring Alberta ethane as feedstock. Figure 5.3 shows Alberta demand for propane compared to the total available supply from gas processing plants. The difference between Alberta requirements and total supply represents volumes used by ex-Alberta markets. Propane is used as a fuel in remote areas for space and water heating, as an alternative fuel in motor vehicles, and for barbecues and grain drying. Figure 5.4 shows Alberta demand for butanes compared to the total available supply from gas processing plants. The difference between Alberta requirements and total supply represents volumes used by ex-Alberta markets. Alberta demand for butanes will increase as refinery requirements grow. Butanes are used in gasoline blends as an octane enhancer. Another major use of butanes in the province is as a petroleum feedstock in the production of methyl-tertiary-butyl-ether (MTBE), which when added to gasoline improves combustion efficiency and reduces pollutants, especially ground-level ozone and carbon monoxide. The state of California, which is the main market for the MTBE produced in Alberta, is poised to ban its use by 2002. The one plant in the province currently producing this product has options available to it and may redesign the plant to produce iso-octane if MTBE is banned from the U.S. market. The other petrochemical consumer of butanes in Alberta is a plant that uses butanes to produce vinyl acetate. Figure 5.5 shows Alberta demand for pentanes plus compared to the total available supply. Alberta pentanes plus demand will increase as diluent requirements for transporting heavy crude oil and bitumen increase, this being the primary use. Diluent is required to increase the API gravity and reduce the viscosity of heavy crude oils and bitumen to facilitate transportation through pipelines. The required diluent for bitumen accounts for 40 per cent of the total volume transported, while heavy crude oil requires about 7 per cent.
EUB Statistical Series 2001-98: Alberta’s Reserves 2000 and Supply/Demand Outlook / Ethane and Other Natural Gas Liquids •••• 5-7
Over the forecast period, pentanes plus demand as diluent is expected to increase from 2000 levels of 19.8 103 m3/d to 61.2 103 m3/d. Shortages of pentanes plus as diluent is forecast to occur by 2005. The diluent requirement for heavy crude oil is expected to rise from 2.4 103 m3/d in 2000 to peak in 2003 at 2.7 103 m3/d and then decline to 2.0 103 m3/d by the end of the forecast. Conversely, diluent requirements for bitumen are expected to increase quite dramatically from 17.4 103 m3/d in 2000 to 59.1 103 m3/d by 2010.
There has been concern within industry that pentanes plus supply may decrease to a level
where refinery light ends may have to be used as diluent. Several steps have been taken to reduce the pentanes plus diluent requirements in past years, including the Enbridge pipeline system implementing a new viscosity standard in 1999, which reduced the diluent requirement by about 10 per cent. Industry may consider alternatives to pentanes plus as diluent, such as light crude oil, synthetic crude oil, and naptha, when pentanes plus demand is greater than supply. Upgrading bitumen near the production source may also be required.
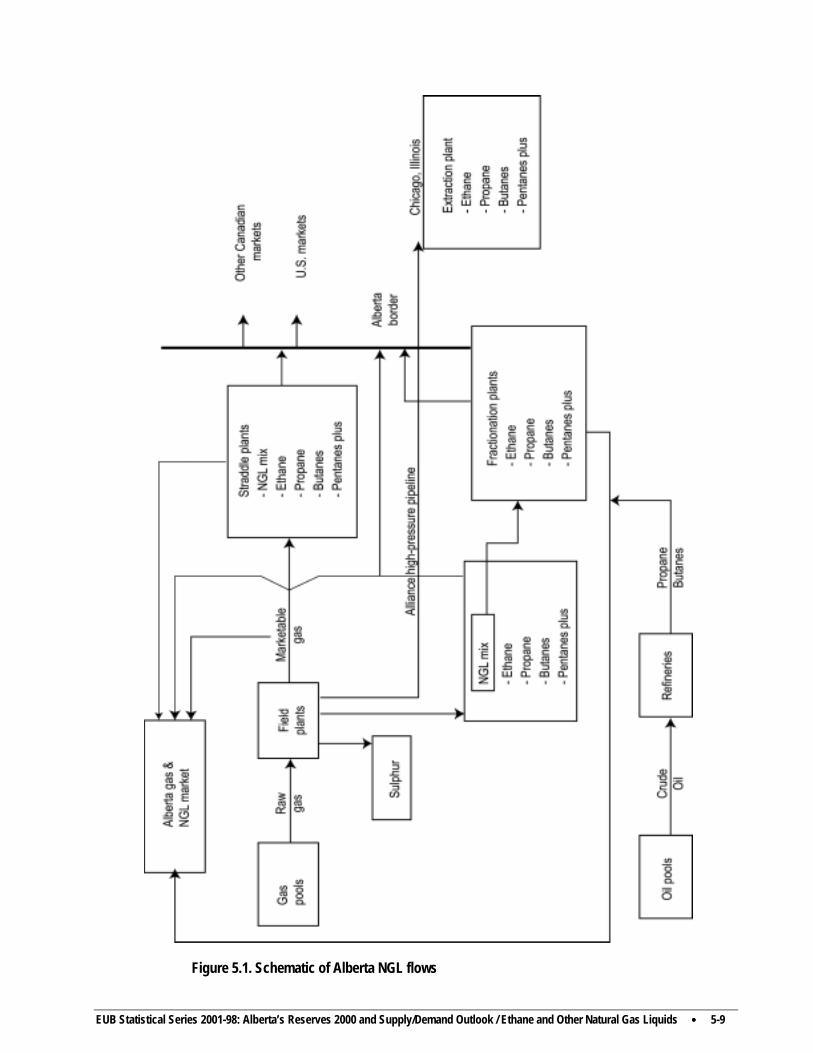
EUB Statistical Series 2001-98: Alberta’s Reserves 2000 and Supply/Demand Outlook / Ethane and Other Natural Gas Liquids •••• 5-9
Figure 5.1. Schematic of Alberta NGL flows
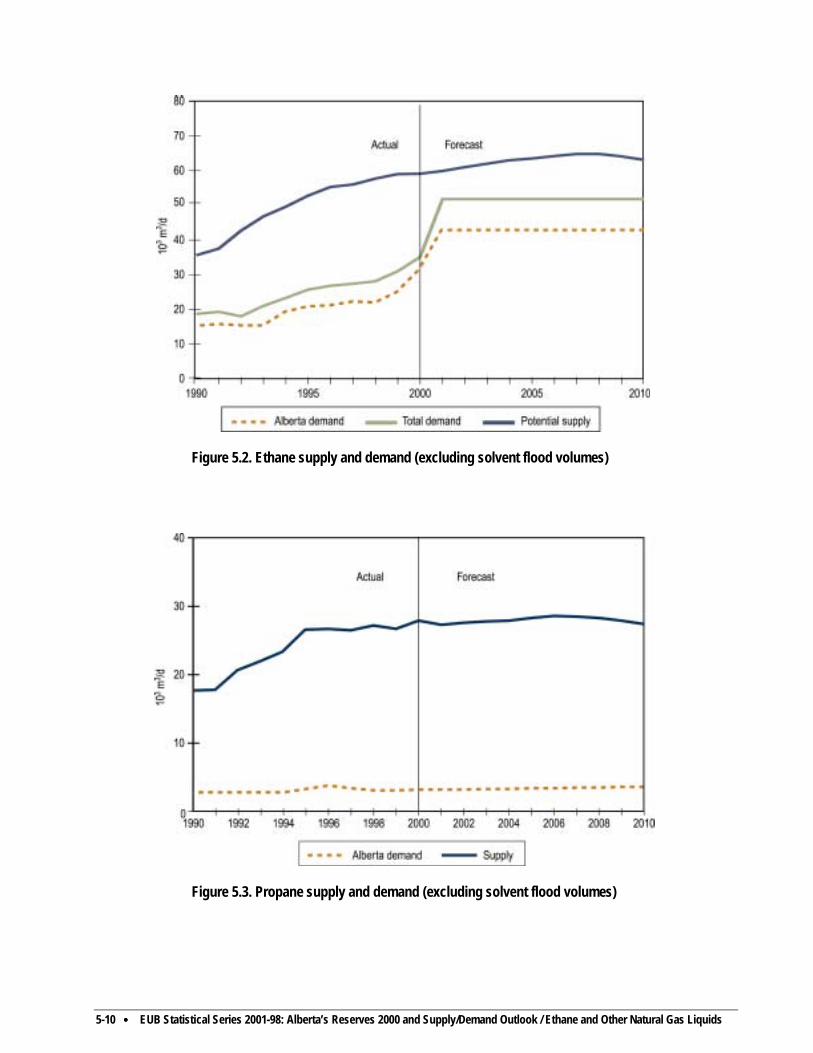
5-10 •••• EUB Statistical Series 2001-98: Alberta’s Reserves 2000 and Supply/Demand Outlook / Ethane and Other Natural Gas Liquids
Figure 5.2. Ethane supply and demand (excluding solvent flood volumes)
Figure 5.3. Propane supply and demand (excluding solvent flood volumes)

EUB Statistical Series 2001-98: Alberta’s Reserves 2000 and Supply/Demand Outlook / Ethane and Other Natural Gas Liquids •••• 5-11
Figure 5.4. Butanes supply and demand (excluding solvent flood volumes)
Figure 5.5. Pentanes plus supply and demand (excluding solvent flood volumes)

EUB Statistical Series 2001-98: Alberta’s Reserves 2000 and Supply/Demand Outlook / Coal •••• 6-1
6 Coal
6.1 Reserves of Coal
6.1.1 Provincial Summary
The following information summarizes the material found in EUB statistical report ST-2000-31: Reserves of Coal. Those seeking more detailed information or a greater understanding of the parameters and procedures used to calculate established coal reserves are referred to that report. The significant amount of data generated in the exploration for coal has been used by the EUB to estimate coal reserves throughout the province. The EUB currently estimates that Alberta’s established initial in-place resources of all types of coal total about 94 gigatonnes (Gt).1 Of this amount, about 34 Gt, or approximately 36 per cent, are considered to be recoverable (by surface and underground methods), and of these reserves, 1.2 Gt are within permit boundaries of mines that were active in 2000. Table 6.1 gives a breakdown by rank of resources and reserves from 244 coal deposits. Table 6.1. Established initial in-place resources and remaining reserves of coal in Alberta as of December 31, 2000 (Gt) Initial Remaining Rank in-place Cumulative Remaining reserves in Classification resources production reserves active mines Low- and medium- volatile bituminousa Surface 1.7 0.21 0.60 Underground 5.1 0.10 0.63 Totalb 6.8 0.32 1.2 0.15 High-volatile bituminous Surface 2.6 0.13 1.8 Underground 3.3 0.05 0.91 Totalb 5.9 0.17 2.7 0.18 Subbituminousc Surface 14 0.55 8.4 Underground 67 0.07 21 Totalb 81 0.62 30 0.83 Grand totalb 94 1.11 34 1.2 a Includes minor amounts of semi-anthracite. b Totals are not arithmetic sums but are the result of separate determinations. c Includes minor lignite.
Minor changes in remaining established reserves from December 31, 1999, to December 31, 2000, resulted from increases in cumulative production. During 2000 the low- and medium-volatile, high-volatile, and subbituminous production were 0.005 Gt, 0.005 Gt, and 0.024 Gt respectively.
1 Giga = 109; 1 tonne = 1000 kilograms.

6-2 •••• EUB Statistical Series 2001-98: Alberta’s Reserves 2000 and Supply/Demand Outlook / Coal
6.1.2 Initial in-Place Resources
Several techniques, in particular the block kriging, grid, polygon, and cross-section methods, have been used for calculating in-place volumes, with separate volumes calculated for surface- and underground-mineable coal. In general, shallow coal is mined more cheaply by surface than by underground methods; such coal is therefore classified as surface-mineable. At some stage of increasing depth and strip ratio the advantage passes to underground mining; this coal is considered underground-mineable. The classification scheme used to differentiate between surface- and underground-mineable coal is very broadly based on depth and strip ratio designed to reflect relative costs, but it does not necessarily mean that the coal could be mined under the economic conditions prevailing today. 6.1.3 Established Reserves
Certain parts of deposits are considered nonrecoverable for technical, environmental, or safety reasons and therefore have no recoverable reserves. For the remaining areas, recovery factors have been determined for the surface-mineable coal, as well as the thicker underground classes. A recovery factor of 90 per cent has been assigned to the remaining in-place surface-mineable area, followed by an additional small coal loss at the top and a small dilution at the bottom of each seam. In the case of underground-mineable coal, geologically complex environments may make mining significant parts of some deposits uneconomic. Because there is seldom sufficient information to outline such areas, it is assumed that in addition to the coal previously excluded, only a percentage of the remaining deposit areas would be mined. Thus a “deposit factor” has been allowed for where, on average, only 50 per cent of the remaining deposit area is considered to be mineable in the mountain region,2 70 per cent in the foothills, and 90 per cent in the plains. A mining recovery factor of 75 per cent is then applied to both medium (1.5 - 3.6 m) and thick (> 3.6 m) seams, with a maximum recoverable thickness of 3.6 m applied to thick seams. Thin seams (0.6 - <1.5 m) are not considered recoverable by underground methods. Any developer wishing to mine coal in Alberta must first obtain a permit and licence from the EUB. An application for a permit must include extensive information on such matters as coal reserves, proposed mining methods, and marketing of coal. Coal reserves within the applied-for mine area must be at least sufficient to meet the marketing plans of the applicant. Table 6.2 shows the established resources and reserves within the current permit boundaries of those mines active in 2000.
2 The EUB has designated three regions within Alberta where coals of similar quality and mineablility are
recovered.

EUB Statistical Series 2001-98: Alberta’s Reserves 2000 and Supply/Demand Outlook / Coal •••• 6-3
Table 6.2. Established resources and reserves of coal under active development as of December 31, 2000 Initial in-place Initial Cumulative Remaining Rank Permit areaa resources reserve production reserves Mine (ha) (106 t) (106 t) (106 t) (106 t) Low- and medium- volatile bituminous Gregg Riverb 3 540 103 62 46 16 Luscar 5 050 332 130 90 40 Smoky Riverc 8 500 604 171 77 94 Total 17 090 1 039 363 213 150 High-volatile bituminous Coal Valley 6 400 349 167 93 74 Obed 7 590 162 137 35 102 Total 13 990 611 304 128 176 Subbituminous Vesta 2 410 69 54 34 20 Paintearth 2 710 94 67 33 34 Sheerness 7 000 196 150 47 103 Dodds 140 2 2 1 1 Whitewood 2 800 163 98 67 31 Highvale 12 140 1 021 764 263 501 Genesee 7 320 250 176 33 143 Total 34 520 1 795 1 311 478 833 Grand total 65 600 3 445 1 978 819 1 159
a The permit areas correspond to the areas defined in the most recent EUB permit. b Suspended operations in August 2000.
c Permanently closed in March 2000. 6.1.4 Ultimate Potential A combination of two methods has been used to estimate ultimate potentials. The first, the volume method, gives a broad estimate of area, coal thickness, and recovery ratio for each coal-bearing horizon, while the second method estimates the ultimate potential from the trend of initial reserves versus exploration effort. A large degree of uncertainty is inevitably associated with estimation of an ultimate potential. New data could substantially alter results derived from the current best fit. To avoid large fluctuations of ultimate potentials from year to year, the EUB has adopted the policy of using the figures published in the previous Reserves of Coal report and adjusting them slightly to reflect the most recent trends. Table 6.3 gives quantities by rank for surface- and underground-mineable ultimate in-place resources, as well as the ultimate potentials.
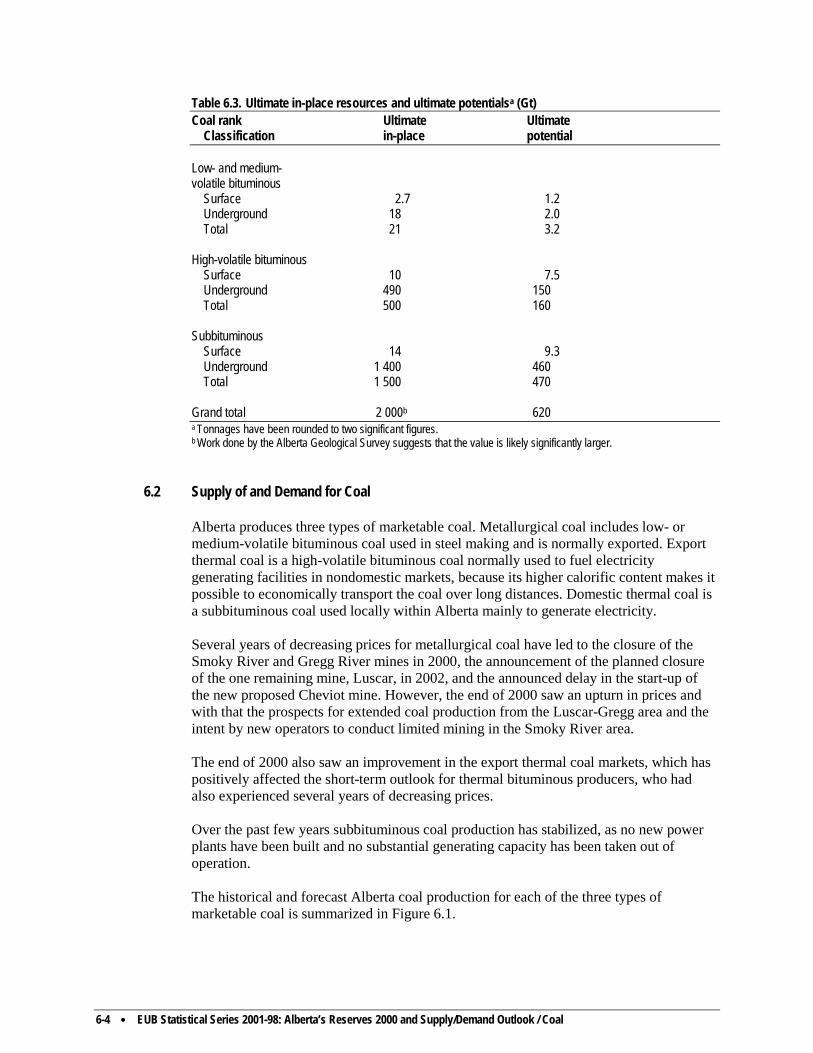
6-4 •••• EUB Statistical Series 2001-98: Alberta’s Reserves 2000 and Supply/Demand Outlook / Coal
Table 6.3. Ultimate in-place resources and ultimate potentialsa (Gt) Coal rank Ultimate Ultimate Classification in-place potential Low- and medium- volatile bituminous Surface 2.7 1.2 Underground 18 2.0 Total 21 3.2 High-volatile bituminous Surface 10 7.5 Underground 490 150 Total 500 160 Subbituminous Surface 14 9.3 Underground 1 400 460 Total 1 500 470 Grand total 2 000b 620 a Tonnages have been rounded to two significant figures. b Work done by the Alberta Geological Survey suggests that the value is likely significantly larger.
6.2 Supply of and Demand for Coal
Alberta produces three types of marketable coal. Metallurgical coal includes low- or medium-volatile bituminous coal used in steel making and is normally exported. Export thermal coal is a high-volatile bituminous coal normally used to fuel electricity generating facilities in nondomestic markets, because its higher calorific content makes it possible to economically transport the coal over long distances. Domestic thermal coal is a subbituminous coal used locally within Alberta mainly to generate electricity. Several years of decreasing prices for metallurgical coal have led to the closure of the Smoky River and Gregg River mines in 2000, the announcement of the planned closure of the one remaining mine, Luscar, in 2002, and the announced delay in the start-up of the new proposed Cheviot mine. However, the end of 2000 saw an upturn in prices and with that the prospects for extended coal production from the Luscar-Gregg area and the intent by new operators to conduct limited mining in the Smoky River area. The end of 2000 also saw an improvement in the export thermal coal markets, which has positively affected the short-term outlook for thermal bituminous producers, who had also experienced several years of decreasing prices. Over the past few years subbituminous coal production has stabilized, as no new power plants have been built and no substantial generating capacity has been taken out of operation. The historical and forecast Alberta coal production for each of the three types of marketable coal is summarized in Figure 6.1.

EUB Statistical Series 2001-98: Alberta’s Reserves 2000 and Supply/Demand Outlook / Coal •••• 6-5
6.2.1 Coal Supply Twelve mine sites supplied coal in Alberta in 2000, as shown in Table 6.4. Table 6.4. Alberta coal mines and marketable coal production in 2000 Company (grouped by Production in 2000 coal type) Mine Location (106 t) Bituminous metallurgical coal Cardinal River Coals Ltd. Luscar Luscar 2.6 Luscar Ltd. Gregg Rivera Luscar 1.0 Smoky River Coal Ltd. Smoky Riverb Grande Cache 0.3 Bituminous thermal coal Luscar Ltd. Coal Valley Coal Valley 1.1 Obed Mountain Hinton 1.5 Subbituminous coal Dodds Coal Mining Co. Ltd. Dodds Ryley <0.1 Epcor Generation Inc. Genesee Genesee 3.5 Luscar Ltd. Sheerness Sheerness 3.6 Paintearth Halkirk 1.7 Vesta Cordel 1.0 TransAlta Utilities Corp Highvale Lake Wabamun 12.5 Whitewood Lake Wabamun 2.0 a Suspended operations in August 2000.
b Permanently closed in March 2000. Alberta’s ability to supply metallurgical coal in the short term is limited. While some additional mining is planned to take place at the two mine sites that shut down in 2000, it will be at lower production levels than in previous years, and neither mine has large mineable reserves available. The Luscar mine may continue production beyond 2002, but it has only limited economically mineable reserves left. While metallurgical-grade coal underlies much of the mountain region, very few areas have been sufficiently explored to identify recoverable reserves. Without significantly increased, stable prices, it is unlikely that any additional mines, other than the proposed Cheviot mine, will come on stream in the next decade. Additionally, it is increasingly more difficult to bring a mountain mine into production due to enhanced social and environmental concerns. The two producing thermal bituminous coal mines have shipped all of their coal out of Alberta to markets overseas and, until recently, to Ontario. However, recently some coal has been transported within Alberta from the Obed mine to the electrical power station at Grande Cache to make up for coal supply lost due to the closure of the Smoky River mine. In recent years falling prices have cut production at these mines, but the improvement in late 2000 in prices will likely lead to modest increases in production. Substantial reserves exist in areas that have been permitted for mining but have not been brought on production. Several other areas contain significant quantities of recoverable coal. Six large mines and one very small mine produce subbituminous coal (see Table 6.4). The large ones serve nearby electric power plants, while the small one supplies residential and commercial customers. Because of the need for long-term supply to power plants, the mines have most of their reserves dedicated to the existing plants. By either
6-6 •••• EUB Statistical Series 2001-98: Alberta’s Reserves 2000 and Supply/Demand Outlook / Coal
mining more within their approved limits or expanding the approved limits, several mines could increase their production. Furthermore, several deposits in Alberta could support large new mines if markets could be secured. In the very long term, vast quantities of underground mineable coal exist, which, under favourable economic conditions, could be recovered. 6.2.2 Coal Demand With recent sharp increases in coal prices due to high petroleum prices and record-high global steel production, prospects for overseas coal sales of metallurgical coal have brightened considerably. One bituminous metallurgical coal mine that ceased production is now expected to reopen, and mining may resume at the other closed mine. Although no production from new export mines is included in this forecast, the proposed Cheviot mine could come into production within the forecast period. However, demand is not expected to be strong enough to create other opportunities for large new mines. Although international markets for thermal bituminous coal had been expanding throughout most of the 1990s (in the face of declining prices), the expansions of supply occurred largely in Indonesia and Colombia. Alberta producers were able to sell on the spot market but were unable to secure long-term contracts, so no new mines were opened in this province. Recent price increases are likely to allow the current producers to increase production levels, but they are not strong enough to bring new mines into production within the forecast period. Additionally, together with increased international competition, Alberta’s thermal bituminous producers must overcome the competitive disadvantage of the cost of moving the coal to port. Subbituminous coal production is expected to increase in the middle part of the forecast period to meet demand for additional electrical generating capacity. Beyond that, it is expected that the demand for additional subbituminous coal will level off, unless strong increases in electrical demand cause an increase in production or lower natural gas prices (to be used to as an alternative fuel to generate electricity) cause a reduction.

EUB Statistical Series 2001-98: Alberta’s Reserves 2000 and Supply/Demand Outlook / Coal •••• 6-7
Figure 6.1. Alberta marketable coal production
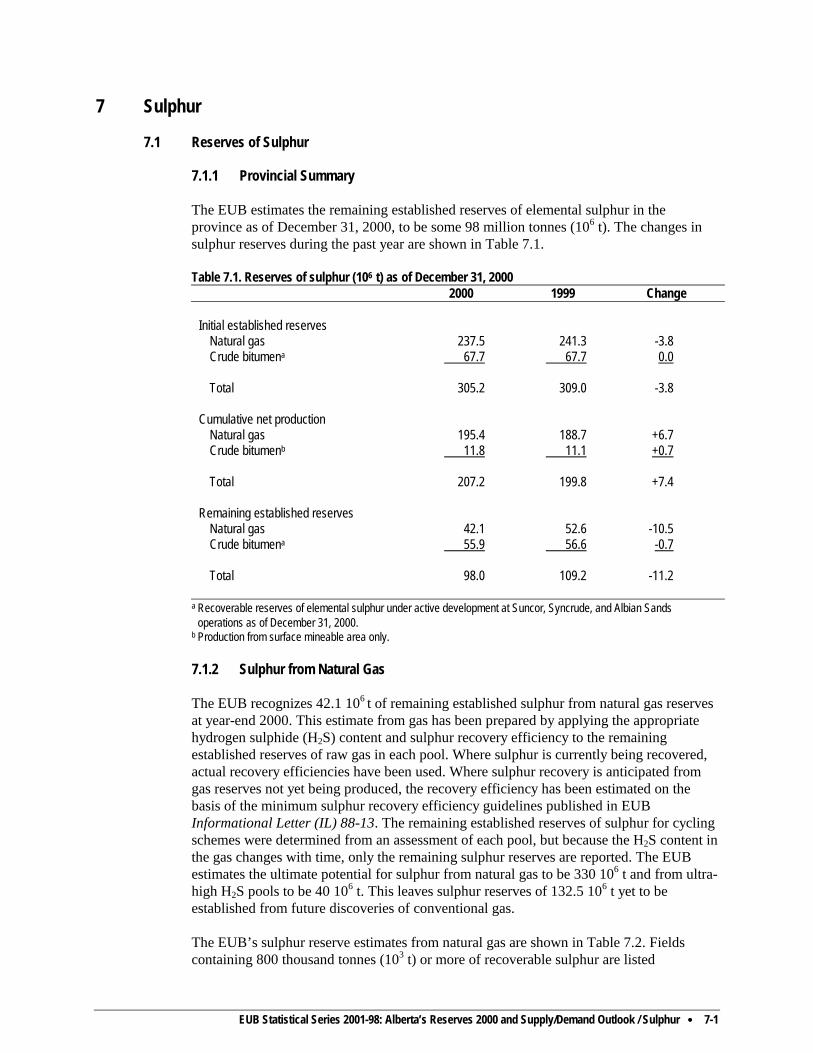
EUB Statistical Series 2001-98: Alberta’s Reserves 2000 and Supply/Demand Outlook / Sulphur •••• 7-1
7 Sulphur
7.1 Reserves of Sulphur
7.1.1 Provincial Summary
The EUB estimates the remaining established reserves of elemental sulphur in the province as of December 31, 2000, to be some 98 million tonnes (106 t). The changes in sulphur reserves during the past year are shown in Table 7.1. Table 7.1. Reserves of sulphur (106 t) as of December 31, 2000
2000 1999 Change Initial established reserves Natural gas 237.5 241.3 -3.8 Crude bitumena 67.7 67.7 0.0 Total 305.2 309.0 -3.8 Cumulative net production Natural gas 195.4 188.7 +6.7 Crude bitumenb 11.8 11.1 +0.7 Total 207.2 199.8 +7.4 Remaining established reserves Natural gas 42.1 52.6 -10.5 Crude bitumena 55.9 56.6 -0.7 Total 98.0 109.2 -11.2
a Recoverable reserves of elemental sulphur under active development at Suncor, Syncrude, and Albian Sands operations as of December 31, 2000.
b Production from surface mineable area only. 7.1.2 Sulphur from Natural Gas The EUB recognizes 42.1 106 t of remaining established sulphur from natural gas reserves at year-end 2000. This estimate from gas has been prepared by applying the appropriate hydrogen sulphide (H2S) content and sulphur recovery efficiency to the remaining established reserves of raw gas in each pool. Where sulphur is currently being recovered, actual recovery efficiencies have been used. Where sulphur recovery is anticipated from gas reserves not yet being produced, the recovery efficiency has been estimated on the basis of the minimum sulphur recovery efficiency guidelines published in EUB Informational Letter (IL) 88-13. The remaining established reserves of sulphur for cycling schemes were determined from an assessment of each pool, but because the H2S content in the gas changes with time, only the remaining sulphur reserves are reported. The EUB estimates the ultimate potential for sulphur from natural gas to be 330 106 t and from ultra-high H2S pools to be 40 106 t. This leaves sulphur reserves of 132.5 106 t yet to be established from future discoveries of conventional gas.
The EUB’s sulphur reserve estimates from natural gas are shown in Table 7.2. Fields containing 800 thousand tonnes (103 t) or more of recoverable sulphur are listed
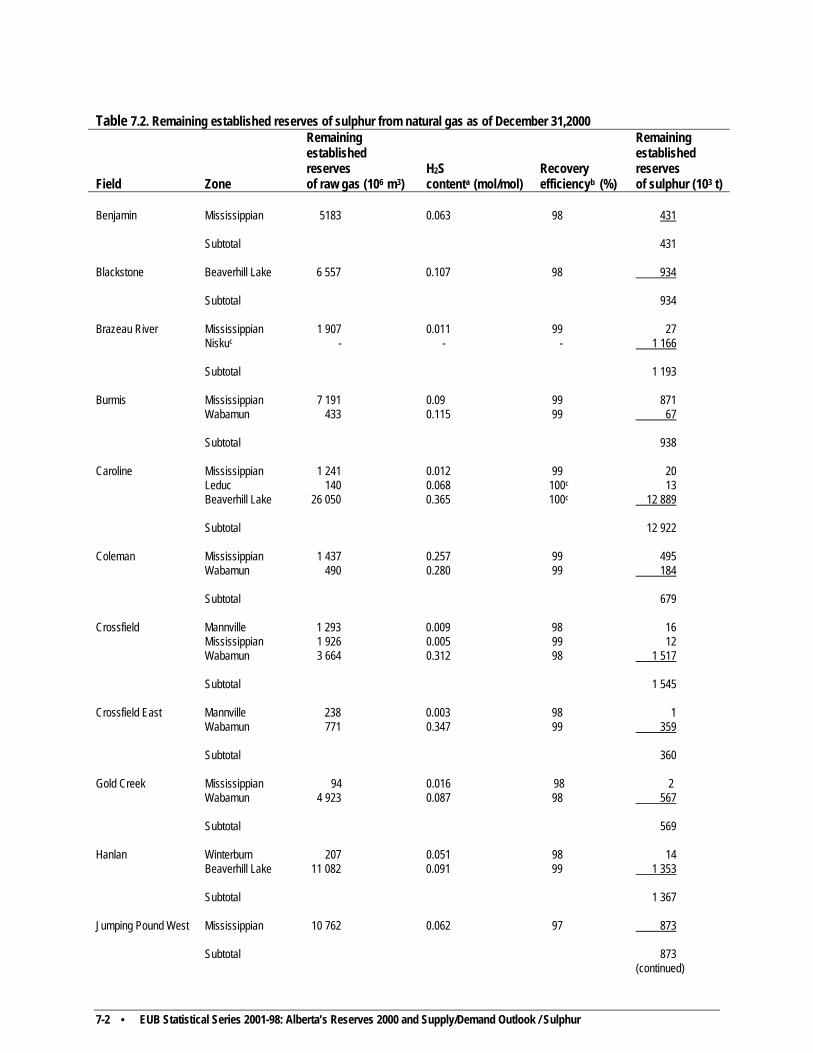
7-2 • EUB Statistical Series 2001-98: Alberta’s Reserves 2000 and Supply/Demand Outlook / Sulphur
Table 7.2. Remaining established reserves of sulphur from natural gas as of December 31,2000 Field
Zone
Remaining established reserves of raw gas (106 m3)
H2S contenta (mol/mol)
Recovery efficiencyb (%)
Remaining established reserves of sulphur (103 t)
Benjamin Mississippian 5183 0.063 98 431 Subtotal 431 Blackstone Beaverhill Lake 6 557 0.107 98 934 Subtotal 934 Brazeau River Mississippian 1 907 0.011 99 27 Niskuc - - - 1 166 Subtotal 1 193 Burmis Mississippian 7 191 0.09 99 871 Wabamun 433 0.115 99 67 Subtotal 938 Caroline Mississippian 1 241 0.012 99 20 Leduc 140 0.068 100c 13 Beaverhill Lake 26 050 0.365 100c 12 889 Subtotal 12 922 Coleman Mississippian 1 437 0.257 99 495 Wabamun 490 0.280 99 184 Subtotal 679 Crossfield Mannville 1 293 0.009 98 16 Mississippian 1 926 0.005 99 12 Wabamun 3 664 0.312 98 1 517 Subtotal 1 545 Crossfield East Mannville 238 0.003 98 1 Wabamun 771 0.347 99 359 Subtotal 360 Gold Creek Mississippian 94 0.016 98 2 Wabamun 4 923 0.087 98 567 Subtotal 569 Hanlan Winterburn 207 0.051 98 14 Beaverhill Lake 11 082 0.091 99 1 353 Subtotal 1 367 Jumping Pound West Mississippian 10 762 0.062 97 873 Subtotal 873 (continued)
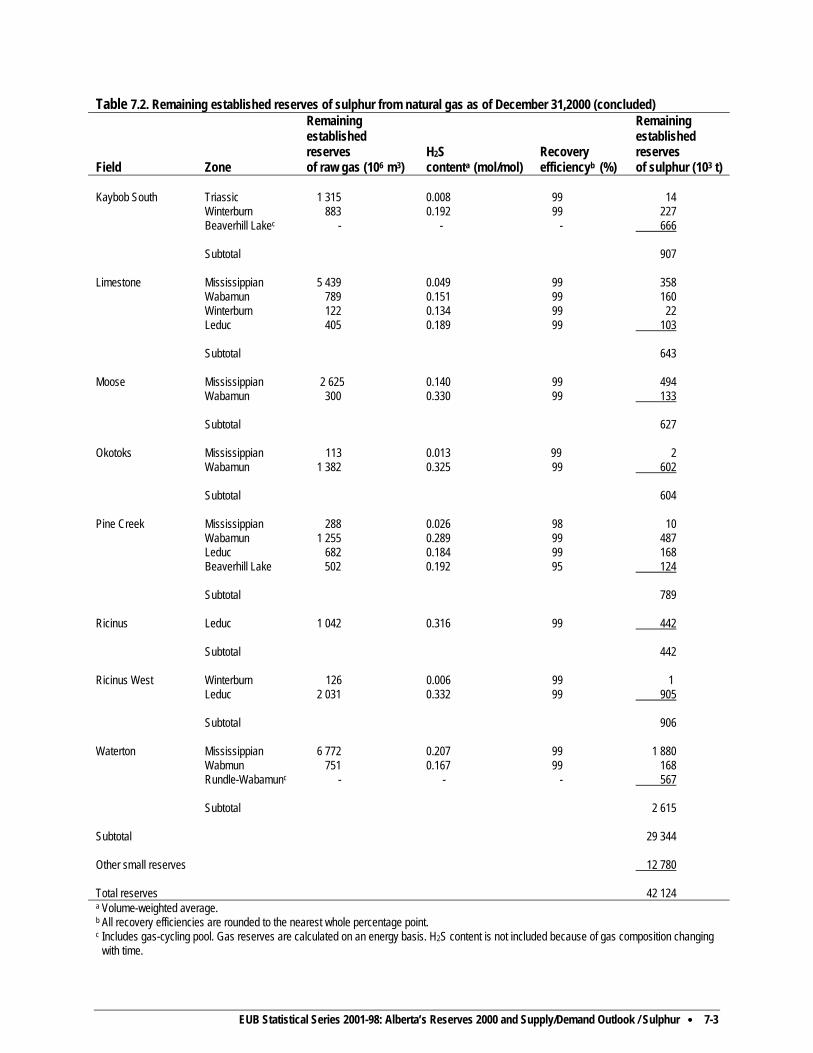
EUB Statistical Series 2001-98: Alberta’s Reserves 2000 and Supply/Demand Outlook / Sulphur •••• 7-3
Table 7.2. Remaining established reserves of sulphur from natural gas as of December 31,2000 (concluded) Field
Zone
Remaining established reserves of raw gas (106 m3)
H2S contenta (mol/mol)
Recovery efficiencyb (%)
Remaining established reserves of sulphur (103 t)
Kaybob South Triassic 1 315 0.008 99 14 Winterburn 883 0.192 99 227 Beaverhill Lakec - - - 666 Subtotal 907 Limestone Mississippian 5 439 0.049 99 358 Wabamun 789 0.151 99 160 Winterburn 122 0.134 99 22 Leduc 405 0.189 99 103 Subtotal 643 Moose Mississippian 2 625 0.140 99 494 Wabamun 300 0.330 99 133 Subtotal 627 Okotoks Mississippian 113 0.013 99 2 Wabamun 1 382 0.325 99 602 Subtotal 604 Pine Creek Mississippian 288 0.026 98 10 Wabamun 1 255 0.289 99 487 Leduc 682 0.184 99 168 Beaverhill Lake 502 0.192 95 124 Subtotal 789 Ricinus Leduc 1 042 0.316 99 442 Subtotal 442 Ricinus West Winterburn 126 0.006 99 1 Leduc 2 031 0.332 99 905 Subtotal 906 Waterton Mississippian 6 772 0.207 99 1 880 Wabmun 751 0.167 99 168 Rundle-Wabamunc - - - 567 Subtotal 2 615 Subtotal 29 344 Other small reserves 12 780 Total reserves 42 124 a Volume-weighted average. b All recovery efficiencies are rounded to the nearest whole percentage point. c Includes gas-cycling pool. Gas reserves are calculated on an energy basis. H2S content is not included because of gas composition changing
with time.

7-4 • EUB Statistical Series 2001-98: Alberta’s Reserves 2000 and Supply/Demand Outlook / Sulphur
individually and those containing less are grouped under other small reserves. For historical reasons, some fields now containing less than 800 103 t of recoverable sulphur have also been included in this table. Sulphur reserves declined most notably in the Burmis, Caroline, and Coleman fields as a result of production. 7.1.3 Sulphur from Crude Bitumen Crude bitumen in oil sands deposits contains significant amounts of sulphur. As a result of current upgrading operations in which bitumen is converted to synthetic crude oil, an average of 90 per cent of the sulphur contained in the crude bitumen is either recovered in the form of elemental sulphur or remains in products including coke. It is currently estimated that some 211 106 t of elemental sulphur will be recoverable from the 5.2 billion cubic metres (109 m3) of remaining established crude bitumen reserves in the surface-mineable area. These sulphur reserves were estimated by multiplying the remaining established reserves of crude bitumen by a factor of 40.5 t/1000 m3 of crude bitumen. In 1989, this ratio was revised from previous estimates to reflect both current operations and the expected use of high-conversion hydrogen-addition upgrading technologies for the future development of surface-mineable crude bitumen reserves. Hydrogen-addition technology yields a higher elemental sulphur production than does an alternative carbon-rejection technology, since a larger percentage of the sulphur in the bitumen remains in upgrading residues, as opposed to being converted to H2S. 7.1.4 Sulphur from Crude Bitumen Reserves under Active Development Only a portion of the surface-mineable established crude bitumen reserves is under active development at the approved Suncor, Syncrude, and Albian Sands projects. The EUB has estimated the initial established sulphur reserves from these projects to be 67.7 106 t. A total of 11.8 106 t of elemental sulphur has been produced from these projects, leaving a remaining established reserve of 55.9 106 t. During 2000, 0.7 106 t of elemental sulphur were produced at the Suncor and Syncrude projects; the Albian Sands project is still to come on stream.
7.2 Supply of and Demand for Sulphur
7.2.1 Sulphur Supply
There are three sources of sulphur production in Alberta: processing of sour natural gas, upgrading of bitumen to synthetic crude oil (SCO), and refining of crude oil into refined petroleum products. In 2000, Alberta produced 7.4 106 t of sulphur, of which 6.7 106 t was derived from sour gas, 0.7 106 t from upgrading of bitumen to SCO, and just 16 103 t from oil refining. Output of sulphur from both sour gas and oil sands upgrading, depicted in Figure 7.1, is expected to expand considerably over the forecast period, reaching 9.3 106 t and 2.4 106 t respectively by 2010. No significant change is expected in sulphur recovery at refineries. The EUB recognizes sulphur reserves associated with reserves of both sour gas and mineable bitumen, but none associated with sour oil, as most of the sour oil produced in Alberta leaves the province without removal of sulphur.

EUB Statistical Series 2001-98: Alberta’s Reserves 2000 and Supply/Demand Outlook / Sulphur •••• 7-5
7.2.2 Sulphur Demand Demand for sulphur within the province in 2000 was only about 0.6 106 t. It was used in production of phosphate fertilizer and kraft pulp and in other chemical operations. The remaining 90 per cent of the sulphur shipped by Alberta producers goes to markets outside the province, primarily to Florida, Asia, and North Africa. In the early 1990s, a number of traditionally sulphur-importing countries installed sulphur-recovery equipment in oil refineries and other sulphur-emitting facilities, largely for environmental reasons. Consequently many of these countries became self-sufficient in sulphur and its price declined significantly. Under such low-price conditions, many of Alberta’s competitors ceased production of sulphur, enabling Alberta’s market share to rise throughout the late 1990s. Demand for Alberta sulphur, both domestic and export, is expected to rise slowly, levelling off at 7.5 megatonnes yearly. 7.2.3 Imbalances between Sulphur Supply and Demand Because elemental sulphur (in contrast to sulphuric acid and the energy resources described in this document) is fairly easy to store, imbalances between production and disposition have traditionally been accommodated through net additions to or removals from sulphur stockpiles. If demand exceeds supply, as was the case over the period 1985-1991, sulphur is withdrawn from stockpiles; if supply exceeds demand, as has been the case since 1992, sulphur is added to stockpiles.
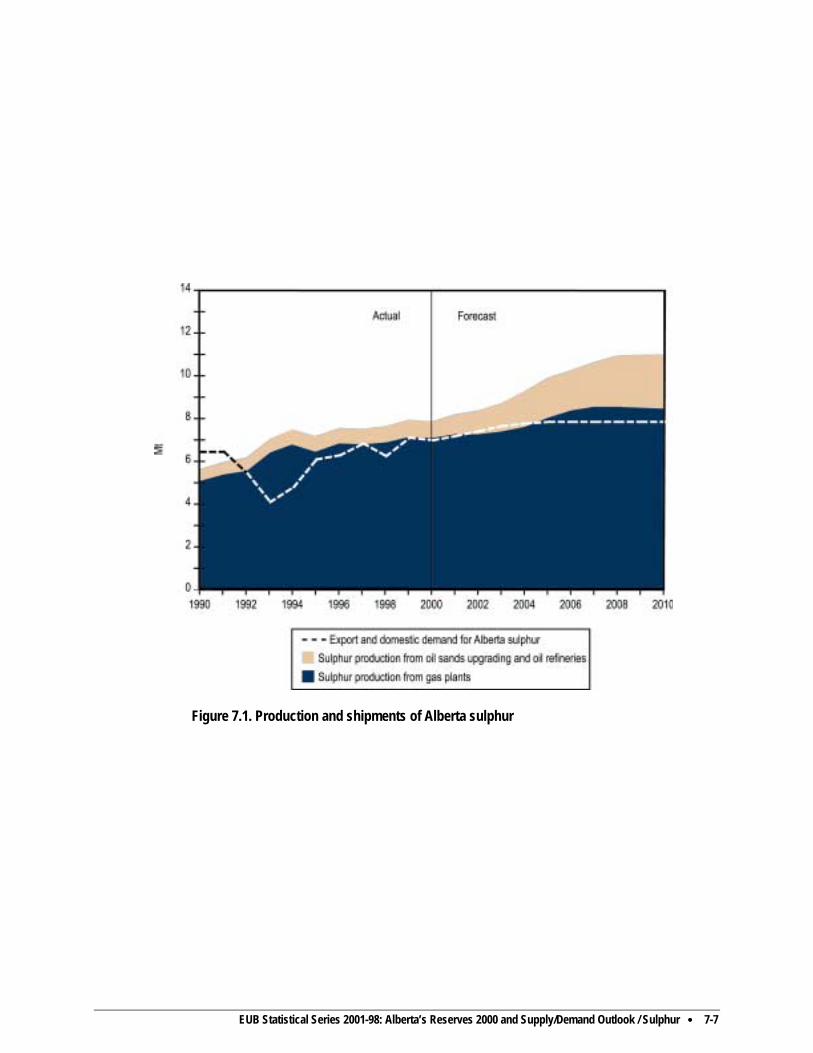
EUB Statistical Series 2001-98: Alberta’s Reserves 2000 and Supply/Demand Outlook / Sulphur •••• 7-7
Figure 7.1. Production and shipments of Alberta sulphur
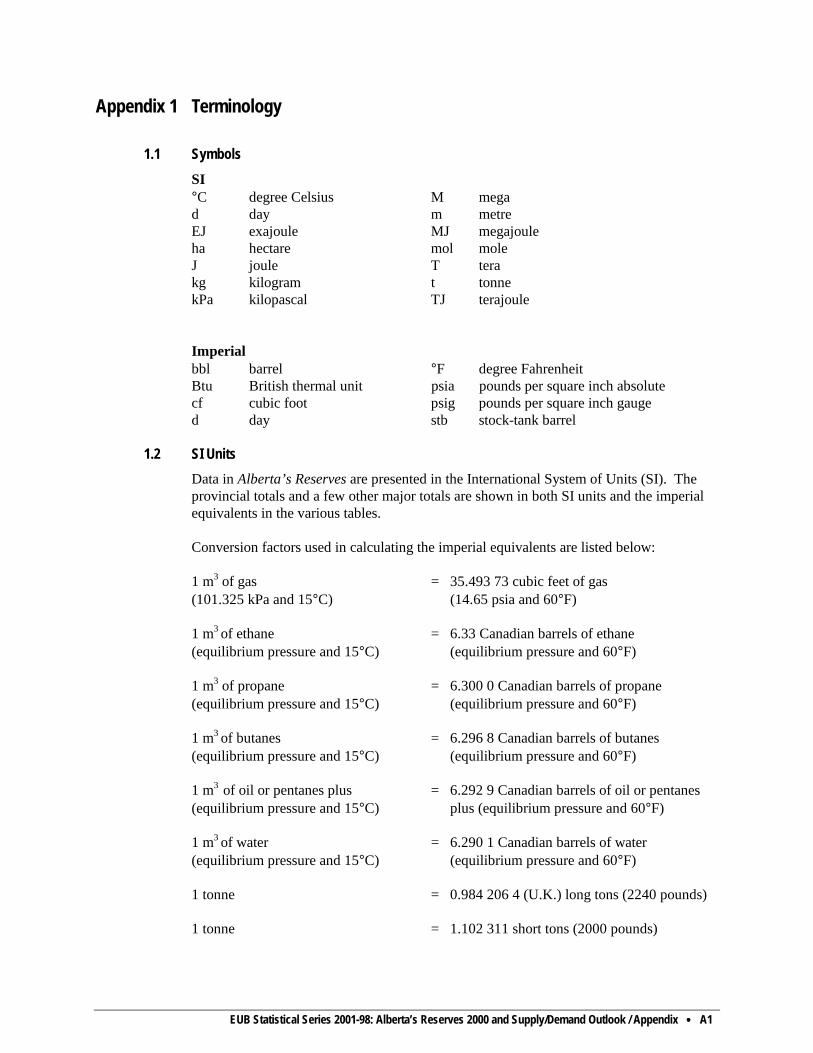
EUB Statistical Series 2001-98: Alberta’s Reserves 2000 and Supply/Demand Outlook / Appendix •••• A1
Appendix 1 Terminology 1.1 Symbols
SI °C degree Celsius M mega d day m metre EJ exajoule MJ megajoule ha hectare mol mole J joule T tera kg kilogram t tonne kPa kilopascal TJ terajoule Imperial bbl barrel °F degree Fahrenheit Btu British thermal unit psia pounds per square inch absolute cf cubic foot psig pounds per square inch gauge d day stb stock-tank barrel
1.2 SI Units
Data in Alberta’s Reserves are presented in the International System of Units (SI). The provincial totals and a few other major totals are shown in both SI units and the imperial equivalents in the various tables. Conversion factors used in calculating the imperial equivalents are listed below: 1 m3 of gas = 35.493 73 cubic feet of gas (101.325 kPa and 15°C) (14.65 psia and 60°F) 1 m3 of ethane = 6.33 Canadian barrels of ethane (equilibrium pressure and 15°C) (equilibrium pressure and 60°F) 1 m3 of propane = 6.300 0 Canadian barrels of propane (equilibrium pressure and 15°C) (equilibrium pressure and 60°F) 1 m3 of butanes = 6.296 8 Canadian barrels of butanes (equilibrium pressure and 15°C) (equilibrium pressure and 60°F) 1 m3 of oil or pentanes plus = 6.292 9 Canadian barrels of oil or pentanes (equilibrium pressure and 15°C) plus (equilibrium pressure and 60°F) 1 m3 of water = 6.290 1 Canadian barrels of water (equilibrium pressure and 15°C) (equilibrium pressure and 60°F) 1 tonne = 0.984 206 4 (U.K.) long tons (2240 pounds)
1 tonne = 1.102 311 short tons (2000 pounds)
A2 •••• EUB Statistical Series 2001-98: Alberta’s Reserves 2000 and Supply/Demand Outlook / Appendix
1 kilojoule = 0.948 213 3 British thermal units (Btu as defined in the federal Gas Inspection Act (60°-61°F))
This report uses SI prefixes throughout. A reference table is provided below. Term Value Scientific notation kilo thousand 103
mega million 106 giga billion 109 tera thousand billion 1012 peta million billion 1015 exa billion billion 1018
1.3 Reserves Terminology
The reserves terminology used in this report applies to all fossil energy resources (including coal) and is as follows: Initial Volume in-Place: The volume of crude oil, crude bitumen, or raw natural gas calculated or interpreted to exist in a reservoir before any volume has been produced. Established Reserves: Those reserves recoverable under current technology and present and anticipated economic conditions specifically proved by drilling, testing, or production, plus the portion of contiguous recoverable reserves that are interpreted to exist from geological, geophysical, or similar information with reasonable certainty. Initial Established Reserves: Established reserves prior to the deduction of any production. Remaining Established Reserves: Initial established reserves less cumulative production. Ultimate Potential: An estimate of the initial established reserves that will have been developed in an area by the time all exploratory and development activity has ceased, having regard for the geological prospects of that area and anticipated technology and economic conditions. Ultimate potential includes cumulative production, remaining established reserves, and future additions through extensions and revisions to existing pools and the discovery of new pools. Ultimate potential can be expressed by the following simple equation: Ultimate potential = initial established reserves + additions to existing pools + future discoveries. The above terminology and definitions were recommended by the Inter-Provincial Advisory Committee on Energy and adopted by the EUB.
1.4 Other Terminology Area The area used to determine the bulk rock volume of the oil-, crude
bitumen-, or gas-bearing reservoir, usually the area of the zero isopach or the assigned area of a pool or deposit.

EUB Statistical Series 2001-98: Alberta’s Reserves 2000 and Supply/Demand Outlook / Appendix •••• A3
Burner-tip The location where a fuel is used by a consumer. Butanes In addition to its normal scientific meaning, a mixture mainly of
butanes that ordinarily may contain some propane or pentanes plus (Oil and Gas Conservation Act, Section 1(1)(c.1)).
Coal-bed The naturally occurring dry, predominantly methane gas produced Methane during the transformation of organic matter into coal. Compressibility A correction factor for nonideal gas determined for gas from a pool at Factor its initial reservoir pressure and temperature and, where necessary, including factors to correct for acid gases.
Condensate A mixture mainly of pentanes and heavier hydrocarbons that may be
contaminated with sulphur compounds and is recovered or is recoverable at a well from an underground reservoir. It may be gaseous in its virgin reservoir state but is liquid at the conditions under which its volume is measured or estimated (Oil and Gas Conservation Act, Section 1(1)(d.1)).
Connected Gas wells that are tied into facilities through a pipeline. Wells Crude Bitumen A naturally occurring viscous mixture mainly of hydrocarbons heavier
than pentane that may contain sulphur compounds and that in its naturally occurring viscous state will not flow to a well (Oil Sands Conservation Act, Section 1(1)(f)).
Crude Oil A mixture mainly of pentanes and heavier hydrocarbons that may be (Conventional) contaminated with sulphur compounds and is recovered or is
recoverable at a well from an underground reservoir. It is liquid at the conditions under which its volume is measured or estimated and includes all other hydrocarbon mixtures so recovered or recoverable except raw gas, condensate, or crude bitumen (Oil and Gas Conservation Act, Section 1(1)(f.1)).
Crude Oil Crude oil is deemed to be heavy crude oil if it has a density of (Heavy) 900 kg/m3 or greater, but the EUB may classify crude oil otherwise
than in accordance with this criterion in a particular case, having regard to its market utilization and purchasers’ classification.
Crude Oil Crude oil is deemed to be light-medium crude oil if it has a density of (Light-Medium) less than 900 kg/m3, but the EUB may classify crude oil otherwise than
in accordance with this criterion in a particular case, having regard to its market utilization and purchasers’ classification.
Crude Oil A mixture mainly of pentanes and heavier hydrocarbons that may (Synthetic) contain sulphur compounds and is derived from crude bitumen. It is
liquid at the conditions under which its volume is measured or estimated and includes all other hydrocarbon mixtures so derived (Oil and Gas Conservation Act, Section 1(1)(t.1)).

A4 •••• EUB Statistical Series 2001-98: Alberta’s Reserves 2000 and Supply/Demand Outlook / Appendix
Datum Depth The approximate average depth relative to sea level of the midpoint of an oil or gas productive zone for the wells in a pool.
Decline Rate The annual rate of decline in well productivity. Deep-cut A gas plant adjacent to or within gas field plants that can Facilities extract ethane and other natural gas liquids using a turboexpander. Density The mass or amount of matter per unit volume. Density, Relative The density relative to air of raw gas upon discovery, determined by an (Raw Gas) analysis of a gas sample representative of a pool under atmospheric
conditions. Diluent Lighter viscosity petroleum products that are used to dilute crude
bitumen for transportation in pipelines.
Discovery Year The year when drilling was completed of the well in which the oil or gas pool was discovered.
Economic Ratio of waste (overburden material that covers mineable ore) to Strip Ratio ore (in this report refers to coal or oil sands) used to define an
economic limit below which it is economical to remove the overburden to recover the ore.
Ethane In addition to its normal scientific meaning, a mixture mainly of ethane
that ordinarily may contain some methane or propane (Oil and Gas Conservation Act, Section 1(1)(h.1)).
Extraction The process of liberating hydrocarbons (propane, bitumen) from their
source (raw gas, mined oil sands). Feedstock In this report feedstock refers to raw material supplied to a refinery, oil
sands upgrader, or petrochemical plant.
Field Plant A natural gas facility that processes raw gas and is located near the source of the gas, upstream of the pipelines that move the gas to markets. These plants remove impurities, such as water and hydrogen sulfide, and may also extract natural gas liquids from the raw gas stream.
Field Plant Gate The point at which the gas exits the field plant and enters the pipeline.
Fractionation A processing facility that takes a natural gas liquids stream Plant and separates out the component parts as specification products.
Frontier Gas In this report this refers to gas produced from areas of northern and
offshore Canada.
EUB Statistical Series 2001-98: Alberta’s Reserves 2000 and Supply/Demand Outlook / Appendix •••• A5
Gas Raw gas, marketable gas, or any constituent of raw gas, condensate, crude bitumen, or crude oil that is recovered in processing and is gaseous at the conditions under which its volume is measured or estimated (Oil and Gas Conservation Act, Section 1(1)(j.1)).
Gas Gas in a free state in communication in a reservoir with crude oil under (Associated) initial reservoir conditions.
Gas A mixture mainly of methane originating from raw gas, or if necessary (Marketable) from the processing of the raw gas for the removal or partial removal
of some constituents, and that meets specifications for use as a domestic, commercial, or industrial fuel or as an industrial raw material (Oil and Gas Conservation Act, Section 1(1)(m)).
Gas The equivalent volume of marketable gas at standard conditions. (Marketable at 101.325 kPa and 15°°°°C)
Gas Gas that is not in communication in a reservoir with an accumulation (Nonassociated) liquid hydrocarbons at initial reservoir conditions. Gas A mixture containing methane, other paraffinic hydrocarbons, (Raw) nitrogen, carbon dioxide, hydrogen sulphide, helium, and minor
impurities, or some of these components, that is recovered or is recoverable at a well from an underground reservoir and is gaseous at the conditions under which its volume is measured or estimated (Oil and Gas Conservation Act, Section 1(1)(s.1)).
Gas Gas that is dissolved in crude oil under reservoir conditions and (Solution ) evolves as a result of pressure and temperature changes.
Gas-Oil Ratio The volume of gas (in cubic metres, measured under standard (Initial Solution) conditions) contained in one stock-tank cubic metre of oil under initial
reservoir conditions.
Good Production Production from oil pools at a rate Practice (i) not governed by a base allowable, but (GPP) (ii) limited to what can be produced without adversely and
significantly affecting conservation, the prevention of waste, or the opportunity of each owner in the pool to obtain its share of the production (Oil and Gas Conservation Regulation 1.020(2)9).
This practice is authorized by the EUB either to improve the economics of production from a pool and thus defer its abandonment or to avoid unnecessary administrative expense associated with regulation or production restrictions where this serves little or no purpose.
Gross Heating The heat liberated by burning moisture-free gas at standard Value (of conditions and condensing the water vapour to a liquid state. Dry Gas)
A6 •••• EUB Statistical Series 2001-98: Alberta’s Reserves 2000 and Supply/Demand Outlook / Appendix
Maximum Day The operating day rate for gas wells when they are first placed
Rate on production. The estimation of the maximum day rate requires the average hourly production rate. For each well, the annual production is divided by the hours that the well produced in that year to obtain the average hourly production for the year. This hourly rate is then multiplied by 24 hours to yield an estimate of a full-day operation of a well, which is referred to as maximum day rate.
Maximum The assumed maximum operational reach of underground coal Recoverable mining equipment in a single seam.
Thickness Mean Formation The approximate average depth below kelly bushing of the midpoint of Depth an oil or gas productive zone for the wells in a pool. Methane In addition to its normal scientific meaning, a mixture mainly of
methane that ordinarily may contain some ethane, nitrogen, helium, or carbon dioxide (Oil and Gas Conservation Act, Section 1(1)(m.1)).
Natural Gas Propane, butanes, pentanes plus, or a combination of these obtained Liquids from the processing of raw gas or condensate (Oil and Gas
Conservation Act, Section 1(1)(n)). Off-gas Natural gas that is produced from the bitumen production in the oil
sands. This gas is typically rich in natural gas liquids and olefins. Oil Condensate, crude oil, or a constituent of raw gas, condensate, or
crude oil that is recovered in processing and is liquid at the conditions under which its volume is measured or estimated (Oil and Gas Conservation Act, Section 1(1)(n.1)).
Oil Sands (i) sands and other rock materials containing crude bitumen, (ii) the crude bitumen contained in those sands and other rock
materials, and (iii) any other mineral substances other than natural gas in association
with that crude bitumen or those sands and other rock materials referred to in subclauses (i) and (ii) (Oil Sands Conservation Act, Section l(l)(o)).
Oil Sands A natural reservoir containing or appearing to contain an Deposit accumulation of oil sands separated or appearing to be separated from
any other such accumulation (Oil and Gas Conservation Act, Section 1(1)(o.1)).
Overburden In this report overburden is a mining term related to the thickness of
material above a mineable occurrence of coal or bitumen. Pay Thickness The bulk rock volume of a reservoir of oil, oil sands, or gas divided by (Average) its area.
EUB Statistical Series 2001-98: Alberta’s Reserves 2000 and Supply/Demand Outlook / Appendix •••• A7
Pentanes Plus A mixture mainly of pentanes and heavier hydrocarbons that ordinarily may contain some butanes and is obtained from the processing of raw gas, condensate, or crude oil (Oil and Gas Conservation Act, Section 1(1)(p)).
Pool A natural underground reservoir containing or appearing to contain an
accumulation of oil or gas or both separated or appearing to be separated from any other such accumulation (Oil and Gas Conservation Act, Section 1(1)(q)).
Porosity The effective pore space of the rock volume determined from core
analysis and well log data measured as a fraction of rock volume. Pressure The reservoir pressure at the reference elevation of a pool upon (Initial) discovery. Propane In addition to its normal scientific meaning, a mixture mainly of
propane that ordinarily may contain some ethane or butanes (Oil and Gas Conservation Act, Section 1(1)(s)).
Recovery The increased recovery from a pool achieved by artificial means or by (Enhanced) the application of energy extrinsic to the pool. The artificial means or
application includes pressuring, cycling, pressure maintenance, or injection to the pool of a substance or form of energy but does not include the injection in a well of a substance or form of energy for the sole purpose of
(i) aiding in the lifting of fluids in the well, or (ii) stimulation of the reservoir at or near the well by mechanical,
chemical, thermal or explosive means (Oil and Gas Conservation Act, Section 1(1)(h)).
Recovery In gas pools, the fraction of the in-place reserves of gas expected to be (Pool) recovered under the subsisting recovery mechanism. Recovery Recovery of oil by natural depletion processes only measured as a (Primary) volume thus recovered or as a fraction of the in-place oil. Refined End products in the refining process.
Petroleum Products
Refinery Light oil products produced at a refinery; includes gasoline and Light Ends aviation fuel.
Reprocessing A gas processing plant used to extract ethane and natural gas Facilities liquids from marketable natural gas. Such facilities, also referred to as
straddle plants, are located on major natural gas transmission lines.
Retrograde Gas pools that have a dew point such that natural gas liquids Condensate will condense out of solution with a drop in reservoir pressure. Pools To limit liquid dropout in the reservoir, dry gas is reinjected to
maintain reservoir pressure.
A8 •••• EUB Statistical Series 2001-98: Alberta’s Reserves 2000 and Supply/Demand Outlook / Appendix
Rich Gas Natural gas that contains a relatively high concentration of natural gas
liquids.
Sales Gas A volume of gas transacted in a time period. This gas may be augmented with gas from storage.
Saturation The fraction of pore space in the reservoir rock occupied by gas upon (Gas) discovery. Saturation The fraction of pore space in the reservoir rock occupied by water (Water) upon discovery. Shrinkage Factor The volume occupied by one cubic metre of oil from a pool measured (Initial) at standard conditions after flash gas liberation consistent with the
surface separation process and divided by the volume occupied by the same oil and gas at the pressure and temperature of a pool upon discovery.
Solvent A suitable mixture of hydrocarbons ranging from methane to pentanes
plus but consisting largely of methane, ethane, propane, and butanes for use in enhanced-recovery operations.
Specification A crude oil or refined petroleum product with defined properties. Product
Sterilization The rendering of otherwise definable economic ore as unrecoverable.
Surface Loss A summation of the fractions of recoverable gas that is removed as
acid gas and liquid hydrocarbons and is used as lease or plant fuel or is flared.
Temperature The initial reservoir temperature upon discovery at the reference
elevation of a pool. Upgrading The process that converts bitumen and heavy crude oil into a product
with a density and viscosity similar to light crude oil. Zone Any stratum or sequence of strata that is designated by the EUB as a
zone (Oil and Gas Conservation Act, Section 1(1)(z)).
1.5 Standard Conditions of Gas Measurement Volumes of gas are given as at a standard pressure and temperature of 101.325 kPa and 15°C respectively.
1.6 Abbreviations General Report
EOR enhanced oil recovery GIP gas in place GPP good production practice
EUB Statistical Series 2001-98: Alberta’s Reserves 2000 and Supply/Demand Outlook / Appendix •••• A9
MU commingling order RPP refined petroleum products RF recovery factor RGE range SCO synthetic crude oil SF solvent flood STP standard temperature and pressure TWP township WF waterflood WM west of a certain meridian
Computer Printout ABAND abandoned ADMIN 2 Administrative Area No. 2 ASSOC associated gas BDY boundary BELL Belloy BER beyond economic reach BLAIR Blairmore BLSKY OR BLSK Bluesky BLUE Blueridge BNFF Banff BOW ISL or BI Bow Island BR Belly River BSL COLO Basal Colorado BSL MANN, BMNV or BMN Basal Mannville BSL QTZ Basal Quartz CADM or CDN Cadomin CARD Cardium CDOT Cadotte CH LK Charlie Lake CLWTR Clearwater CLY or COL Colony CMRS Camrose COMP compressibility DBLT Debolt DETR Detrital DISC YEAR discovery year ELRSL, ELERS or ELRS Ellerslie ELTN or ELK Elkton ERSO enhanced-recovery scheme is in operation but no
additional established reserves are attributed FALH Falher FRAC fraction GEN PETE or GEN PET General Petroleum GETH or GET Gething GLAUC or GLC Glauconitic GLWD Gilwood GOR gas-oil ratio GRD RAP or GRD RP Grand Rapids GROSS HEAT VALUE gross heating value GSMT Grosmont
A10 •••• EUB Statistical Series 2001-98: Alberta’s Reserves 2000 and Supply/Demand Outlook / Appendix
ha hectare HFWY Halfway INJ injected I.S. integrated scheme JUR or J Jurassic KB kelly bushing KISK Kiskatinaw KR Keg River LED Leduc LF load factor LIV Livingston LLOYD Lloydminster LMNV, LMN or LM Lower Mannville LOC EX PROJECT local experimental project LOC U local utility LOW or L lower LUSC Luscar MANN or MN Mannville MCM McMurray MED HAT Medicine Hat MID or M middle MILK RIV Milk River MOP maximum operating pressure MSKG Muskeg MSL mean sea level NGL natural gas liquids NIKA Nikanassin NIS Nisku NO. number NON-ASSOC non-associated gas NORD Nordegg NOTIK, NOTI or NOT Notikewin OST Ostracod PALL Palliser PEK Pekisko PM-PN SYS Permo-Penn System RF recovery factor RK CK Rock Creek RUND or RUN Rundle SA strike area SATN saturation SD sandstone SE ALTA GAS SYS (MU) Southeastern Alberta Gas System - commingled SG gas saturation SHUN Shunda SL surface loss SL PT Slave Point SOLN solution gas SPKY Sparky ST. ED St. Edouard SULPT Sulphur Point SUSP suspended
EUB Statistical Series 2001-98: Alberta’s Reserves 2000 and Supply/Demand Outlook / Appendix •••• A11
SW water saturation SW HL Swan Hills TEMP temperature TOT total TV Turner Valley TVD true vertical depth UIRE Upper Ireton UMNV, UMN or UM Upper Mannville UP or U upper VIK or VK Viking VOL volume WAB Wabamun WBSK Wabiskaw WINT Winterburn WTR DISP water disposal WTR INJ water injection 1ST WHITE SPKS OR 1WS First White Specks 2WS Second White Specks
Company Names AEC Alberta Energy Company Ltd. AEL Anderson Exploration Ltd. ALTAGAS AltaGas Marketing Inc. ALTROAN Altana Exploration Company/Roan Resources
Ltd. AMOCO Amoco Canada Petroleum Company Ltd. APACHE Apache Canada Ltd. BARRING Barrington Petroleum Ltd. BEAU Beau Canada Exploration Ltd. BLUERGE Blue Range Resource Corporation CAN88 Canadian 88 Energy Corp. CANOR Canor Energy Ltd. CANOXY Canadian Occidental Petroleum Ltd. CANST Canstates Gas Marketing CDNFRST Canadian Forest Oil Ltd. CENTRA Centra Gas Alberta Inc. CGGS Canadian Gas Gathering Systems Inc. CHEL Canadian Hunter Exploration Ltd. CHEVRON Chevron Canada Resources CMG Canadian-Montana Gas Company Limited CNRL Canadian Natural Resources Limited CNWE Canada Northwest Energy Limited CONOCO Conoco Canada Limited CRESTAR Crestar Energy Inc. CTYMEDH City of Medicine Hat CWNG Canadian Western Natural Gas Company
Limited and Northwestern Utilities Limited DART Dartmouth Power Associates Limited
Partnership DIRECT Direct Energy Marketing Limited DUKE Duke Energy Marketing Limited Partnership DYNALTA Dynalta Energy Corporation

A12 •••• EUB Statistical Series 2001-98: Alberta’s Reserves 2000 and Supply/Demand Outlook / Appendix
ENCAL Encal Energy Ltd. ENGAGE Engage Energy Canada, L.P. ENRMARK EnerMark Inc. GARDNER Gardiner Oil and Gas Limited GULF Gulf Canada Resources Limited HUSKY Husky Oil Ltd. IOL Imperial Oil Resources Limited LOMALTA Lomalta Petroleums Ltd. MARTHON Marathon International Petroleum Canada, Ltd. METGAZ Metro Gaz Marketing MOBIL Mobil Oil Canada NOVERGZ Novergaz NRTHSTR Northstar Energy Corporation PANALTA Pan-Alberta Gas Ltd. PANCDN PanCanadian Petroleum Limited PARAMNT Paramount Resources Ltd. PAWTUCK Pawtucket Power Associates Limited Partnership PCOG Petro-Canada Oil and Gas PENWEST Penn West Petroleum Ltd. PETRMET Petromet PIONEER Pioneer Natural Resources Canada Ltd. POCO Poco Petroleums Ltd. PROGAS ProGas Limited QUEBEC 3091-9070 Quebec RANGER Ranger Oil Limited RENENER Renaissance Energy Ltd. RIFE Rife Resources Ltd. RIOALTO Rio Alta Exploration Ltd. SASKEN SaskEnergy Incorporated SHELL Shell Canada Limited SHERRIT Sherritt Inc. SIMPLOT Simplot Canada Limited SUMMIT Summit Resources Limited SUNCOR Suncor Energy Inc. (Oil Sands Group) SYNCRUDE Syncrude Canada Ltd. TALISMA Talisman Energy Inc. TCPL TransCanada PipeLines Limited ULSTER Ulster Petroleums Ltd. UNPACF Union Pacific Resources Inc. WAINOCO Wainoco Oil Corporation WASCANA Wascana Energy Inc.
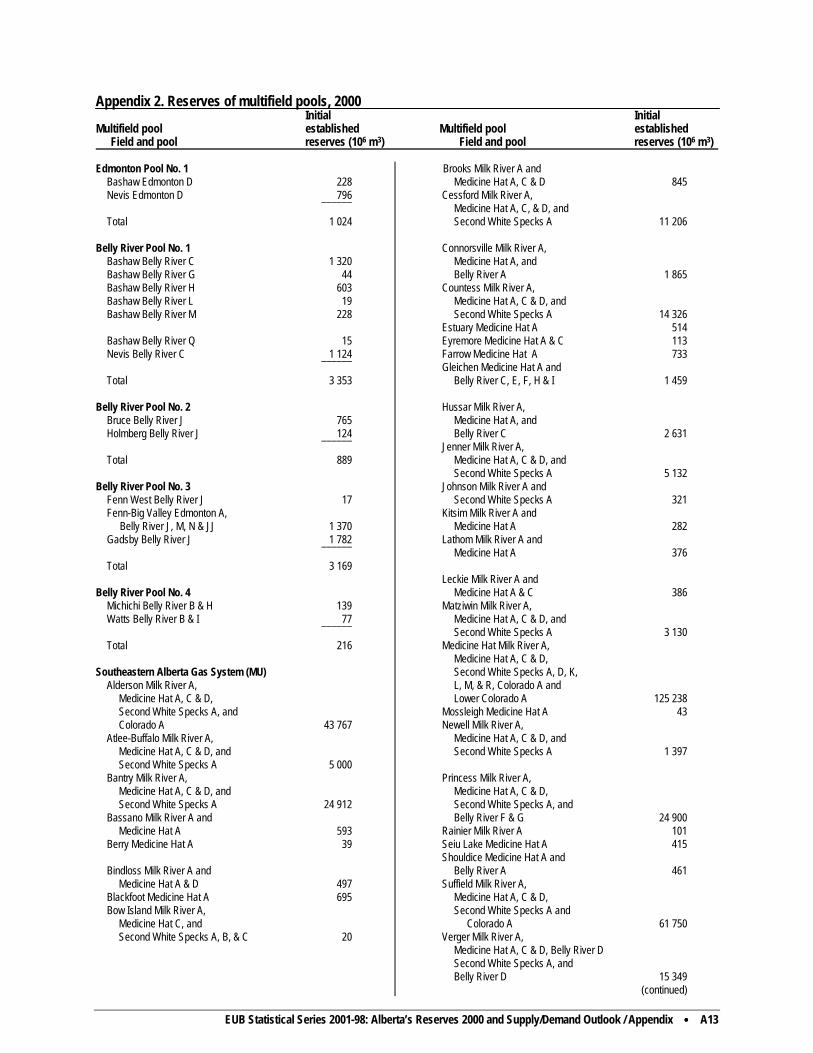
EUB Statistical Series 2001-98: Alberta’s Reserves 2000 and Supply/Demand Outlook / Appendix •••• A13
Appendix 2. Reserves of multifield pools, 2000 Initial Initial Multifield pool established Multifield pool established Field and pool reserves (106 m3) Field and pool reserves (106 m3) Edmonton Pool No. 1
Bashaw Edmonton D 228 Nevis Edmonton D 796 ______
Total 1 024 Belly River Pool No. 1
Bashaw Belly River C 1 320 Bashaw Belly River G 44 Bashaw Belly River H 603 Bashaw Belly River L 19 Bashaw Belly River M 228 Bashaw Belly River Q 15 Nevis Belly River C 1 124 ______
Total 3 353 Belly River Pool No. 2
Bruce Belly River J 765 Holmberg Belly River J 124 ______
Total 889 Belly River Pool No. 3
Fenn West Belly River J 17 Fenn-Big Valley Edmonton A, Belly River J, M, N & JJ 1 370 Gadsby Belly River J 1 782 ______
Total 3 169 Belly River Pool No. 4
Michichi Belly River B & H 139 Watts Belly River B & I 77 ______
Total 216 Southeastern Alberta Gas System (MU)
Alderson Milk River A, Medicine Hat A, C & D, Second White Specks A, and Colorado A 43 767
Atlee-Buffalo Milk River A, Medicine Hat A, C & D, and Second White Specks A 5 000
Bantry Milk River A, Medicine Hat A, C & D, and Second White Specks A 24 912
Bassano Milk River A and Medicine Hat A 593 Berry Medicine Hat A 39 Bindloss Milk River A and
Medicine Hat A & D 497 Blackfoot Medicine Hat A 695 Bow Island Milk River A,
Medicine Hat C, and Second White Specks A, B, & C 20
Brooks Milk River A and Medicine Hat A, C & D 845
Cessford Milk River A, Medicine Hat A, C, & D, and Second White Specks A 11 206
Connorsville Milk River A,
Medicine Hat A, and Belly River A 1 865
Countess Milk River A, Medicine Hat A, C & D, and Second White Specks A 14 326
Estuary Medicine Hat A 514 Eyremore Medicine Hat A & C 113 Farrow Medicine Hat A 733 Gleichen Medicine Hat A and
Belly River C, E, F, H & I 1 459
Hussar Milk River A, Medicine Hat A, and Belly River C 2 631
Jenner Milk River A, Medicine Hat A, C & D, and Second White Specks A 5 132
Johnson Milk River A and Second White Specks A 321
Kitsim Milk River A and Medicine Hat A 282
Lathom Milk River A and Medicine Hat A 376
Leckie Milk River A and
Medicine Hat A & C 386 Matziwin Milk River A,
Medicine Hat A, C & D, and Second White Specks A 3 130
Medicine Hat Milk River A, Medicine Hat A, C & D, Second White Specks A, D, K, L, M, & R, Colorado A and Lower Colorado A 125 238
Mossleigh Medicine Hat A 43 Newell Milk River A,
Medicine Hat A, C & D, and Second White Specks A 1 397
Princess Milk River A,
Medicine Hat A, C & D, Second White Specks A, and Belly River F & G 24 900
Rainier Milk River A 101 Seiu Lake Medicine Hat A 415 Shouldice Medicine Hat A and
Belly River A 461 Suffield Milk River A, Medicine Hat A, C & D, Second White Specks A and Colorado A 61 750 Verger Milk River A,
Medicine Hat A, C & D, Belly River D Second White Specks A, and Belly River D 15 349 (continued)

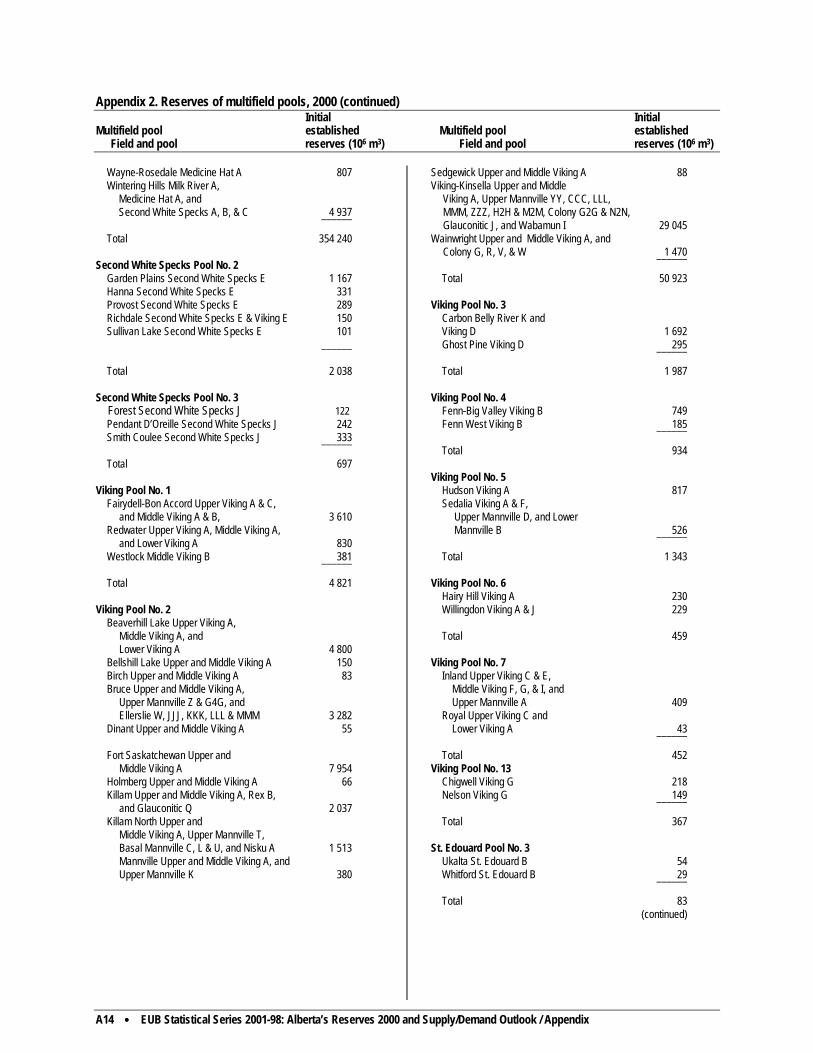
A14 •••• EUB Statistical Series 2001-98: Alberta’s Reserves 2000 and Supply/Demand Outlook / Appendix
Appendix 2. Reserves of multifield pools, 2000 (continued) Initial Initial Multifield pool established Multifield pool established Field and pool reserves (106 m3) Field and pool reserves (106 m3)
Wayne-Rosedale Medicine Hat A 807 Wintering Hills Milk River A,
Medicine Hat A, and Second White Specks A, B, & C 4 937 ______
Total 354 240 Second White Specks Pool No. 2
Garden Plains Second White Specks E 1 167 Hanna Second White Specks E 331 Provost Second White Specks E 289 Richdale Second White Specks E & Viking E 150 Sullivan Lake Second White Specks E 101
______ Total 2 038
Second White Specks Pool No. 3 Forest Second White Specks J 122
Pendant D’Oreille Second White Specks J 242 Smith Coulee Second White Specks J 333 ______
Total 697 Viking Pool No. 1
Fairydell-Bon Accord Upper Viking A & C, and Middle Viking A & B, 3 610
Redwater Upper Viking A, Middle Viking A, and Lower Viking A 830
Westlock Middle Viking B 381 ______
Total 4 821 Viking Pool No. 2
Beaverhill Lake Upper Viking A, Middle Viking A, and Lower Viking A 4 800
Bellshill Lake Upper and Middle Viking A 150 Birch Upper and Middle Viking A 83 Bruce Upper and Middle Viking A,
Upper Mannville Z & G4G, and Ellerslie W, JJJ, KKK, LLL & MMM 3 282
Dinant Upper and Middle Viking A 55
Fort Saskatchewan Upper and Middle Viking A 7 954
Holmberg Upper and Middle Viking A 66 Killam Upper and Middle Viking A, Rex B,
and Glauconitic Q 2 037 Killam North Upper and
Middle Viking A, Upper Mannville T, Basal Mannville C, L & U, and Nisku A 1 513
Mannville Upper and Middle Viking A, and Upper Mannville K 380
Sedgewick Upper and Middle Viking A 88 Viking-Kinsella Upper and Middle
Viking A, Upper Mannville YY, CCC, LLL, MMM, ZZZ, H2H & M2M, Colony G2G & N2N, Glauconitic J, and Wabamun I 29 045
Wainwright Upper and Middle Viking A, and Colony G, R, V, & W 1 470 ______
Total 50 923
Viking Pool No. 3 Carbon Belly River K and Viking D 1 692 Ghost Pine Viking D 295 ______
Total 1 987 Viking Pool No. 4
Fenn-Big Valley Viking B 749 Fenn West Viking B 185 ______
Total 934
Viking Pool No. 5 Hudson Viking A 817 Sedalia Viking A & F,
Upper Mannville D, and Lower Mannville B 526 ______
Total 1 343 Viking Pool No. 6
Hairy Hill Viking A 230 Willingdon Viking A & J 229
Total 459 Viking Pool No. 7
Inland Upper Viking C & E, Middle Viking F, G, & I, and Upper Mannville A 409
Royal Upper Viking C and Lower Viking A 43 ______
Total 452 Viking Pool No. 13
Chigwell Viking G 218 Nelson Viking G 149 ______
Total 367 St. Edouard Pool No. 3
Ukalta St. Edouard B 54 Whitford St. Edouard B 29 ______
Total 83 (continued)

EUB Statistical Series 2001-98: Alberta’s Reserves 2000 and Supply/Demand Outlook / Appendix •••• A15
Appendix 2. Reserves of multi-field pools, 2000 (concluded) Initial Initial Multifield pool established Multifield pool established Field and pool reserves (106 m3) Field and pool reserves (106 m3)
Glauconitic Pool No. 3 Bonnie Glen Glauconitic A and
Lower Mannville F 1 440 Ferrybank Glauconitic A 900 Ferrybank Lower Mannville W 97 ______
Total 2 437 Glauconitic Pool No. 5
Bigoray Glauconitic I 1 207 Bigoray Ostracod D 131 Pembina Glauconitic I & D and Ostracod C 3 348 ______
Total 4 686 Glauconitic Pool No. 6
Bassano Glauconitic III 432 Countess Bow Island MM and Glauconitic III 2 023 Hussar Viking L, Glauconitic III, and Ostracod OO 1 152 Wintering Hills Glauconitic III and
Lower Mannville W 17 ______
Total 3 624 Bluesky-Detrital-Debolt Pool No. 1
Cranberry Bluesky-Detrital-Debolt A 1 744 Hotchkiss Bluesky-Detrital-Debolt A 4 688 ______
Total 6 432 Gething Pool No. 1
Fox Creek Viking C, Notikewin C and Gething D & H 2 470
Kaybob South Gething H 518 ______
Total 2 988 Ellerslie Pool No. 1
Connorsville Glauconitic A 239 Connorsville Glauconitic B 23 Connorsville Glauconitic C 126 Connorsville Glauconitic E 103 Connorsville Glauconitic I 45
Connorsville Ellerslie A 2 867 Wintering Hills Upper Mannville A 25 Wintering Hills Ellerslie A 1993 ______
Total 5 421 Cadomin Pool No. 1
Elmworth Dunvegan A 366 Elmworth Dunvegan I 62 Elmworth Cadotte A 2 817 Elmworth Cadotte D 474 Elmworth Cadotte E 21 Elmworth Cadotte F 60 Elmworth Cadotte G 37 Elmworth Cadotte I 57 Elmworth Cadotte J 52 Elmworth Cadotte K 22
Elmworth Cadotte M 17 Elmworth Cadotte N 44 Elmworth Cadotte T 176 Elmworth Falher A-1 7 260 Elmworth Falher A-2 1 729
Elmworth Falher A-4 218 Elmworth Falher A-5 222 Elmworth Falher A-7 132 Elmworth Falher A-10 6 360 Elmworth Falher A-16 86 Elmworth Falher A-21 58 Elmworth Falher A-43 56 Elmworth Falher B-1 1 804 Elmworth Falher B-2 604 Elmworth Falher B-3 2 819 Elmworth Falher B-4 3 037 Elmworth Falher B-9 1 041 Elmworth Falher B-13 46 Elmworth Falher B-14 119 Elmworth Falher B-15 210 Elmworth Falher B-16 126
Elmworth Falher C-2 36 Elmworth Falher C-3 27 Elmworth Falher D-2 652 Elmworth Falher D-3 20 Elmworth Falher D-5 25 Elmworth Falher D-6 43 Elmworth Bluesky A 104 Elmworth Gething A 22 Elmworth Cadomin A 4 926 Sinclair Notikewin A, B, & C, Falher A and Cadomin A 2 816
______ Total 38 803
Halfway Pool No. 1 Valhalla Halfway B 4 572 Wembley Halfway B 4 133 ______
Total 8 705
Halfway Pool No. 2 Knopcik Halfway N 675 Valhalla Halfway N 115 ______
Total 790 Banff Pool No. 1
Haro Banff E 87 Rainbow South Banff E 59 ______
Total 146

Appendix 3. Remaining established reserves of natural gas liquids as of December 31, 2000
EUB Statistical Series 2001-98: Alberta’s Reserves 2000 and Supply/Demand Outlook / Appendix •••• A17
1 2 3 4 5 6 7 8 9 Liquid recovery ratio (m3/106 m3 of marketable gas)
Remaining established reserves of natural gas liquids (103 m3)
Field
Zone
Remaining reserves of marketable gas (106 m3)
Pentanes Propane Butanes plus
Pentanes Propane Butanes plus Total
Ansell Cardium 2 729 33 58 196 89 159 535 783 Viking 730 21 25 86 15 18 63 96 Mannville 1 413 25 19 69 35 27 97 159 Other 160 - 15 60 - 1 10 11 Subtotal 139 205 705 1 049 Bonnie Glen Mannville 342 88 53 44 30 18 15 63 Leduca 4 783 - - - 598 321 690 1 609 Subtotal 628 339 705 1 672 Brazeau River Belly River 1 958 104 50 66 204 98 129 431 Cardium 559 14 7 138 8 4 77 89 Mannville 1 610 63 32 302 102 51 487 640 Jurassic 2 393 153 81 310 366 194 743 1 303 Rundle 1 908 1 1 80 2 1 152 155 Winterburna 5 501 - - - 1471 837 2 291 4 599 Subtotal 2 153 1 185 3 879 7 217 Caroline Cardium 1 182 166 84 147 196 99 174 469 Mannville 3 428 148 77 147 508 263 505 1 276 Viking 390 118 59 77 46 23 30 99 Jurassic 56 125 71 107 7 4 6 17 Rundle 1 468 138 71 89 202 104 130 436 Beaverhill Lake 8 726 456 572 1 499 3 976 4 993 13 076 22 045 Subtotal 4 935 5 486 13 921 24 342 Cranberry Beaverhill Lake 2 674 65 67 206 174 179 551 904 Middle Devonian 213 19 19 38 4 4 8 16 Subtotal 178 183 559 920 Crossfield Belly River 169 41 24 24 7 4 4 15 Viking 122 90 74 57 11 9 7 27 Mannville 1 270 85 57 133 108 72 169 349 Jurassic 35 57 143 200 2 5 7 14 Mississippiana 1 868 - - - 70 100 151 321 Wabamun 1 784 7 6 28 12 11 50 73 Subtotal 210 201 388 799 Dunvegan Triassic 545 64 37 39 35 20 21 76 Belloy 160 50 31 44 8 5 7 20 Mississippian 214 9 5 70 2 1 15 18 Rundle 9 376 60 36 83 564 336 776 1 676 Wabamun 157 108 70 191 17 11 30 58 Subtotal 626 373 849 1 848 (continued)
a Includes gas cycling pool. Gas reserves calculated on an energy basis. Liquid recovery ratios are not included because of parameters changing with time.
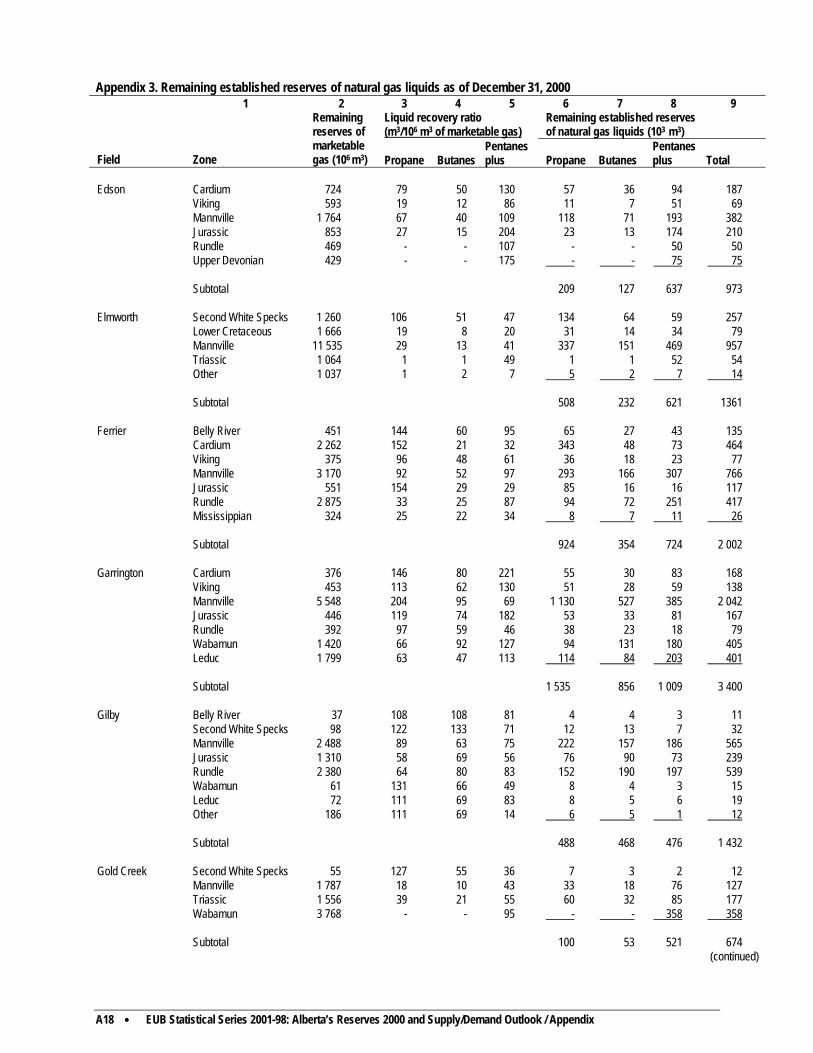
Appendix 3. Remaining established reserves of natural gas liquids as of December 31, 2000
A18 •••• EUB Statistical Series 2001-98: Alberta’s Reserves 2000 and Supply/Demand Outlook / Appendix
1 2 3 4 5 6 7 8 9 Liquid recovery ratio (m3/106 m3 of marketable gas)
Remaining established reserves of natural gas liquids (103 m3)
Field
Zone
Remaining reserves of marketable gas (106 m3)
Pentanes Propane Butanes plus
Pentanes Propane Butanes plus Total
Edson Cardium 724 79 50 130 57 36 94 187 Viking 593 19 12 86 11 7 51 69 Mannville 1 764 67 40 109 118 71 193 382 Jurassic 853 27 15 204 23 13 174 210 Rundle 469 - - 107 - - 50 50 Upper Devonian 429 - - 175 - - 75 75 Subtotal 209 127 637 973 Elmworth Second White Specks 1 260 106 51 47 134 64 59 257 Lower Cretaceous 1 666 19 8 20 31 14 34 79 Mannville 11 535 29 13 41 337 151 469 957 Triassic 1 064 1 1 49 1 1 52 54 Other 1 037 1 2 7 5 2 7 14 Subtotal 508 232 621 1361 Ferrier Belly River 451 144 60 95 65 27 43 135 Cardium 2 262 152 21 32 343 48 73 464 Viking 375 96 48 61 36 18 23 77 Mannville 3 170 92 52 97 293 166 307 766 Jurassic 551 154 29 29 85 16 16 117 Rundle 2 875 33 25 87 94 72 251 417 Mississippian 324 25 22 34 8 7 11 26 Subtotal 924 354 724 2 002 Garrington Cardium 376 146 80 221 55 30 83 168 Viking 453 113 62 130 51 28 59 138 Mannville 5 548 204 95 69 1 130 527 385 2 042 Jurassic 446 119 74 182 53 33 81 167 Rundle 392 97 59 46 38 23 18 79 Wabamun 1 420 66 92 127 94 131 180 405 Leduc 1 799 63 47 113 114 84 203 401 Subtotal 1 535 856 1 009 3 400 Gilby Belly River 37 108 108 81 4 4 3 11 Second White Specks 98 122 133 71 12 13 7 32 Mannville 2 488 89 63 75 222 157 186 565 Jurassic 1 310 58 69 56 76 90 73 239 Rundle 2 380 64 80 83 152 190 197 539 Wabamun 61 131 66 49 8 4 3 15 Leduc 72 111 69 83 8 5 6 19 Other 186 111 69 14 6 5 1 12 Subtotal 488 468 476 1 432 Gold Creek Second White Specks 55 127 55 36 7 3 2 12 Mannville 1 787 18 10 43 33 18 76 127 Triassic 1 556 39 21 55 60 32 85 177 Wabamun 3 768 - - 95 - - 358 358 Subtotal 100 53 521 674 (continued)

Appendix 3. Remaining established reserves of natural gas liquids as of December 31, 2000
EUB Statistical Series 2001-98: Alberta’s Reserves 2000 and Supply/Demand Outlook / Appendix •••• A19
1 2 3 4 5 6 7 8 9 Liquid recovery ratio (m3/106 m3 of marketable gas)
Remaining established reserves of natural gas liquids (103 m3)
Field
Zone
Remaining reserves of marketable gas (106 m3)
Pentanes Propane Butanes plus
Pentanes Propane Butanes plus Total
Hamburg Triassic 294 31 17 20 9 5 6 20 Beaverhill Lake 3 463 16 19 178 56 65 616 737 Subtotal 65 70 622 757 Harmattan East Viking 95 95 126 84 9 12 8 29 Mannville 283 198 134 159 56 38 45 139 Jurassic 99 101 131 91 10 13 9 32 Mississippiana 5 728 - - - 37 22 26 85 Subtotal 112 85 88 285 Harmattan-Elkton Mannville 123 244 65 57 30 8 7 45 Mississippiana 5 675 - - - 299 29 95 423 Subtotal 329 37 102 468 Hussar Viking 570 16 9 21 9 5 12 26 Mannville 3 972 70 43 79 280 170 314 764 Rundle 94 96 53 53 9 5 5 19 Subtotal 298 180 331 809 Judy Creek Viking 562 16 11 69 9 6 39 54 Rundle 187 75 43 75 14 8 14 36 Beaverhill Lake 2 321 255 135 87 591 314 203 1 108 Subtotal 614 328 256 1198 Jumping Pound West
Rundle 8 609 42 38 126 360 331 1 086 1 777
Subtotal 360 331 1 086 1 777 Kakwa Cardiuma 3 639 - - - 294 155 117 566 Second White Specks 107 56 47 84 6 5 9 20 Lower Cretaceous 117 94 51 17 11 6 2 19 Mannville 229 44 26 26 10 6 6 22 Triassic 94 96 43 43 9 4 4 17 Subtotal 330 176 138 644 Karr Cardium 63 127 63 48 8 4 3 15 Second White Specks 224 125 58 45 28 13 10 51 Mannville 4 384 127 71 120 555 311 524 1390 Jurassic 241 54 25 46 13 6 11 30 Triassic 407 93 47 54 38 19 22 79 Wabamun 956 27 21 38 26 20 36 82 Beaverhill Lake 47 170 85 64 8 4 3 15 Subtotal 676 377 609 1 662 (continued) a Includes gas cycling pool. Gas reserves calculated on an energy basis. Liquid recovery ratios are not included because of parameters changing with time.

Appendix 3. Remaining established reserves of natural gas liquids as of December 31, 2000
A20 •••• EUB Statistical Series 2001-98: Alberta’s Reserves 2000 and Supply/Demand Outlook / Appendix
1 2 3 4 5 6 7 8 9 Liquid recovery ratio (m3/106 m3 of marketable gas)
Remaining established reserves of natural gas liquids (103 m3)
Field
Zone
Remaining reserves of marketable gas (106 m3)
Pentanes Propane Butanes plus
Pentanes Propane Butanes plus Total
Kaybob Viking 484 19 19 76 9 9 37 55 Mannville 2 993 21 18 48 62 53 144 259 Upper Devonian 51 - - 196 - - 10 10 Beaverhill Lakea 743 - - - 221 217 360 798 Subtotal 292 279 551 1 122 Kaybob South Second White Specks 73 68 41 219 5 3 16 24 Viking 200 35 30 70 7 6 14 27 Mannville 10 508 65 41 81 678 431 855 1 964 Jurassic 317 13 13 47 4 4 15 23 Triassic 1 163 41 53 73 48 62 85 195 Wabamun 110 109 64 55 12 7 6 25 Upper Devonian 360 75 75 644 27 27 232 286 Nisku 182 66 115 462 12 21 84 117 Beaverhill Lakea 3 106 - - - 386 348 1 401 2 135 Subtotal 1 179 909 2 708 4 796 Knopcik Second White Specks 149 27 27 47 4 4 7 15 Viking 235 34 26 89 8 6 21 35 Mannville 648 11 8 31 7 5 20 32 Jurassic 1 208 45 32 102 54 39 123 216 Triassic 5 241 12 8 122 63 43 637 743 Subtotal 136 97 808 1 041 McLeod Cardium 1 347 91 58 89 122 78 120 320 Mannville 3 525 71 49 111 251 174 390 815 Jurassic 1 178 53 33 154 62 39 181 282 Subtotal 435 291 691 1 417 Medicine River Viking 63 143 79 127 9 5 8 22 Mannville 2 471 110 66 59 272 164 145 581 Jurassic 1 533 91 59 44 140 90 67 297 Rundle 1 924 109 61 70 210 117 135 462 Leduc 329 219 152 340 72 50 112 234 Subtotal 703 426 467 1 596 Minehead Cardium 3 649 6 6 181 22 23 661 706 Subtotal 22 23 661 706 Moose Rundle 2 035 71 57 191 144 115 388 647 Wabamun 180 44 33 61 8 6 11 25 Subtotal 152 121 399 672 (continued) a Includes gas cycling pool. Gas reserves calculated on an energy basis. Liquid recovery ratios are not included because of parameters changing with time.

Appendix 3. Remaining established reserves of natural gas liquids as of December 31, 2000
EUB Statistical Series 2001-98: Alberta’s Reserves 2000 and Supply/Demand Outlook / Appendix •••• A21
1 2 3 4 5 6 7 8 9 Liquid recovery ratio (m3/106 m3 of marketable gas)
Remaining established reserves of natural gas liquids (103 m3)
Field
Zone
Remaining reserves of marketable gas (106 m3)
Pentanes Propane Butanes plus
Pentanes Propane Butanes plus Total
Peco Cardium 425 26 14 595 11 6 253 270 Mannville 1 329 107 69 357 142 92 475 709 Jurassic 41 122 73 49 5 3 2 10 Nisku 748 39 29 29 29 22 22 73 Subtotal 187 123 752 1 062 Pembina Belly River 2 170 88 55 97 191 119 211 521 Cardium 3 492 186 129 119 650 452 415 1 517 Viking 388 72 52 77 28 20 30 78 Mannville 7 461 64 37 166 481 276 1 239 1 996 Jurassic 5 266 62 38 198 329 200 1 041 1 570 Rundle 448 40 25 60 18 11 27 56 Mississippian 395 114 61 81 45 24 32 101 Upper Devonian 44 295 205 205 13 9 9 31 Nisku 4 812 225 107 86 1 083 513 414 2 010 Subtotal 2 838 1 624 3 418 7 880 Pine Creek Second White Specks 135 - - 156 - - 21 21 Mannville 2 683 37 19 201 98 52 538 688 Jurassic 303 13 10 46 4 3 14 21 Rundle 170 - - 112 - - 19 19 Wabamun 787 6 5 25 5 4 20 29 Leduc 488 18 25 39 9 12 19 40 Other 1 047 - 3 53 2 1 22 25 Subtotal 118 72 653 843 Rainbow Mannville 3 052 3 3 15 10 10 46 66 Beaverhill Lake 216 93 56 83 20 12 18 50 Sulphur Point 396 61 38 129 24 15 51 90 Muskeg 401 209 102 95 84 41 38 163 Keg River 7 471 311 163 113 2 323 1 219 846 4 388 Subtotal 2 461 1 297 999 4 757 Rainbow South Sulphur Point 349 9 6 72 3 2 25 30 Muskeg 312 128 74 83 40 23 26 89 Keg River 2 734 273 139 134 747 380 367 1494 Subtotal 790 405 418 1 613 Ricinus Cardiuma 9 869 - - - 412 275 376 1 063 Viking 5 027 30 18 36 150 90 182 422 Mannville 198 61 30 45 12 6 9 27 Subtotal 574 371 567 1 512 Shekelie Keg River 1 363 142 84 84 193 115 114 422 Subtotal 193 115 114 422 (continued) a Includes gas cycling pool. Gas reserves calculated on an energy basis. Liquid recovery ratios are not included because of parameters changing with time.
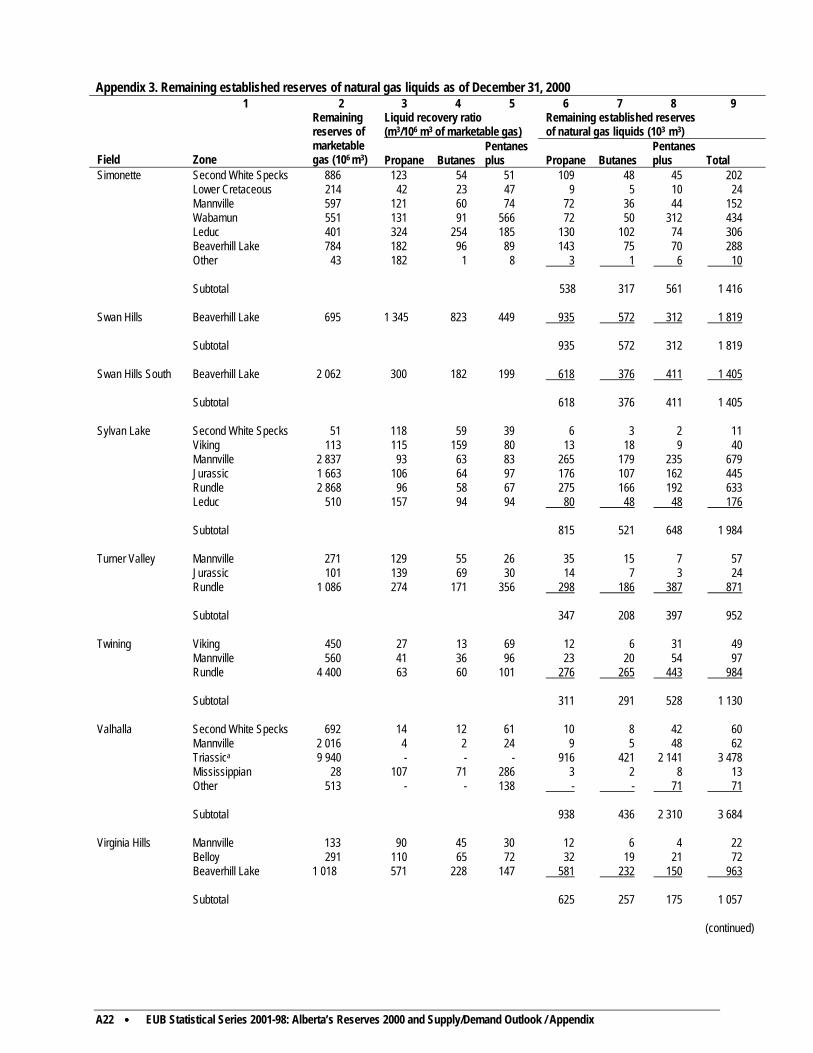
Appendix 3. Remaining established reserves of natural gas liquids as of December 31, 2000
A22 •••• EUB Statistical Series 2001-98: Alberta’s Reserves 2000 and Supply/Demand Outlook / Appendix
1 2 3 4 5 6 7 8 9 Liquid recovery ratio (m3/106 m3 of marketable gas)
Remaining established reserves of natural gas liquids (103 m3)
Field
Zone
Remaining reserves of marketable gas (106 m3)
Pentanes Propane Butanes plus
Pentanes Propane Butanes plus Total
Simonette Second White Specks 886 123 54 51 109 48 45 202 Lower Cretaceous 214 42 23 47 9 5 10 24 Mannville 597 121 60 74 72 36 44 152 Wabamun 551 131 91 566 72 50 312 434 Leduc 401 324 254 185 130 102 74 306 Beaverhill Lake 784 182 96 89 143 75 70 288 Other 43 182 1 8 3 1 6 10 Subtotal 538 317 561 1 416 Swan Hills Beaverhill Lake 695 1 345 823 449 935 572 312 1 819 Subtotal 935 572 312 1 819 Swan Hills South Beaverhill Lake 2 062 300 182 199 618 376 411 1 405 Subtotal 618 376 411 1 405 Sylvan Lake Second White Specks 51 118 59 39 6 3 2 11 Viking 113 115 159 80 13 18 9 40 Mannville 2 837 93 63 83 265 179 235 679 Jurassic 1 663 106 64 97 176 107 162 445 Rundle 2 868 96 58 67 275 166 192 633 Leduc 510 157 94 94 80 48 48 176 Subtotal 815 521 648 1 984 Turner Valley Mannville 271 129 55 26 35 15 7 57 Jurassic 101 139 69 30 14 7 3 24 Rundle 1 086 274 171 356 298 186 387 871 Subtotal 347 208 397 952 Twining Viking 450 27 13 69 12 6 31 49 Mannville 560 41 36 96 23 20 54 97 Rundle 4 400 63 60 101 276 265 443 984 Subtotal 311 291 528 1 130 Valhalla Second White Specks 692 14 12 61 10 8 42 60 Mannville 2 016 4 2 24 9 5 48 62 Triassica 9 940 - - - 916 421 2 141 3 478 Mississippian 28 107 71 286 3 2 8 13 Other 513 - - 138 - - 71 71 Subtotal 938 436 2 310 3 684 Virginia Hills Mannville 133 90 45 30 12 6 4 22 Belloy 291 110 65 72 32 19 21 72 Beaverhill Lake 1 018 571 228 147 581 232 150 963 Subtotal 625 257 175 1 057 (continued)
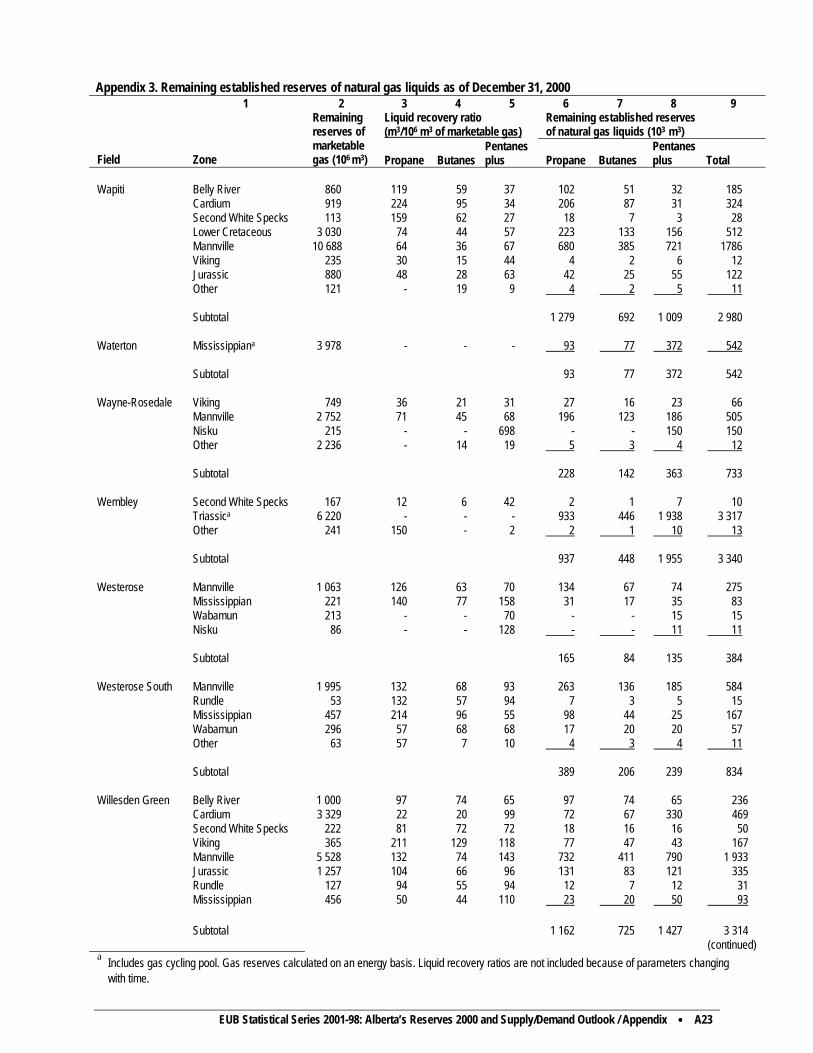
Appendix 3. Remaining established reserves of natural gas liquids as of December 31, 2000
EUB Statistical Series 2001-98: Alberta’s Reserves 2000 and Supply/Demand Outlook / Appendix •••• A23
1 2 3 4 5 6 7 8 9 Liquid recovery ratio (m3/106 m3 of marketable gas)
Remaining established reserves of natural gas liquids (103 m3)
Field
Zone
Remaining reserves of marketable gas (106 m3)
Pentanes Propane Butanes plus
Pentanes Propane Butanes plus Total
Wapiti Belly River 860 119 59 37 102 51 32 185 Cardium 919 224 95 34 206 87 31 324 Second White Specks 113 159 62 27 18 7 3 28 Lower Cretaceous 3 030 74 44 57 223 133 156 512 Mannville 10 688 64 36 67 680 385 721 1786 Viking 235 30 15 44 4 2 6 12 Jurassic 880 48 28 63 42 25 55 122 Other 121 - 19 9 4 2 5 11 Subtotal 1 279 692 1 009 2 980 Waterton Mississippiana 3 978 - - - 93 77 372 542 Subtotal 93 77 372 542 Wayne-Rosedale Viking 749 36 21 31 27 16 23 66 Mannville 2 752 71 45 68 196 123 186 505 Nisku 215 - - 698 - - 150 150 Other 2 236 - 14 19 5 3 4 12 Subtotal 228 142 363 733 Wembley Second White Specks 167 12 6 42 2 1 7 10 Triassica 6 220 - - - 933 446 1 938 3 317 Other 241 150 - 2 2 1 10 13 Subtotal 937 448 1 955 3 340 Westerose Mannville 1 063 126 63 70 134 67 74 275 Mississippian 221 140 77 158 31 17 35 83 Wabamun 213 - - 70 - - 15 15 Nisku 86 - - 128 - - 11 11 Subtotal 165 84 135 384 Westerose South Mannville 1 995 132 68 93 263 136 185 584 Rundle 53 132 57 94 7 3 5 15 Mississippian 457 214 96 55 98 44 25 167 Wabamun 296 57 68 68 17 20 20 57 Other 63 57 7 10 4 3 4 11 Subtotal 389 206 239 834 Willesden Green Belly River 1 000 97 74 65 97 74 65 236 Cardium 3 329 22 20 99 72 67 330 469 Second White Specks 222 81 72 72 18 16 16 50 Viking 365 211 129 118 77 47 43 167 Mannville 5 528 132 74 143 732 411 790 1 933 Jurassic 1 257 104 66 96 131 83 121 335 Rundle 127 94 55 94 12 7 12 31 Mississippian 456 50 44 110 23 20 50 93 Subtotal 1 162 725 1 427 3 314 (continued) a Includes gas cycling pool. Gas reserves calculated on an energy basis. Liquid recovery ratios are not included because of parameters changing with time.

Appendix 3. Remaining established reserves of natural gas liquids as of December 31, 2000
A24 •••• EUB Statistical Series 2001-98: Alberta’s Reserves 2000 and Supply/Demand Outlook / Appendix
1 2 3 4 5 6 7 8 9 Liquid recovery ratio (m3/106 m3 of marketable gas)
Remaining established reserves of natural gas liquids (103 m3)
Field
Zone
Remaining reserves of marketable gas (106 m3)
Pentanes Propane Butanes plus
Pentanes Propane Butanes plus Total
Wilson Creek Belly River 771 167 109 332 129 84 256 469 Mannville 1 003 82 66 103 82 66 103 251 Jurassic 348 92 60 60 32 21 21 74 Rundle 565 87 50 112 49 28 63 140 Mississippian 255 133 75 145 34 19 37 90 Other 56 133 12 16 5 3 4 12 Subtotal 331 221 484 1 036 Windfall Mannville 1 073 52 30 67 56 32 72 160 Rundle 87 57 46 184 5 4 16 25 Mississippian 54 111 56 56 6 3 3 12 Upper Devonian 1 173 15 32 142 18 37 166 221 Nisku 185 43 54 492 8 10 91 109 Leduca 1 931 - - - 31 30 280 341 Other 235 16 1 5 2 2 9 13 Subtotal 126 118 637 881 Wizard Lake Mannville 588 37 20 100 22 12 59 93 Leduc 5 819 351 202 61 2 045 1 178 354 3 577 Subtotal 2 067 1 190 413 3 670 Subtotal 37 710 24 846 54 102 116 658 Confidential reserves 81 42 101 224 Other small reserves 13 174 8 423 23 959 45 556 Subtotal 50 965 33 311 78 162 162 438 Recoverable at straddle plants 34 470 15 860 7 170 57 500 Recoverable at solvent floods 48 1 237 621 1 906 Total reserves 85 483 50 408 85 953 221 844 (538.5)b (317.4)b (540 9)b (1 396.8)b
b Imperial equivalent in millions of barrels.

EUB Statistical Series 2001-98: Alberta’s Reserves 2000 and Supply/Demand Outlook / Appendix •••• A25
Appendix 4 Basic Data Tables and Map Introduction The databases used to prepare this report were developed by EUB staff. Input was also obtained from the National Energy Board (NEB) through an ongoing process of crude oil, natural gas, and crude bitumen reserve studies. The crude oil and natural gas reserves data tables and the crude bitumen resources data table present the official reserve estimates of both the EUB and NEB for the province of Alberta. Basic Data Tables The conventional oil reserves and basic data, crude bitumen resources and basic data, and the natural gas reserves and basic data tables are included this year as Microsoft Excel 2000 spreadsheets on a CD that accompanies this report. The individual oil and gas pools and crude bitumen deposit/pool values are presented on the first worksheet of each spreadsheet. Oil field, crude bitumen deposit, and gas field/strike are on the second worksheet. Provincial totals for crude oil and natural gas are on the third worksheet. Crude bitumen provincial totals are included with the deposit information. The pool names along the left side and the column headings on the top of the spreadsheets are locked into place to allow for easy scrolling. All crude oil and natural gas pools are listed first alphabetically by field/strike name and then stratigraphically within the field, with the pools occurring in the youngest reservoir rock listed first. Crude Bitumen Resources and Basic Data The crude bitumen resources and basic data spreadsheet is similar to the data tables in previous versions of the reserves report (EUB Statistical Series 18). The Oils Sands Area, Oil Sands Deposit, overburden/zone, Oil Sands Sector/Pool, and reserve determination method are listed in separate columns. Crude Oil Reserves and Basic Data The crude oil reserves and basic data spreadsheet is similar to the data tables in previous versions of the reserves report. The spreadsheet contains all nonconfidential pools in Alberta. Reserves data for single- and multi-mechanism pools are presented in separate columns. The total pool record contains the summation of the multi-mechanism pool reserves data. These data appear in the pool column, which can be used for determining field and provincial totals. The mechanism type is displayed with the pool names. All fields are listed in alphabetical order, and within each field the pools are ordered stratigraphically, with the pool occurring in the most recent reservoir rock appearing first. This order is preserved regardless of whether the pool consists of light-medium or heavy oil. A data field of crude classification has been included that will allow the reader to sort the file by that category, if desired. Provincial totals for the light-medium and heavy oil pools are presented separately on the provincial total worksheet.
A26 •••• EUB Statistical Series 2001-98: Alberta’s Reserves 2000 and Supply/Demand Outlook / Appendix
Natural Gas Reserves and Basic Data The natural gas reserves and basic data file is greatly expanded over the table that was included in past reserve reports. Previously the data table was limited to individual natural gas pools with initial established reserves of marketable gas equal to or greater than 300 million cubic metres. Pools with less than 300 million cubic metres were grouped within each field and presented as a total. The natural gas reserves data file in this report has been expanded to include all nonconfidential pools, regardless of initial established reserves values. The number of data fields in the natural gas reserves table has also been expanded. The EUB field, pool, and sequence codes are included, as are fields to indicate associated, nonassociated, and solution gas. The solution gas data are listed under separate column headings from the associated/nonassociated gas data. Gas/water and oil/water interfaces are also given. Basic reserves data are split into two columns consisting of pools (individual, undefined, and total pool records) and member pools (pools that are separate gas pools overlying a single oil pool or individual gas pools that have been commingled). The total pool record contains a summation of the basic reserves data for all of the related members. Individual pools have a pool sequence code of 000, undefined pools have a pool code ending in 98, and total pool records have a pool sequence code of 999. Member pools have the same pool code as the total pool record, but each discreet member pool has a unique pool sequence code. In previous reserve reports, the natural gas reserves data files used footnotes to indicate certain conditions. With the change of format for this report, the footnotes are no longer present, but the information can be deduced from the natural gas reserves spreadsheet as follows: • Footnote a – measured heating value. This refers to the gross heating values (GHV),
where the heating value was based on an analysis of the natural gas, rather than being calculated from the components. These pools are indicated on the spreadsheet by a GHV code of A (analyzed).
• Footnote b – includes solution gas production. Solution gas production was included
with the associated gas production in the marketable gas net cumulative production where associated gas was present. That practice is continued in this report and occurs where the Associated Gas and Solution Gas indicator fields are both present.
• Footnote c – pool recovery and surface loss calculated on an energy basis. This
footnote applied to pools that were undergoing gas cycling. These pools have a GHV code of A (analyzed) and an analysis code of GC (gas cycling).
The codes for gross heating value and reserve analysis are as follows: Gross Heating Value Codes A Analyzed C Calculated

EUB Statistical Series 2001-98: Alberta’s Reserves 2000 and Supply/Demand Outlook / Appendix •••• A27
Reserves Analysis Codes CM Coal Bed Methane CP Cumulative Production GC Gas Cycling MB Material Balance PD Production Decline SG Secondary Gas Cap TR Total Record VO Volumetrics PE Performance Estimate If production from two or more pools is commingled before measurement, the initial reserve estimate for each pool is given, if available, together with the total reserve estimate for the pools. Also, because production of associated and solution gas reserves for a pool has not been determined separately, the spreadsheet lists remaining associated and solution gas reserves for those pools on a combined basis. Map of Oil and Gas Fields and Oil Sands Deposits in Alberta The EUB map of the oil and gas fields and oil sands deposits in Alberta is included in an envelope at the end of this report. This map illustrates the feature boundaries as they existed on December 31, 2000. Also included on this map are the main pipelines, refineries, and gas processing plants.