Embed Size (px)
Citation preview
DRAFT
METROPOLITAN BOROUGH OF ROTHERHAM
STATEMENT OF ACCOUNTS 2017/18 Contents Page Number Notice of Public Rights 1 Statement of Responsibilities for the Statement of Accounts 2 Explanation of the Financial Statements 3 Main Financial Statements and Notes to the Core Financial Statements 5 Comprehensive Income and Expenditure Statement 6 Movement in Reserves Statement 7 Balance Sheet 9 Cash Flow Statement 10 Statement of Accounting Concepts and Policies 12 Accounting Standards not yet adopted 31 Critical Judgements in applying Accounting Policies 32 Assumptions made about future and other major sources of estimations 33 Notes to the Core Financial Statements 34 Housing Revenue Account (HRA) Income and Expenditure Account 100 Movement on the HRA Statement 101 Collection Fund 108 Metropolitan Debt Administration 111 Certification 114 Glossary 116
1
AUDIT OF ACCOUNTS 2017/18 ROTHERHAM METROPOLITAN BOROUGH COUNCIL Statement of Accounts 2017/18 Public Inspection Notice Notice of the Commencement of the Period for the Exercise of Public Rights Local Audit and Accountability Act 2014 Sections 26 and 27 Accounts and Audit (England) Regulations 2015 Regulations, 14 and 15 The period for the Exercise of Public Rights commences at 9.30am on Friday 1 June 2018 and will conclude at 4pm on Thursday 12 July 2018. The following documents will be made available:
The Draft Statement of Accounts The Annual Governance Statement The Narrative Report
The draft Statement of Accounts may be subject to change. The above Council’s accounts are subject to external audit by KPMG LLP, Timothy Cutler, 1, Sovereign Square, Sovereign Street, Leeds, LS1 4DA. Members of the public and local government electors have certain rights in the audit process:- 1. The period for the Exercise of Public Rights commences on Friday 1 June 2018 and will conclude on
Thursday 12 July 2018 (between 9.30am and 4.00 pm Monday to Friday). Any person interested, on application to the Strategic Director of Finance and Customer Services, Rotherham Metropolitan Borough Council, Riverside House, Main Street, Rotherham, S60 1AE, may inspect and make copies of the accounts of the above-named Council for the year ended 31 March 2018, and all books, deeds, contracts, bills, vouchers and receipts relating thereto.
2. Notice is also given that on or after Friday 1 June 2018 until Thursday 12 July 2018, a local government
elector for the area to which the accounts relate or his/her representative may ask any questions of the auditor. Please contact the auditor at the above address to make arrangements to ask any questions.
3. These rights do not permit a person to require disclosure of personal information as defined in section 26 of the Local Audit and Accountability Act 2014.
4. From 9.30am on Friday 1 June 2018 until Thursday 12 July 2018, a local government elector for the area
of the Authority, or his/her representative, may object to the Council’s accounts asking that the auditor issue a report in the public interest (schedule 7, Local Audit and Accountability Act 2014) and/or apply to the Court for a declaration that an item in the accounts is contrary to law (section 27, Local Audit and Accountability Act 2014). No such objection may be made unless the Auditor has previously received written notice of the objection and the grounds on which it is made and a copy of that notice has been provided to the Strategic Director of Finance and Customer Services, Rotherham Metropolitan Borough Council.
Judith Badger CPFA Strategic Director of Finance and Customer Services Finance and Customer Services Directorate, Riverside House, Main Street, Rotherham, S60 1AE Thursday 31 May 2018
2
STATEMENT OF RESPONSIBILITIES FOR THE STATEMENT OF ACCOUNTS The Council’s Responsibilities The Council is required: - to make arrangements for the proper administration of its financial affairs and to secure that one of its
officers has the responsibility for the administration of those affairs. In this Council, that officer is the Strategic Director of Finance and Customer Services;
- to manage its affairs to secure economic, efficient and effective use of resources and to safeguard its assets;
- to approve the Statement of Accounts. The Strategic Director of Finance and Customer Services Responsibilities The Strategic Director of Finance and Customer Services is responsible for the preparation of the Council’s Statement of Accounts, consistent with the CIPFA/LASAAC Code of Practice on Local Authority Accounting (the Code). In preparing this Statement of Accounts, the Strategic Director of Finance and Customer Services has: - selected suitable accounting policies and then applied them consistently, - made judgements and estimates that were reasonable and prudent, - complied with the Code of Practice. The Strategic Director of Finance and Customer Services has also: - kept proper accounting records which were up to date, - taken reasonable steps for the prevention and detection of fraud and other irregularities. Strategic Director of Finance and Customer Services Certificate This Statement of Accounts is that upon which the Auditor should enter his certificate and opinion. It presents a true and fair view of the financial position of the Council at 31 March 2018 and its income and expenditure for the year then ended.
Signed… ……………………………………………………………… Judith Badger CPFA Date…………..31 May 2018……………………………….
3
Explanation of the Financial Statements The Statement of Accounts summarises the Council’s financial performance during the year ended 31 March 2018 and shows its overall financial position at the end of that period. The Statement is prepared in accordance with the Code of Practice on Local Authority Accounting (the Code), as published by the Chartered Institute of Public Finance and Accountancy (CIPFA). The Code is based on approved accounting standards issued by the International Accounting Standards Board (IASB) and interpretations of the International Financial Reporting Interpretations Committee (IFRIC), except where these are inconsistent with specific statutory requirements. The principle bases, conventions, rules and practices that specify how the effects of transactions and other events are reflected in the financial statements of the Council are set out in the section of this report headed ‘Statement of Accounting Policies’. These accounting policies are kept under review and updated where appropriate to take account of changes in accounting practice adopted within the Code. The Statement of Accounts comprises: Statement of Responsibilities for the Statement of Accounts (Page 2) – which details the
respective responsibilities of the Council and its chief financial officer for the accounts; An explanation of the financial Statements (Page 3) – which details the components of the Financial
Statements; A Statement of Accounting Concepts and Policies (Page 12) – These are the principle bases,
conventions, rules and practices that specify how the effects of transactions and other events are reflected in the financial statements. The accounting concepts and policies that have been applied in preparing the Council’s 2016/17 financial statements are detailed on Page 12;
Financial Statements and related disclosure notes – which are explained further below. For the sake of clarity, the Accounts and Audit Regulations 2015 has clarified that the Annual Governance Statement does not form part of the Statement of Accounts although there is an expectation that it is published alongside the Statement of Accounts. The Council follows this practice. To comply with the Accounts and Audit Regulations 2015 and the Code, the Narrative Report will be published alongside the Statement of Accounts. Financial Statements The Financial Statements report the Council’s financial performance for the year and its financial position. The Council’s financial performance is reported through the:
Comprehensive Income and Expenditure Statement (CIES) (Page 6) – The Comprehensive Income
and Expenditure Statement shows the surplus or deficit on the provision of services and other gains and losses recognised in the year prior to any statutory adjustments for the differences between the way transactions are presented on a commercial accounting basis and the amounts which are statutorily required to be met under the Local Authority Accounting Framework from local taxpayers and housing rents to meet the cost of General Fund and HRA services.
Movement in Reserves Statement (MIRS) (Page 7) – The Movement in Reserves Statement shows
the net change in the balances on reserves allowing for the aforementioned statutory adjustments. Reserves are analysed into usable reserves and unusable reserves. Usable reserves represent revenue or capital resources which are available to fund revenue or capital expenditure or repay debt in the future, subject to the need to maintain a prudent level of reserves to cover contingencies and unforeseen commitments. Unusable reserves are not available for use.
The Cash Flow Statement (Page 10) – This Statement summarises the inflows and outflows of cash
arising from transactions with third parties for revenue and capital purposes. The statement shows
4
how the Council generates and uses cash and cash equivalents by classifying cash flows as operating, investing and financing activities.
The Housing Revenue Account (HRA) Income and Expenditure Account (Page 100) – This Account summarises the income and expenditure in respect of the provision of local Council housing accommodation. Councils’ are required by statute to account separately for all transactions relating to the cost of providing such accommodation.
Collection Fund Account (Page 108) – By statute, billing Authorities are required to maintain a
separate Collection Fund which shows the level of National Non Domestic Rates, Council Tax and the residual Community Charge received by the Council during the accounting period and the distribution of these funds.
The Council’s financial position is reported through the:
Balance Sheet (Page 9) - The Balance Sheet shows the value as at the Balance Sheet date of the
assets and liabilities recognised by the Council. The net assets of the Council (assets less liabilities) represent the Council’s net worth and are matched by the reserves held by the Council. Reserves are analysed into usable and unusable in the same way as in the MIRS.
The financial statements described above include the income, expenditure, assets, liabilities, reserves and cash flows of maintained schools within the control of the Council. The Council’s Financial Statements also include the Metropolitan Debt Administration statement (Page 111) as under the Local Government Act Reorganisation (Debt Administration – South Yorkshire) Order, 1986, the Council became responsible for the administration of the former South Yorkshire County Council Debt with effect from 1 April 1986. A separate account has been established to record the transactions, in order to arrive at an average rate of interest with which to charge the four district councils and joint boards within the South Yorkshire area. The Expenditure and Funding Analysis, included as Note 1 (Page 35) in the Notes to the Accounts, accompanies the Comprehensive Income and Expenditure Statement. It takes the net expenditure that is chargeable to taxation and rents (i.e. the General Fund and Housing Revenue Account) and reconciles it to the Comprehensive Income and Expenditure Statement.

5
Main Financial Statements and Notes to the Core Financial Statements Comprehensive Income and Expenditure Statement Movement in Reserves Statement Balance Sheet Cash Flow Statement Notes to the Core Financial Statements

6
Comprehensive Income and Expenditure Statement This Statement shows the surplus or deficit on the provision of services and other gains and losses recognised in the year prior to any statutory adjustments for the differences between the way transactions are presented on a commercial accounting basis and the amounts which are statutorily required to be met under the Local Authority Accounting Framework from local taxpayers and housing rents to meet the cost of General Fund and HRA services. The amount to be met from local taxpayers and housing rents is shown in the Movement in Reserves Statement. All of the Council’s income and expenditure relates to continuing operations. None of the items included within other comprehensive income and expenditure are reclassifiable within the surplus or deficit on provision of services.
2016/17 2016/17 2016/172017/18 2017/18 2017/18
Gross Expenditure Gross Income Net Cost Gross
Expenditure Gross Income Net Cost
£000 £000 £000 £000 £000 £000 Notes111,611 (37,849) 73,762 Adult Care and Housing 112,038 (46,660) 65,378
(32,983) (85,096) (118,079) Local Authority Housing (HRA) 68,803 (84,345) (15,542) 49
99,188 (28,069) 71,119 CYPS Excl Schools 112,405 (34,583) 77,822
101,049 (110,862) (9,813) Schools 85,343 (90,474) (5,131) 49
75,604 (30,825) 44,779 Regeneration and Environment Services 81,417 (29,950) 51,467
17,950 (17,542) 408 Public Health 16,906 (16,975) (69)
7,783 (2,730) 5,053 Assistant Chief Executive Office 8,813 (3,247) 5,566
106,847 (92,355) 14,492 Finance and Customer Services 104,325 (89,557) 14,768
16,363 (10,431) 5,932 Central Services 13,273 (10,828) 2,445
503,412 (415,759) 87,653 Cost of Services 603,323 (406,619) 196,704
62,038 (2) 62,036 Other Operating Expenditure 60,202 (16) 60,187 4
48,141 (1,964) 46,177Financing and Investment Income and Expenditure 45,943 (1,782) 44,161 5
0 (228,457) (228,457)Taxation & Non-Specific Grant Income and expenditure 0 (225,787) (225,787) 7
613,591 (646,182) (32,591) (Surplus) / Deficit on Provision of Services 709,468 (634,204) 75,264
(60,972) (Surplus) on Revaluation of Non Current Assets (33,505) 38b(1,424) Write down of Met Debt (1,567) 38a
142,878 Remeasurements of the Pensions Net Defined Benefit Liability (Asset) (93,612) 18
80,481 Other Comprehensive Income & Expenditure (128,684)
47,890 Total Comprehensive Income & Expenditure (53,420)
7 Movement in Reserves Statement
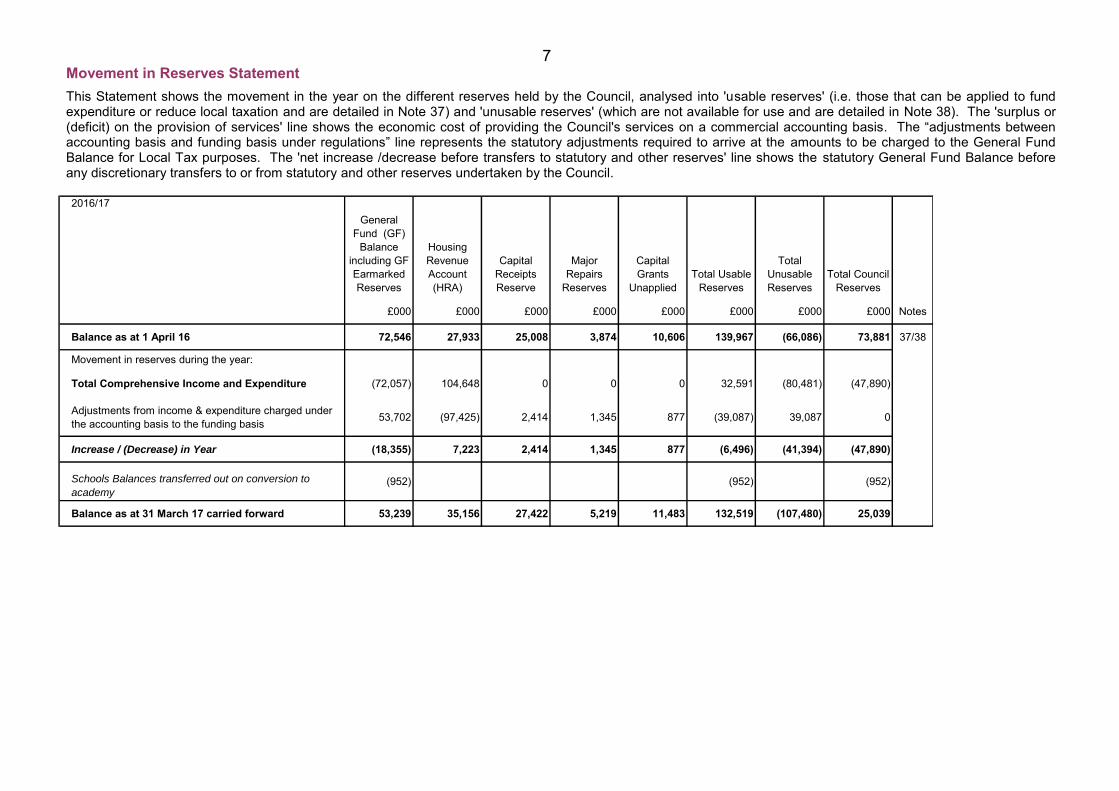
This Statement shows the movement in the year on the different reserves held by the Council, analysed into 'usable reserves' (i.e. those that can be applied to fund expenditure or reduce local taxation and are detailed in Note 37) and 'unusable reserves' (which are not available for use and are detailed in Note 38). The 'surplus or (deficit) on the provision of services' line shows the economic cost of providing the Council's services on a commercial accounting basis. The “adjustments between accounting basis and funding basis under regulations” line represents the statutory adjustments required to arrive at the amounts to be charged to the General Fund Balance for Local Tax purposes. The 'net increase /decrease before transfers to statutory and other reserves' line shows the statutory General Fund Balance before any discretionary transfers to or from statutory and other reserves undertaken by the Council.
2016/17General
Fund (GF) Balance
including GF Earmarked Reserves
Housing Revenue Account (HRA)
Capital Receipts Reserve
Major Repairs
Reserves
Capital Grants
UnappliedTotal Usable
Reserves
Total Unusable Reserves
Total Council Reserves
£000 £000 £000 £000 £000 £000 £000 £000 Notes
Balance as at 1 April 16 72,546 27,933 25,008 3,874 10,606 139,967 (66,086) 73,881 37/38
Movement in reserves during the year:
Total Comprehensive Income and Expenditure (72,057) 104,648 0 0 0 32,591 (80,481) (47,890)
Adjustments from income & expenditure charged under the accounting basis to the funding basis 53,702 (97,425) 2,414 1,345 877 (39,087) 39,087 0
Increase / (Decrease) in Year (18,355) 7,223 2,414 1,345 877 (6,496) (41,394) (47,890)
Schools Balances transferred out on conversion to
academy(952) (952) (952)
Balance as at 31 March 17 carried forward 53,239 35,156 27,422 5,219 11,483 132,519 (107,480) 25,039
8 2017/18
General Fund (GF)
Balance including GF Earmarked Reserves
Housing Revenue Account (HRA)
Balance including
HRA earmarked Reserves
Capital Receipts Reserve
Major Repairs
Reserves
Capital Grants
UnappliedTotal Usable
Reserves
Total Unusable Reserves
Total Council Reserves
£000 £000 £000 £000 £000 £000 £000 £000 Notes
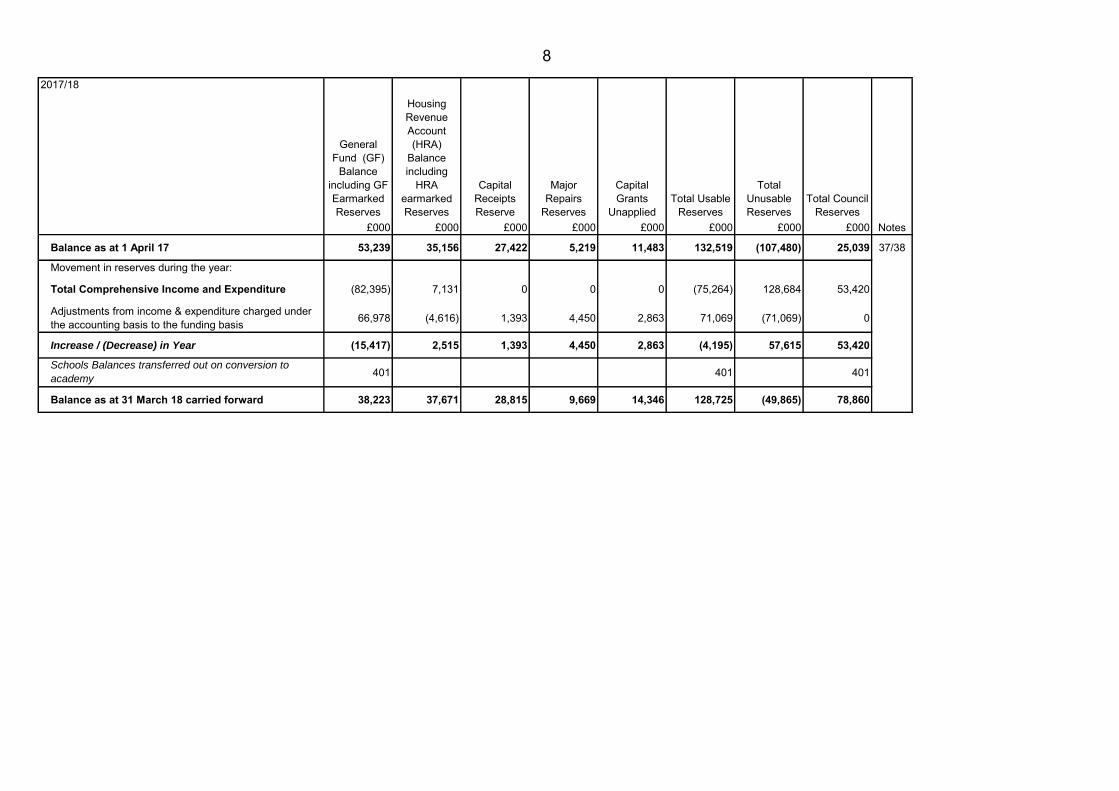
Balance as at 1 April 17 53,239 35,156 27,422 5,219 11,483 132,519 (107,480) 25,039 37/38
Movement in reserves during the year:
Total Comprehensive Income and Expenditure (82,395) 7,131 0 0 0 (75,264) 128,684 53,420
Adjustments from income & expenditure charged under the accounting basis to the funding basis 66,978 (4,616) 1,393 4,450 2,863 71,069 (71,069) 0
Increase / (Decrease) in Year (15,417) 2,515 1,393 4,450 2,863 (4,195) 57,615 53,420
Schools Balances transferred out on conversion to
academy401 401 401
Balance as at 31 March 18 carried forward 38,223 37,671 28,815 9,669 14,346 128,725 (49,865) 78,860
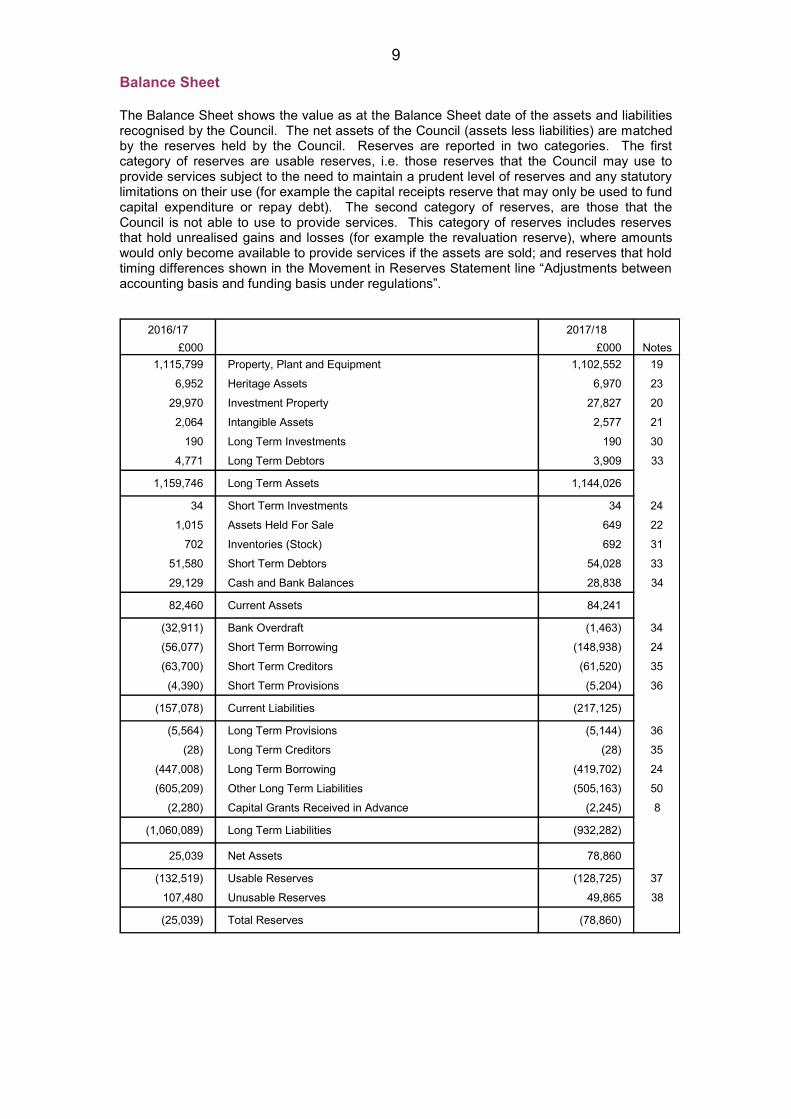
9 Balance Sheet The Balance Sheet shows the value as at the Balance Sheet date of the assets and liabilities recognised by the Council. The net assets of the Council (assets less liabilities) are matched by the reserves held by the Council. Reserves are reported in two categories. The first category of reserves are usable reserves, i.e. those reserves that the Council may use to provide services subject to the need to maintain a prudent level of reserves and any statutory limitations on their use (for example the capital receipts reserve that may only be used to fund capital expenditure or repay debt). The second category of reserves, are those that the Council is not able to use to provide services. This category of reserves includes reserves that hold unrealised gains and losses (for example the revaluation reserve), where amounts would only become available to provide services if the assets are sold; and reserves that hold timing differences shown in the Movement in Reserves Statement line “Adjustments between accounting basis and funding basis under regulations”.
2016/17 2017/18 £000 £000 Notes
1,115,799 Property, Plant and Equipment 1,102,552 196,952 Heritage Assets 6,970 23
29,970 Investment Property 27,827 202,064 Intangible Assets 2,577 21
190 Long Term Investments 190 304,771 Long Term Debtors 3,909 33
1,159,746 Long Term Assets 1,144,026
34 Short Term Investments 34 241,015 Assets Held For Sale 649 22
702 Inventories (Stock) 692 3151,580 Short Term Debtors 54,028 3329,129 Cash and Bank Balances 28,838 34
82,460 Current Assets 84,241
(32,911) Bank Overdraft (1,463) 34(56,077) Short Term Borrowing (148,938) 24(63,700) Short Term Creditors (61,520) 35
(4,390) Short Term Provisions (5,204) 36
(157,078) Current Liabilities (217,125)
(5,564) Long Term Provisions (5,144) 36(28) Long Term Creditors (28) 35
(447,008) Long Term Borrowing (419,702) 24(605,209) Other Long Term Liabilities (505,163) 50
(2,280) Capital Grants Received in Advance (2,245) 8
(1,060,089) Long Term Liabilities (932,282)
25,039 Net Assets 78,860
(132,519) Usable Reserves (128,725) 37107,480 Unusable Reserves 49,865 38
(25,039) Total Reserves (78,860)
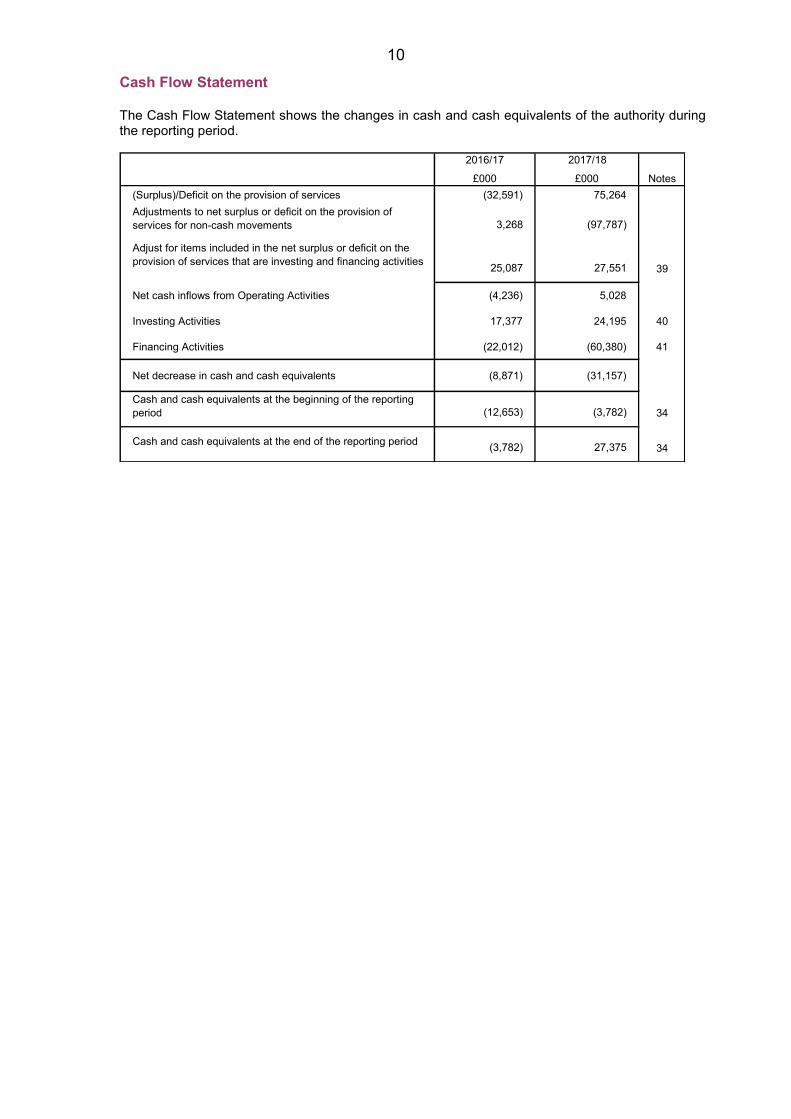
10 Cash Flow Statement The Cash Flow Statement shows the changes in cash and cash equivalents of the authority during the reporting period.
2016/17 2017/18
£000 £000 Notes(Surplus)/Deficit on the provision of services (32,591) 75,264Adjustments to net surplus or deficit on the provision of services for non-cash movements 3,268 (97,787)
Adjust for items included in the net surplus or deficit on the provision of services that are investing and financing activities 25,087 27,551 39
Net cash inflows from Operating Activities (4,236) 5,028
Investing Activities 17,377 24,195 40
Financing Activities (22,012) (60,380) 41
Net decrease in cash and cash equivalents (8,871) (31,157)
Cash and cash equivalents at the beginning of the reporting period (12,653) (3,782) 34
Cash and cash equivalents at the end of the reporting period (3,782) 27,375 34
11
Accounting Policies A) Statement of Accounting Policies B) Accounting Standards issued but not yet adopted C) Critical Judgements in applying Accounting Policies D) Assumptions made about the future and other major sources of estimation
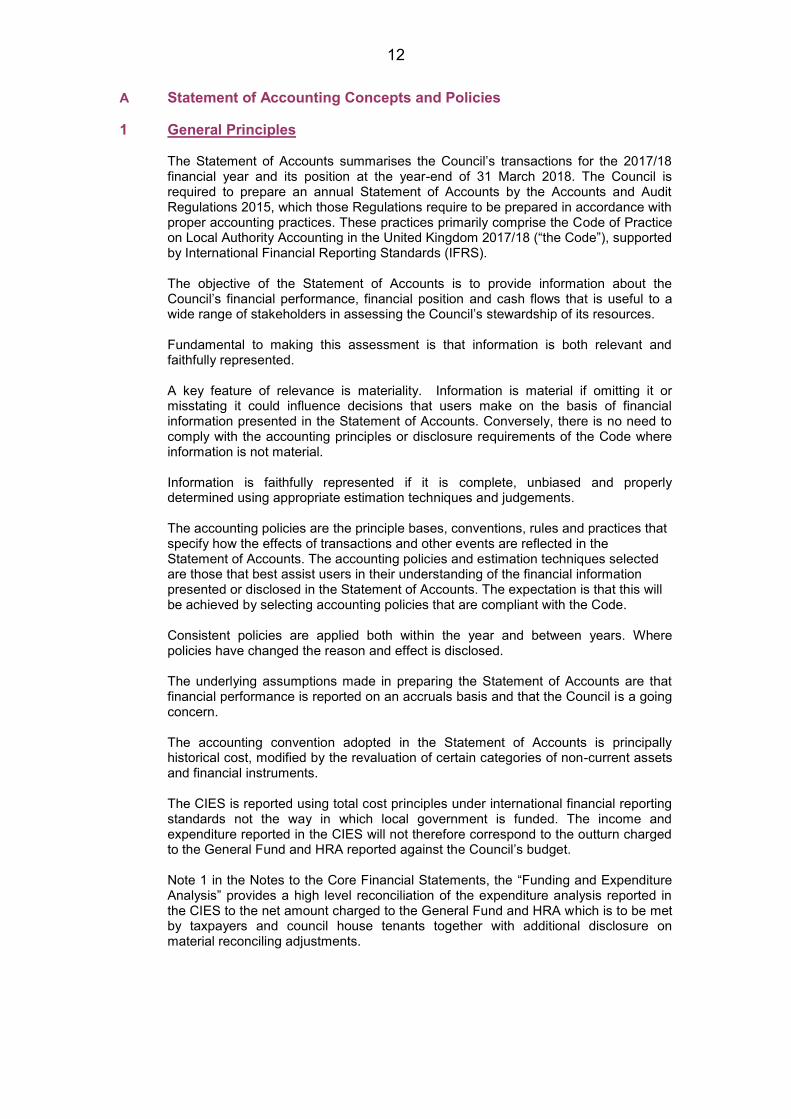
12 A Statement of Accounting Concepts and Policies 1 General Principles
The Statement of Accounts summarises the Council’s transactions for the 2017/18 financial year and its position at the year-end of 31 March 2018. The Council is required to prepare an annual Statement of Accounts by the Accounts and Audit Regulations 2015, which those Regulations require to be prepared in accordance with proper accounting practices. These practices primarily comprise the Code of Practice on Local Authority Accounting in the United Kingdom 2017/18 (“the Code”), supported by International Financial Reporting Standards (IFRS). The objective of the Statement of Accounts is to provide information about the Council’s financial performance, financial position and cash flows that is useful to a wide range of stakeholders in assessing the Council’s stewardship of its resources. Fundamental to making this assessment is that information is both relevant and faithfully represented. A key feature of relevance is materiality. Information is material if omitting it or misstating it could influence decisions that users make on the basis of financial information presented in the Statement of Accounts. Conversely, there is no need to comply with the accounting principles or disclosure requirements of the Code where information is not material. Information is faithfully represented if it is complete, unbiased and properly determined using appropriate estimation techniques and judgements. The accounting policies are the principle bases, conventions, rules and practices that specify how the effects of transactions and other events are reflected in the Statement of Accounts. The accounting policies and estimation techniques selected are those that best assist users in their understanding of the financial information presented or disclosed in the Statement of Accounts. The expectation is that this will be achieved by selecting accounting policies that are compliant with the Code.
Consistent policies are applied both within the year and between years. Where policies have changed the reason and effect is disclosed. The underlying assumptions made in preparing the Statement of Accounts are that financial performance is reported on an accruals basis and that the Council is a going concern. The accounting convention adopted in the Statement of Accounts is principally historical cost, modified by the revaluation of certain categories of non-current assets and financial instruments.
The CIES is reported using total cost principles under international financial reporting standards not the way in which local government is funded. The income and expenditure reported in the CIES will not therefore correspond to the outturn charged to the General Fund and HRA reported against the Council’s budget. Note 1 in the Notes to the Core Financial Statements, the “Funding and Expenditure Analysis” provides a high level reconciliation of the expenditure analysis reported in the CIES to the net amount charged to the General Fund and HRA which is to be met by taxpayers and council house tenants together with additional disclosure on material reconciling adjustments.
13 2 Changes in Accounting Policies and Estimates and Errors
Changes in accounting policies are only made when required by proper accounting practices or the change provides more reliable or relevant information about the effect of transactions, other events and conditions on the Council’s financial position or financial performance. Where a change is made, it is applied retrospectively by adjusting opening balances and comparative amounts for the prior period as if the new policy had always been applied unless the Code specifies that the change should be applied prospectively. Changes in accounting estimates are accounted for prospectively, i.e. in the current and future years affected by the change. Material errors discovered in prior period figures are corrected retrospectively by amending opening balances and comparative amounts for the prior period.
3 Accruals of Income and Expenditure
Activity is accounted for in the year that it takes place, not simply when cash payments are made or received. The general principle is that revenue is measured at the fair value of the consideration received which, in most transactions, will be the amount of cash and cash equivalents receivable. Revenue is recognised when the following conditions have been met:: - Revenue from the sale of goods is recognised when the Council transfers the
significant risks and rewards of ownership to the purchaser and it is probable that economic benefits or service potential associated with the transaction will flow to the Council.
- Revenue from the provision of services is recognised when the Council can measure reliably the percentage of completion of the transaction and it is probable that economic benefits or service potential associated with the transaction will flow to the Council.
- Supplies are recorded as expenditure when they are consumed. Where there is a gap between the date supplies are received and their consumption; they are carried as inventories on the Balance Sheet.
- Expenses in relation to services received (including those rendered by the Council’s officers) are recorded as expenditure when the services are received, rather than when payments are made.
- Interest payable on borrowings (other than that capitalised on qualifying assets) and receivable on investments is accounted for on the basis of the effective interest rate for the relevant financial instrument rather than the cash flows fixed or determined by the contract.
- Where revenue and expenditure have been recognised but cash has not been received or paid, a debtor or creditor for the relevant amount is recorded in the Balance Sheet. Where there is evidence that debts are unlikely to be settled, the balance of debtors is written down and a charge made to revenue for the income that might not be collected.
Where the Council acts as an agent for another party, income and expenditure are recognised only to the extent that commission is receivable by the Council for the agency services rendered or the Council incurs expenses directly on its own behalf in rendering the services.
14 4 Overheads and Support Services
Support services are operated, managed and reported as separate segments they are not apportioned across services but instead reported separately in their own right in the Comprehensive Income and Expenditure Statement. Under the Council’s current structure such costs predominantly fall within Assistant Chief Executive’s or Finance and Customer Services.
5 Debtors
Debtors are recognised when the Council has delivered or tendered a supply of goods or services. They are recognised and measured at fair value when revenue has been recognised, except for a financial asset where they form part of the asset’s carrying value (see accounting policy note 22). Amounts paid in advance of the receipt of goods/services are recognised as a prepayment.
6 Creditors Creditors are recognised when the Council receives a supply of goods or services. They are recognised and measured at fair value of the consideration payable except for a financial liability where they form part of the liability’s carrying value (see accounting policy note 22). If consideration is received but the revenue does not meet the revenue recognition criteria, a receipt in advance is recognised.
7 Tax Income (Council Tax, Residual Community Charge, National Non-
Domestic Rates and Rates
Council Tax Council tax collection is an agency arrangement. Income shown within the Comprehensive Income & Expenditure Statement is the Council’s share of the year’s accrued income. The difference between this and the amount transferred to the General Fund under statute (representing the demand on the Collection Fund for the year together with the Council’s share of the previous year’s surplus or deficit which is distributed or recovered) is taken to the Collection Fund Adjustment Account. Debtors are shown exclusive of the proportions attributable to major preceptors. National Non-Domestic Rates (NNDR) NNDR collection is an agency arrangement. Business rate income within the Comprehensive Income & Expenditure Statement is the Council’s share of the accrued business rate income for the year. The difference between this and the amount transferred to the General Fund under statute (representing the Council’s share of the estimated business rate income for the year together with the Council’s share of the previous year’s surplus or deficit which is distributed or recovered) is taken to the Collection Fund Adjustment Account. The central share (after allowable deductions) of business rate income is paid out of the Collection Fund to central government. Growth in business rate income in an Enterprise Zone area, business rate income from renewable energy schemes and from businesses in New Deal areas is wholly attributable to the Council and transferred in full to the General Fund on an accruals basis. Debtors are shown exclusive of the proportions attributable to major preceptors
8 Inventories Inventories are measured at the lower of cost and net realisable value except where acquired through a non-exchange transaction when cost is assumed to be equal to fair value at acquisition date. Inventories are measured at the lower of cost and current replacement cost where held for distribution at no charge or for a nominal charge.
15 The cost attributed to identify inventory is assigned using the first-in, first-out (FIFO) basis.
9 Work in Progress (Construction Contracts)
Where the Council acts as a contractor, if the outcome of a construction contract can be estimated reliably, the percentage of completion method is used to recognise revenue and expenses. Contract revenue is matched with the contract costs incurred in reaching the stage of completion, resulting in the reporting of revenue, expenses and surplus/deficit which can be attributed to the proportion of work completed. If the outcome cannot be estimated reliably revenue is recognised only to the extent it is probable costs will be recoverable, and costs are recognised as an expense in the period incurred. When the uncertainties no longer exist, revenue and expenses are recognised using the percentage of completion method. Should it become apparent that total costs will exceed total revenue the expected deficit on the contract is immediately expensed.
10 Cash and Cash Equivalents Cash is represented by cash in hand and deposits with financial institutions repayable without penalty on notice of not more than 24 hours. Cash equivalents are investments that mature in three months or less from the date of acquisition and that are readily convertible to known amounts of cash with insignificant risk of change in value. In the Cash Flow Statement, cash and cash equivalents are shown net of bank overdrafts that are repayable on demand and form an integral part of the Council’s cash management.
11 Provisions, Contingent Liabilities and Contingent Assets
Provisions A provision is recognised when:
- there is a present obligation (legal/constructive) as a result of a past event
- it is probable a resource outflow will be required to settle the obligation, and
- a reliable estimate of the amount can be made. For instance, the Council may be involved in a court case that could eventually result in the making of a settlement or the payment of compensation. Provisions are charged as an expense to the appropriate service line in the Comprehensive Income and Expenditure Statement in the year that the Council becomes aware of the obligation, and measured at the best estimate at the balance sheet date of the expenditure required to settle the obligation, taking into account relevant risks and uncertainties. When payments are eventually made, they are charged to the provision carried in the Balance Sheet. Estimated settlements are reviewed at each reporting date and adjusted to reflect current best estimates. Where it becomes less than probable that a transfer of economic benefits will now be required (or a lower settlement than anticipated is made), the provision is reversed and credited back to the relevant service. If some or all of the expenditure required to settle a provision is expected to be reimbursed (e.g. an insurance claim), this is recognised when it is virtually certain that if the obligation is settled reimbursement will be received. The reimbursement is
16 treated as an asset but the amount recognised does not exceed the amount of the provision. Contingent Liability A contingent liability arises where an event has taken place that gives the Council a possible obligation whose existence will only be confirmed by the occurrence or otherwise of uncertain future events not wholly within the control of the Council. Contingent liabilities also arise in circumstances where a provision would otherwise be made but either it is not probable that an outflow of resources will be required or the amount of the obligation cannot be measured reliably. A contingent liability is not recognised in the financial statements but disclosed as a note to the accounts. If it becomes probable that a resource outflow will be required for an item previously dealt with as a contingent liability, a provision is recognised. Contingent Asset A contingent asset arises where an event has taken place that gives the Council a possible asset whose existence will only be confirmed by the occurrence or otherwise of uncertain future events not wholly within the control of the Council. A contingent asset is not recognised in the financial statements but disclosed as a note to the accounts where it is probable that there will be an inflow of economic benefits or service potential. If it has become virtually certain an inflow will arise and the asset’s value can be measured reliably, a debtor and related revenue are recognised.
12 Reserves The Council sets aside specific amounts as usable reserves for future policy purposes or to cover contingencies. Reserves are created by appropriating amounts out of the General Fund Balance in the Movement in Reserves Statement. When expenditure to be financed from a reserve is incurred, it is charged to the appropriate service in that year to score against the Surplus/Deficit on the Provision of Services in the Comprehensive Income and Expenditure Statement. The reserve is then appropriated back into the General Fund Balance in the Movement in Reserves Statement so that there is no net charge against council tax for the expenditure. Certain unusable reserves are kept to manage the accounting processes for non-current assets, financial instruments and retirement benefits and that do not represent usable resources for the Council – these reserves are explained in the sections relating to the relevant policies.
13 Government and Non-Government Grants
Government grants and third-party contributions, including donated assets are recognised as due when there is reasonable assurance that;
- the Council will comply with the conditions attached to them
- the grants and contributions will be received Where conditions of grant remain outstanding which could give rise to grant being repaid, grant is carried in the balance sheet as grant received in advance. Conditions are stipulations that give the grant funder or donor the right to the return of their monies if it is not used for the purpose specified. Revenue grants or contributions are credited to the relevant service line within net cost of services if specific or to Taxation and Non-Specific Grant Income if general or non ring-fenced. Capital grants are credited to Taxation and Non-Specific Grant Income as general grant, but then reversed out of the General Fund Balance in the Movement in
17 Reserves Statement. Where capital grant has been recognised but has yet to be used to finance capital expenditure, it is credited to the Capital Grants Unapplied Account within reserves. Capital grant that has been used for financing purposes is transferred to the Capital Adjustment Account.
14 Non-current Assets – Property, Plant and Equipment Assets that have physical substance and are held for use in the production or supply of goods or services, for rental to others or for administrative purposes and that are expected to be used during more than one financial year are classified as Property, Plant and Equipment. Recognition Expenditure on the acquisition and creation of or which add to Property, Plant & Equipment is capitalised on an accruals basis, provided that it is probable that the future economic benefits or service potential associated with the item will flow to the Council and the cost of the item can be measured reliably. Expenditure that maintains but does not add to an asset’s potential to deliver future economic benefits or service potential (i.e. repairs and maintenance) is charged as an expense when it is incurred.
Measurement Assets are initially measured at cost, comprising:
- the purchase price
- any costs attributable to bringing the asset to the location and condition necessary for it to be capable of operating in the manner intended by management
- the initial estimate of the costs of dismantling, removing or restoring an asset where the Council has an obligation to do so and is required to make provision for these costs
Borrowing Costs - The Council has adopted a policy under IAS 23 ‘Borrowing Costs’ to capitalise borrowing costs directly attributable to the acquisition, construction or production of a qualifying asset. In implementing a policy of capitalisation of borrowing costs the Council has determined what it sees as a qualifying asset and what the borrowing costs are, that are to be capitalised.
- Qualifying Assets – Assets that take a substantial period of time to get ready for their intended use or sale, where this would cause a significant balance of borrowing costs to accrue.
- Borrowing costs – Where the Council borrows to specifically fund a scheme the amount that is capitalised is the actual cost of borrowing less investment income. Where funds are borrowed generally a capitalisation rate is used based on the weighted average of borrowing costs during the period.
The Council only capitalises borrowing costs when in addition to the above it becomes probable that the capital expenditure will result in future economic benefits or service potential to the Council; and that the borrowing costs can be measured reliably. The cost of assets acquired other than by purchase is deemed to be its fair value, unless the acquisition will not increase the cash flows of the Council. In the latter case, the cost of the acquisition is the carrying amount of the asset given up by the Council. Donated assets are measured initially at fair value. The difference between fair value and any consideration paid is credited to the Taxation and Non-Specific Grant Income line of the Comprehensive Income and Expenditure Statement, unless the donation has been made conditionally. Until conditions are satisfied, the gain is held in the
18 Donated Assets Account. Where gains are credited to the Comprehensive Income and Expenditure Statement, they are reversed out of the General Fund Balance to the Capital Adjustment Account in the Movement in Reserves Statement. Assets are then carried in the Balance Sheet using the following measurement bases:
- infrastructure, community assets and assets under construction – depreciated historical cost
- dwellings – current value based on existing use value for social housing (EUV-SH)
- all other assets – current value based on existing use (existing use value – EUV) for non-specialised operational assets where there is an active market or where there is no market-based evidence of current value because of the specialist nature of an asset, depreciated replacement cost.
Depreciated historical cost is used as a proxy for current value for relatively short life assets such as vehicles, plant and equipment. Assets included in the Balance Sheet at current value are revalued sufficiently regularly to ensure that their carrying amount is not materially different from their current value at the year-end, but as a minimum every five years. In support of this the Council carries out an annual review of its assets for impairment. Increases in valuations are matched by credits to the Revaluation Reserve to recognise unrealised gains unless they reverse a previous revaluation or impairment loss in which case they are credited to the relevant service line within net cost of services. Where decreases in value are identified, the revaluation loss is accounted for by:
- where there is a balance of revaluation gains for the asset in the Revaluation Reserve, the carrying amount of the asset is written down against that balance (up to the amount of the accumulated gains)
- where there is no balance in the Revaluation Reserve or an insufficient balance, the carrying amount of the asset is written down against the relevant service line(s) in the Comprehensive Income and Expenditure Statement
The Revaluation Reserve contains revaluation gains recognised since 1 April 2007 only, the date of its formal implementation. Gains arising before that date have been consolidated into the Capital Adjustment Account.
Impairment of Assets At the end of each reporting period an assessment takes place as to whether there is any indication that an asset may be impaired. Where indications exist and any possible differences are estimated to be material, the recoverable amount of the asset is estimated and, where this is less than the carrying amount of the asset, an impairment loss is recognised for the shortfall. Where impairment losses are identified, they are accounted for by:
- where there is a balance of revaluation gains for the asset in the Revaluation Reserve, the carrying amount of the asset is written down against that balance (up to the amount of the accumulated gains)
- where there is no balance in the Revaluation Reserve or an insufficient balance, the carrying amount of the asset is written down against the relevant service line(s) in the Comprehensive Income and Expenditure Statement
Where an impairment loss is reversed subsequently, the reversal is credited to the relevant service line(s) in the Comprehensive Income and Expenditure Statement, up to the amount of the original loss, adjusted for depreciation that would have been charged if the loss had not been recognised.
19 Disposals The carrying amount of an item is derecognised: - on disposal through, for example, sale, donation granting of a finance lease or
transfer, or
- when no future economic benefits or service potential are expected from its use or disposal as a result, for example, of it being abandoned, scrapped or decommissioned.
When it becomes probable that the carrying amount of an asset will be recovered principally through a sale transaction rather than through its continuing use, it is reclassified as an Asset Held for Sale. The asset is revalued immediately before reclassification and then carried at the lower of this amount and fair value less costs to sell. Fair Value is the price that would be received from the selling the asset in an orderly transaction between market participants under the conditions prevailing at the end of the reporting period. Fair value for social housing being disposed of under Right to Buy (RTB) legislation is the discounted RTB value. Depreciation is not charged on Assets Held for Sale. Assets held solely for capital appreciation purposes are classified as investment properties. Non-operational property, plant and equipment which do not meet the criteria for reclassification as either Assets Held for Sale or investment properties are held within property, plant and equipment as surplus assets. Surplus assets are carried in the balance sheet at their existing use value and revalued immediately prior to disposal if the current carrying value is materially different in order that the proper gain or loss on disposal can be determined. Assets that are to be abandoned or scrapped are not reclassified as Assets Held for Sale. When an asset is disposed of or decommissioned, the carrying amount of the asset in the Balance Sheet (whether Property, Plant and Equipment or Assets Held for Sale) is written off to the Other Operating Expenditure line in the Comprehensive Income and Expenditure Statement as part of the gain or loss on disposal. Receipts from disposals (if any) are credited to the same line in the Comprehensive Income and Expenditure Statement also as part of the gain or loss on disposal (i.e. netted off against the carrying value of the asset at the time of disposal). Any revaluation gains accumulated for the asset in the Revaluation Reserve are transferred to the Capital Adjustment Account. Amounts received for a disposal in excess of £10,000 are categorised as capital receipts. A proportion of receipts relating to housing disposals (75% for dwellings, 50% for land and other assets, net of statutory deductions and allowances) is payable to the Government. The balance of receipts is required to be credited to the Capital Receipts Reserve, and can then only be used for new capital investment or set aside to reduce the Council’s underlying need to borrow (the Capital Financing Requirement). Receipts are appropriated to the Reserve from the General Fund Balance in the Movement in Reserves Statement. The written-off value of disposals is not a charge against council tax, as the cost of Non-Current Assets is fully provided for under separate arrangements for capital financing. Amounts are appropriated to the Capital Adjustment Account from the General Fund Balance in the Movement in Reserves Statement.
Depreciation Depreciation is provided for on all Property, Plant and Equipment assets by the systematic allocation of their depreciable amounts over their useful lives, the depreciable amount being an asset’s depreciated historic cost or fair value at the start
20 of the financial year. No depreciation is charged in the year in which an asset is first made ready for use. A charge is made in the year in which an asset is derecognised or classified as held for sale. An exception is made for assets without a determinable finite useful life (i.e., freehold land and certain Community Assets) and assets that are not yet available for use (i.e., assets under construction). Depreciation is calculated on the following bases: - dwellings and other buildings – straight-line allocation over the useful life of the
property as estimated by the Council’s valuer (Council dwellings 30 Years or now notional Major Repairs Allowance (MRA) if notional MRA reasonably reflects the annual cost of maintaining property in its current condition over a thirty-year period, other buildings and non-operational properties up to 100 years)
- vehicles – a reducing balance method over the useful life of the asset, as advised by a suitably qualified officer (Up to 10 years)
- infrastructure – straight-line allocation over 40 years
- plant, equipment and computers – straight-line allocation over the useful life of the asset as advised by a suitably qualified officer (plant and equipment up to 15 years and computers/office equipment up to 10 years).
Where an item of Property, Plant and Equipment asset has major components whose cost is significant in relation to the total cost of the item, the components are depreciated separately. Componentisation is being introduced with effect from 1 April 2010 as assets are acquired, enhanced, replaced or revalued. Revaluation gains are also depreciated, with an amount equal to the difference between current value depreciation charged on assets and the depreciation that would have been chargeable based on their historical cost being transferred each year from the Revaluation Reserve to the Capital Adjustment Account.
15 Charges to Revenue for Non-Current Assets Services, support services and trading accounts are debited with the following amounts to record the cost of holding Non-Current Assets during the year:
- depreciation attributable to the assets used by the relevant service
- revaluation and impairment losses on assets used by the service where there are no accumulated gains in the Revaluation Reserve against which the losses can be written off
- amortisation of intangible Non-Current Assets attributable to the service. The Council is not required to raise council tax to cover depreciation, revaluation and impairment losses or amortisations. However, it is required to make an annual provision from revenue to contribute towards the reduction in its overall borrowing requirement equal to an amount calculated on a prudent basis determined by the Council in accordance with statutory guidance. This is known as the minimum revenue provision and the policy is detailed below. Depreciation, revaluation and impairment losses and amortisations are therefore replaced by the revenue provision in the General Fund Balance, by way of an adjusting transaction with the Capital Adjustment Account in the Movement in Reserves Statement. Depreciation, revaluation and impairment losses represent a “real” charge to the HRA to be met by rent payers. However, the Council has taken advantage of the transitional protection offered to housing authorities over a five year period to 2016/17, to reverse out impairment and revaluation losses relating to council dwellings and to cap the amount of depreciation charged on council dwellings at the notional Major Repairs Allowance included within the HRA Business Plan for that year. From 2017/18, depreciation, revaluation and impairment losses will be determined in accordance with the new Item 8 Credit and Item 8 Debit (General) Determination” which came into effect from 1 April 2017. That determination allows
21 the Council to reverse out impairment and revaluation gains and losses relating to both council dwellings and non-dwellings. Minimum Revenue Provision (MRP) Prudent provision (MRP) is made annually for the repayment of debt relating to capital expenditure financed by borrowing or credit arrangements. The amount charged is determined having regard to the relevant statutory requirements and related guidance on MRP issued by DCLG. The recovery of any MRP that has been overcharged in previous years will be effected by taking an MRP holiday in full or in part against future years' charges that would otherwise have been made. The MRP holiday will be taken in such a way as to ensure that the total MRP after taking the holiday will not be less than zero in any financial year.
16 Leases and Lease-Type Arrangements
Leases are classified as finance leases where the terms of the lease transfer substantially all the risks and rewards incidental to ownership of the property, plant or equipment from the lessor to the lessee. All other leases are classified as operating leases. Where a lease covers both land and buildings, the land and buildings elements are considered separately for classification. Arrangements that do not have the legal status of a lease but convey a right to use an asset in return for payment are accounted for under this policy where fulfilment of the arrangement is dependent on the use of specific assets.
(a) Finance Leases – Council as Lessee An asset held under a finance lease is recognised on the Balance Sheet at the commencement of the lease at its fair value measured at the lease’s inception (or the present value of the minimum lease payments, if lower). The asset recognised is matched by a liability for the obligation to pay the lessor. Initial direct costs of the Council are added to the carrying amount of the asset. Premiums paid on entry into a lease are applied to writing down the lease liability. Contingent rents are charged as expenses in the years in which they are incurred. Lease payments are apportioned between:
- a charge for the acquisition of the interest in the asset – applied to write down the lease liability, and
- a finance charge (debited to the Financing and Investment Income and Expenditure line in the Comprehensive Income and Expenditure Statement)
The apportionment is done in such a way as to produce a constant rate of interest on the outstanding liability in each period over the lease term An asset recognised under a finance lease is accounted for using the policies applied generally to such assets, subject to depreciation being charged over the lease term if this is shorter than the asset’s estimated useful life. The Council is not required to raise council tax to cover depreciation, revaluation and impairment losses arising on leased assets. Instead, a minimum revenue provision is made towards the deemed capital investment in accordance with statutory requirements and the Council’s policy for determining MRP. Depreciation, revaluation and impairment losses are therefore replaced by the revenue provision in the General Fund Balance, by way of an adjusting transaction with the Capital Adjustment Account in the Movement in Reserves Statement. (b) Operating Leases – Council as Lessee
22 Rentals paid under operating leases are charged to the Comprehensive Income and Expenditure Statement as an expense of the services benefitting from use of the leased property, plant or equipment. Charges are made on a straight-line basis over the life of the lease, even if this does not match the pattern of payments.
(a) Finance Leases – Council as Lessor
Where the Council grants a finance lease over an asset, the relevant asset is written out of the Balance Sheet as a disposal. At the commencement of the lease, the carrying amount of the asset in the Balance Sheet is written off to the Other Operating Expenditure line in the Comprehensive Income and Expenditure Statement as part of the gain or loss on disposal. A gain, representing the Council’s net investment in the lease, is credited to the same line in the Comprehensive Income and Expenditure Statement also as part of the gain or loss on disposal (i.e. netted off against the carrying value of the asset at the time of disposal), matched by a lease asset in the Balance Sheet.
Lease rentals receivable are apportioned between:
- an amount to write down the net investment in the lease including any premiums received, and
- finance income (credited to the Financing and Investment Income and Expenditure line in the Comprehensive Income and Expenditure Statement)
The gain credited to the Comprehensive Income and Expenditure Statement on disposal is not permitted by statute to increase the General Fund Balance and will be required to be treated as a capital receipt. Where a premium has been received, this is posted out of the General Fund Balance to the Capital Receipts Reserve in the Movement in Reserves Statement. Where the amount due in relation to the lease asset is to be settled by the payment of rentals in future financial years, this is posted out of the General Fund Balance to the Deferred Capital Receipts Reserve in the Movement in Reserves Statement. When the future rentals are paid, the element for the charge for the acquisition of the interest in the property is used to write down the lease asset. At this point, the deferred capital receipts are transferred to the Capital Receipts Reserve. The written-off value of disposals is not a charge against council tax, as the cost of Non-Current Assets is fully provided for under separate arrangements for capital financing. Amounts are appropriated from the Capital Adjustment Account to the General Fund Balance in the Movement in Reserves Statement. (b) Operating Leases – Council as Lessor
Where the Council grants an operating lease over an asset, the asset is retained in the Balance Sheet. Rental income is credited to the Other Operating Expenditure line in the Comprehensive Income and Expenditure Statement. Credits are made on a straight-line basis over the life of the lease, even if this does not match the pattern of payments. Initial direct costs incurred in negotiating and arranging the lease are added to the carrying amount of the relevant asset and charged as an expense over the lease term on the same basis as rental income.
17 PFI and PPP Arrangements
PFI and similar contracts are agreements to receive services, where the responsibility for making available the property, plant and equipment needed to provide the services passes to the PFI contractor. As the Council is deemed to control the services that are provided under its PFI schemes and as ownership of the property, plant and equipment will pass to the Council at the end of the contracts for no additional charge, the Council carries the assets used under the contracts on its Balance Sheet as part of Property, Plant and Equipment. PFI assets are initially recognised at their fair value when they are first made available for use balanced by the recognition of a liability for amounts due to the scheme operator to pay for the capital investment (this is normally based on the
23 relevant elements of capital cost in the operator’s financial model). Initial direct costs of the Council are added to the carrying amount of the asset. Any upfront contributions made by the authority to the PFI operator, either in the form of a cash lump sum or transfer of property that will not be used to provide services under the arrangement, are applied to write-down the PFI liability at the contribution’s value agreed in the operator’s financial model when the PFI asset is first made available for use. PFI assets under construction are recognised on the balance sheet where the terms and conditions of the contractual obligation are such that the economic benefit of the asset flows to the Council at that time, similar to an asset that a Council constructs or develops for its own use. PFI assets recognised on the Balance Sheet are revalued and depreciated in the same way as property, plant and equipment owned by the Council. The amounts payable to the PFI operators each year are analysed into five elements:
- fair value of the services received during the year – debited to the relevant service in the Comprehensive Income and Expenditure Statement
- finance cost – an interest charge on the outstanding Balance Sheet liability, debited to the Financing and Investment Income and Expenditure line in the Comprehensive Income and Expenditure Statement
- contingent rent – increases in the amount to be paid for the property arising during the contract, debited to the Financing and Investment Income and Expenditure line in the Comprehensive Income and Expenditure Statement
- payment towards liability – applied to write down the Balance Sheet liability due to the PFI operator (the profile of write-downs is calculated using the same principles as for a finance lease)
- lifecycle replacement costs – are accounted for as they are incurred. Where the profile of lifecycle expenditure actually incurred by the PFI operator differs significantly from the projected profile included within the PFI model adjustments are made to account for the difference. A prepayment is recognised where planned expenditure paid for through the unitary payment exceeds the actual amount incurred by the PFI operator. An additional liability is recognised where planned expenditure is less than that actually incurred. The prepayment / additional liability is carried forward in the balance sheet until the expenditure is actually incurred / settled, or , in the case of a prepayment when there is no longer an expectation that it will eventually be incurred by the PFI operator at which point it is charged to revenue. Lifecycle replacement costs which represent the refurbishment or replacement of major components are capitalised as Property, Plant and Equipment in accordance with Accounting Policy 14.
18 Investment Properties
Investment properties are those that are used solely to earn rentals and/or for capital appreciation. The definition is not met if the property is used in any way to facilitate the delivery of services or production of goods or is held for sale. Investment properties are measured initially at cost and subsequently at fair value being the price that would be received from the selling the asset in an orderly transaction between market participants under the market conditions prevailing at the end of the reporting period.. Properties are not depreciated but are revalued annually according to market conditions at the year-end. Gains and losses on revaluation are posted to the Financing and Investment Income and Expenditure line in the Comprehensive Income and Expenditure Statement. The same treatment is applied to gains and losses on disposal. Rentals received and expenditure incurred in relation to investment properties are credited/charged to the Financing and Investment Income line in the Comprehensive Income and Expenditure Statement.
24 Revaluation and disposal gains and losses are not permitted by statutory arrangements to have an impact on the General Fund Balance. The gains and losses are therefore reversed out of the General Fund Balance in the Movement in Reserves Statement and posted to the Capital Adjustment Account and (for any sale proceeds greater than £10,000) the Capital Receipts Reserve.
19 Intangible Assets
Expenditure on non-monetary assets that do not have physical substance but are controlled by the Council as a result of past events (e.g. software licences) is capitalised when it is expected that future economic benefits or service potential will flow from the intangible asset to the Council. Internally generated assets are capitalised where it is demonstrable that the project is technically feasible and is intended to be completed (with adequate resources being available) and the Council will be able to generate future economic benefits or deliver service potential by being able to sell or use the asset. Expenditure is capitalised where it can be measured reliably as attributable to the asset and is restricted to that incurred during the development phase (research expenditure is not capitalised). Expenditure on the development of websites is not capitalised if the website is solely or primarily intended to promote or advertise the Council’s goods or services. Intangible assets are measured initially at cost. Amounts are only revalued where the fair value of the assets held by the Council can be determined by reference to an active market. The depreciable amount of an intangible asset is amortised over its useful life to the relevant service line(s) in the Comprehensive Income and Expenditure Statement. An asset is tested for impairment whenever there is an indication that the asset might be impaired and any losses recognised are posted to the relevant service line(s) in the Comprehensive Income and Expenditure Statement. Any gain or loss arising on the disposal or abandonment of an intangible asset is posted to the Other Operating Expenditure line in the Comprehensive Income and Expenditure Statement. Where expenditure on intangible assets qualifies as capital expenditure for statutory purposes, amortisation, impairment losses and disposal gains and losses are not permitted to have an impact on the General Fund Balance. The gains and losses are therefore reversed out of the General Fund Balance in the Movement in Reserves Statement and posted to the Capital Adjustment Account and (for any sale proceeds greater than £10,000) the Capital Receipts Reserve.
20 Revenue Expenditure Funded from Capital under Statute
Expenditure incurred during the year that may be capitalised under statutory provisions but does not result in the creation of a non-current asset is charged as expenditure to the relevant service in the Comprehensive Income and Expenditure Statement in the year. This includes transformational expenditure on reform projects capitalised under the capital receipts flexibilities implemented with effect from 1 April 2016 under the Local Government Act 2003. Where the Council has determined to meet the cost of this expenditure from existing capital resources or by borrowing, a transfer in the Movement in Reserves Statement from the General Fund Balance to the Capital Adjustment Account then reverses out the amounts charged so that there is no impact on the level of council tax.
21 Heritage Assets Heritage assets’ principal purpose is to contribute to knowledge and culture and which are preserved in trust for future generations for their artistic, cultural, environmental, historical, scientific or technological associations. They are recognised on balance sheet at cost or value. Where they are carried at value, the most appropriate and relevant valuation method is used including, e.g., insurance values.
25 Revaluations are carried out as and when necessary in order to keep carrying values current (there is no requirement for them to be revalued at least every 5 years). . Operational heritage assets (i.e. those that are being held for their heritage characteristics, but are also used for other activities or services) are accounted for as operational assets. Depreciation is not provided on heritage assets where they have indefinite lives. Revaluation gains and losses and impairments of heritage assets are accounted for in exactly the same way as for Property, Plant and Equipment.
22 Financial Instruments Financial Assets
Financial assets are classified into two types:
- loans and receivables – assets that have fixed or determinable payments but are not quoted in an active market
- available-for-sale assets – assets that have a quoted market price and/or do not have fixed or determinable payments.
(a) Loans and Receivables Loans and receivables are recognised on the Balance Sheet when the Council becomes a party to the contractual provisions of a financial instrument. They are initially measured at fair value, this being the price that would be received in an orderly transaction between market participants on the date on which the asset is recognised. Ordinarily, this will be the transaction price, such as the principal amount of a loan advanced. Thereafter they are then measured at their amortised cost. Annual credits to the Financing and Investment Income and Expenditure line in the Comprehensive Income and Expenditure Statement for interest receivable are based on the carrying amount of the asset multiplied by the effective rate of interest for the instrument. For most of the loans that the Council has made, this means that the amount presented in the Balance Sheet is the outstanding principal receivable (plus accrued interest) and interest credited to the Comprehensive Income and Expenditure Statement is the amount receivable for the year in the loan agreement. When the Council makes loans at less than market rates (soft loans) a loss is recorded in the Comprehensive Income and Expenditure Statement (debited to the appropriate service) for the present value of the interest that will be foregone over the life of the instrument, resulting in a lower amortised cost than the outstanding principal. Interest is credited to the Financing and Investment Income and Expenditure line in the Comprehensive Income and Expenditure Statement at a marginally higher effective rate of interest than the rate receivable, with the difference serving to increase the amortised cost of the loan in the Balance Sheet. Statutory provisions require that the impact of soft loans on the General Fund Balance is the interest receivable for the financial year – the reconciliation of amounts debited and credited to the Comprehensive Income and Expenditure Statement to the net gain required against the General Fund Balance is managed by a transfer to or from the Financial Instruments Adjustment Account in the Movement in Reserves Statement. Where assets are identified as impaired because of a likelihood arising from a past event that payments due under the contract will not be made, the asset is written down and a charge made to the Financing and Investment Income and Expenditure line in the Comprehensive Income and Expenditure Statement. The impairment loss is measured as the difference between the carrying amount and the present value of the revised future cash flows discounted at the asset’s original effective interest rate. Any gains and losses that arise on the derecognition of an asset are credited/debited to the Financing and Investment Income and Expenditure line in the Comprehensive Income and Expenditure Statement.
26
(b) Available-for-Sale Assets Available-for-sale assets are recognised on the Balance Sheet when the Council becomes a party to the contractual provisions of a financial instrument and are initially measured at fair value. Where the asset has fixed or determinable payments, annual credits to the Financing and Investment Income and Expenditure line in the Comprehensive Income and Expenditure Statement for interest receivable are based on the amortised cost of the asset multiplied by the effective rate of interest for the instrument. Where there are no fixed or determinable payments, income (e.g., dividends) is credited to the Comprehensive Income and Expenditure Statement when it becomes receivable by the Council. Assets are maintained in the Balance Sheet at fair value. Fair Value is measured by reference to prevailing interest or market rates using an appropriate valuation technique.
Changes in fair value are balanced by an entry in the Available-for-Sale Reserve and the gain/loss is recognised in the Surplus/Deficit on Revaluation of Available-for –Sale Financial Assets line in the Comprehensive Income and Expenditure Statement. The exception is where impairment losses have been incurred – these are debited to the Financing and Investment Income and Expenditure line in the Comprehensive Income and Expenditure Statement, along with any net gain/loss for the asset accumulated in the Reserve. Where assets are identified as impaired because of a likelihood arising from a past event that payments due under the contract will not be made (fixed or determinable payments) or fair value falls below cost, the asset is written down and a charge made to the Financing and Investment Income and Expenditure line in the Comprehensive Income and Expenditure Statement. If the asset has fixed or determinable payments, the impairment loss is measured as the difference between the carrying amount and the present value of the revised future cash flows discounted at the asset’s original effective interest rate. Otherwise, the impairment loss is measured as any shortfall of fair value against the acquisition cost of the instrument (net of any principal repayment and amortisation). Any gains and losses that arise on the derecognition of the asset are credited/debited to the Financing and Investment Income and Expenditure line in the Comprehensive Income and Expenditure Statement, along with any accumulated gains/losses previously recognised in the Available for Sale Reserve. Where fair value cannot be measured reliably, the instrument is carried at cost (less any impairment losses) Financial Liabilities Financial liabilities are recognised on the Balance Sheet when the Council becomes a party to the contractual provisions of a financial instrument and are initially measured at fair value this being the price that would be paid in an orderly transaction between market participants on the date on which the liability is recognised. Ordinarily, this will be the transaction price, such as the principal amount of a loan received. Thereafter they are carried at their amortised cost. Annual charges to the Financing and Investment Income and Expenditure line in the Comprehensive Income and Expenditure Statement for interest payable are based on the carrying amount of the liability, multiplied by the effective rate of interest for the instrument. The effective interest rate is the rate that exactly discounts estimated future cash payments over the life of the instrument to the amount at which it was originally recognised. For most of the borrowings that the Council has, this means that the amount presented in the Balance Sheet is the outstanding principal repayable (plus accrued interest) and interest charged to the Comprehensive Income and Expenditure Statement is the amount payable for the year according to the loan agreement.
27 The amount of interest charged to the HRA is determined on a fair and equitable share basis by reference to the HRA’s Capital Financing Requirement.
Gains and losses on the repurchase or early settlement of borrowing are credited and debited to the Financing and Investment Income and Expenditure line in the Comprehensive Income and Expenditure Statement in the year of repurchase/settlement. However, where repurchase has taken place as part of a restructuring of the loan portfolio that involves the modification or exchange of existing instruments, the premium or discount is respectively deducted from or added to the amortised cost of the new or modified loan and the write-down to the Comprehensive Income and Expenditure Statement is spread over the life of the loan by an adjustment to the effective interest rate. Where premiums and discounts have been charged to the Comprehensive Income and Expenditure Statement, regulations allow the impact on the General Fund Balance to be spread over future years. The reconciliation of amounts charged to the Comprehensive Income and Expenditure Statement to the net charge required against the General Fund Balance is managed by a transfer to or from the Financial Instruments Adjustment Account in the Movement in Reserves Statement.
Where the Council has entered into financial guarantees that are not required to be accounted for as financial instruments they are reflected in the Statement of Accounts to the extent that provisions might be required or a contingent liability note is needed under the policies set out in the section on Provisions, Contingent Liabilities and Contingent Assets.
23 Employee Benefits
Benefits Payable During Employment Short-term employee benefits (those that fall due wholly within 12 months of the year-end), such as wages and salaries, paid annual leave and paid sick leave, bonuses and non-monetary benefits for current employees, are recognised as an expense in the year in which employees render service to the Council. An accrual is made against services in the Surplus or Deficit on the Provision of Services for the cost of holiday entitlements and other forms of leave earned by employees but not taken before the year-end and which employees can carry forward into the next financial year. The accrual is made at the remuneration rates applicable in the following financial year. Any accrual made is required under statute to be reversed out of the General Fund Balance by a credit to the Accumulating Compensated Absences Adjustment Account via the Movement in Reserves Statement. Termination Benefits Termination benefits are amounts payable as a result of a decision by the Council to terminate an officer’s employment before the normal retirement date or an officer’s decision to accept voluntary redundancy and are charged on an accruals basis at the earlier of when the Council can no longer withdraw an offer of those benefits or when the Council recognises the cost of restructuring. . Redundancy payments are charged to the relevant service line in the Comprehensive Income and Expenditure Statement. Pension strain costs are charged to Non Distributed Costs in accordance with statutory provisions which require that the General Fund be charged with the amount payable by the Council to the pension fund or pensioner in the year, not the amount calculated according to the relevant accounting standards. Post-Employment Benefits
Employees of the Council are members of three separate pension schemes:
- The National Health Service Pension Scheme, administered by the NHS Business service
28 - The Teachers’ Pension Scheme, administered by Capita Teachers’ Pensions on
behalf of the Department for Education
- The Local Government Pensions Scheme, administered by South Yorkshire Pensions Authority
All three schemes provide defined benefits to members (retirement lump sums and pensions), earned as employees worked for the Council. The arrangements for both the National Health Service and teachers’ scheme mean that liabilities for these benefits cannot be identified specifically to the Council. These schemes are therefore accounted for as if they were a defined contributions scheme – no liability for future payments of benefits is recognised in the Balance Sheet and the Public Health and Children’s and Education Service line in the Comprehensive Income and Expenditure Statements are charged with the employer’s contributions payable to the National Health Service and Teachers’ Pensions Scheme in the year. The Local Government Scheme is accounted for as a defined benefits scheme:
- The liabilities of the South Yorkshire pension fund attributable to the Council are included in the Balance Sheet on an actuarial basis using the projected unit method – i.e. an assessment of the future payments that will be made in relation to retirement benefits earned to date by employees, based on assumptions about mortality rates, employee turnover rates, etc., and projections of projected earnings for current employees.
- Liabilities are discounted to their value at current prices, using a discount rate based on the indicative rate of return on high quality corporate bonds. In determining these liabilities, an assumption has been made on the advice of our actuaries that 50% of employees retiring will take an increase in their lump sum payment on retirement in exchange for a reduction in their future annual pension
- The assets of the South Yorkshire pension fund attributable to the Council are included in the Balance Sheet at their fair value:
- The change in the net pensions liability is analysed into the following components:
- current service cost – the increase in liabilities as result of years of service earned this year – allocated in the Comprehensive Income and Expenditure Statement to the services for which the employees worked
- past service cost – the increase in liabilities arising from current year decisions as a result of a scheme amendment or curtailment whose effect relates to years of service earned in earlier years – debited to the Surplus/Deficit on the Provision of Services in the Comprehensive Income and Expenditure Statement as part of Non Distributed Costs
- net interest – interest receivable on the fair value of plan assets held at the start of the period adjusted for changes in plan assets during the year as a result of contributions and benefit payments less the interest payable on pension liabilities both determined using the discount rate based on high quality corporate bonds used to measure the defined benefit obligation at the beginning of the period – debited/credited to the Financing and Investment Income and Expenditure line in the Comprehensive Income and Expenditure Statement
- remeasurements - return on plan assets (net of admin expenses and excluding amounts included in net interest) and actuarial gains/losses that arise because events have not coincided with assumptions made at the last actuarial valuation or because the actuaries have updated their assumptions debited/credited to the Pensions reserve as Other Comprehensive Income and Expenditure
- contributions paid to the South Yorkshire pension fund – cash paid as employer’s contributions to the pension fund in settlement of liabilities; not accounted for as an expense.
29 - In relation to retirement benefits, statutory provisions require the General Fund
balance to be charged with the amount payable by the Council to the pension fund or directly to pensioners in the year, not the amount calculated according to the relevant accounting standards. In the Movement in Reserves Statement, this means that there are appropriations to and from the Pensions Reserve to remove the notional debits and credits for retirement benefits and replace them with debits for the cash paid to the pension fund and pensioners and any such amounts payable but unpaid at the year-end. The negative balance that arises on the Pensions Reserve thereby measures the beneficial impact on the General Fund of being required to account for retirement benefits on the basis of cash flows rather than as benefits are earned by employees.
Discretionary Benefits The Council also has restricted powers to make discretionary awards of retirement benefits in the event of early retirements. Any liabilities estimated to arise as a result of an award to any member of staff (including teachers) are accrued in the year of the decision to make the award and accounted for using the same policies as are applied to the Local Government Pension Scheme.
24 Repayment of Debt – Metropolitan Debt Principal repayments are based on a 10% Sinking Fund using a methodology prescribed in Statutory Instrument 1986 No. 437 and will be extinguished by 2020/21.
25 Value Added Tax (VAT) VAT payable is included only to the extent that it is irrecoverable from HM Revenue & Customs, whilst VAT receivable is excluded from income. The net amount due from/to HMRC at the end of the financial year is included within debtors or creditors.
26 Events after the Reporting Period
Events after the reporting period are those events, both favourable and unfavourable, that occur between the end of the reporting period and the date when the Statement of Accounts is authorised for issue. Two types of events can be identified:
- those that provide evidence of conditions that existed at the end of the reporting period – the Statement of Accounts is adjusted to reflect such events
- those that are indicative of conditions that arose after the reporting period – the Statement of Accounts is not adjusted to reflect such events, but where a category of events would have a material effect disclosure is made in the notes of the nature of the events and their estimated financial effect
Events taking place after the date the Strategic Director of Finance and Customer Services authorises the Accounts for issue are not reflected in the Statement of Accounts.
27 Exceptional Items When items of income and expense are material, their nature and amount is disclosed separately, either on the face of the Comprehensive Income and Expenditure Statement or in the notes to the accounts, depending on how significant the items are to an understanding of the Council’s financial performance.
28 Interests in Companies and Other Entities Where the Council exercises control, shares control or exerts a significant influence over another entity, and the Council’s interests are material in aggregate, it will prepare Group Accounts. The Council’s interest in another entity can be contractual or non-contractual, and may be evidenced by, but is not limited to, the holding of
30 equity or debt instruments in the entity as well as other forms of involvement such as the provision of funding, liquidity support, credit enhancement and guarantees. The Council has control over another entity, where it is able to direct the activities of that entity such that it is has exposure to or rights over variable returns and can use its power over the entity to affect the returns it receives. Shared control with another party or parties in a joint venture arises where decisions about activities that significantly affect returns require the unanimous consent of the parties sharing control including the Council. The Council can exert a significant influence over an associate where the Council has the power to participate in the financial and operating policy decisions of an entity which fall short of control or joint control.
The Council’s single entity financial statements include the income, expenditure, assets, liabilities, reserves and cash flows of the local Council maintained schools within the control of the Council.. Where local Council maintained schools convert to academies during the year, the assets, liabilities and reserves of the school are deconsolidated from the Council’s single entity accounts at their carrying amount at the date of conversion unless the school has a deficit for which the Council retains responsibility. The Non-Current Assets of the school are derecognised when the Council relinquishes control over school premises which it had held as a local Council maintained school through ownership, legally enforceable rights or some other means.
Interests in companies and other entities are recorded in the Council’s balance sheet as financial assets at cost, less any provision for losses.
29 Acquisitions and discontinued operations
Transfers of functions to or from other public sector bodies are accounted for with effect from the date of transfer. Assets and liabilities are transferred at their carrying value at the date of transfer unless otherwise agreed and the balance sheet restated to reflect the value of assets brought onto or removed from the balance sheet. The financial effect of functions transferred, to or from the Council are disclosed separately in the current year as “transferred in” or “transferred out” operations. The financial effect of functions transferred to another public sector body are disclosed separately in the comparative year to enable the performance of continuing operations to be compared on a like for like basis. A function in this context is an identifiable service or business operation with an integrated set of activities, staff and recognised assets and/or liabilities that are capable of being conducted and managed to achieve the objectives of that service or business operation.
Discontinued operations are activities that cease completely. Income and expenditure relating to discontinued operations are presented separately on the face of the Comprehensive Income and Expenditure Statement.
31 B) Accounting Standards issued but not yet adopted
Amendments have been made to two accounting standards that will not be adopted by the Code until 2018/19 and a further standard which will not be adopted until the 2019/20 Code. A brief description of the accounting changes and their estimated financial effect is provided.
IFRS 9 Financial Instruments IFRS9 replaces IAS39 Financial Instruments: Recognition and Measurement. It includes a single classification approach for financial assets driven by cash flow characteristics and how an instrument is managed. It is a forward looking ‘expected loss’ model for impairment rather than the current ‘incurred loss’ model. Its adoption in the 2018/19 Code will require a review of all financial assets to ensure they are categorised under the new approach. It will not be necessary to restate comparatives; all adjustments are to be made in 2018/19. It has not yet been possible to assess what the effect of these changes might be, however due to the nature of Instruments held by RMBC it is anticipated any financial impact will be minimal. IFRS 15 Revenue from Contracts with Customers IFRS 15 replaces IAS 18 Revenue and IAS 11 Construction Contracts and their associated interpretations. The core principle in IFRS 15 for local authorities is that they should recognise revenue to depict the transfer of promised goods or services to the service recipient or customer in an amount that reflects the consideration to which the authority expects to be entitled in exchange for those goods or services. At this stage it is not envisaged that this will result in material changes to the accounts, however a review will be carried out during 2018/19. IFRS 16 Leases IFRS 16 replaces IAS17 Leases, it will not be adopted until the 2019/20 Code. The key impact of IFRS 16 will be to bring most leases on balance sheet from April 2019. Transitional arrangements will cover existing contracts but these judgements will have to be made for all new contracts. Preparatory work has begun to ensure compliance with IFRS 16. Guidance on Local Authority Investments & Minimum Revenue Provision Over the past years, the economic and regulatory landscape has changed significantly, along with changes in the borrowing and investing activities of local authorities. The Ministry for Housing, Communities and Local Government (MHCLG) have therefore sought to refresh the statutory codes. The principle changes are to set a 50 year maximum asset life, for the calculation of MRP charges, LA’s can exceed this where the related debt is PFI or opinion from an appropriately qualified person states an asset will be operational for more than 50 years. The guidance has re-affirmed that net MRP charges must not be a credit. Investments Guidance will be implemented in 2018/19, and MRP changes from 2019/20, they are not expected to materially impact the Council’s accounts.
32 C) Critical Judgements in applying Accounting Policies
In applying the accounting policies set out, the Council has had to make certain judgements about complex transactions or those involving uncertainty about future events. The critical judgements made in the Statement of Accounts are:
- Back funding pension contributions - The Council is liable to make annual revenue contributions in respect of its Pension Fund deficit liabilities as specified in the actuary’s certificate of rates and contributions. Agreement was reached with South Yorkshire Pensions Authority that the amounts due in respect of 2017/18, 2018/19 and 2019/20 could be settled by way of a single payment made in April 2017. The amount settled in April 2017 in respect of 2017/18 was £7.272m, this was a discounted payment in respect of past service deficit. The discount given for doing this and has been apportioned over the three years on a pro rata basis.
- Better Care Fund – The Council entered into a partnership agreement with
Rotherham CCG in April 2015 to manage the Better Care Fund (BCF) as a pooled budget arrangement from 2015/16 onwards. A joint assessment was conducted with the CCG on how the arrangement should be accounted for by reference to the Department of Health Group Manual for Accounts 2015/16 (Chapter 3 Annex 1) and the guidance on “Pooled budgets and the Better Care Fund” produced in October 2014 by HFMA /CIPFA. In accordance with this guidance, the Council has recognised income and expenditure and assets and liabilities proportionate to the risks and rewards it enjoys. The total available BCF funding for the year was £32.389m, of which the Council was allocated and recognised in its accounts £21.486m of income and £21.672m of expenditure, resulting in an overspend of £0.186m which was approved by the BCF Board to be supported by underspends elsewhere in the BCF programme.
- Business rates appeals – The introduction of the business rates retention scheme
with effect from 1 April 2013, means that the Council shares in the risks and rewards of growth or decline in business rates income with central government and the fire authority. As a consequence the Council recognises on its balance sheet its proportion of business rates assets and liabilities including its share of refunds to business ratepayers as a result of appeal. Valuation Office statistics on appeals lodged and settled since the April 2010 rating valuation to the 2017 revaluation has been used to arrive at the best estimate of the likely level of business rate income collectable up to and including 2017/18 which may have to be refunded as a result of outstanding appeals as at 31 March 2018. Since the 2017 revaluation the appeals has process has changed resulting in the Valuation Office no longer providing the same statistics, as a result the addition to the provision for potential refunds relating to amounts billed in 2017/18 has been calculated as a percentage of the amount billed. The Council’s share of the provision for appeals £4.317m is shown as a provision in Note 36.
33 D) Assumptions made about the future and other major sources of
estimation
The Statement of Accounts contains estimated figures that are based on assumptions made by the Council about the future or that are otherwise uncertain. Estimates are made taking into account historical experience, current trends and other relevant factors. However, because balances cannot be determined with certainty, actual results could be materially different from the assumptions and estimates.
MRP As stated in Accounting Policy Note 15, the Council is required to make a prudent provision (Minimum Revenue Provision or MRP) to repay debt each year relating to capital expenditure financed by borrowing or credit arrangements. The recovery of any MRP that has been overcharged in previous years will be effected by taking an MRP holiday in full or in part against future years’ charges that would otherwise have been made. The MRP holiday will be taken in such a way as to ensure that the total MRP after taking the holiday will not be less than zero in any financial year.
Pensions liability Included in the Council’s Balance Sheet at 31 March 2018 is an estimated pensions liability of £371m. This compares to £466m at 31 March 2017 and £320m at 31 March 2016. The volatility in the amount of the liability is due to it being highly sensitive to a number of key assumptions used to determine pension fund liabilities, including the rate at which future liabilities are discounted to present value terms, the rate at which salaries are projected to increase, changes in retirement ages, mortality rates, indexation of pensions and the rate of inflation. The sensitivity analysis provided in Note 18 sets out how small changes to these key assumptions can result in a material change to the pensions liability. A firm of consulting actuaries is engaged by South Yorkshire Pensions Authority to provide expert advice about the best assumptions to be applied based on information available each year end.
Property, Plant and Equipment Assets are depreciated over useful lives that are dependent on assumptions about the level of repairs and maintenance that will be incurred in relation to individual assets. The current economic climate makes it uncertain that the authority will be able to sustain its current spending on repairs and maintenance, bringing into doubt the useful lives assigned to assets. If the useful lives of the assets reduce, depreciation increases and the carrying amount of the assets falls.
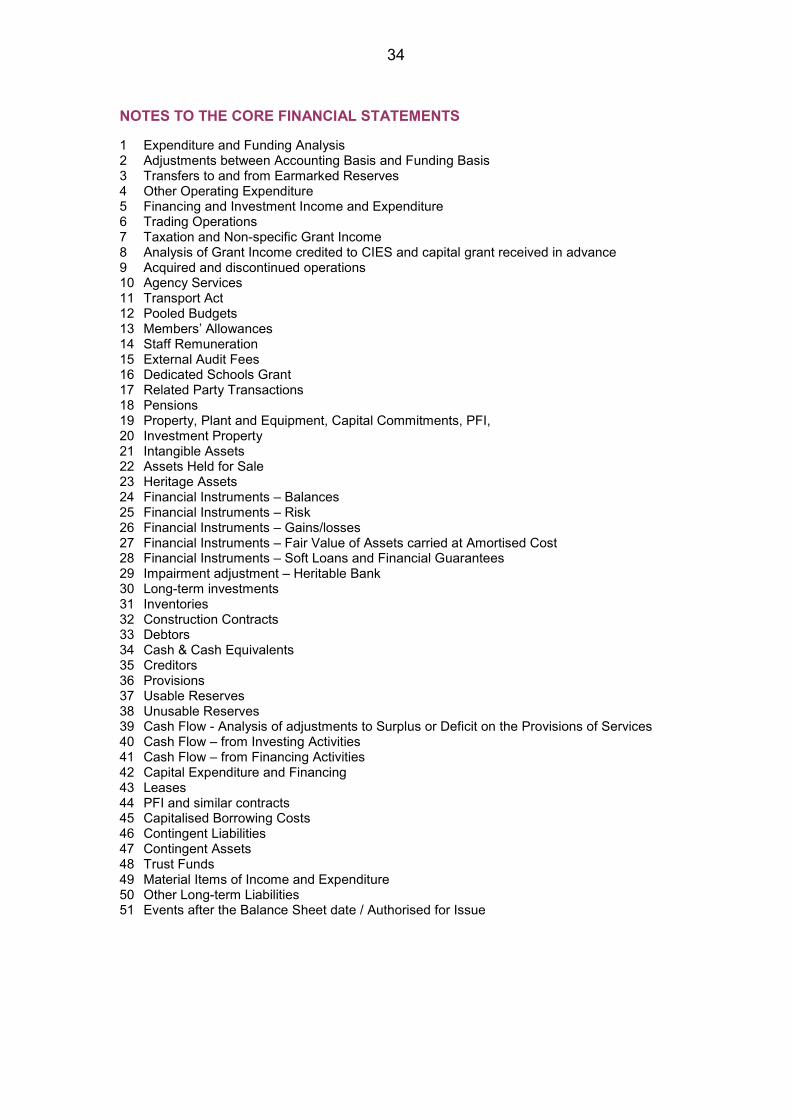
34
NOTES TO THE CORE FINANCIAL STATEMENTS 1 Expenditure and Funding Analysis 2 Adjustments between Accounting Basis and Funding Basis 3 Transfers to and from Earmarked Reserves 4 Other Operating Expenditure 5 Financing and Investment Income and Expenditure 6 Trading Operations 7 Taxation and Non-specific Grant Income 8 Analysis of Grant Income credited to CIES and capital grant received in advance 9 Acquired and discontinued operations 10 Agency Services 11 Transport Act 12 Pooled Budgets 13 Members’ Allowances 14 Staff Remuneration 15 External Audit Fees 16 Dedicated Schools Grant 17 Related Party Transactions 18 Pensions 19 Property, Plant and Equipment, Capital Commitments, PFI, 20 Investment Property 21 Intangible Assets 22 Assets Held for Sale 23 Heritage Assets 24 Financial Instruments – Balances 25 Financial Instruments – Risk 26 Financial Instruments – Gains/losses 27 Financial Instruments – Fair Value of Assets carried at Amortised Cost 28 Financial Instruments – Soft Loans and Financial Guarantees 29 Impairment adjustment – Heritable Bank 30 Long-term investments 31 Inventories 32 Construction Contracts 33 Debtors 34 Cash & Cash Equivalents 35 Creditors 36 Provisions 37 Usable Reserves 38 Unusable Reserves 39 Cash Flow - Analysis of adjustments to Surplus or Deficit on the Provisions of Services 40 Cash Flow – from Investing Activities 41 Cash Flow – from Financing Activities 42 Capital Expenditure and Financing 43 Leases 44 PFI and similar contracts 45 Capitalised Borrowing Costs 46 Contingent Liabilities 47 Contingent Assets 48 Trust Funds 49 Material Items of Income and Expenditure 50 Other Long-term Liabilities 51 Events after the Balance Sheet date / Authorised for Issue
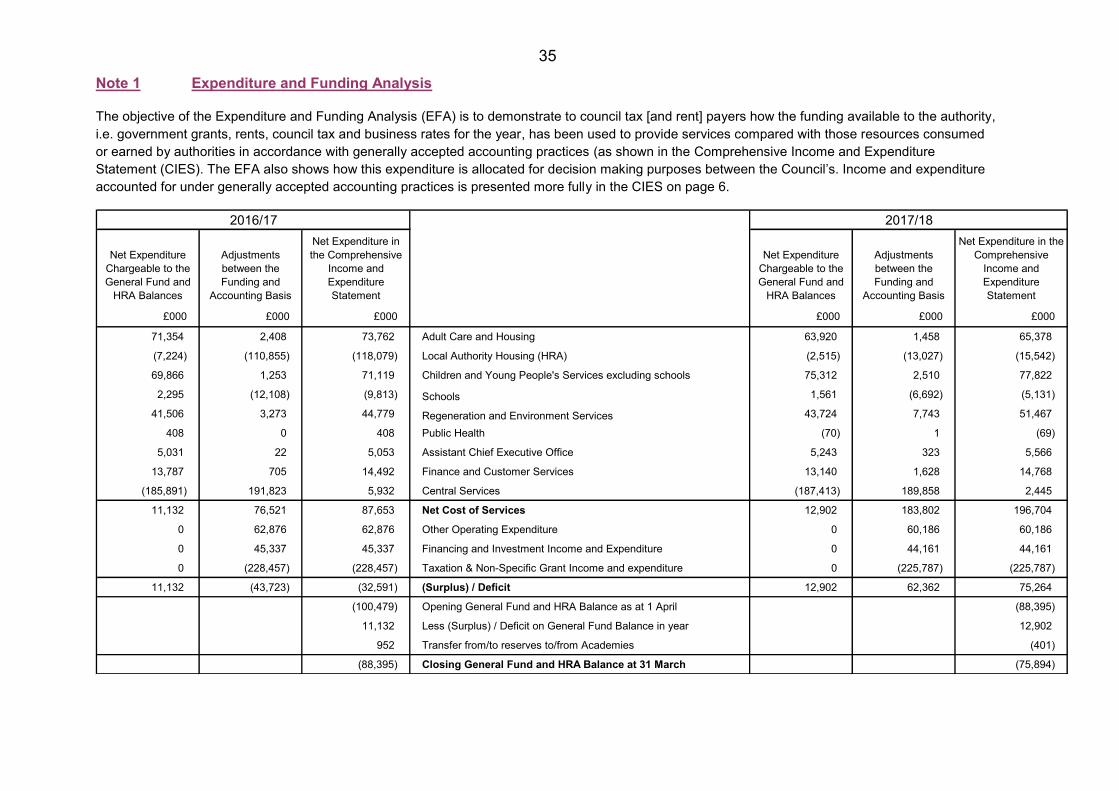
35 Note 1 Expenditure and Funding Analysis The objective of the Expenditure and Funding Analysis (EFA) is to demonstrate to council tax [and rent] payers how the funding available to the authority, i.e. government grants, rents, council tax and business rates for the year, has been used to provide services compared with those resources consumed or earned by authorities in accordance with generally accepted accounting practices (as shown in the Comprehensive Income and Expenditure Statement (CIES). The EFA also shows how this expenditure is allocated for decision making purposes between the Council’s. Income and expenditure accounted for under generally accepted accounting practices is presented more fully in the CIES on page 6.
Net Expenditure Chargeable to the General Fund and
HRA Balances
Adjustments between the Funding and
Accounting Basis
Net Expenditure in the Comprehensive
Income and Expenditure Statement
Net Expenditure Chargeable to the General Fund and
HRA Balances
Adjustments between the Funding and
Accounting Basis
Net Expenditure in the Comprehensive
Income and Expenditure Statement
£000 £000 £000 £000 £000 £000
71,354 2,408 73,762 Adult Care and Housing 63,920 1,458 65,378
(7,224) (110,855) (118,079) Local Authority Housing (HRA) (2,515) (13,027) (15,542)
69,866 1,253 71,119 Children and Young People's Services excluding schools 75,312 2,510 77,822
2,295 (12,108) (9,813) Schools 1,561 (6,692) (5,131)
41,506 3,273 44,779 Regeneration and Environment Services 43,724 7,743 51,467
408 0 408 Public Health (70) 1 (69)
5,031 22 5,053 Assistant Chief Executive Office 5,243 323 5,566
13,787 705 14,492 Finance and Customer Services 13,140 1,628 14,768
(185,891) 191,823 5,932 Central Services (187,413) 189,858 2,445
11,132 76,521 87,653 Net Cost of Services 12,902 183,802 196,704
0 62,876 62,876 Other Operating Expenditure 0 60,186 60,186
0 45,337 45,337 Financing and Investment Income and Expenditure 0 44,161 44,161
0 (228,457) (228,457) Taxation & Non-Specific Grant Income and expenditure 0 (225,787) (225,787)
11,132 (43,723) (32,591) (Surplus) / Deficit 12,902 62,362 75,264
(100,479) Opening General Fund and HRA Balance as at 1 April (88,395)
11,132 Less (Surplus) / Deficit on General Fund Balance in year 12,902
952 Transfer from/to reserves to/from Academies (401)
(88,395) Closing General Fund and HRA Balance at 31 March (75,894)
2016/17 2017/18
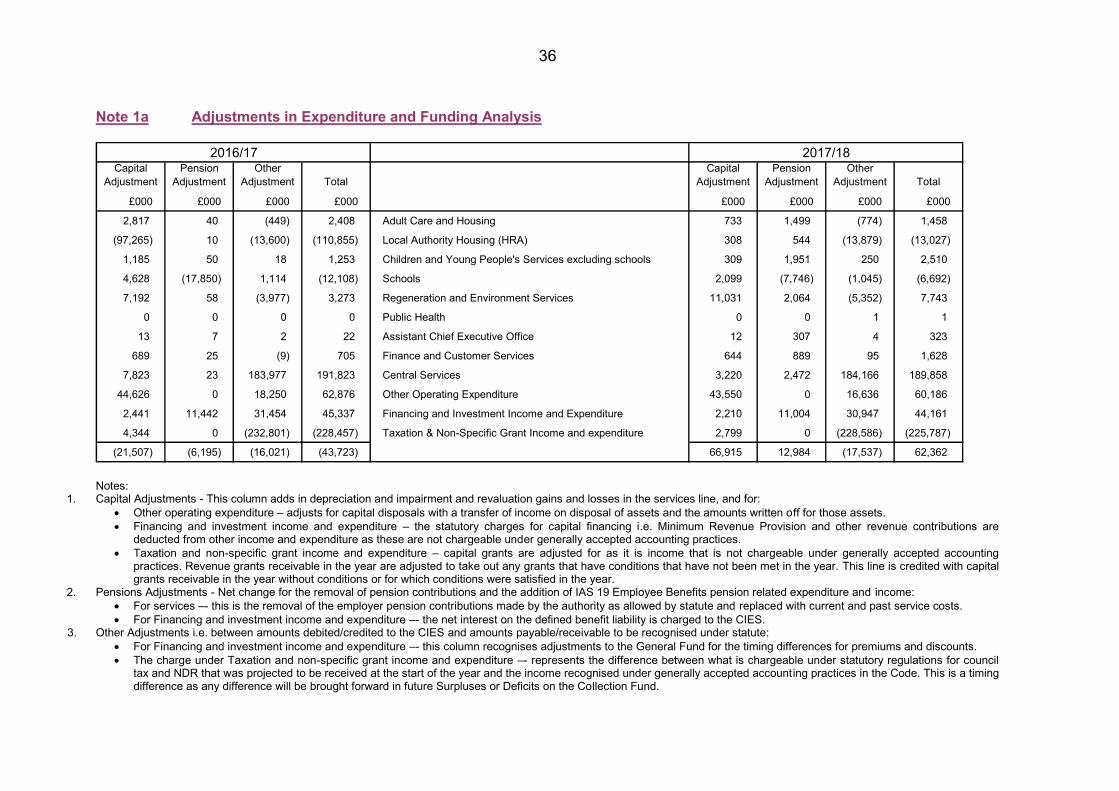
36 Note 1a Adjustments in Expenditure and Funding Analysis
Capital Adjustment
Pension Adjustment
Other Adjustment Total
Capital Adjustment
Pension Adjustment
Other Adjustment Total
£000 £000 £000 £000 £000 £000 £000 £000
2,817 40 (449) 2,408 Adult Care and Housing 733 1,499 (774) 1,458
(97,265) 10 (13,600) (110,855) Local Authority Housing (HRA) 308 544 (13,879) (13,027)
1,185 50 18 1,253 Children and Young People's Services excluding schools 309 1,951 250 2,510
4,628 (17,850) 1,114 (12,108) Schools 2,099 (7,746) (1,045) (6,692)
7,192 58 (3,977) 3,273 Regeneration and Environment Services 11,031 2,064 (5,352) 7,743
0 0 0 0 Public Health 0 0 1 1
13 7 2 22 Assistant Chief Executive Office 12 307 4 323
689 25 (9) 705 Finance and Customer Services 644 889 95 1,628
7,823 23 183,977 191,823 Central Services 3,220 2,472 184,166 189,858
44,626 0 18,250 62,876 Other Operating Expenditure 43,550 0 16,636 60,186
2,441 11,442 31,454 45,337 Financing and Investment Income and Expenditure 2,210 11,004 30,947 44,161
4,344 0 (232,801) (228,457) Taxation & Non-Specific Grant Income and expenditure 2,799 0 (228,586) (225,787)
(21,507) (6,195) (16,021) (43,723) 66,915 12,984 (17,537) 62,362
2016/17 2017/18
Notes:
1. Capital Adjustments - This column adds in depreciation and impairment and revaluation gains and losses in the services line, and for: Other operating expenditure – adjusts for capital disposals with a transfer of income on disposal of assets and the amounts written off for those assets. Financing and investment income and expenditure – the statutory charges for capital financing i.e. Minimum Revenue Provision and other revenue contributions are
deducted from other income and expenditure as these are not chargeable under generally accepted accounting practices. Taxation and non-specific grant income and expenditure – capital grants are adjusted for as it is income that is not chargeable under generally accepted accounting
practices. Revenue grants receivable in the year are adjusted to take out any grants that have conditions that have not been met in the year. This line is credited with capital grants receivable in the year without conditions or for which conditions were satisfied in the year.
2. Pensions Adjustments - Net change for the removal of pension contributions and the addition of IAS 19 Employee Benefits pension related expenditure and income: For services –- this is the removal of the employer pension contributions made by the authority as allowed by statute and replaced with current and past service costs. For Financing and investment income and expenditure –- the net interest on the defined benefit liability is charged to the CIES.
3. Other Adjustments i.e. between amounts debited/credited to the CIES and amounts payable/receivable to be recognised under statute: For Financing and investment income and expenditure –- this column recognises adjustments to the General Fund for the timing differences for premiums and discounts. The charge under Taxation and non-specific grant income and expenditure –- represents the difference between what is chargeable under statutory regulations for council
tax and NDR that was projected to be received at the start of the year and the income recognised under generally accepted accounting practices in the Code. This is a timing difference as any difference will be brought forward in future Surpluses or Deficits on the Collection Fund.
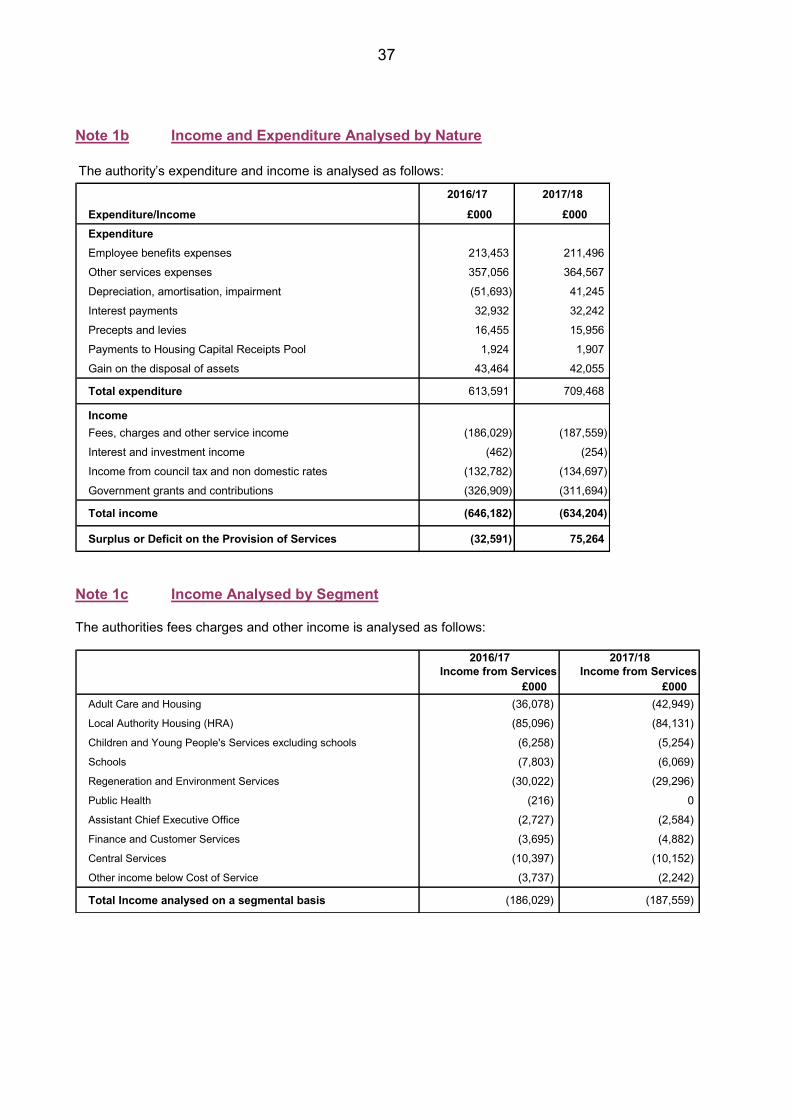
37
Note 1b Income and Expenditure Analysed by Nature The authority’s expenditure and income is analysed as follows:
2016/17 2017/18
Expenditure/Income £000 £000ExpenditureEmployee benefits expenses 213,453 211,496 Other services expenses 357,056 364,567
Depreciation, amortisation, impairment (51,693) 41,245 Interest payments 32,932 32,242 Precepts and levies 16,455 15,956 Payments to Housing Capital Receipts Pool 1,924 1,907
Gain on the disposal of assets 43,464 42,055
Total expenditure 613,591 709,468
IncomeFees, charges and other service income (186,029) (187,559)
Interest and investment income (462) (254)Income from council tax and non domestic rates (132,782) (134,697)Government grants and contributions (326,909) (311,694)
Total income (646,182) (634,204)
Surplus or Deficit on the Provision of Services (32,591) 75,264 Note 1c Income Analysed by Segment The authorities fees charges and other income is analysed as follows:
2016/17 2017/18Income from Services Income from Services
£000 £000Adult Care and Housing (36,078) (42,949) Local Authority Housing (HRA) (85,096) (84,131) Children and Young People's Services excluding schools (6,258) (5,254) Schools (7,803) (6,069) Regeneration and Environment Services (30,022) (29,296) Public Health (216) 0Assistant Chief Executive Office (2,727) (2,584) Finance and Customer Services (3,695) (4,882) Central Services (10,397) (10,152) Other income below Cost of Service (3,737) (2,242)
Total Income analysed on a segmental basis (186,029) (187,559)
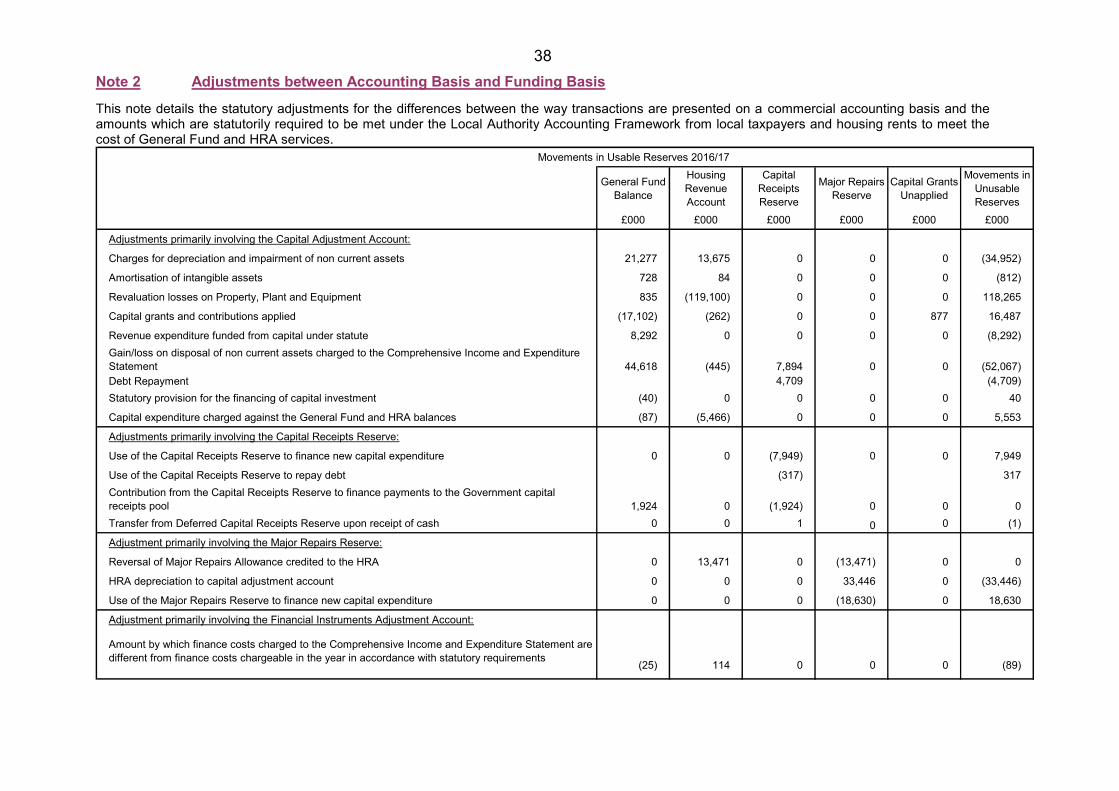
38 Note 2 Adjustments between Accounting Basis and Funding Basis This note details the statutory adjustments for the differences between the way transactions are presented on a commercial accounting basis and the amounts which are statutorily required to be met under the Local Authority Accounting Framework from local taxpayers and housing rents to meet the cost of General Fund and HRA services.
Movements in Usable Reserves 2016/17
General Fund Balance
Housing Revenue Account
Capital Receipts Reserve
Major Repairs Reserve
Capital Grants Unapplied
Movements in Unusable Reserves
£000 £000 £000 £000 £000 £000
Adjustments primarily involving the Capital Adjustment Account:
Charges for depreciation and impairment of non current assets 21,277 13,675 0 0 0 (34,952)
Amortisation of intangible assets 728 84 0 0 0 (812)
Revaluation losses on Property, Plant and Equipment 835 (119,100) 0 0 0 118,265
Capital grants and contributions applied (17,102) (262) 0 0 877 16,487
Revenue expenditure funded from capital under statute 8,292 0 0 0 0 (8,292)Gain/loss on disposal of non current assets charged to the Comprehensive Income and Expenditure Statement 44,618 (445) 7,894 0 0 (52,067)Debt Repayment 4,709 (4,709)Statutory provision for the financing of capital investment (40) 0 0 0 0 40
Capital expenditure charged against the General Fund and HRA balances (87) (5,466) 0 0 0 5,553
Adjustments primarily involving the Capital Receipts Reserve:
Use of the Capital Receipts Reserve to finance new capital expenditure 0 0 (7,949) 0 0 7,949
Use of the Capital Receipts Reserve to repay debt (317) 317Contribution from the Capital Receipts Reserve to finance payments to the Government capital receipts pool 1,924 0 (1,924) 0 0 0Transfer from Deferred Capital Receipts Reserve upon receipt of cash 0 0 1 0 0 (1)
Adjustment primarily involving the Major Repairs Reserve:
Reversal of Major Repairs Allowance credited to the HRA 0 13,471 0 (13,471) 0 0
HRA depreciation to capital adjustment account 0 0 0 33,446 0 (33,446)
Use of the Major Repairs Reserve to finance new capital expenditure 0 0 0 (18,630) 0 18,630
Adjustment primarily involving the Financial Instruments Adjustment Account:
Amount by which finance costs charged to the Comprehensive Income and Expenditure Statement are different from finance costs chargeable in the year in accordance with statutory requirements
(25) 114 0 0 0 (89)
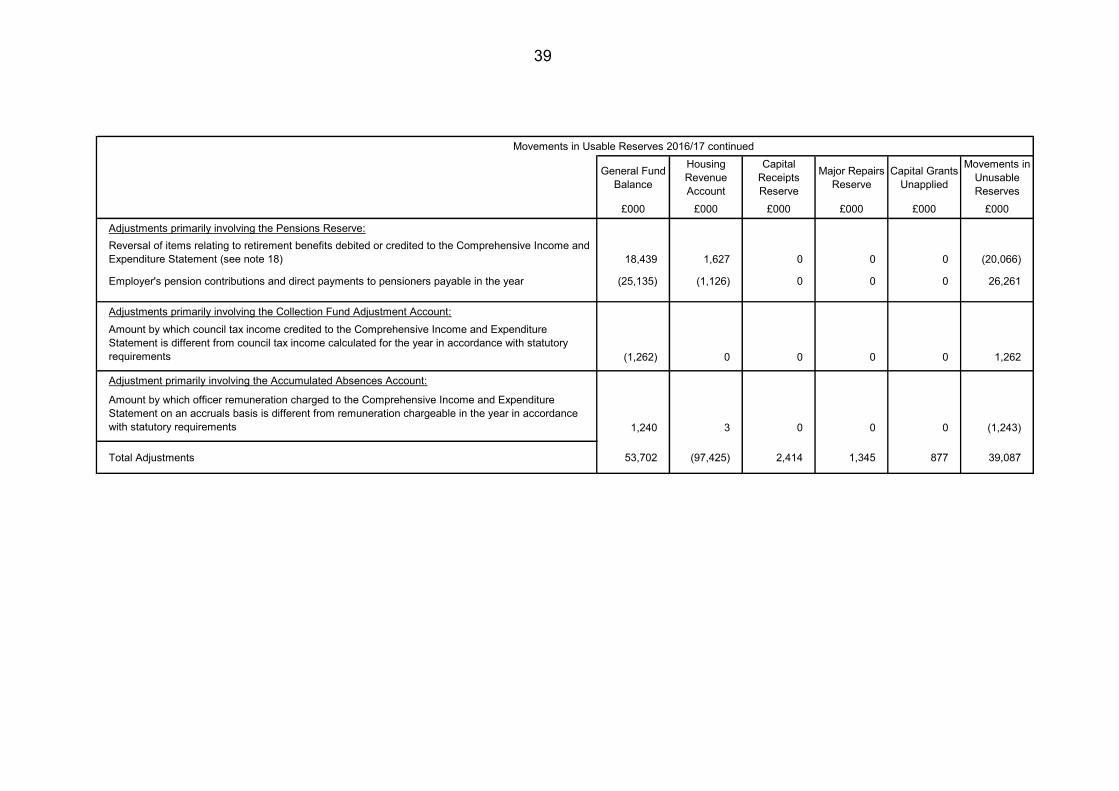
39
Movements in Usable Reserves 2016/17 continued
General Fund Balance
Housing Revenue Account
Capital Receipts Reserve
Major Repairs Reserve
Capital Grants Unapplied
Movements in Unusable Reserves
£000 £000 £000 £000 £000 £000
Adjustments primarily involving the Pensions Reserve:Reversal of items relating to retirement benefits debited or credited to the Comprehensive Income and Expenditure Statement (see note 18) 18,439 1,627 0 0 0 (20,066)
Employer's pension contributions and direct payments to pensioners payable in the year (25,135) (1,126) 0 0 0 26,261
Adjustments primarily involving the Collection Fund Adjustment Account:Amount by which council tax income credited to the Comprehensive Income and Expenditure Statement is different from council tax income calculated for the year in accordance with statutory requirements (1,262) 0 0 0 0 1,262
Adjustment primarily involving the Accumulated Absences Account:
Amount by which officer remuneration charged to the Comprehensive Income and Expenditure Statement on an accruals basis is different from remuneration chargeable in the year in accordance with statutory requirements 1,240 3 0 0 0 (1,243)
Total Adjustments 53,702 (97,425) 2,414 1,345 877 39,087
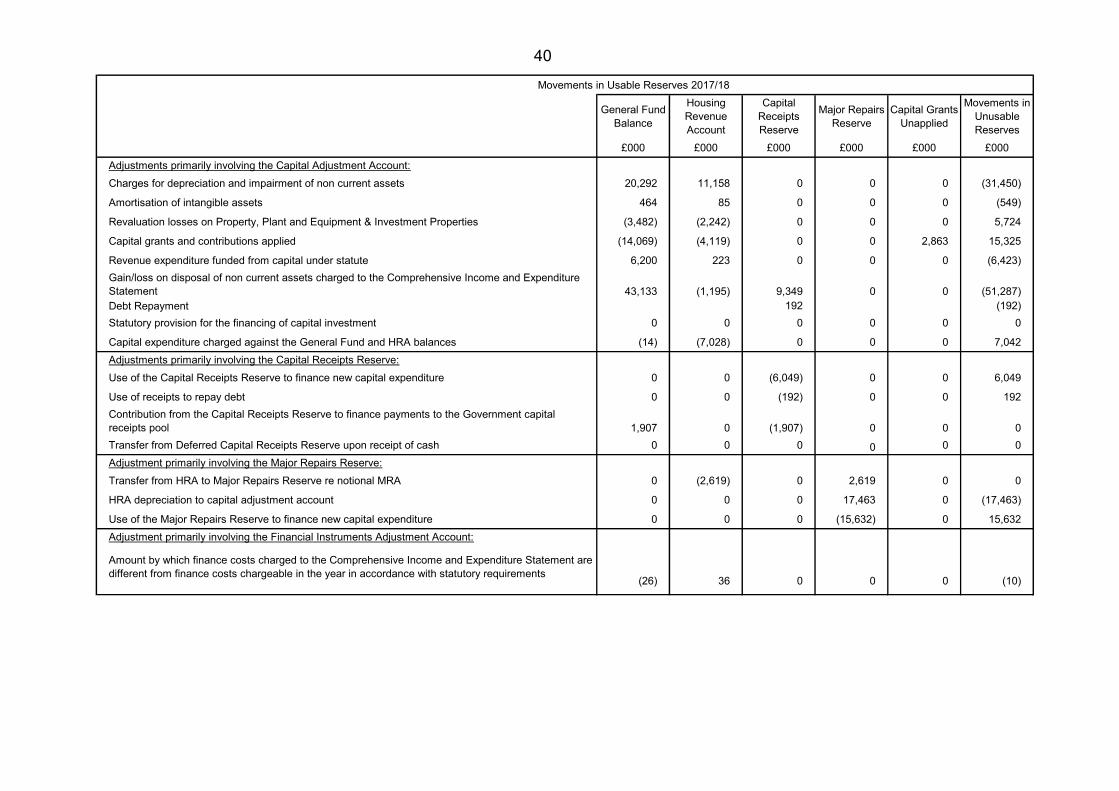
40
Movements in Usable Reserves 2017/18
General Fund Balance
Housing Revenue Account
Capital Receipts Reserve
Major Repairs Reserve
Capital Grants Unapplied
Movements in Unusable Reserves
£000 £000 £000 £000 £000 £000Adjustments primarily involving the Capital Adjustment Account:Charges for depreciation and impairment of non current assets 20,292 11,158 0 0 0 (31,450)
Amortisation of intangible assets 464 85 0 0 0 (549)
Revaluation losses on Property, Plant and Equipment & Investment Properties (3,482) (2,242) 0 0 0 5,724
Capital grants and contributions applied (14,069) (4,119) 0 0 2,863 15,325
Revenue expenditure funded from capital under statute 6,200 223 0 0 0 (6,423)Gain/loss on disposal of non current assets charged to the Comprehensive Income and Expenditure Statement 43,133 (1,195) 9,349 0 0 (51,287)Debt Repayment 192 (192)Statutory provision for the financing of capital investment 0 0 0 0 0 0
Capital expenditure charged against the General Fund and HRA balances (14) (7,028) 0 0 0 7,042Adjustments primarily involving the Capital Receipts Reserve:Use of the Capital Receipts Reserve to finance new capital expenditure 0 0 (6,049) 0 0 6,049
Use of receipts to repay debt 0 0 (192) 0 0 192Contribution from the Capital Receipts Reserve to finance payments to the Government capital receipts pool 1,907 0 (1,907) 0 0 0Transfer from Deferred Capital Receipts Reserve upon receipt of cash 0 0 0 0 0 0Adjustment primarily involving the Major Repairs Reserve:Transfer from HRA to Major Repairs Reserve re notional MRA 0 (2,619) 0 2,619 0 0
HRA depreciation to capital adjustment account 0 0 0 17,463 0 (17,463)
Use of the Major Repairs Reserve to finance new capital expenditure 0 0 0 (15,632) 0 15,632Adjustment primarily involving the Financial Instruments Adjustment Account:
Amount by which finance costs charged to the Comprehensive Income and Expenditure Statement are different from finance costs chargeable in the year in accordance with statutory requirements
(26) 36 0 0 0 (10)
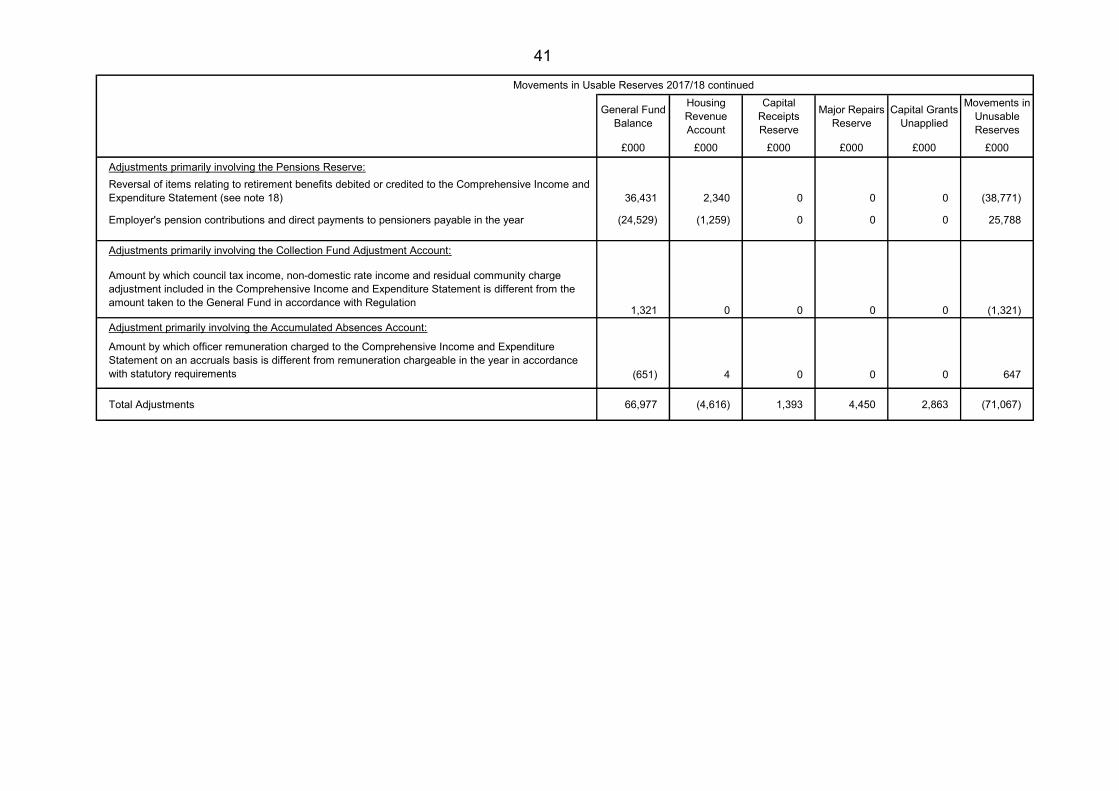
41
Movements in Usable Reserves 2017/18 continued
General Fund Balance
Housing Revenue Account
Capital Receipts Reserve
Major Repairs Reserve
Capital Grants Unapplied
Movements in Unusable Reserves
£000 £000 £000 £000 £000 £000
Adjustments primarily involving the Pensions Reserve:Reversal of items relating to retirement benefits debited or credited to the Comprehensive Income and Expenditure Statement (see note 18) 36,431 2,340 0 0 0 (38,771)
Employer's pension contributions and direct payments to pensioners payable in the year (24,529) (1,259) 0 0 0 25,788
Adjustments primarily involving the Collection Fund Adjustment Account:
Amount by which council tax income, non-domestic rate income and residual community charge adjustment included in the Comprehensive Income and Expenditure Statement is different from the amount taken to the General Fund in accordance with Regulation
1,321 0 0 0 0 (1,321)Adjustment primarily involving the Accumulated Absences Account:
Amount by which officer remuneration charged to the Comprehensive Income and Expenditure Statement on an accruals basis is different from remuneration chargeable in the year in accordance with statutory requirements (651) 4 0 0 0 647
Total Adjustments 66,977 (4,616) 1,393 4,450 2,863 (71,067)
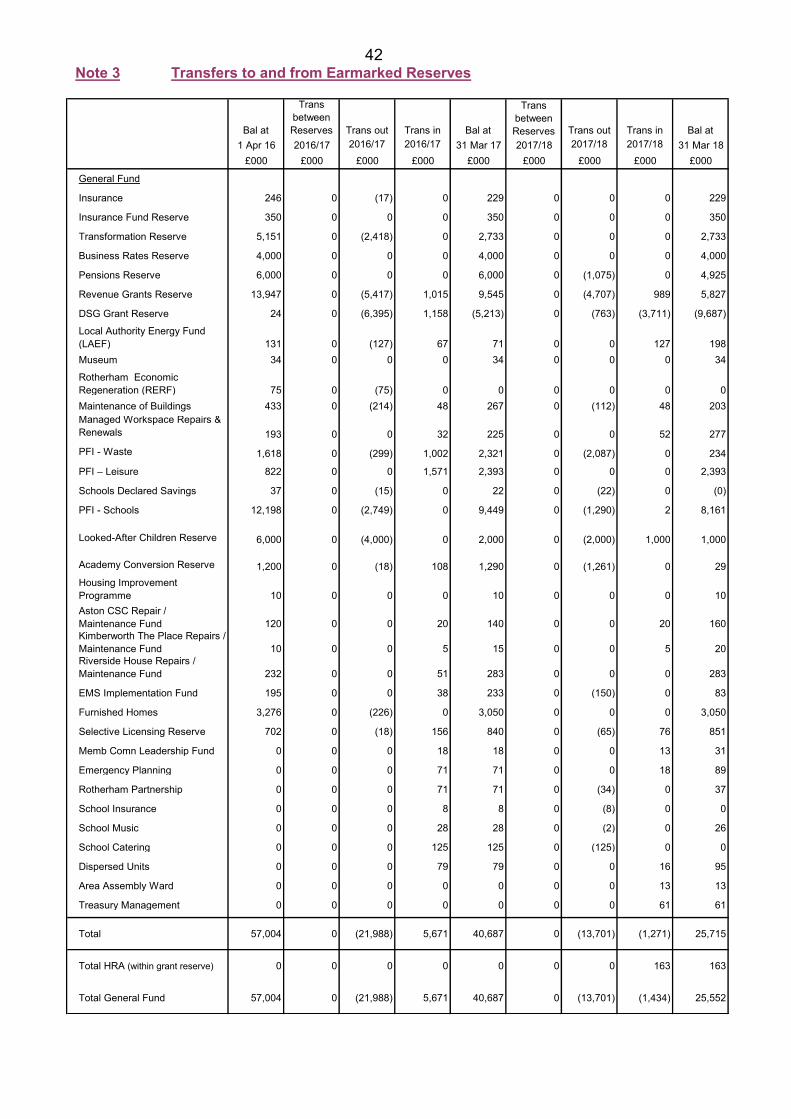
42 Note 3 Transfers to and from Earmarked Reserves
Bal at
Trans between Reserves Trans out Trans in Bal at
Trans between Reserves Trans out Trans in Bal at
1 Apr 16 2016/17 2016/17 2016/17 31 Mar 17 2017/18 2017/18 2017/18 31 Mar 18£000 £000 £000 £000 £000 £000 £000 £000 £000
General Fund
Insurance 246 0 (17) 0 229 0 0 0 229
Insurance Fund Reserve 350 0 0 0 350 0 0 0 350
Transformation Reserve 5,151 0 (2,418) 0 2,733 0 0 0 2,733
Business Rates Reserve 4,000 0 0 0 4,000 0 0 0 4,000
Pensions Reserve 6,000 0 0 0 6,000 0 (1,075) 0 4,925
Revenue Grants Reserve 13,947 0 (5,417) 1,015 9,545 0 (4,707) 989 5,827
DSG Grant Reserve 24 0 (6,395) 1,158 (5,213) 0 (763) (3,711) (9,687)
Local Authority Energy Fund (LAEF) 131 0 (127) 67 71 0 0 127 198Museum 34 0 0 0 34 0 0 0 34
Rotherham Economic Regeneration (RERF) 75 0 (75) 0 0 0 0 0 0Maintenance of Buildings 433 0 (214) 48 267 0 (112) 48 203Managed Workspace Repairs & Renewals 193 0 0 32 225 0 0 52 277
PFI - Waste 1,618 0 (299) 1,002 2,321 0 (2,087) 0 234
PFI – Leisure 822 0 0 1,571 2,393 0 0 0 2,393
Schools Declared Savings 37 0 (15) 0 22 0 (22) 0 (0)
PFI - Schools 12,198 0 (2,749) 0 9,449 0 (1,290) 2 8,161
Looked-After Children Reserve 6,000 0 (4,000) 0 2,000 0 (2,000) 1,000 1,000
Academy Conversion Reserve 1,200 0 (18) 108 1,290 0 (1,261) 0 29Housing Improvement Programme 10 0 0 0 10 0 0 0 10Aston CSC Repair / Maintenance Fund 120 0 0 20 140 0 0 20 160Kimberworth The Place Repairs / Maintenance Fund 10 0 0 5 15 0 0 5 20Riverside House Repairs / Maintenance Fund 232 0 0 51 283 0 0 0 283
EMS Implementation Fund 195 0 0 38 233 0 (150) 0 83
Furnished Homes 3,276 0 (226) 0 3,050 0 0 0 3,050
Selective Licensing Reserve 702 0 (18) 156 840 0 (65) 76 851
Memb Comn Leadership Fund 0 0 0 18 18 0 0 13 31
Emergency Planning 0 0 0 71 71 0 0 18 89
Rotherham Partnership 0 0 0 71 71 0 (34) 0 37
School Insurance 0 0 0 8 8 0 (8) 0 0
School Music 0 0 0 28 28 0 (2) 0 26
School Catering 0 0 0 125 125 0 (125) 0 0
Dispersed Units 0 0 0 79 79 0 0 16 95
Area Assembly Ward 0 0 0 0 0 0 0 13 13
Treasury Management 0 0 0 0 0 0 0 61 61
Total 57,004 0 (21,988) 5,671 40,687 0 (13,701) (1,271) 25,715
Total HRA (within grant reserve) 0 0 0 0 0 0 0 163 163
Total General Fund 57,004 0 (21,988) 5,671 40,687 0 (13,701) (1,434) 25,552
43 Earmarked General Fund Reserves This note sets out the amounts set aside from the General Fund and HRA balances in earmarked reserves to provide financing for future expenditure plans and the amounts posted back from earmarked reserves to meet expenditure in 2017/18. A brief description of the purpose of each reserve is provided as follows.
(i) Insurance Reserve
This reserve has been set up to cover claims incurred but not yet reported to the Council and not taken account of in the Insurance Provision.
(ii) Insurance Fund Reserve
The majority of this reserve relates to insurance settlement money in respect of Museum and Art Collections, with a small residual balance in respect of Leisure and Green Spaces.
(iii) Transformation Reserve
This reserve is to be used to fund costs associated with transformational change in the delivery of Council services.
(iv) Business Rates Reserve
This reserve is to cover residual risks relating to appeals, NHS trusts claim for charitable relief and business closures.
(v) Pension Reserve
The Pension Reserve is to be used to meet the Council’s pension obligations across the medium term.
(vi) Revenue Grant Reserve The Revenue Grant Reserve represents revenue grants which have been recognised within income as the grant’s terms and conditions have been met but yet to be applied. They will be used to meet future spending plans relevant to the grant.
(vii) DSG Grant Reserve The Dedicated School Grant (DSG) is a ring fenced grant for Schools. There is currently a deficit balance on the Dedicated Schools Grant, which in accordance with Government policy, can be carried forward for the deficit to be addressed in future years. Childrens’ and Young Peoples Service have implemented a plan to recover the deficit in later years
(viii) Local Authority Energy Fund (LAEF)
This reserve has been set up to provide initial investment for energy conservation work. It is anticipated that such investment will generate long term savings. Money is advanced to spending services and is repaid over a predetermined period, the repayments generating resources for further investment.
(ix) Museum
This reserve was created principally for the Rotherham Museum to enable the purchase of exhibits that come onto the market on an irregular basis.
(x) Rotherham Economic Regeneration Fund (RERF)
Set up to defray the costs associated with supporting/funding externally funded schemes across several financial years and facilitating the economic regeneration of the borough, and to allow carry forward of funds on an annual basis.
(xi) Maintenance of Buildings
Set up to defray the cost of Maintenance of Buildings across the Council by focussing on a more corporate and strategic approach.
(xii) Managed Workspace Repairs and Renewals
Set up to defray the cost of a rolling programme of maintenance on the managed workspace buildings and a programme of equipment renewal. The nature of the initial grant funding of these buildings excludes them from the programme of maintenance for other council buildings, creating the necessity for a separate reserve.
(xiii) PFI – Waste
44 This PFI arrangement will last for 25 years. The reserve recognises the fact that receipts and
payments into the reserve are smoothed out over the life of the contract so that the balance on the reserve at the end of the contract is nil.
(xiv) PFI – Leisure
This PFI arrangement will last for 33 years and 3 months. The reserve recognises the fact that receipts and payments into the reserve are smoothed out over the life of the contract so that the balance on the reserve at the end of the contract is nil.
(xv) Schools Declared Savings
Under the Council’s Scheme for the Local Management of Schools, all Primary, Secondary and Special Schools are allowed to invest, internally with the Council, sums set aside from their delegated budgets, for use in future years. Interest can be earned on such savings. These sums were initially allocated to schools as part of their formula-funded budgets and are, therefore, exclusively earmarked for use by those same schools in the future.
(xvi) PFI – Schools
This PFI arrangement will last for 30 years. The reserve recognises the fact that receipts and payments into the reserve are smoothed out over the life of the contract so that the balance on the reserve at the end of the contract is nil.
(xvii) Looked-After Children
This has been set up to support the Council’s Revenue Budget on a £3m, £2m and £1m basis over the three financial years, 2016/17 to 2018/19.
(xviii) Academy Conversion
This reserve has been created to manage the potential financial impact of schools converting to Academy status.
(xix) Housing Improvement Programme (HIP)
This reserve has been created to support HIP’s role in enabling decent affordable housing in the private sector. It covers the Works in Default Scheme.
Under the Works in Default scheme Environmental Health Officers may require private landlords to do improvements to their properties. An amount of £9,554 has been set aside in the event that landlords default in reimbursing the Council for the cost of the improvement works.
(xx) Aston CSC Repair & Maintenance Fund
This reserve has been created for agreed cyclical redecoration and major repair with NHS Rotherham.
(xxi) Kimberworth The Place Repairs & Maintenance Fund
This reserve has been created for agreed cyclical redecoration and major repair with NHS Rotherham.
(xxii) Riverside Repairs & Maintenance Fund
This reserve has been created for agreed cyclical lifecycle maintenance, major repair and redecoration of the building, in line with the Council’s obligations in respect of the lease agreement.
(xxiii) Environmental Management System (EMS) Implementation Fund
This reserve has been created to provide funding for a temporary post of Carbon Reduction Officer to work towards reducing CO2 emissions.
(xxiv) Furnished Homes Reserve
The Rotherham Furnished Homes Scheme offers a range of furniture and other household goods to tenants to assist them in establishing and sustaining their home in exchange for an additional service charge. The scheme was transferred from the HRA to the General Fund on 1 April 2014 in order to maximise the Scheme’s flexibility and capacity to respond to the changing circumstances brought about by welfare reform and the introduction in 2012/13 of HRA self-financing. The reserve is being used to provide financial resilience for the existing scheme, to support any future expansion of the service, and, to meet additional financing
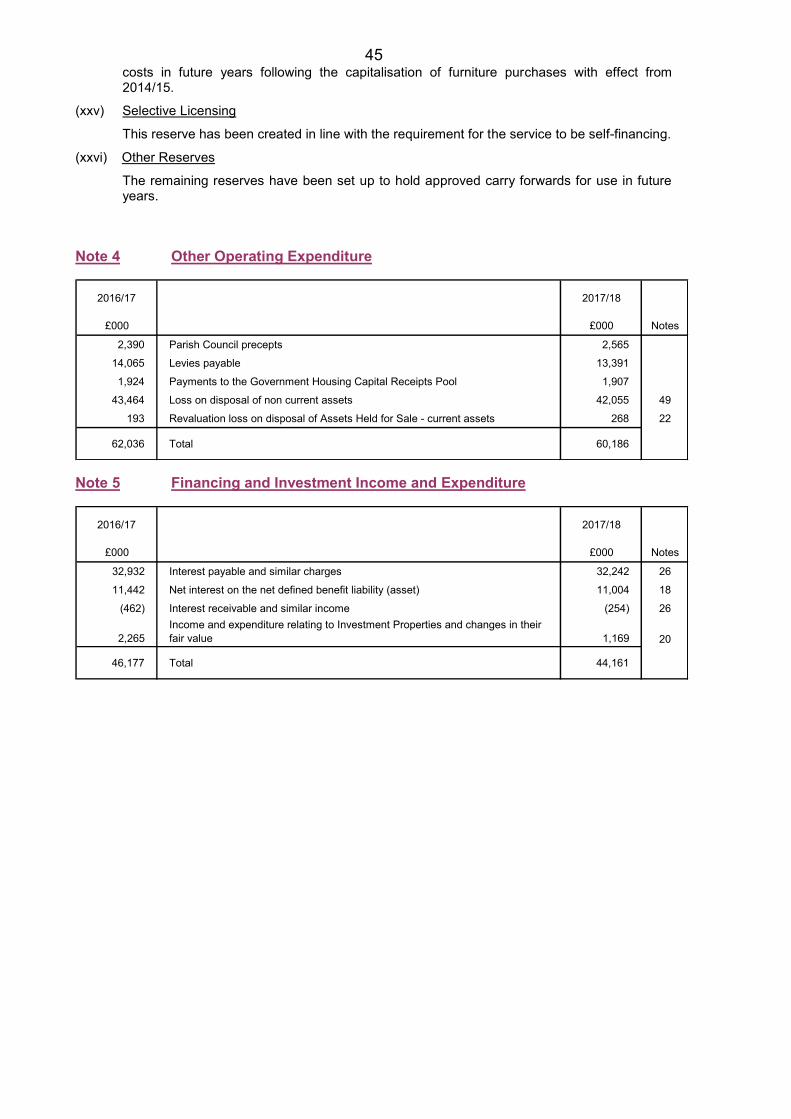
45 costs in future years following the capitalisation of furniture purchases with effect from 2014/15.
(xxv) Selective Licensing
This reserve has been created in line with the requirement for the service to be self-financing.
(xxvi) Other Reserves
The remaining reserves have been set up to hold approved carry forwards for use in future years.
Note 4 Other Operating Expenditure
2016/17 2017/18
£000 £000 Notes
2,390 Parish Council precepts 2,565
14,065 Levies payable 13,391
1,924 Payments to the Government Housing Capital Receipts Pool 1,907
43,464 Loss on disposal of non current assets 42,055 49
193 Revaluation loss on disposal of Assets Held for Sale - current assets 268 22
62,036 Total 60,186
Note 5 Financing and Investment Income and Expenditure
2016/17 2017/18
£000 £000 Notes
32,932 Interest payable and similar charges 32,242 26
11,442 Net interest on the net defined benefit liability (asset) 11,004 18
(462) Interest receivable and similar income (254) 26
2,265Income and expenditure relating to Investment Properties and changes in their fair value 1,169 20
46,177 Total 44,161
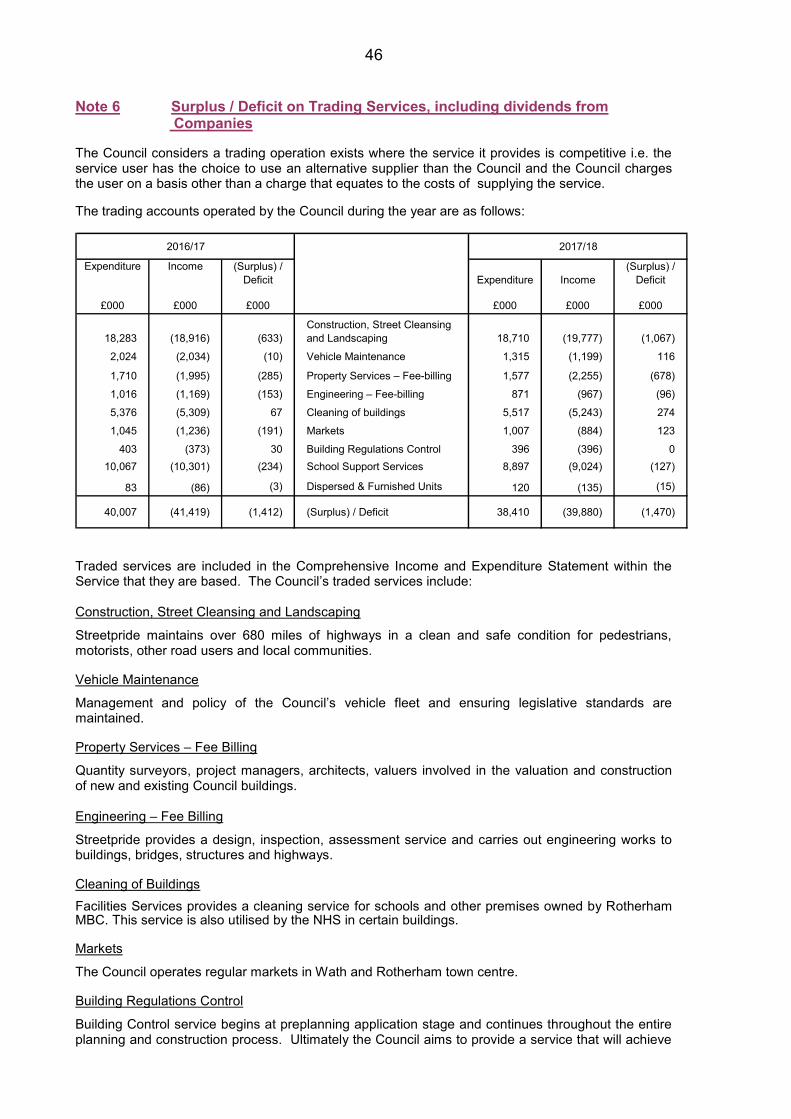
46 Note 6 Surplus / Deficit on Trading Services, including dividends from
Companies The Council considers a trading operation exists where the service it provides is competitive i.e. the service user has the choice to use an alternative supplier than the Council and the Council charges the user on a basis other than a charge that equates to the costs of supplying the service. The trading accounts operated by the Council during the year are as follows:
2016/17 2017/18
Expenditure Income (Surplus) / Deficit Expenditure Income
(Surplus) / Deficit
£000 £000 £000 £000 £000 £000
18,283 (18,916) (633)Construction, Street Cleansing and Landscaping 18,710 (19,777) (1,067)
2,024 (2,034) (10) Vehicle Maintenance 1,315 (1,199) 116
1,710 (1,995) (285) Property Services – Fee-billing 1,577 (2,255) (678)
1,016 (1,169) (153) Engineering – Fee-billing 871 (967) (96)
5,376 (5,309) 67 Cleaning of buildings 5,517 (5,243) 274
1,045 (1,236) (191) Markets 1,007 (884) 123
403 (373) 30 Building Regulations Control 396 (396) 010,067 (10,301) (234) School Support Services 8,897 (9,024) (127)
83 (86) (3) Dispersed & Furnished Units 120 (135) (15)
40,007 (41,419) (1,412) (Surplus) / Deficit 38,410 (39,880) (1,470)
Traded services are included in the Comprehensive Income and Expenditure Statement within the Service that they are based. The Council’s traded services include: Construction, Street Cleansing and Landscaping
Streetpride maintains over 680 miles of highways in a clean and safe condition for pedestrians, motorists, other road users and local communities. Vehicle Maintenance
Management and policy of the Council’s vehicle fleet and ensuring legislative standards are maintained. Property Services – Fee Billing
Quantity surveyors, project managers, architects, valuers involved in the valuation and construction of new and existing Council buildings. Engineering – Fee Billing
Streetpride provides a design, inspection, assessment service and carries out engineering works to buildings, bridges, structures and highways. Cleaning of Buildings Facilities Services provides a cleaning service for schools and other premises owned by Rotherham MBC. This service is also utilised by the NHS in certain buildings. Markets
The Council operates regular markets in Wath and Rotherham town centre. Building Regulations Control
Building Control service begins at preplanning application stage and continues throughout the entire planning and construction process. Ultimately the Council aims to provide a service that will achieve
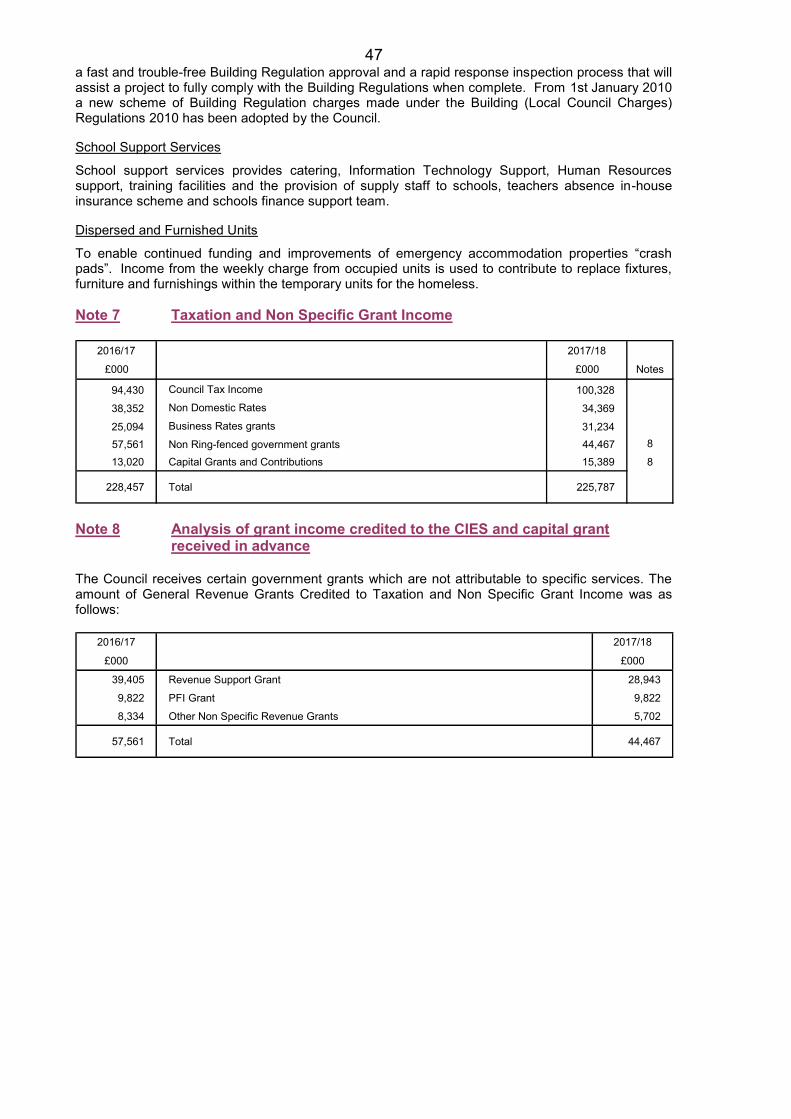
47 a fast and trouble-free Building Regulation approval and a rapid response inspection process that will assist a project to fully comply with the Building Regulations when complete. From 1st January 2010 a new scheme of Building Regulation charges made under the Building (Local Council Charges) Regulations 2010 has been adopted by the Council.
School Support Services
School support services provides catering, Information Technology Support, Human Resources support, training facilities and the provision of supply staff to schools, teachers absence in-house insurance scheme and schools finance support team. Dispersed and Furnished Units
To enable continued funding and improvements of emergency accommodation properties “crash pads”. Income from the weekly charge from occupied units is used to contribute to replace fixtures, furniture and furnishings within the temporary units for the homeless. Note 7 Taxation and Non Specific Grant Income
2016/17 2017/18
£000 £000 Notes
94,430 Council Tax Income 100,328
38,352 Non Domestic Rates 34,369
25,094 Business Rates grants 31,23457,561 Non Ring-fenced government grants 44,467 8
13,020 Capital Grants and Contributions 15,389 8
228,457 Total 225,787
Note 8 Analysis of grant income credited to the CIES and capital grant
received in advance The Council receives certain government grants which are not attributable to specific services. The amount of General Revenue Grants Credited to Taxation and Non Specific Grant Income was as follows:
2016/17 2017/18
£000 £000
39,405 Revenue Support Grant 28,943
9,822 PFI Grant 9,822
8,334 Other Non Specific Revenue Grants 5,702
57,561 Total 44,467
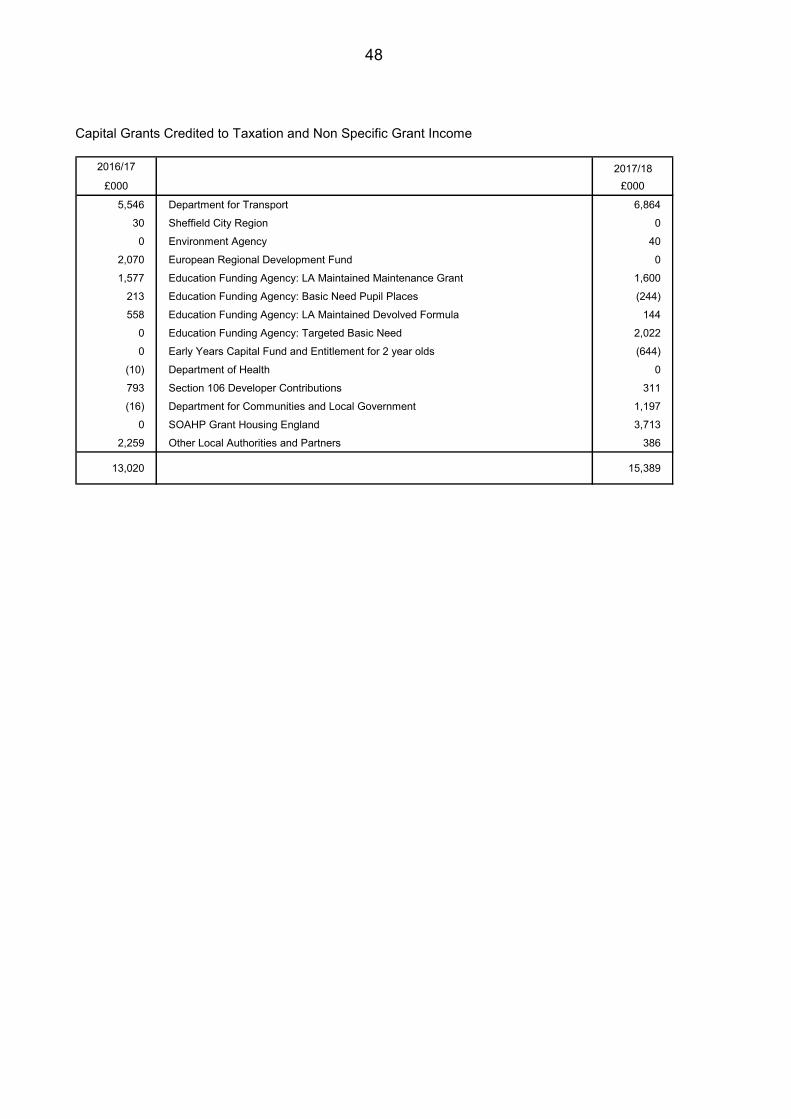
48 Capital Grants Credited to Taxation and Non Specific Grant Income
2016/17 2017/18£000 £000
5,546 Department for Transport 6,864
30 Sheffield City Region 0
0 Environment Agency 40
2,070 European Regional Development Fund 0
1,577 Education Funding Agency: LA Maintained Maintenance Grant 1,600
213 Education Funding Agency: Basic Need Pupil Places (244)
558 Education Funding Agency: LA Maintained Devolved Formula 144
0 Education Funding Agency: Targeted Basic Need 2,022
0 Early Years Capital Fund and Entitlement for 2 year olds (644)
(10) Department of Health 0
793 Section 106 Developer Contributions 311
(16) Department for Communities and Local Government 1,197
0 SOAHP Grant Housing England 3,713
2,259 Other Local Authorities and Partners 386
13,020 15,389
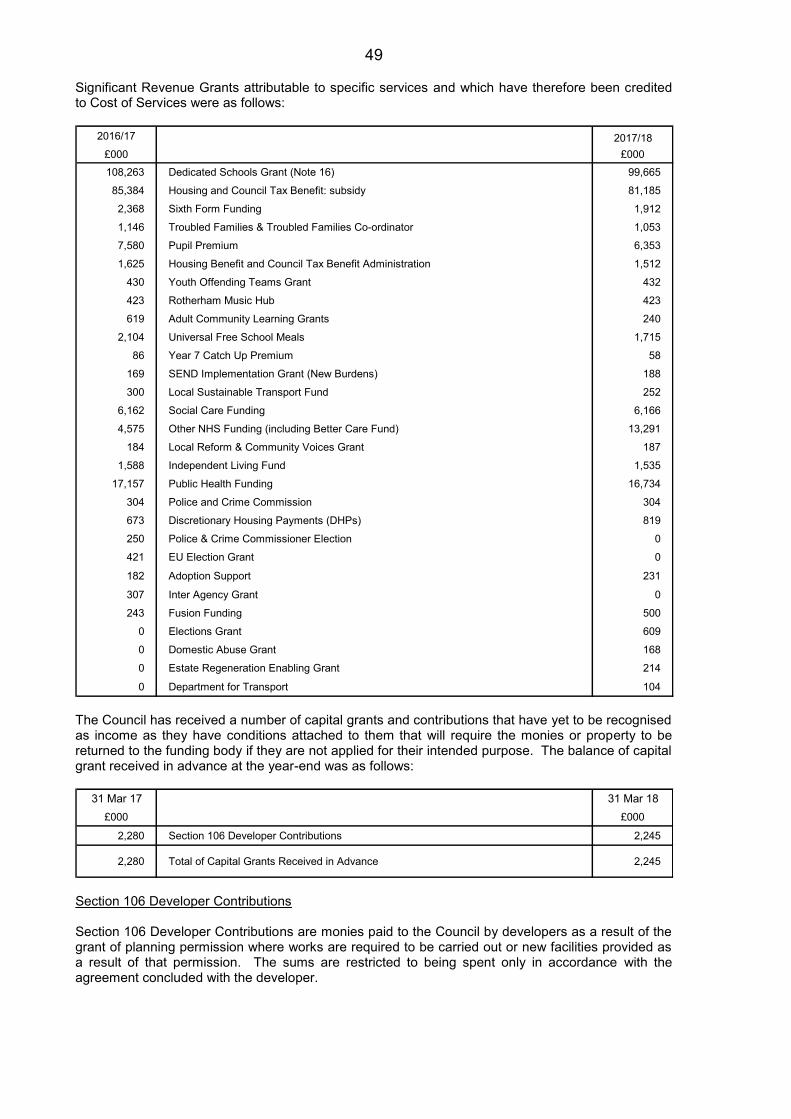
49 Significant Revenue Grants attributable to specific services and which have therefore been credited to Cost of Services were as follows:
2016/17 2017/18£000 £000108,263 Dedicated Schools Grant (Note 16) 99,665
85,384 Housing and Council Tax Benefit: subsidy 81,185
2,368 Sixth Form Funding 1,912
1,146 Troubled Families & Troubled Families Co-ordinator 1,053
7,580 Pupil Premium 6,353
1,625 Housing Benefit and Council Tax Benefit Administration 1,512
430 Youth Offending Teams Grant 432
423 Rotherham Music Hub 423
619 Adult Community Learning Grants 240
2,104 Universal Free School Meals 1,715
86 Year 7 Catch Up Premium 58
169 SEND Implementation Grant (New Burdens) 188
300 Local Sustainable Transport Fund 252
6,162 Social Care Funding 6,166
4,575 Other NHS Funding (including Better Care Fund) 13,291
184 Local Reform & Community Voices Grant 187
1,588 Independent Living Fund 1,535
17,157 Public Health Funding 16,734
304 Police and Crime Commission 304
673 Discretionary Housing Payments (DHPs) 819
250 Police & Crime Commissioner Election 0
421 EU Election Grant 0
182 Adoption Support 231
307 Inter Agency Grant 0
243 Fusion Funding 500
0 Elections Grant 609
0 Domestic Abuse Grant 168
0 Estate Regeneration Enabling Grant 214
0 Department for Transport 104
The Council has received a number of capital grants and contributions that have yet to be recognised as income as they have conditions attached to them that will require the monies or property to be returned to the funding body if they are not applied for their intended purpose. The balance of capital grant received in advance at the year-end was as follows:
31 Mar 17 31 Mar 18£000 £000
2,280 Section 106 Developer Contributions 2,245
2,280 Total of Capital Grants Received in Advance 2,245
Section 106 Developer Contributions Section 106 Developer Contributions are monies paid to the Council by developers as a result of the grant of planning permission where works are required to be carried out or new facilities provided as a result of that permission. The sums are restricted to being spent only in accordance with the agreement concluded with the developer.
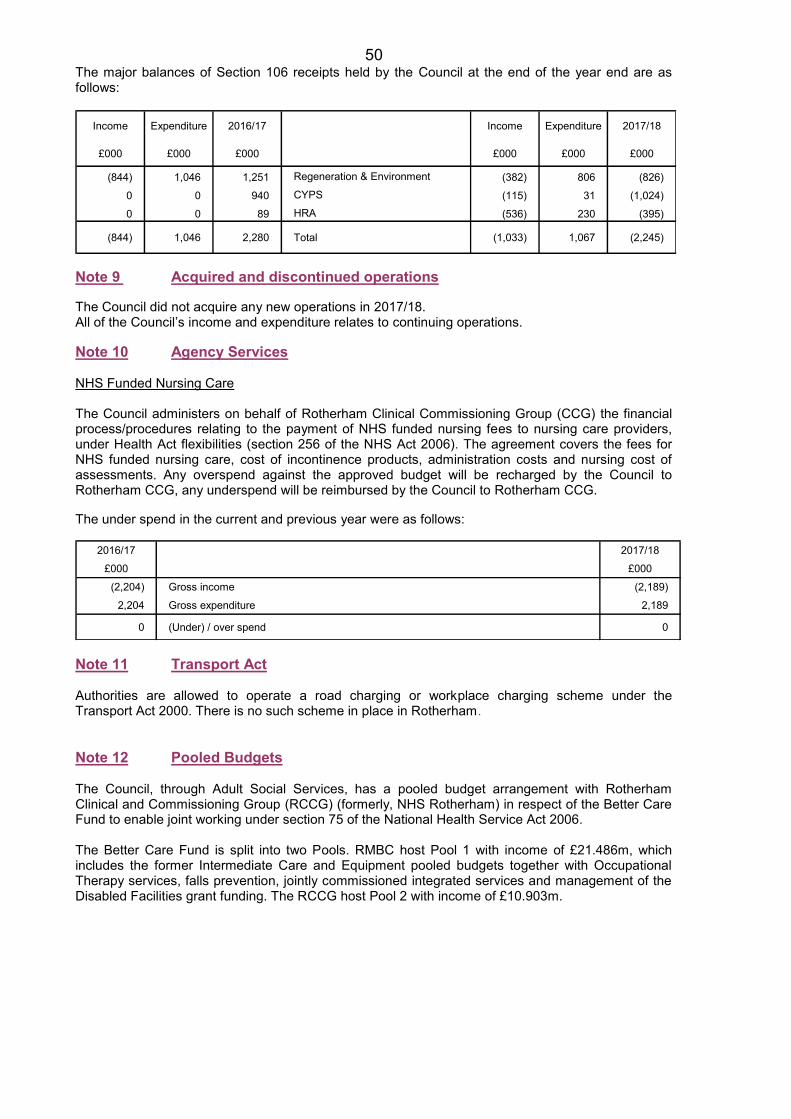
50 The major balances of Section 106 receipts held by the Council at the end of the year end are as follows:
Income Expenditure 2016/17 Income Expenditure 2017/18
£000 £000 £000 £000 £000 £000
(844) 1,046 1,251 Regeneration & Environment (382) 806 (826)
0 0 940 CYPS (115) 31 (1,024)
0 0 89 HRA (536) 230 (395)
(844) 1,046 2,280 Total (1,033) 1,067 (2,245)
Note 9 Acquired and discontinued operations The Council did not acquire any new operations in 2017/18. All of the Council’s income and expenditure relates to continuing operations. Note 10 Agency Services NHS Funded Nursing Care The Council administers on behalf of Rotherham Clinical Commissioning Group (CCG) the financial process/procedures relating to the payment of NHS funded nursing fees to nursing care providers, under Health Act flexibilities (section 256 of the NHS Act 2006). The agreement covers the fees for NHS funded nursing care, cost of incontinence products, administration costs and nursing cost of assessments. Any overspend against the approved budget will be recharged by the Council to Rotherham CCG, any underspend will be reimbursed by the Council to Rotherham CCG. The under spend in the current and previous year were as follows:
2016/17 2017/18
£000 £000
(2,204) Gross income (2,189)
2,204 Gross expenditure 2,189
0 (Under) / over spend 0
Note 11 Transport Act Authorities are allowed to operate a road charging or workplace charging scheme under the Transport Act 2000. There is no such scheme in place in Rotherham. Note 12 Pooled Budgets The Council, through Adult Social Services, has a pooled budget arrangement with Rotherham Clinical and Commissioning Group (RCCG) (formerly, NHS Rotherham) in respect of the Better Care Fund to enable joint working under section 75 of the National Health Service Act 2006. The Better Care Fund is split into two Pools. RMBC host Pool 1 with income of £21.486m, which includes the former Intermediate Care and Equipment pooled budgets together with Occupational Therapy services, falls prevention, jointly commissioned integrated services and management of the Disabled Facilities grant funding. The RCCG host Pool 2 with income of £10.903m.
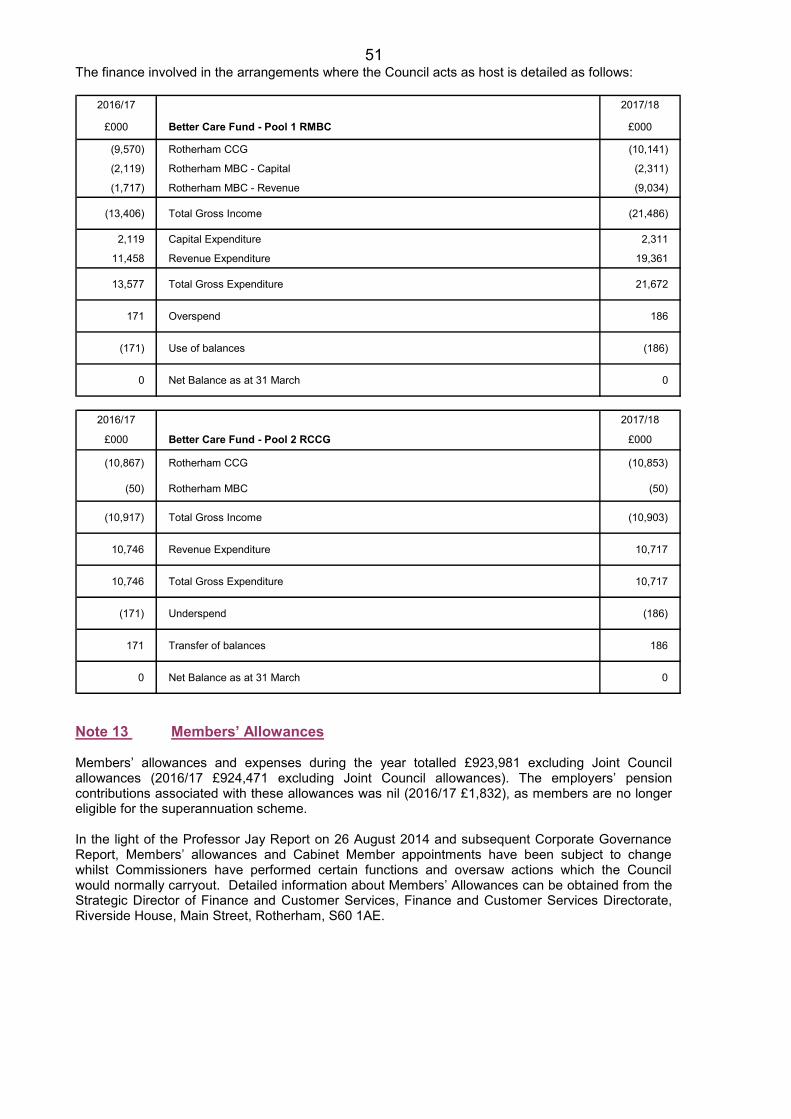
51 The finance involved in the arrangements where the Council acts as host is detailed as follows:
2016/17 2017/18
£000 Better Care Fund - Pool 1 RMBC £000
(9,570) Rotherham CCG (10,141)
(2,119) Rotherham MBC - Capital (2,311)
(1,717) Rotherham MBC - Revenue (9,034)
(13,406) Total Gross Income (21,486)
2,119 Capital Expenditure 2,311
11,458 Revenue Expenditure 19,361
13,577 Total Gross Expenditure 21,672
171 Overspend 186
(171) Use of balances (186)
0 Net Balance as at 31 March 0
2016/17 2017/18
£000 Better Care Fund - Pool 2 RCCG £000
(10,867) Rotherham CCG (10,853)
(50) Rotherham MBC (50)
(10,917) Total Gross Income (10,903)
10,746 Revenue Expenditure 10,717
10,746 Total Gross Expenditure 10,717
(171) Underspend (186)
171 Transfer of balances 186
0 Net Balance as at 31 March 0
Note 13 Members’ Allowances Members’ allowances and expenses during the year totalled £923,981 excluding Joint Council allowances (2016/17 £924,471 excluding Joint Council allowances). The employers’ pension contributions associated with these allowances was nil (2016/17 £1,832), as members are no longer eligible for the superannuation scheme. In the light of the Professor Jay Report on 26 August 2014 and subsequent Corporate Governance Report, Members’ allowances and Cabinet Member appointments have been subject to change whilst Commissioners have performed certain functions and oversaw actions which the Council would normally carryout. Detailed information about Members’ Allowances can be obtained from the Strategic Director of Finance and Customer Services, Finance and Customer Services Directorate, Riverside House, Main Street, Rotherham, S60 1AE.
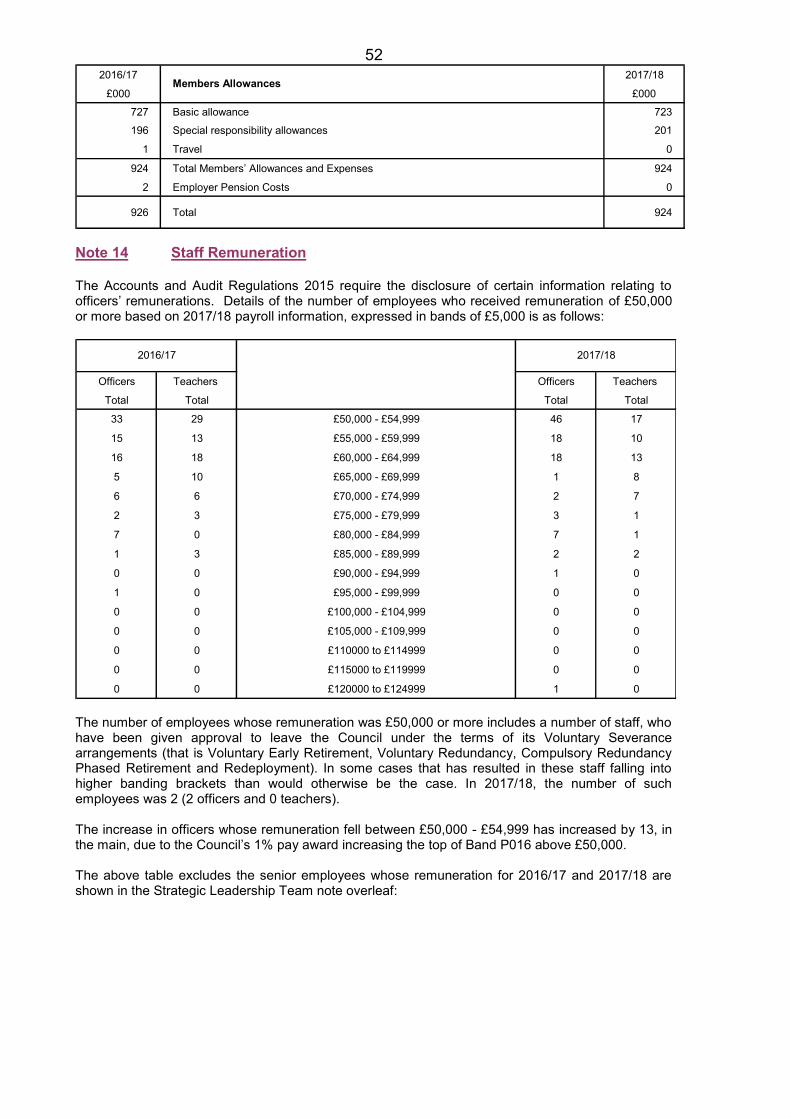
52 2016/17 2017/18
£000 £000
727 Basic allowance 723
196 Special responsibility allowances 201
1 Travel 0
924 Total Members’ Allowances and Expenses 924
2 Employer Pension Costs 0
926 Total 924
Members Allowances
Note 14 Staff Remuneration
The Accounts and Audit Regulations 2015 require the disclosure of certain information relating to officers’ remunerations. Details of the number of employees who received remuneration of £50,000 or more based on 2017/18 payroll information, expressed in bands of £5,000 is as follows:
Officers Teachers Officers Teachers
Total Total Total Total
33 29 £50,000 - £54,999 46 17
15 13 £55,000 - £59,999 18 10
16 18 £60,000 - £64,999 18 13
5 10 £65,000 - £69,999 1 8
6 6 £70,000 - £74,999 2 7
2 3 £75,000 - £79,999 3 1
7 0 £80,000 - £84,999 7 1
1 3 £85,000 - £89,999 2 2
0 0 £90,000 - £94,999 1 0
1 0 £95,000 - £99,999 0 0
0 0 £100,000 - £104,999 0 0
0 0 £105,000 - £109,999 0 0
0 0 £110000 to £114999 0 0
0 0 £115000 to £119999 0 0
0 0 £120000 to £124999 1 0
2016/17 2017/18
The number of employees whose remuneration was £50,000 or more includes a number of staff, who have been given approval to leave the Council under the terms of its Voluntary Severance arrangements (that is Voluntary Early Retirement, Voluntary Redundancy, Compulsory Redundancy Phased Retirement and Redeployment). In some cases that has resulted in these staff falling into higher banding brackets than would otherwise be the case. In 2017/18, the number of such employees was 2 (2 officers and 0 teachers). The increase in officers whose remuneration fell between £50,000 - £54,999 has increased by 13, in the main, due to the Council’s 1% pay award increasing the top of Band P016 above £50,000. The above table excludes the senior employees whose remuneration for 2016/17 and 2017/18 are shown in the Strategic Leadership Team note overleaf:
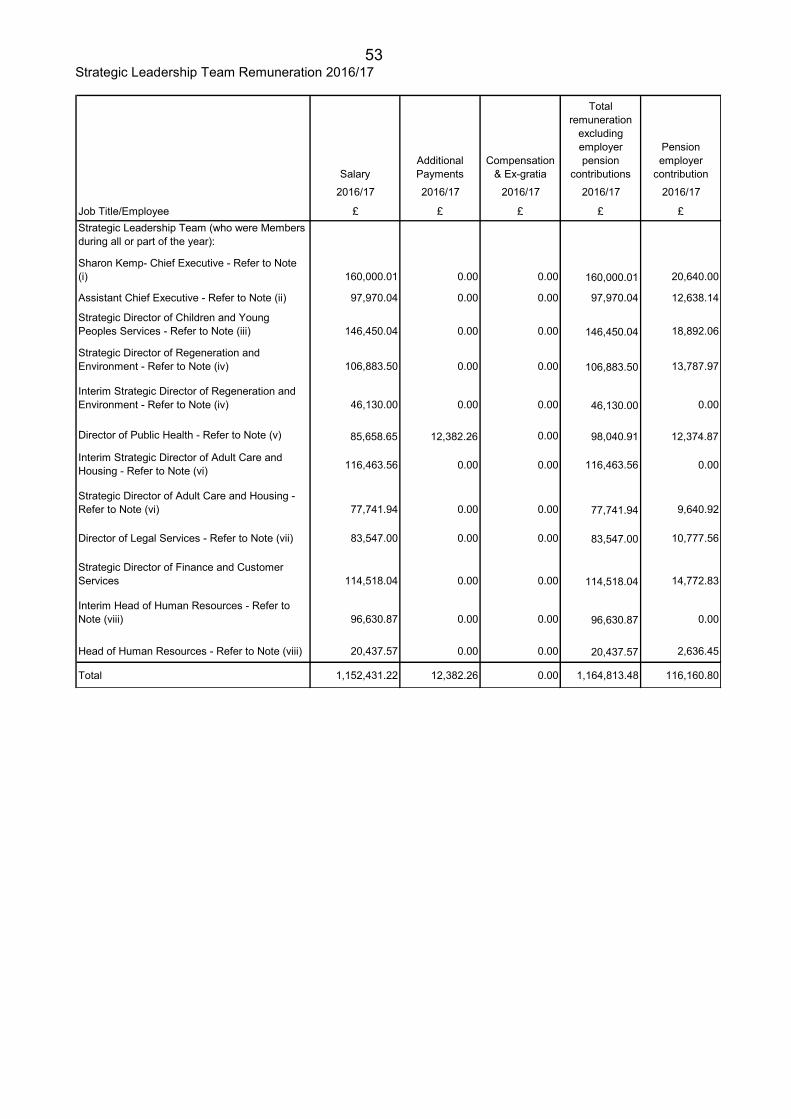
53 Strategic Leadership Team Remuneration 2016/17
SalaryAdditional Payments
Compensation & Ex-gratia
Total remuneration
excluding employer pension
contributions
Pension employer
contribution 2016/17 2016/17 2016/17 2016/17 2016/17
Job Title/Employee £ £ £ £ £Strategic Leadership Team (who were Members during all or part of the year):
Sharon Kemp- Chief Executive - Refer to Note (i) 160,000.01 0.00 0.00 160,000.01 20,640.00
Assistant Chief Executive - Refer to Note (ii) 97,970.04 0.00 0.00 97,970.04 12,638.14
Strategic Director of Children and Young Peoples Services - Refer to Note (iii) 146,450.04 0.00 0.00 146,450.04 18,892.06
Strategic Director of Regeneration and Environment - Refer to Note (iv) 106,883.50 0.00 0.00 106,883.50 13,787.97
Interim Strategic Director of Regeneration and Environment - Refer to Note (iv) 46,130.00 0.00 0.00 46,130.00 0.00
Director of Public Health - Refer to Note (v) 85,658.65 12,382.26 0.00 98,040.91 12,374.87
Interim Strategic Director of Adult Care and Housing - Refer to Note (vi) 116,463.56 0.00 0.00 116,463.56 0.00
Strategic Director of Adult Care and Housing - Refer to Note (vi) 77,741.94 0.00 0.00 77,741.94 9,640.92
Director of Legal Services - Refer to Note (vii) 83,547.00 0.00 0.00 83,547.00 10,777.56
Strategic Director of Finance and Customer Services 114,518.04 0.00 0.00 114,518.04 14,772.83
Interim Head of Human Resources - Refer to Note (viii) 96,630.87 0.00 0.00 96,630.87 0.00
Head of Human Resources - Refer to Note (viii) 20,437.57 0.00 0.00 20,437.57 2,636.45
Total 1,152,431.22 12,382.26 0.00 1,164,813.48 116,160.80
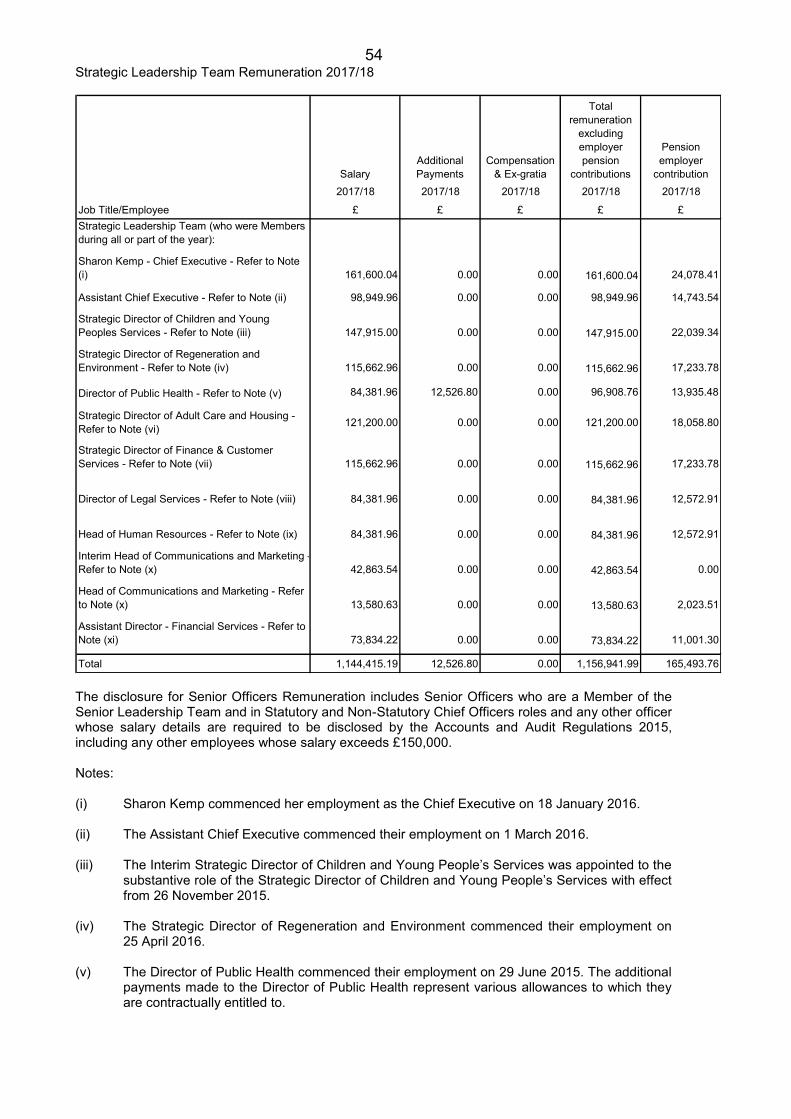
54 Strategic Leadership Team Remuneration 2017/18
SalaryAdditional Payments
Compensation & Ex-gratia
Total remuneration
excluding employer pension
contributions
Pension employer
contribution 2017/18 2017/18 2017/18 2017/18 2017/18
Job Title/Employee £ £ £ £ £Strategic Leadership Team (who were Members during all or part of the year):
Sharon Kemp - Chief Executive - Refer to Note (i) 161,600.04 0.00 0.00 161,600.04 24,078.41
Assistant Chief Executive - Refer to Note (ii) 98,949.96 0.00 0.00 98,949.96 14,743.54
Strategic Director of Children and Young Peoples Services - Refer to Note (iii) 147,915.00 0.00 0.00 147,915.00 22,039.34
Strategic Director of Regeneration and Environment - Refer to Note (iv) 115,662.96 0.00 0.00 115,662.96 17,233.78
Director of Public Health - Refer to Note (v) 84,381.96 12,526.80 0.00 96,908.76 13,935.48
Strategic Director of Adult Care and Housing - Refer to Note (vi) 121,200.00 0.00 0.00 121,200.00 18,058.80
Strategic Director of Finance & Customer Services - Refer to Note (vii) 115,662.96 0.00 0.00 115,662.96 17,233.78
Director of Legal Services - Refer to Note (viii) 84,381.96 0.00 0.00 84,381.96 12,572.91
Head of Human Resources - Refer to Note (ix) 84,381.96 0.00 0.00 84,381.96 12,572.91
Interim Head of Communications and Marketing - Refer to Note (x) 42,863.54 0.00 0.00 42,863.54 0.00
Head of Communications and Marketing - Refer to Note (x) 13,580.63 0.00 0.00 13,580.63 2,023.51
Assistant Director - Financial Services - Refer to Note (xi) 73,834.22 0.00 0.00 73,834.22 11,001.30
Total 1,144,415.19 12,526.80 0.00 1,156,941.99 165,493.76
The disclosure for Senior Officers Remuneration includes Senior Officers who are a Member of the Senior Leadership Team and in Statutory and Non-Statutory Chief Officers roles and any other officer whose salary details are required to be disclosed by the Accounts and Audit Regulations 2015, including any other employees whose salary exceeds £150,000. Notes: (i) Sharon Kemp commenced her employment as the Chief Executive on 18 January 2016. (ii) The Assistant Chief Executive commenced their employment on 1 March 2016. (iii) The Interim Strategic Director of Children and Young People’s Services was appointed to the
substantive role of the Strategic Director of Children and Young People’s Services with effect from 26 November 2015.
(iv) The Strategic Director of Regeneration and Environment commenced their employment on
25 April 2016. (v) The Director of Public Health commenced their employment on 29 June 2015. The additional
payments made to the Director of Public Health represent various allowances to which they are contractually entitled to.
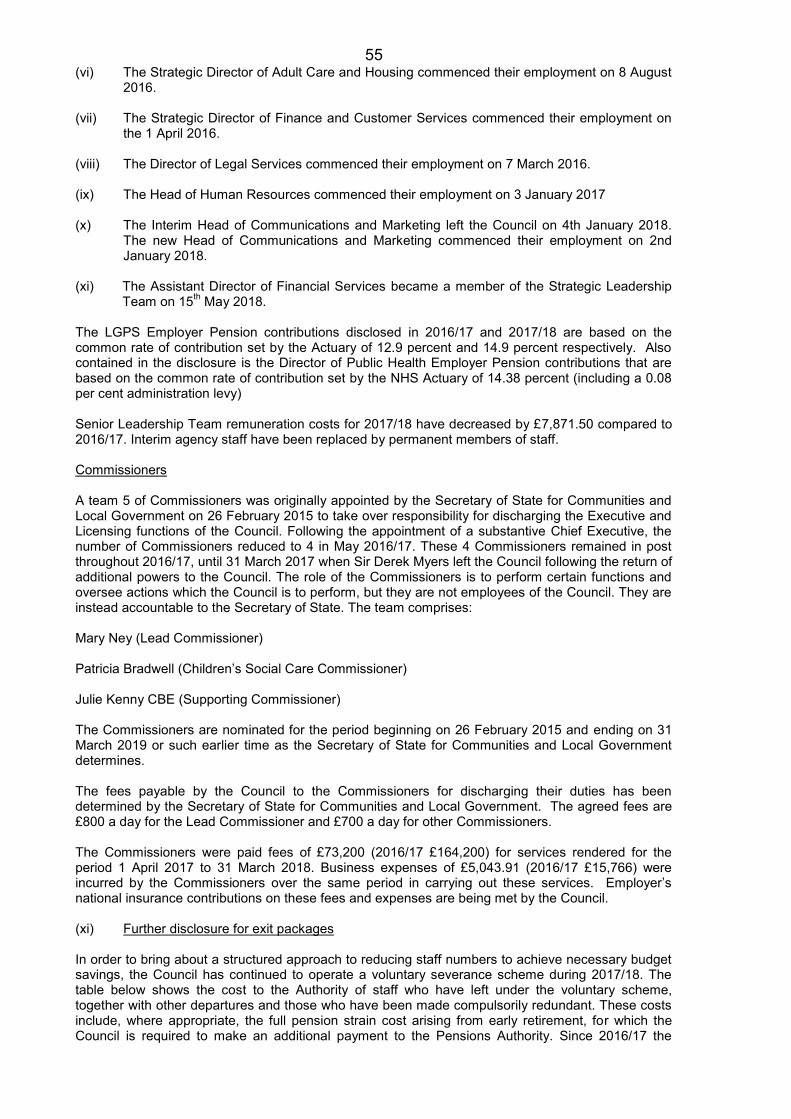
55 (vi) The Strategic Director of Adult Care and Housing commenced their employment on 8 August
2016. (vii) The Strategic Director of Finance and Customer Services commenced their employment on
the 1 April 2016. (viii) The Director of Legal Services commenced their employment on 7 March 2016. (ix) The Head of Human Resources commenced their employment on 3 January 2017 (x) The Interim Head of Communications and Marketing left the Council on 4th January 2018.
The new Head of Communications and Marketing commenced their employment on 2nd January 2018.
(xi) The Assistant Director of Financial Services became a member of the Strategic Leadership
Team on 15th May 2018. The LGPS Employer Pension contributions disclosed in 2016/17 and 2017/18 are based on the common rate of contribution set by the Actuary of 12.9 percent and 14.9 percent respectively. Also contained in the disclosure is the Director of Public Health Employer Pension contributions that are based on the common rate of contribution set by the NHS Actuary of 14.38 percent (including a 0.08 per cent administration levy) Senior Leadership Team remuneration costs for 2017/18 have decreased by £7,871.50 compared to 2016/17. Interim agency staff have been replaced by permanent members of staff.
Commissioners A team 5 of Commissioners was originally appointed by the Secretary of State for Communities and Local Government on 26 February 2015 to take over responsibility for discharging the Executive and Licensing functions of the Council. Following the appointment of a substantive Chief Executive, the number of Commissioners reduced to 4 in May 2016/17. These 4 Commissioners remained in post throughout 2016/17, until 31 March 2017 when Sir Derek Myers left the Council following the return of additional powers to the Council. The role of the Commissioners is to perform certain functions and oversee actions which the Council is to perform, but they are not employees of the Council. They are instead accountable to the Secretary of State. The team comprises: Mary Ney (Lead Commissioner) Patricia Bradwell (Children’s Social Care Commissioner) Julie Kenny CBE (Supporting Commissioner) The Commissioners are nominated for the period beginning on 26 February 2015 and ending on 31 March 2019 or such earlier time as the Secretary of State for Communities and Local Government determines. The fees payable by the Council to the Commissioners for discharging their duties has been determined by the Secretary of State for Communities and Local Government. The agreed fees are £800 a day for the Lead Commissioner and £700 a day for other Commissioners. The Commissioners were paid fees of £73,200 (2016/17 £164,200) for services rendered for the period 1 April 2017 to 31 March 2018. Business expenses of £5,043.91 (2016/17 £15,766) were incurred by the Commissioners over the same period in carrying out these services. Employer’s national insurance contributions on these fees and expenses are being met by the Council. (xi) Further disclosure for exit packages
In order to bring about a structured approach to reducing staff numbers to achieve necessary budget savings, the Council has continued to operate a voluntary severance scheme during 2017/18. The table below shows the cost to the Authority of staff who have left under the voluntary scheme, together with other departures and those who have been made compulsorily redundant. These costs include, where appropriate, the full pension strain cost arising from early retirement, for which the Council is required to make an additional payment to the Pensions Authority. Since 2016/17 the
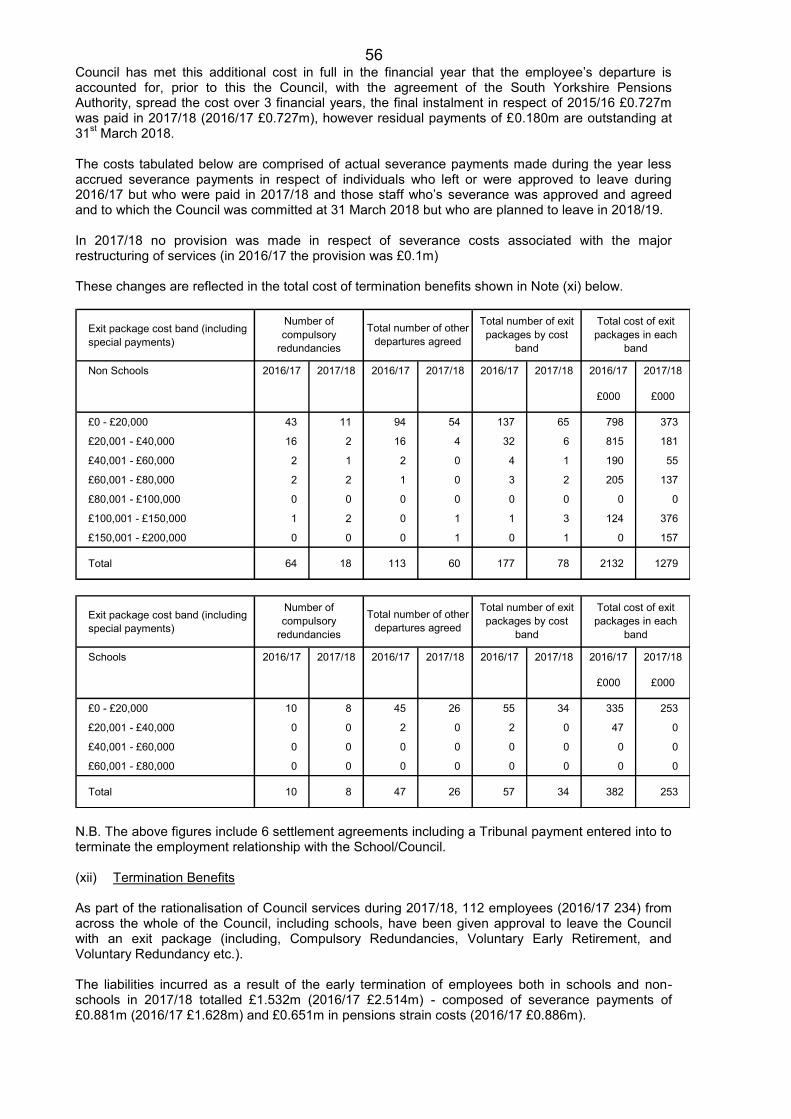
56 Council has met this additional cost in full in the financial year that the employee’s departure is accounted for, prior to this the Council, with the agreement of the South Yorkshire Pensions Authority, spread the cost over 3 financial years, the final instalment in respect of 2015/16 £0.727m was paid in 2017/18 (2016/17 £0.727m), however residual payments of £0.180m are outstanding at 31st March 2018. The costs tabulated below are comprised of actual severance payments made during the year less accrued severance payments in respect of individuals who left or were approved to leave during 2016/17 but who were paid in 2017/18 and those staff who’s severance was approved and agreed and to which the Council was committed at 31 March 2018 but who are planned to leave in 2018/19. In 2017/18 no provision was made in respect of severance costs associated with the major restructuring of services (in 2016/17 the provision was £0.1m) These changes are reflected in the total cost of termination benefits shown in Note (xi) below.
Exit package cost band (including special payments)
Non Schools 2016/17 2017/18 2016/17 2017/18 2016/17 2017/18 2016/17 2017/18
£000 £000
£0 - £20,000 43 11 94 54 137 65 798 373
£20,001 - £40,000 16 2 16 4 32 6 815 181
£40,001 - £60,000 2 1 2 0 4 1 190 55
£60,001 - £80,000 2 2 1 0 3 2 205 137
£80,001 - £100,000 0 0 0 0 0 0 0 0
£100,001 - £150,000 1 2 0 1 1 3 124 376
£150,001 - £200,000 0 0 0 1 0 1 0 157
Total 64 18 113 60 177 78 2132 1279
Total number of exit packages by cost
band
Total cost of exit packages in each
band
Number of compulsory
redundancies
Total number of other departures agreed
Exit package cost band (including special payments)
Schools 2016/17 2017/18 2016/17 2017/18 2016/17 2017/18 2016/17 2017/18
£000 £000
£0 - £20,000 10 8 45 26 55 34 335 253
£20,001 - £40,000 0 0 2 0 2 0 47 0
£40,001 - £60,000 0 0 0 0 0 0 0 0
£60,001 - £80,000 0 0 0 0 0 0 0 0
Total 10 8 47 26 57 34 382 253
Total number of exit packages by cost
band
Total cost of exit packages in each
band
Number of compulsory
redundancies
Total number of other departures agreed
N.B. The above figures include 6 settlement agreements including a Tribunal payment entered into to terminate the employment relationship with the School/Council. (xii) Termination Benefits As part of the rationalisation of Council services during 2017/18, 112 employees (2016/17 234) from across the whole of the Council, including schools, have been given approval to leave the Council with an exit package (including, Compulsory Redundancies, Voluntary Early Retirement, and Voluntary Redundancy etc.). The liabilities incurred as a result of the early termination of employees both in schools and non-schools in 2017/18 totalled £1.532m (2016/17 £2.514m) - composed of severance payments of £0.881m (2016/17 £1.628m) and £0.651m in pensions strain costs (2016/17 £0.886m).
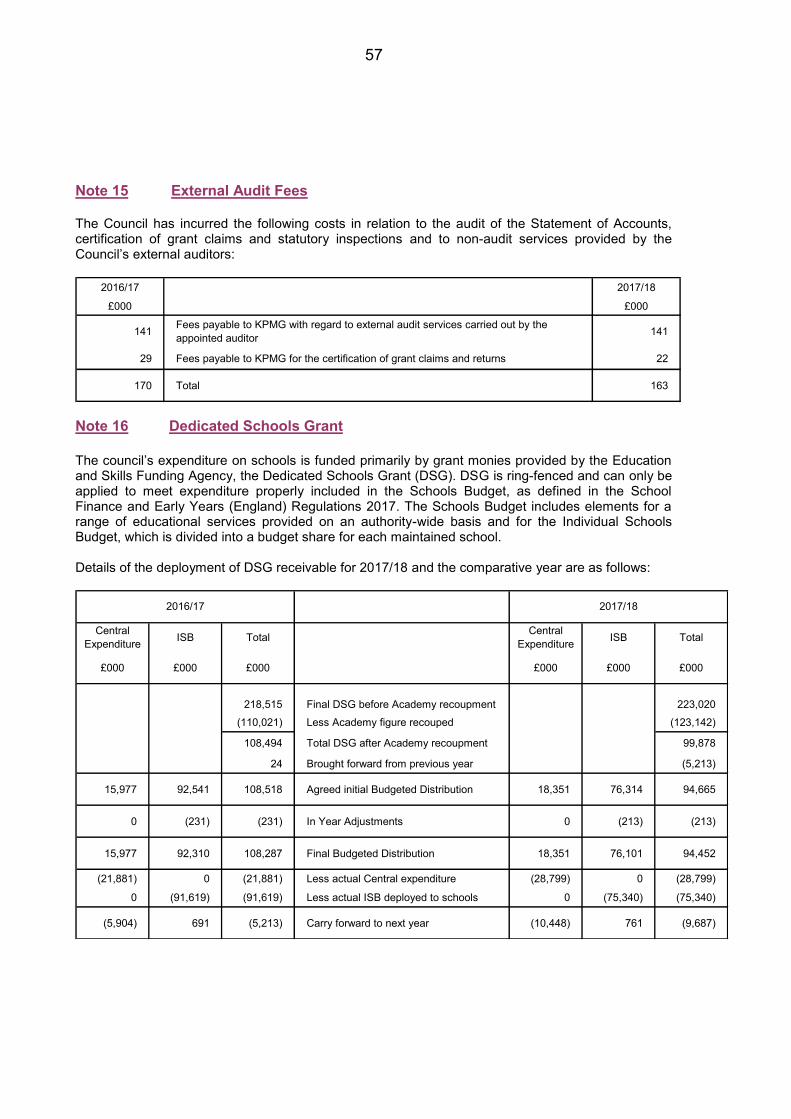
57 Note 15 External Audit Fees The Council has incurred the following costs in relation to the audit of the Statement of Accounts, certification of grant claims and statutory inspections and to non-audit services provided by the Council’s external auditors:
2016/17 2017/18
£000 £000
141 Fees payable to KPMG with regard to external audit services carried out by the appointed auditor 141
29 Fees payable to KPMG for the certification of grant claims and returns 22
170 Total 163
Note 16 Dedicated Schools Grant The council’s expenditure on schools is funded primarily by grant monies provided by the Education and Skills Funding Agency, the Dedicated Schools Grant (DSG). DSG is ring-fenced and can only be applied to meet expenditure properly included in the Schools Budget, as defined in the School Finance and Early Years (England) Regulations 2017. The Schools Budget includes elements for a range of educational services provided on an authority-wide basis and for the Individual Schools Budget, which is divided into a budget share for each maintained school. Details of the deployment of DSG receivable for 2017/18 and the comparative year are as follows:
Central Expenditure ISB Total Central
Expenditure ISB Total
£000 £000 £000 £000 £000 £000
218,515 Final DSG before Academy recoupment 223,020(110,021) Less Academy figure recouped (123,142)
108,494 Total DSG after Academy recoupment 99,878
24 Brought forward from previous year (5,213)
15,977 92,541 108,518 Agreed initial Budgeted Distribution 18,351 76,314 94,665
0 (231) (231) In Year Adjustments 0 (213) (213)
15,977 92,310 108,287 Final Budgeted Distribution 18,351 76,101 94,452
(21,881) 0 (21,881) Less actual Central expenditure (28,799) 0 (28,799)
0 (91,619) (91,619) Less actual ISB deployed to schools 0 (75,340) (75,340)
(5,904) 691 (5,213) Carry forward to next year (10,448) 761 (9,687)
2016/17 2017/18
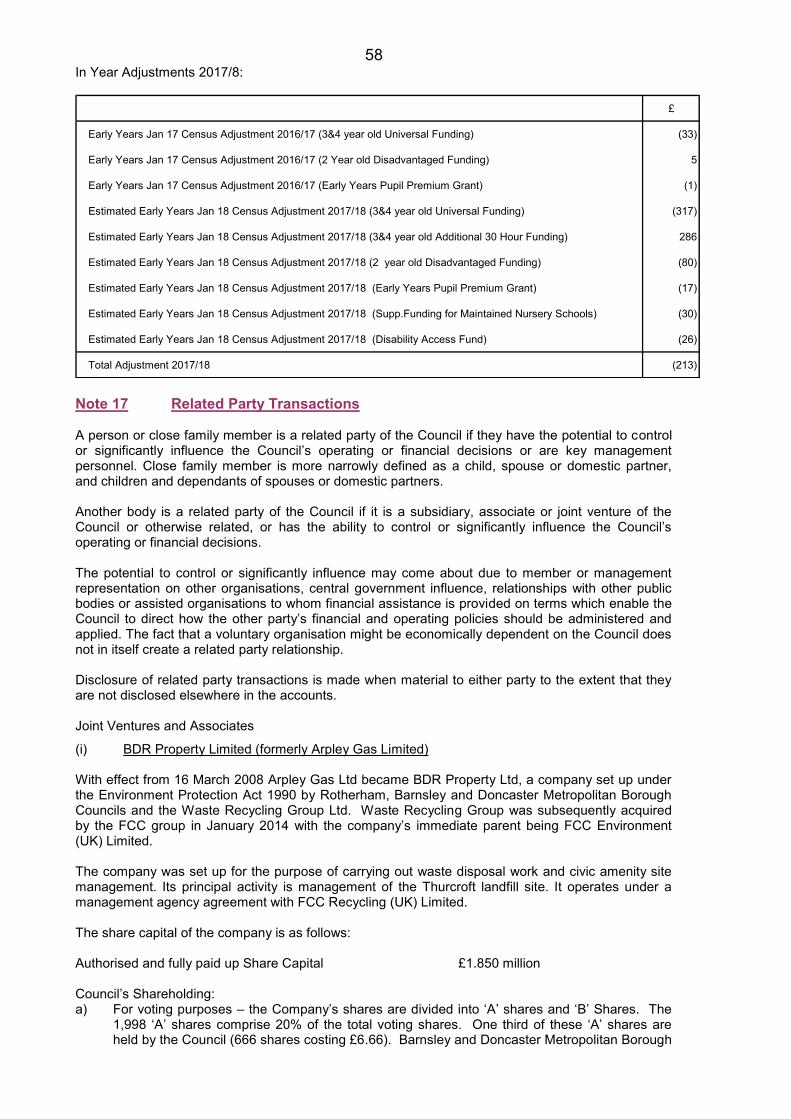
58 In Year Adjustments 2017/8:
£
Early Years Jan 17 Census Adjustment 2016/17 (3&4 year old Universal Funding) (33)
Early Years Jan 17 Census Adjustment 2016/17 (2 Year old Disadvantaged Funding) 5
Early Years Jan 17 Census Adjustment 2016/17 (Early Years Pupil Premium Grant) (1)
Estimated Early Years Jan 18 Census Adjustment 2017/18 (3&4 year old Universal Funding) (317)
Estimated Early Years Jan 18 Census Adjustment 2017/18 (3&4 year old Additional 30 Hour Funding) 286
Estimated Early Years Jan 18 Census Adjustment 2017/18 (2 year old Disadvantaged Funding) (80)
Estimated Early Years Jan 18 Census Adjustment 2017/18 (Early Years Pupil Premium Grant) (17)
Estimated Early Years Jan 18 Census Adjustment 2017/18 (Supp.Funding for Maintained Nursery Schools) (30)
Estimated Early Years Jan 18 Census Adjustment 2017/18 (Disability Access Fund) (26)
Total Adjustment 2017/18 (213)
Note 17 Related Party Transactions A person or close family member is a related party of the Council if they have the potential to control or significantly influence the Council’s operating or financial decisions or are key management personnel. Close family member is more narrowly defined as a child, spouse or domestic partner, and children and dependants of spouses or domestic partners. Another body is a related party of the Council if it is a subsidiary, associate or joint venture of the Council or otherwise related, or has the ability to control or significantly influence the Council’s operating or financial decisions. The potential to control or significantly influence may come about due to member or management representation on other organisations, central government influence, relationships with other public bodies or assisted organisations to whom financial assistance is provided on terms which enable the Council to direct how the other party’s financial and operating policies should be administered and applied. The fact that a voluntary organisation might be economically dependent on the Council does not in itself create a related party relationship. Disclosure of related party transactions is made when material to either party to the extent that they are not disclosed elsewhere in the accounts. Joint Ventures and Associates
(i) BDR Property Limited (formerly Arpley Gas Limited) With effect from 16 March 2008 Arpley Gas Ltd became BDR Property Ltd, a company set up under the Environment Protection Act 1990 by Rotherham, Barnsley and Doncaster Metropolitan Borough Councils and the Waste Recycling Group Ltd. Waste Recycling Group was subsequently acquired by the FCC group in January 2014 with the company’s immediate parent being FCC Environment (UK) Limited. The company was set up for the purpose of carrying out waste disposal work and civic amenity site management. Its principal activity is management of the Thurcroft landfill site. It operates under a management agency agreement with FCC Recycling (UK) Limited. The share capital of the company is as follows: Authorised and fully paid up Share Capital £1.850 million Council’s Shareholding: a) For voting purposes – the Company’s shares are divided into ‘A’ shares and ‘B’ Shares. The
1,998 ‘A’ shares comprise 20% of the total voting shares. One third of these ‘A’ shares are held by the Council (666 shares costing £6.66). Barnsley and Doncaster Metropolitan Borough
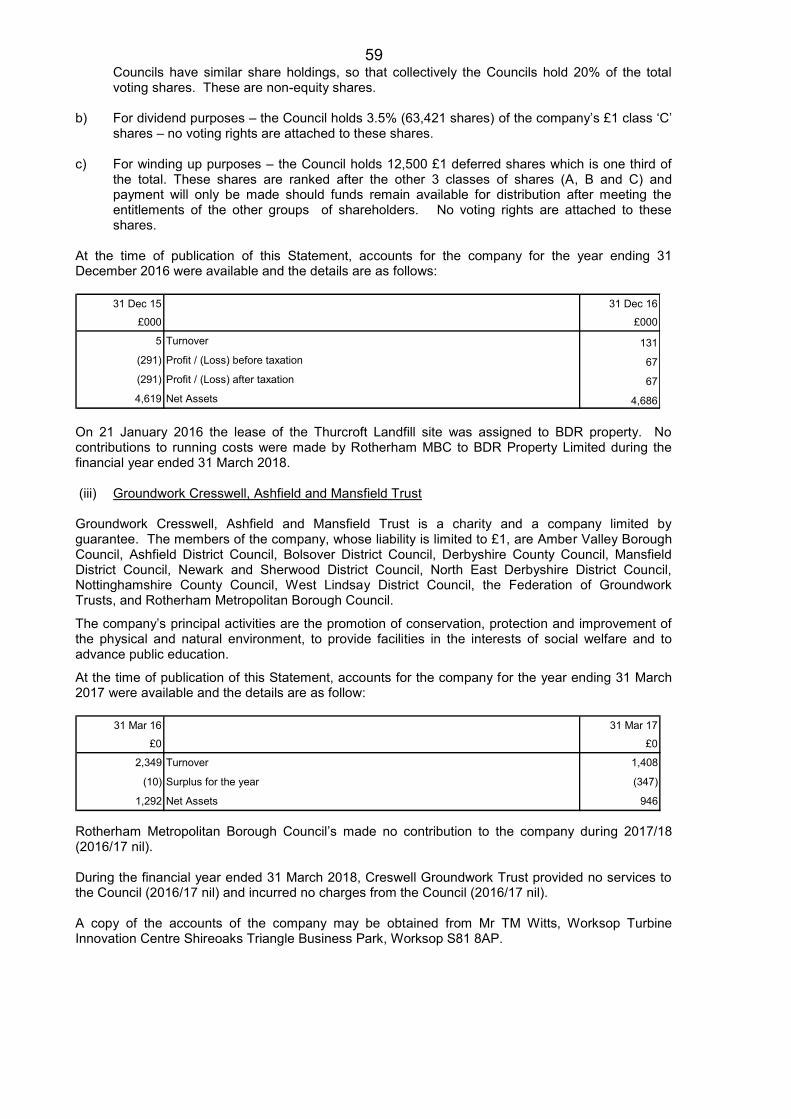
59 Councils have similar share holdings, so that collectively the Councils hold 20% of the total voting shares. These are non-equity shares.
b) For dividend purposes – the Council holds 3.5% (63,421 shares) of the company’s £1 class ‘C’
shares – no voting rights are attached to these shares. c) For winding up purposes – the Council holds 12,500 £1 deferred shares which is one third of
the total. These shares are ranked after the other 3 classes of shares (A, B and C) and payment will only be made should funds remain available for distribution after meeting the entitlements of the other groups of shareholders. No voting rights are attached to these shares.
At the time of publication of this Statement, accounts for the company for the year ending 31 December 2016 were available and the details are as follows:
31 Dec 15 31 Dec 16
£000 £000
5 Turnover 131(291) Profit / (Loss) before taxation 67(291) Profit / (Loss) after taxation 674,619 Net Assets 4,686
On 21 January 2016 the lease of the Thurcroft Landfill site was assigned to BDR property. No contributions to running costs were made by Rotherham MBC to BDR Property Limited during the financial year ended 31 March 2018. (iii) Groundwork Cresswell, Ashfield and Mansfield Trust Groundwork Cresswell, Ashfield and Mansfield Trust is a charity and a company limited by guarantee. The members of the company, whose liability is limited to £1, are Amber Valley Borough Council, Ashfield District Council, Bolsover District Council, Derbyshire County Council, Mansfield District Council, Newark and Sherwood District Council, North East Derbyshire District Council, Nottinghamshire County Council, West Lindsay District Council, the Federation of Groundwork Trusts, and Rotherham Metropolitan Borough Council.
The company’s principal activities are the promotion of conservation, protection and improvement of the physical and natural environment, to provide facilities in the interests of social welfare and to advance public education.
At the time of publication of this Statement, accounts for the company for the year ending 31 March 2017 were available and the details are as follow:
31 Mar 16 31 Mar 17
£0 £0
2,349 Turnover 1,408
(10) Surplus for the year (347)
1,292 Net Assets 946 Rotherham Metropolitan Borough Council’s made no contribution to the company during 2017/18 (2016/17 nil). During the financial year ended 31 March 2018, Creswell Groundwork Trust provided no services to the Council (2016/17 nil) and incurred no charges from the Council (2016/17 nil). A copy of the accounts of the company may be obtained from Mr TM Witts, Worksop Turbine Innovation Centre Shireoaks Triangle Business Park, Worksop S81 8AP.
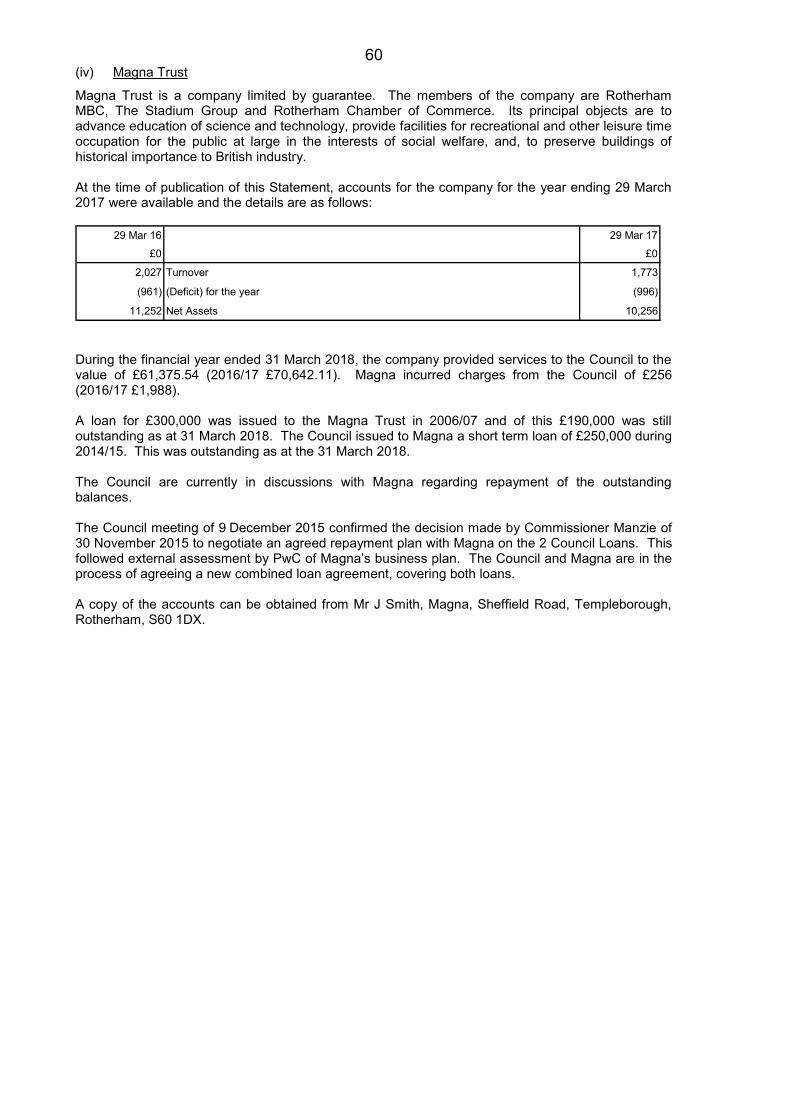
60 (iv) Magna Trust
Magna Trust is a company limited by guarantee. The members of the company are Rotherham MBC, The Stadium Group and Rotherham Chamber of Commerce. Its principal objects are to advance education of science and technology, provide facilities for recreational and other leisure time occupation for the public at large in the interests of social welfare, and, to preserve buildings of historical importance to British industry. At the time of publication of this Statement, accounts for the company for the year ending 29 March 2017 were available and the details are as follows:
29 Mar 16 29 Mar 17
£0 £0
2,027 Turnover 1,773
(961) (Deficit) for the year (996)
11,252 Net Assets 10,256 During the financial year ended 31 March 2018, the company provided services to the Council to the value of £61,375.54 (2016/17 £70,642.11). Magna incurred charges from the Council of £256 (2016/17 £1,988). A loan for £300,000 was issued to the Magna Trust in 2006/07 and of this £190,000 was still outstanding as at 31 March 2018. The Council issued to Magna a short term loan of £250,000 during 2014/15. This was outstanding as at the 31 March 2018. The Council are currently in discussions with Magna regarding repayment of the outstanding balances. The Council meeting of 9 December 2015 confirmed the decision made by Commissioner Manzie of 30 November 2015 to negotiate an agreed repayment plan with Magna on the 2 Council Loans. This followed external assessment by PwC of Magna’s business plan. The Council and Magna are in the process of agreeing a new combined loan agreement, covering both loans. A copy of the accounts can be obtained from Mr J Smith, Magna, Sheffield Road, Templeborough, Rotherham, S60 1DX.
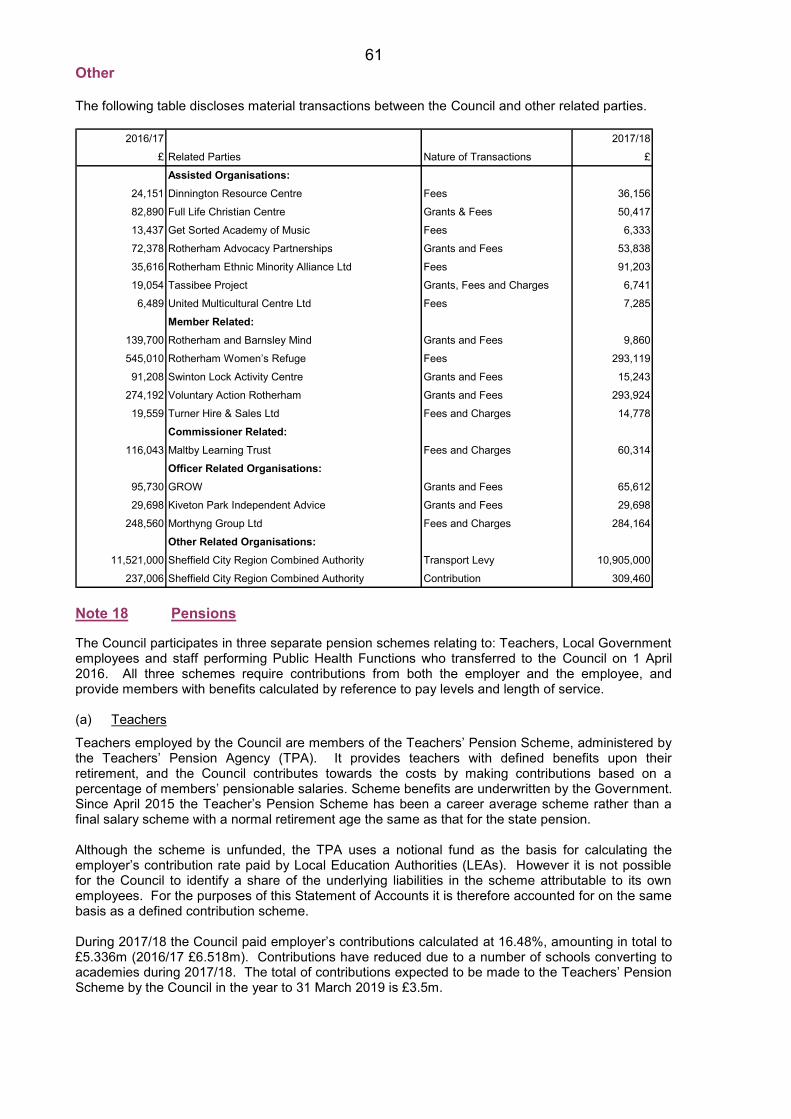
61 Other The following table discloses material transactions between the Council and other related parties.
2016/17 2017/18
£ Related Parties Nature of Transactions £
Assisted Organisations:24,151 Dinnington Resource Centre Fees 36,156
82,890 Full Life Christian Centre Grants & Fees 50,417
13,437 Get Sorted Academy of Music Fees 6,333
72,378 Rotherham Advocacy Partnerships Grants and Fees 53,838
35,616 Rotherham Ethnic Minority Alliance Ltd Fees 91,203
19,054 Tassibee Project Grants, Fees and Charges 6,741
6,489 United Multicultural Centre Ltd Fees 7,285
Member Related:139,700 Rotherham and Barnsley Mind Grants and Fees 9,860
545,010 Rotherham Women’s Refuge Fees 293,119
91,208 Swinton Lock Activity Centre Grants and Fees 15,243
274,192 Voluntary Action Rotherham Grants and Fees 293,924
19,559 Turner Hire & Sales Ltd Fees and Charges 14,778
Commissioner Related:116,043 Maltby Learning Trust Fees and Charges 60,314
Officer Related Organisations:95,730 GROW Grants and Fees 65,612
29,698 Kiveton Park Independent Advice Grants and Fees 29,698
248,560 Morthyng Group Ltd Fees and Charges 284,164
Other Related Organisations: 11,521,000 Sheffield City Region Combined Authority Transport Levy 10,905,000
237,006 Sheffield City Region Combined Authority Contribution 309,460 Note 18 Pensions The Council participates in three separate pension schemes relating to: Teachers, Local Government employees and staff performing Public Health Functions who transferred to the Council on 1 April 2016. All three schemes require contributions from both the employer and the employee, and provide members with benefits calculated by reference to pay levels and length of service. (a) Teachers
Teachers employed by the Council are members of the Teachers’ Pension Scheme, administered by the Teachers’ Pension Agency (TPA). It provides teachers with defined benefits upon their retirement, and the Council contributes towards the costs by making contributions based on a percentage of members’ pensionable salaries. Scheme benefits are underwritten by the Government. Since April 2015 the Teacher’s Pension Scheme has been a career average scheme rather than a final salary scheme with a normal retirement age the same as that for the state pension. Although the scheme is unfunded, the TPA uses a notional fund as the basis for calculating the employer’s contribution rate paid by Local Education Authorities (LEAs). However it is not possible for the Council to identify a share of the underlying liabilities in the scheme attributable to its own employees. For the purposes of this Statement of Accounts it is therefore accounted for on the same basis as a defined contribution scheme. During 2017/18 the Council paid employer’s contributions calculated at 16.48%, amounting in total to £5.336m (2016/17 £6.518m). Contributions have reduced due to a number of schools converting to academies during 2017/18. The total of contributions expected to be made to the Teachers’ Pension Scheme by the Council in the year to 31 March 2019 is £3.5m.
62 The Government Actuary’s Department (GAD) carried out an actuarial valuation of the scheme as at 31 March 2012. It showed there to be an overall deficit against the notional fund of £15bn compared to a deficit of £1.8bn at the time of the last actuarial valuation at 31 March 2004. The GAD has determined that the employers’ contribution over the 4 years commencing 2015/16 should be 16.48%. The rate of 16.48% comprises 5.6% to recover the projected deficit at 31 March 2015 over a 15 year period and 10.8% to meet the ongoing benefits accrued by members under the new scheme from 1 April 2015 onwards and 0.08% administration. This has been capped at 10.9% over the years commencing 2015/16. Members will be expected to pay an average contribution of 9.6%. The current employer contribution rate will be payable until the outcome of the next valuation is implemented, which is expected to be April 2019. (b) Public Health Staff
Under the provisions of the Health and Social Care Act 2012, Public Health functions and the staff performing these duties were transferred from the National Health Service to Local Authorities on 1 April 2013. The majority of staff transferring have the eligibility to continue membership of the National Health Service Pension Scheme (NHSPS). The NHSPS is an unfunded scheme operated on a “pay as you go” basis which provides defined benefits to its members. The NHS Business service (NHSBS) which administers the scheme uses a notional fund as a basis for calculating the employer’s contribution rate paid by Local Authorities. However, it is not possible for the Council to identify its share of the underlying assets and liabilities relating to the scheme and it is therefore accounted for as if it were a defined contribution scheme with the amount charged to revenue being the employer contributions payable in the year. Employee contributions in 2017/18 are tiered from 5% to 14.5% based on salary. During 2017/18 the Council paid employer’s contributions calculated at 14.3% amounting in total to £0.086m (£0.116m 2016/17). A new NHS Pension Scheme came into effect in April 2015, the main features of the new scheme are that it is a career average scheme rather than a final salary scheme and the normal retirement age is now the same as that for the State Pension. An actuarial valuation of the NHS Pension Scheme was carried out as at 31 March 2012 to replace the previous actuarial valuation at 31 March 2004. The primary purpose of the 2012 actuarial valuation was to set the employer contribution rate payable from April 2015 under the new NHS Pension scheme. This determined that employee contribution rates continue to be tiered from 5% to 14.5% based on salary over the 4 years commencing 2015/16 and employer contributions at 14.3% over the same period. In March 2017 the Department of Health announced that a levy of 0.08% on employers would be introduced to pay for the administration of the NHS Pension scheme meaning that employers would pay 14.38% of pensionable pay – in light of this the total contributions expected to be made to the new NHS Pension Scheme by the Council in the year to 31 March 2019 is £0.058m. (c) Other Local Government Employees
As part of the terms and conditions of employment of its officers and other employees, the Council offers retirement benefits through its participation in the Local Government Pension Scheme, administered by the South Yorkshire Pensions Authority. Although these benefits will not actually be payable until employees retire, the Council has a commitment to make the payments and this needs to be disclosed at the time that employees earn their future entitlement. The Council is able to identify a share of the underlying liabilities in the scheme attributable to its own employees and accordingly accounts for post-employment benefits as a defined benefit scheme in accordance with the requirements of IAS19. Consequently, the Council recognises the cost of retirement benefits in the Net Cost of Services when they are earned by employees, rather than when the benefits are eventually paid as pensions. However, the charge the Council is required to make against Council Tax is based on the cash payable in the year, so the IAS 19 cost of retirement benefits is reversed out through the Movement in Reserves Statement and replaced by the actual contributions payable in the year. The IAS 19 figures provided by the actuary in respect of 2017/18 make allowance for the reduction in liabilities falling on the Council as a result of schools acquiring academy status during the year which are shown as gains / losses on settlements.
63 During the year the Council paid employer’s superannuation contributions calculated at 14.9% amounting to £16.529m (2016/17 £14.759m at 12.9%) and made a prepayment of £21.802m in relation to past service deficit for the 3 years 2017/18, 2018/19 and 2019/20 of which £7.272m relates to 2017/18. Total ongoing contributions of £16.1m are expected to be made to the Local Government Pension Scheme by the Council in the year to 31 March 2019 based on an ongoing service contribution rate of 14.9%. The contribution rates take account of changes to the Local Government Pensions Scheme which came into effect from April 2014. The main changes were the introduction of a career average scheme rather than a final salary scheme and a “50:50 Scheme Option” whereby members can elect to accrue 50% of the full scheme benefits and pay 50% of the normal member contribution for a period of up to 3 years. They also reflect the most recent triennial actuarial valuation in March 2016 which the South Yorkshire Pensions Authority, on behalf of its member Authorities, commissioned from the actuary, Mercer Human Resource Consulting Ltd. This showed an improvement in the fund’s position with the Council’s share of the Fund deficit on the scheme reducing from £181 million at the previous actuarial valuation in 2013 to £129 million in March 2016 (with the funding level improving from 82% to 88% of scheme liabilities). The funding plan, in accordance with the Funding Strategy Statement (FSS), is to make good the shortfall and achieve a funding level of 100% by 31 March 2036. In order to make good the funding deficit the Council has made and will continue to make contributions towards recovering Rotherham’s share of the deficit on the pensions fund. The deficit recovery contribution in 2017/18 was £7.3m which was included in the lump sum prepayment of £21.8m paid April 2017 and covering the 3 financial years 2017/18 to 2019/20. The funding level of the Pensions Fund is subject to a range of potentially material risks. The impact of small changes to key assumptions (inflation, pay awards, life expectancy, discounting of future pension liabilities) is set out in the sensitivity analysis later in this note. In assessing the potential level of liabilities the funds actuary has estimated the weighted average maturity profile of the defined benefit obligation to be 19 years. The Pensions Authority invests the funds held by the scheme with the aim of achieving a return on these funds to pay the benefits due. If actual investment returns do not in future match the assumptions then the value of the assets will be lower and a funding shortfall could arise. To address this South Yorkshire Pensions Authority has processes in place to monitor investment performance and the actuaries produce an annual review of the fund’s performance including a comparison to other local Council funds. The Pension Fund’s investment strategy is reviewed alongside each triennial valuation. In the event that an employer is unable to pay contributions or make good deficits, the Pension Authority’s focus is to ensure as far as possible that any liability can be recovered should an employer exit the Pension Fund. Where a Council acts as guarantor for an employer that defaults the Council is responsible for meeting the liability, otherwise it falls on all employers in the Fund in relation to their size. Rotherham Council does not act as guarantor for other employers. Council contractors with access to the LGPS are required to have bonds in place (which are subject to regular review) to cover unpaid liabilities should their business fail before the end of their contract with the Council. In addition, contractors’ contributions are subject to smoothing arrangements which are intended to ensure that they are fully funded by the end of the contract period. An exception to this is regulation 64 of the Local Government Pensions Regulations which require, in some circumstances, that the Council makes Exit Payments in respect of employers leaving the Fund. Further information in relation to the Local Government Superannuation Scheme can be found in the South Yorkshire Pension Fund Annual Report which is available upon request from the Superannuation Manager, South Yorkshire Joint Secretariat, Regent Street, Barnsley
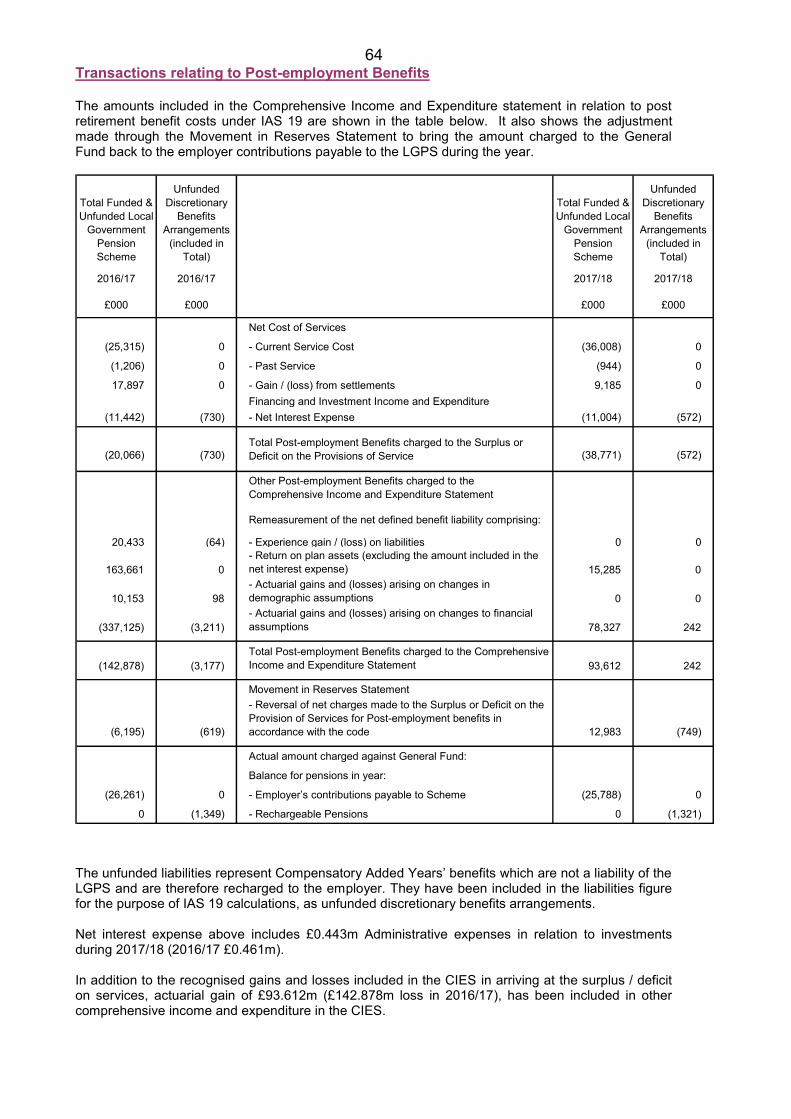
64 Transactions relating to Post-employment Benefits The amounts included in the Comprehensive Income and Expenditure statement in relation to post retirement benefit costs under IAS 19 are shown in the table below. It also shows the adjustment made through the Movement in Reserves Statement to bring the amount charged to the General Fund back to the employer contributions payable to the LGPS during the year.
Total Funded & Unfunded Local
Government Pension Scheme
Unfunded Discretionary
Benefits Arrangements
(included in Total)
Total Funded & Unfunded Local
Government Pension Scheme
Unfunded Discretionary
Benefits Arrangements
(included in Total)
2016/17 2016/17 2017/18 2017/18
£000 £000 £000 £000
Net Cost of Services
(25,315) 0 - Current Service Cost (36,008) 0
(1,206) 0 - Past Service (944) 0
17,897 0 - Gain / (loss) from settlements 9,185 0Financing and Investment Income and Expenditure
(11,442) (730) - Net Interest Expense (11,004) (572)
(20,066) (730)Total Post-employment Benefits charged to the Surplus or Deficit on the Provisions of Service (38,771) (572)
Other Post-employment Benefits charged to the Comprehensive Income and Expenditure Statement
Remeasurement of the net defined benefit liability comprising:
20,433 (64) - Experience gain / (loss) on liabilities 0 0
163,661 0- Return on plan assets (excluding the amount included in the net interest expense) 15,285 0
10,153 98- Actuarial gains and (losses) arising on changes in demographic assumptions 0 0
(337,125) (3,211)- Actuarial gains and (losses) arising on changes to financial assumptions 78,327 242
(142,878) (3,177)Total Post-employment Benefits charged to the Comprehensive Income and Expenditure Statement 93,612 242
Movement in Reserves Statement
(6,195) (619)
- Reversal of net charges made to the Surplus or Deficit on the Provision of Services for Post-employment benefits in accordance with the code 12,983 (749)
Actual amount charged against General Fund:
Balance for pensions in year:
(26,261) 0 - Employer’s contributions payable to Scheme (25,788) 0
0 (1,349) - Rechargeable Pensions 0 (1,321)
The unfunded liabilities represent Compensatory Added Years’ benefits which are not a liability of the LGPS and are therefore recharged to the employer. They have been included in the liabilities figure for the purpose of IAS 19 calculations, as unfunded discretionary benefits arrangements. Net interest expense above includes £0.443m Administrative expenses in relation to investments during 2017/18 (2016/17 £0.461m). In addition to the recognised gains and losses included in the CIES in arriving at the surplus / deficit on services, actuarial gain of £93.612m (£142.878m loss in 2016/17), has been included in other comprehensive income and expenditure in the CIES.
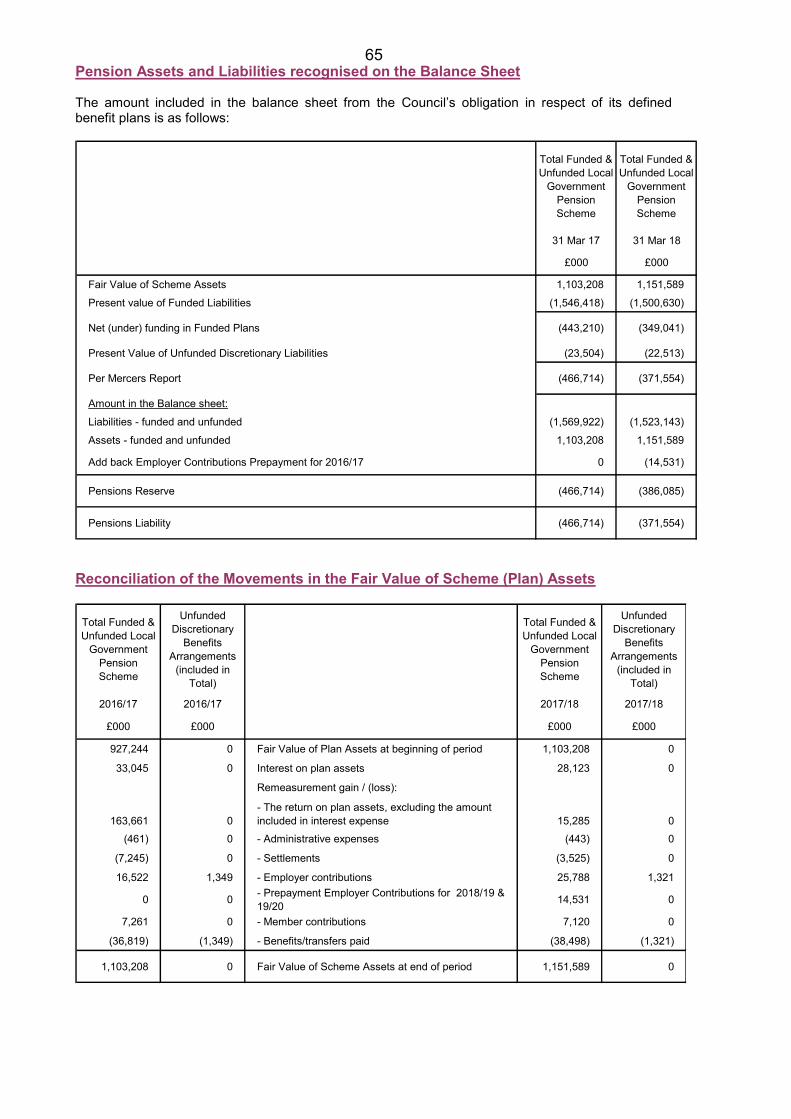
65 Pension Assets and Liabilities recognised on the Balance Sheet The amount included in the balance sheet from the Council’s obligation in respect of its defined benefit plans is as follows:
Total Funded & Unfunded Local
Government Pension Scheme
Total Funded & Unfunded Local
Government Pension Scheme
31 Mar 17 31 Mar 18
£000 £000
Fair Value of Scheme Assets 1,103,208 1,151,589
Present value of Funded Liabilities (1,546,418) (1,500,630)
Net (under) funding in Funded Plans (443,210) (349,041)
Present Value of Unfunded Discretionary Liabilities (23,504) (22,513)
Per Mercers Report (466,714) (371,554)
Amount in the Balance sheet:
Liabilities - funded and unfunded (1,569,922) (1,523,143)
Assets - funded and unfunded 1,103,208 1,151,589
Add back Employer Contributions Prepayment for 2016/17 0 (14,531)
Pensions Reserve (466,714) (386,085)
Pensions Liability (466,714) (371,554)
Reconciliation of the Movements in the Fair Value of Scheme (Plan) Assets
Total Funded & Unfunded Local
Government Pension Scheme
Unfunded Discretionary
Benefits Arrangements
(included in Total)
Total Funded & Unfunded Local
Government Pension Scheme
Unfunded Discretionary
Benefits Arrangements
(included in Total)
2016/17 2016/17 2017/18 2017/18
£000 £000 £000 £000
927,244 0 Fair Value of Plan Assets at beginning of period 1,103,208 0
33,045 0 Interest on plan assets 28,123 0
Remeasurement gain / (loss):
163,661 0- The return on plan assets, excluding the amount included in interest expense 15,285 0
(461) 0 - Administrative expenses (443) 0
(7,245) 0 - Settlements (3,525) 0
16,522 1,349 - Employer contributions 25,788 1,321
0 0 - Prepayment Employer Contributions for 2018/19 & 19/20 14,531 0
7,261 0 - Member contributions 7,120 0
(36,819) (1,349) - Benefits/transfers paid (38,498) (1,321)
1,103,208 0 Fair Value of Scheme Assets at end of period 1,151,589 0
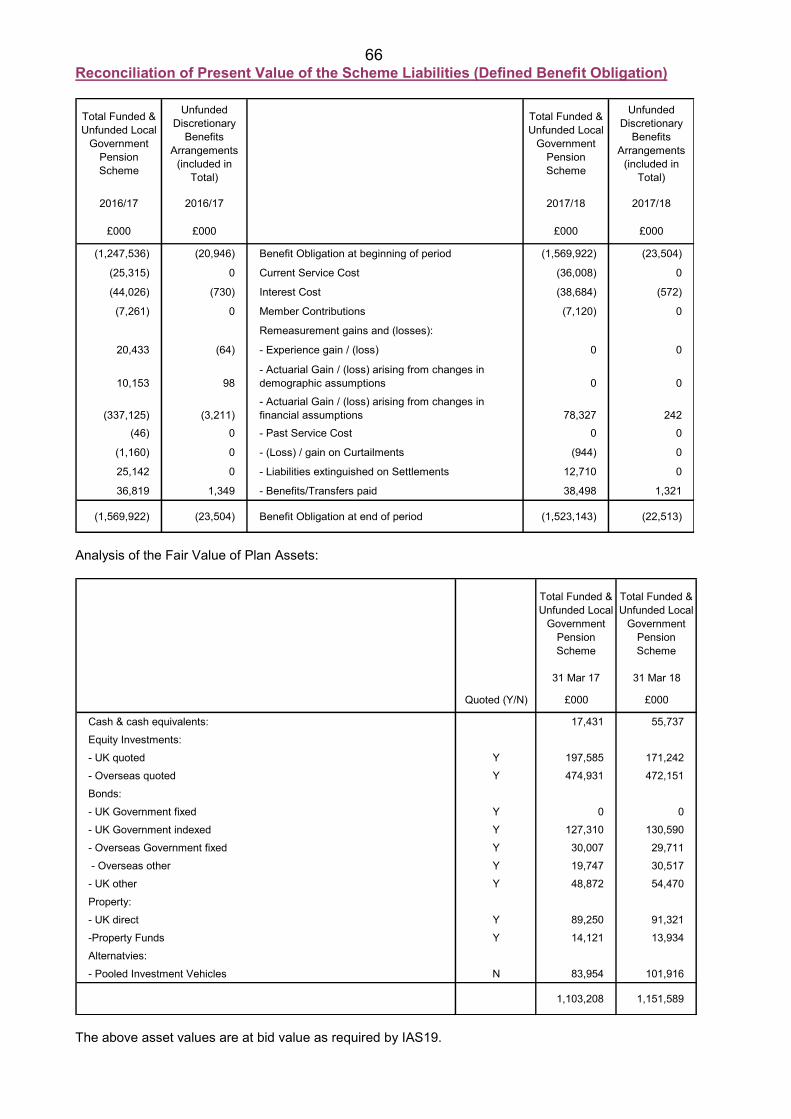
66 Reconciliation of Present Value of the Scheme Liabilities (Defined Benefit Obligation)
Total Funded & Unfunded Local
Government Pension Scheme
Unfunded Discretionary
Benefits Arrangements
(included in Total)
Total Funded & Unfunded Local
Government Pension Scheme
Unfunded Discretionary
Benefits Arrangements
(included in Total)
2016/17 2016/17 2017/18 2017/18
£000 £000 £000 £000
(1,247,536) (20,946) Benefit Obligation at beginning of period (1,569,922) (23,504)
(25,315) 0 Current Service Cost (36,008) 0
(44,026) (730) Interest Cost (38,684) (572)
(7,261) 0 Member Contributions (7,120) 0
Remeasurement gains and (losses):
20,433 (64) - Experience gain / (loss) 0 0
10,153 98- Actuarial Gain / (loss) arising from changes in demographic assumptions 0 0
(337,125) (3,211)- Actuarial Gain / (loss) arising from changes in financial assumptions 78,327 242
(46) 0 - Past Service Cost 0 0
(1,160) 0 - (Loss) / gain on Curtailments (944) 0
25,142 0 - Liabilities extinguished on Settlements 12,710 0
36,819 1,349 - Benefits/Transfers paid 38,498 1,321
(1,569,922) (23,504) Benefit Obligation at end of period (1,523,143) (22,513)
Analysis of the Fair Value of Plan Assets:
Total Funded & Unfunded Local
Government Pension Scheme
Total Funded & Unfunded Local
Government Pension Scheme
31 Mar 17 31 Mar 18
Quoted (Y/N) £000 £000
Cash & cash equivalents: 17,431 55,737Equity Investments:- UK quoted Y 197,585 171,242- Overseas quoted Y 474,931 472,151Bonds:- UK Government fixed Y 0 0- UK Government indexed Y 127,310 130,590- Overseas Government fixed Y 30,007 29,711 - Overseas other Y 19,747 30,517- UK other Y 48,872 54,470Property:- UK direct Y 89,250 91,321-Property Funds Y 14,121 13,934Alternatvies:- Pooled Investment Vehicles N 83,954 101,916
1,103,208 1,151,589
The above asset values are at bid value as required by IAS19.
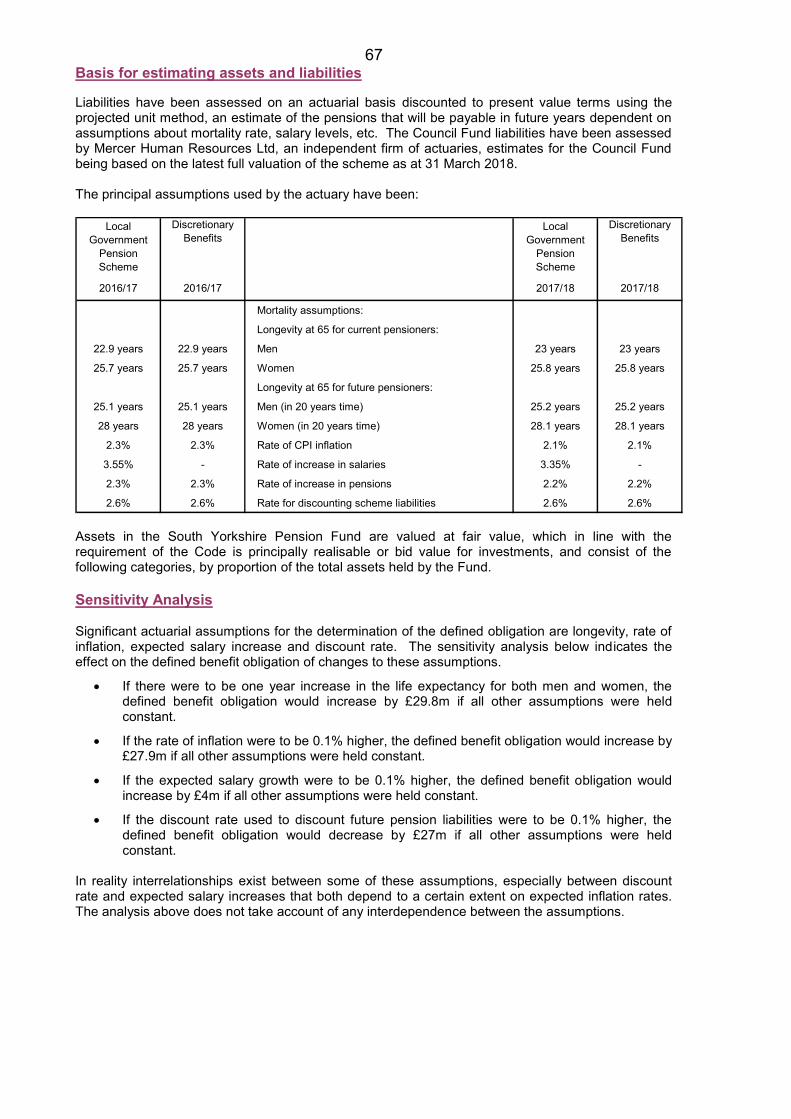
67 Basis for estimating assets and liabilities Liabilities have been assessed on an actuarial basis discounted to present value terms using the projected unit method, an estimate of the pensions that will be payable in future years dependent on assumptions about mortality rate, salary levels, etc. The Council Fund liabilities have been assessed by Mercer Human Resources Ltd, an independent firm of actuaries, estimates for the Council Fund being based on the latest full valuation of the scheme as at 31 March 2018. The principal assumptions used by the actuary have been:
Local Government
Pension Scheme
Discretionary Benefits
Local Government
Pension Scheme
Discretionary Benefits
2016/17 2016/17 2017/18 2017/18
Mortality assumptions:
Longevity at 65 for current pensioners:
22.9 years 22.9 years Men 23 years 23 years
25.7 years 25.7 years Women 25.8 years 25.8 years
Longevity at 65 for future pensioners:
25.1 years 25.1 years Men (in 20 years time) 25.2 years 25.2 years
28 years 28 years Women (in 20 years time) 28.1 years 28.1 years
2.3% 2.3% Rate of CPI inflation 2.1% 2.1%
3.55% - Rate of increase in salaries 3.35% -
2.3% 2.3% Rate of increase in pensions 2.2% 2.2%
2.6% 2.6% Rate for discounting scheme liabilities 2.6% 2.6%
Assets in the South Yorkshire Pension Fund are valued at fair value, which in line with the requirement of the Code is principally realisable or bid value for investments, and consist of the following categories, by proportion of the total assets held by the Fund. Sensitivity Analysis Significant actuarial assumptions for the determination of the defined obligation are longevity, rate of inflation, expected salary increase and discount rate. The sensitivity analysis below indicates the effect on the defined benefit obligation of changes to these assumptions.
If there were to be one year increase in the life expectancy for both men and women, the defined benefit obligation would increase by £29.8m if all other assumptions were held constant.
If the rate of inflation were to be 0.1% higher, the defined benefit obligation would increase by £27.9m if all other assumptions were held constant.
If the expected salary growth were to be 0.1% higher, the defined benefit obligation would increase by £4m if all other assumptions were held constant.
If the discount rate used to discount future pension liabilities were to be 0.1% higher, the defined benefit obligation would decrease by £27m if all other assumptions were held constant.
In reality interrelationships exist between some of these assumptions, especially between discount rate and expected salary increases that both depend to a certain extent on expected inflation rates. The analysis above does not take account of any interdependence between the assumptions.
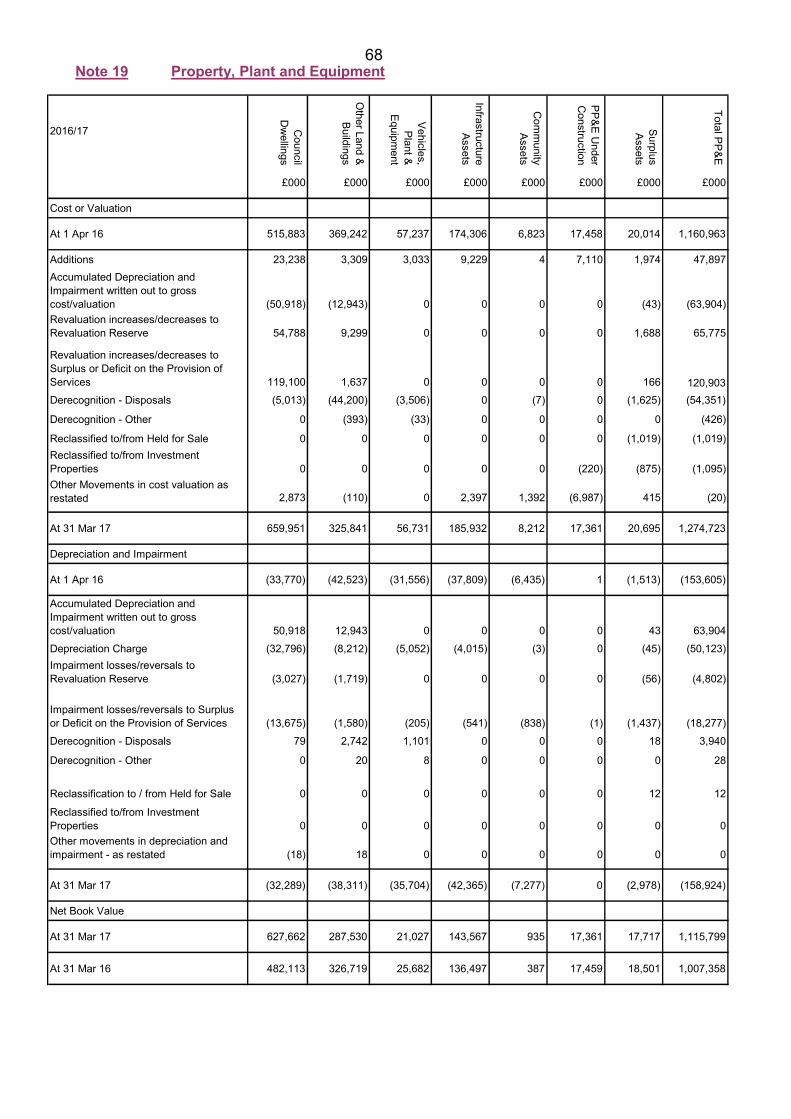
68 Note 19 Property, Plant and Equipment
2016/17 Council
Dw
ellings
Other Land &
Buildings
Vehicles, Plant &
Equipment
Infrastructure Assets
Com
munity
Assets
PP&E Under
Construction
Surplus Assets
Total PP&E
£000 £000 £000 £000 £000 £000 £000 £000
Cost or Valuation
At 1 Apr 16 515,883 369,242 57,237 174,306 6,823 17,458 20,014 1,160,963
Additions 23,238 3,309 3,033 9,229 4 7,110 1,974 47,897Accumulated Depreciation and Impairment written out to gross cost/valuation (50,918) (12,943) 0 0 0 0 (43) (63,904)Revaluation increases/decreases to Revaluation Reserve 54,788 9,299 0 0 0 0 1,688 65,775
Revaluation increases/decreases to Surplus or Deficit on the Provision of Services 119,100 1,637 0 0 0 0 166 120,903Derecognition - Disposals (5,013) (44,200) (3,506) 0 (7) 0 (1,625) (54,351)
Derecognition - Other 0 (393) (33) 0 0 0 0 (426)
Reclassified to/from Held for Sale 0 0 0 0 0 0 (1,019) (1,019)Reclassified to/from Investment Properties 0 0 0 0 0 (220) (875) (1,095)Other Movements in cost valuation as restated 2,873 (110) 0 2,397 1,392 (6,987) 415 (20)
At 31 Mar 17 659,951 325,841 56,731 185,932 8,212 17,361 20,695 1,274,723
Depreciation and Impairment
At 1 Apr 16 (33,770) (42,523) (31,556) (37,809) (6,435) 1 (1,513) (153,605)
Accumulated Depreciation and Impairment written out to gross cost/valuation 50,918 12,943 0 0 0 0 43 63,904Depreciation Charge (32,796) (8,212) (5,052) (4,015) (3) 0 (45) (50,123)Impairment losses/reversals to Revaluation Reserve (3,027) (1,719) 0 0 0 0 (56) (4,802)
Impairment losses/reversals to Surplus or Deficit on the Provision of Services (13,675) (1,580) (205) (541) (838) (1) (1,437) (18,277)Derecognition - Disposals 79 2,742 1,101 0 0 0 18 3,940
Derecognition - Other 0 20 8 0 0 0 0 28
Reclassification to / from Held for Sale 0 0 0 0 0 0 12 12
Reclassified to/from Investment Properties 0 0 0 0 0 0 0 0Other movements in depreciation and impairment - as restated (18) 18 0 0 0 0 0 0
At 31 Mar 17 (32,289) (38,311) (35,704) (42,365) (7,277) 0 (2,978) (158,924)
Net Book Value
At 31 Mar 17 627,662 287,530 21,027 143,567 935 17,361 17,717 1,115,799
At 31 Mar 16 482,113 326,719 25,682 136,497 387 17,459 18,501 1,007,358
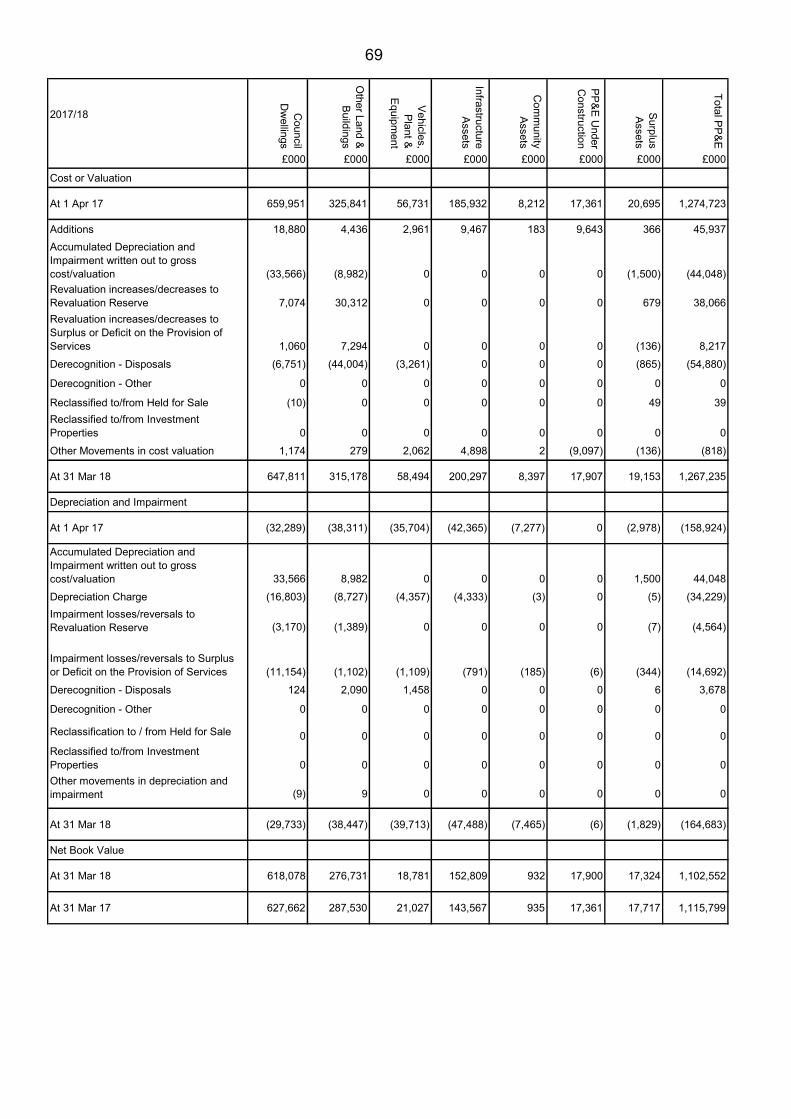
69
2017/18 Council
Dw
ellings
Other Land &
Buildings
Vehicles, Plant &
Equipment
Infrastructure Assets
Com
munity
Assets
PP&E Under
Construction
Surplus Assets
Total PP&E
£000 £000 £000 £000 £000 £000 £000 £000
Cost or Valuation
At 1 Apr 17 659,951 325,841 56,731 185,932 8,212 17,361 20,695 1,274,723
Additions 18,880 4,436 2,961 9,467 183 9,643 366 45,937Accumulated Depreciation and Impairment written out to gross cost/valuation (33,566) (8,982) 0 0 0 0 (1,500) (44,048)Revaluation increases/decreases to Revaluation Reserve 7,074 30,312 0 0 0 0 679 38,066Revaluation increases/decreases to Surplus or Deficit on the Provision of Services 1,060 7,294 0 0 0 0 (136) 8,217Derecognition - Disposals (6,751) (44,004) (3,261) 0 0 0 (865) (54,880)
Derecognition - Other 0 0 0 0 0 0 0 0
Reclassified to/from Held for Sale (10) 0 0 0 0 0 49 39Reclassified to/from Investment Properties 0 0 0 0 0 0 0 0Other Movements in cost valuation 1,174 279 2,062 4,898 2 (9,097) (136) (818)
At 31 Mar 18 647,811 315,178 58,494 200,297 8,397 17,907 19,153 1,267,235
Depreciation and Impairment
At 1 Apr 17 (32,289) (38,311) (35,704) (42,365) (7,277) 0 (2,978) (158,924)
Accumulated Depreciation and Impairment written out to gross cost/valuation 33,566 8,982 0 0 0 0 1,500 44,048Depreciation Charge (16,803) (8,727) (4,357) (4,333) (3) 0 (5) (34,229)Impairment losses/reversals to Revaluation Reserve (3,170) (1,389) 0 0 0 0 (7) (4,564)
Impairment losses/reversals to Surplus or Deficit on the Provision of Services (11,154) (1,102) (1,109) (791) (185) (6) (344) (14,692)Derecognition - Disposals 124 2,090 1,458 0 0 0 6 3,678
Derecognition - Other 0 0 0 0 0 0 0 0
Reclassification to / from Held for Sale 0 0 0 0 0 0 0 0Reclassified to/from Investment Properties 0 0 0 0 0 0 0 0Other movements in depreciation and impairment (9) 9 0 0 0 0 0 0
At 31 Mar 18 (29,733) (38,447) (39,713) (47,488) (7,465) (6) (1,829) (164,683)
Net Book Value
At 31 Mar 18 618,078 276,731 18,781 152,809 932 17,900 17,324 1,102,552
At 31 Mar 17 627,662 287,530 21,027 143,567 935 17,361 17,717 1,115,799
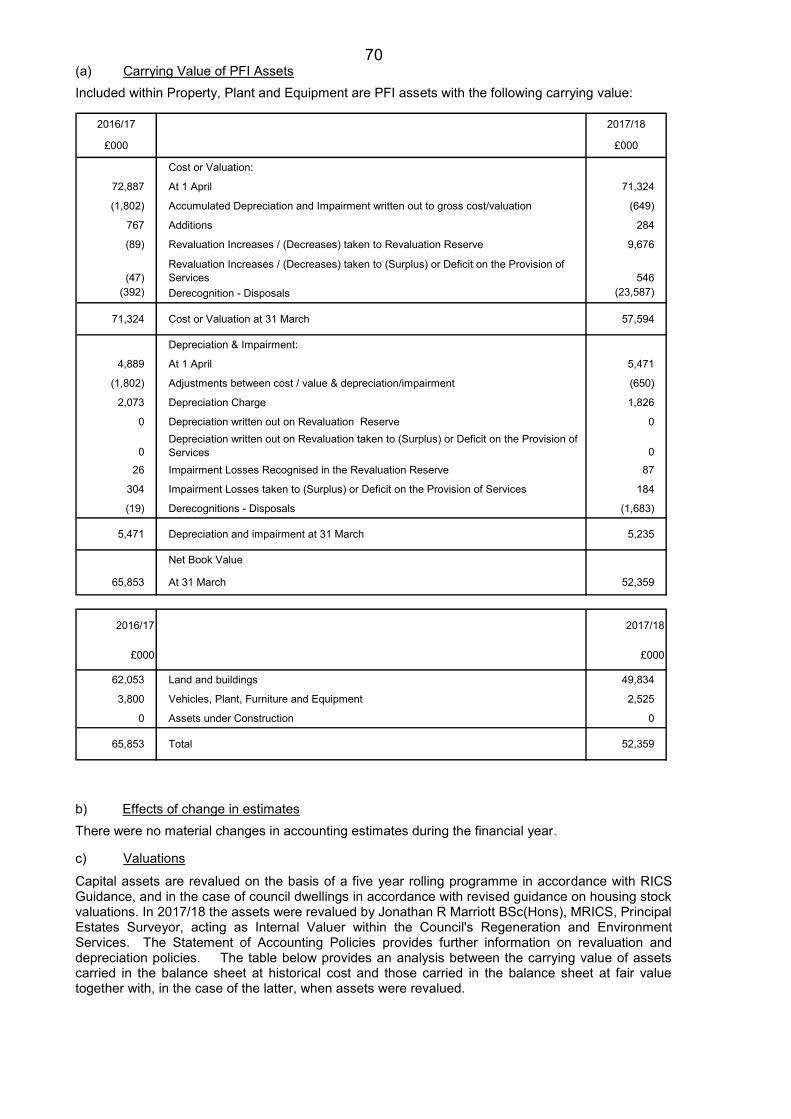
70 (a) Carrying Value of PFI Assets Included within Property, Plant and Equipment are PFI assets with the following carrying value:
2016/17 2017/18
Cost or Valuation:
72,887 At 1 April 71,324
(1,802) Accumulated Depreciation and Impairment written out to gross cost/valuation (649)
767 Additions 284
(89) Revaluation Increases / (Decreases) taken to Revaluation Reserve 9,676
(47)Revaluation Increases / (Decreases) taken to (Surplus) or Deficit on the Provision of Services 546
(392) Derecognition - Disposals (23,587)
71,324 Cost or Valuation at 31 March 57,594
Depreciation & Impairment:
4,889 At 1 April 5,471
(1,802) Adjustments between cost / value & depreciation/impairment (650)
2,073 Depreciation Charge 1,826
0 Depreciation written out on Revaluation Reserve 0
0Depreciation written out on Revaluation taken to (Surplus) or Deficit on the Provision of Services 0
26 Impairment Losses Recognised in the Revaluation Reserve 87
304 Impairment Losses taken to (Surplus) or Deficit on the Provision of Services 184
(19) Derecognitions - Disposals (1,683)
5,471 Depreciation and impairment at 31 March 5,235
Net Book Value
65,853 At 31 March 52,359
2016/17 2017/18
62,053 Land and buildings 49,834
3,800 Vehicles, Plant, Furniture and Equipment 2,525
0 Assets under Construction 0
65,853 Total 52,359
£000 £000
£000 £000
b) Effects of change in estimates There were no material changes in accounting estimates during the financial year. c) Valuations
Capital assets are revalued on the basis of a five year rolling programme in accordance with RICS Guidance, and in the case of council dwellings in accordance with revised guidance on housing stock valuations. In 2017/18 the assets were revalued by Jonathan R Marriott BSc(Hons), MRICS, Principal Estates Surveyor, acting as Internal Valuer within the Council's Regeneration and Environment Services. The Statement of Accounting Policies provides further information on revaluation and depreciation policies. The table below provides an analysis between the carrying value of assets carried in the balance sheet at historical cost and those carried in the balance sheet at fair value together with, in the case of the latter, when assets were revalued.
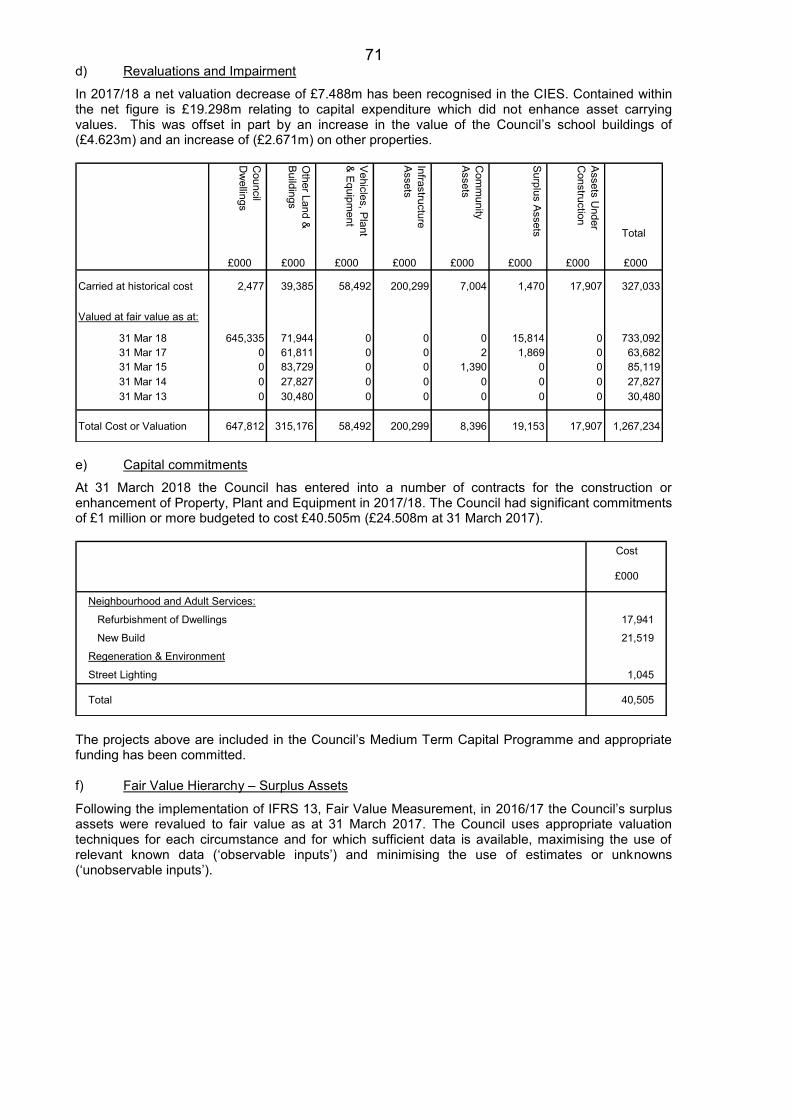
71 d) Revaluations and Impairment
In 2017/18 a net valuation decrease of £7.488m has been recognised in the CIES. Contained within the net figure is £19.298m relating to capital expenditure which did not enhance asset carrying values. This was offset in part by an increase in the value of the Council’s school buildings of (£4.623m) and an increase of (£2.671m) on other properties. C
ouncil D
wellings
Other Land &
Buildings
Vehicles, Plant & Equipm
ent
Infrastructure Assets
Com
munity
Assets
Surplus Assets
Assets Under
Construction
Total
£000 £000 £000 £000 £000 £000 £000 £000
Carried at historical cost 2,477 39,385 58,492 200,299 7,004 1,470 17,907 327,033
Valued at fair value as at:
31 Mar 18 645,335 71,944 0 0 0 15,814 0 733,09231 Mar 17 0 61,811 0 0 2 1,869 0 63,68231 Mar 15 0 83,729 0 0 1,390 0 0 85,11931 Mar 14 0 27,827 0 0 0 0 0 27,82731 Mar 13 0 30,480 0 0 0 0 0 30,480
Total Cost or Valuation 647,812 315,176 58,492 200,299 8,396 19,153 17,907 1,267,234
e) Capital commitments
At 31 March 2018 the Council has entered into a number of contracts for the construction or enhancement of Property, Plant and Equipment in 2017/18. The Council had significant commitments of £1 million or more budgeted to cost £40.505m (£24.508m at 31 March 2017).
Cost
£000
Neighbourhood and Adult Services:
Refurbishment of Dwellings 17,941
New Build 21,519
Regeneration & Environment
Street Lighting 1,045
Total 40,505
The projects above are included in the Council’s Medium Term Capital Programme and appropriate funding has been committed. f) Fair Value Hierarchy – Surplus Assets
Following the implementation of IFRS 13, Fair Value Measurement, in 2016/17 the Council’s surplus assets were revalued to fair value as at 31 March 2017. The Council uses appropriate valuation techniques for each circumstance and for which sufficient data is available, maximising the use of relevant known data (‘observable inputs’) and minimising the use of estimates or unknowns (‘unobservable inputs’).
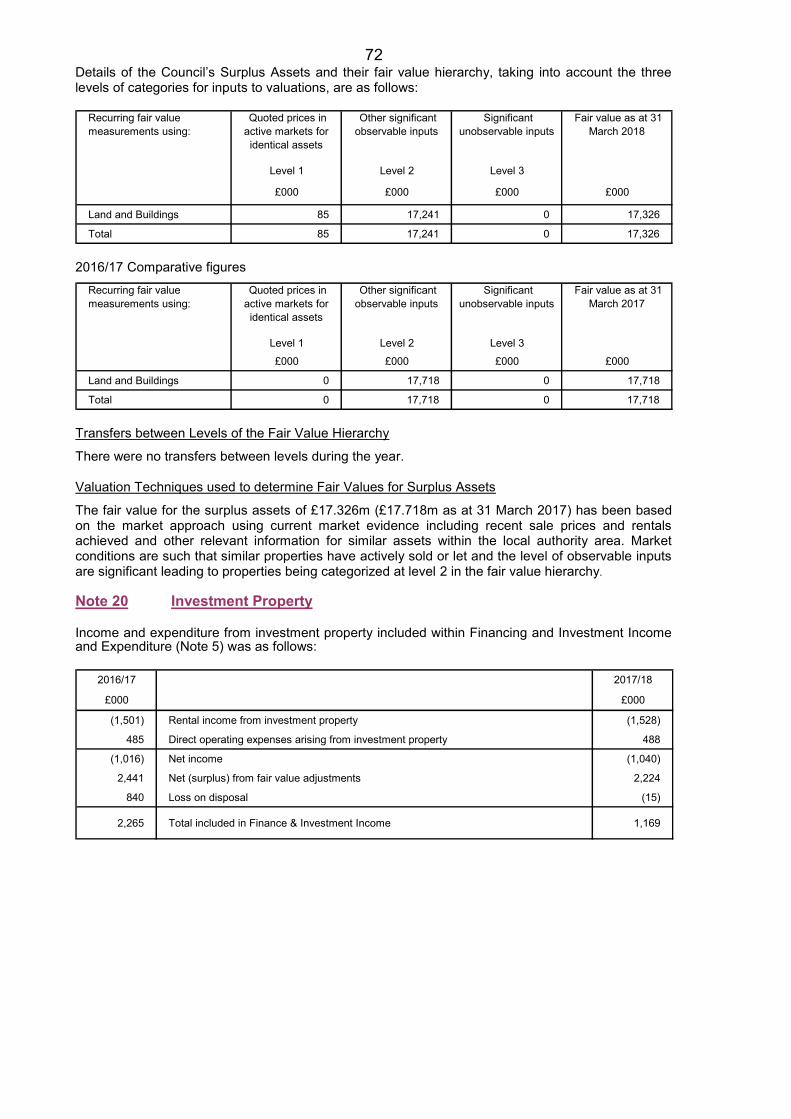
72 Details of the Council’s Surplus Assets and their fair value hierarchy, taking into account the three levels of categories for inputs to valuations, are as follows:
Recurring fair value measurements using:
Quoted prices in active markets for identical assets
Other significant observable inputs
Significant unobservable inputs
Fair value as at 31 March 2018
Level 1 Level 2 Level 3
£000 £000 £000 £000
Land and Buildings 85 17,241 0 17,326
Total 85 17,241 0 17,326
2016/17 Comparative figures
Recurring fair value measurements using:
Quoted prices in active markets for identical assets
Other significant observable inputs
Significant unobservable inputs
Fair value as at 31 March 2017
Level 1 Level 2 Level 3£000 £000 £000 £000
Land and Buildings 0 17,718 0 17,718
Total 0 17,718 0 17,718
Transfers between Levels of the Fair Value Hierarchy
There were no transfers between levels during the year. Valuation Techniques used to determine Fair Values for Surplus Assets
The fair value for the surplus assets of £17.326m (£17.718m as at 31 March 2017) has been based on the market approach using current market evidence including recent sale prices and rentals achieved and other relevant information for similar assets within the local authority area. Market conditions are such that similar properties have actively sold or let and the level of observable inputs are significant leading to properties being categorized at level 2 in the fair value hierarchy. Note 20 Investment Property Income and expenditure from investment property included within Financing and Investment Income and Expenditure (Note 5) was as follows:
2016/17 2017/18
£000 £000
(1,501) Rental income from investment property (1,528)
485 Direct operating expenses arising from investment property 488
(1,016) Net income (1,040)
2,441 Net (surplus) from fair value adjustments 2,224
840 Loss on disposal (15)
2,265 Total included in Finance & Investment Income 1,169
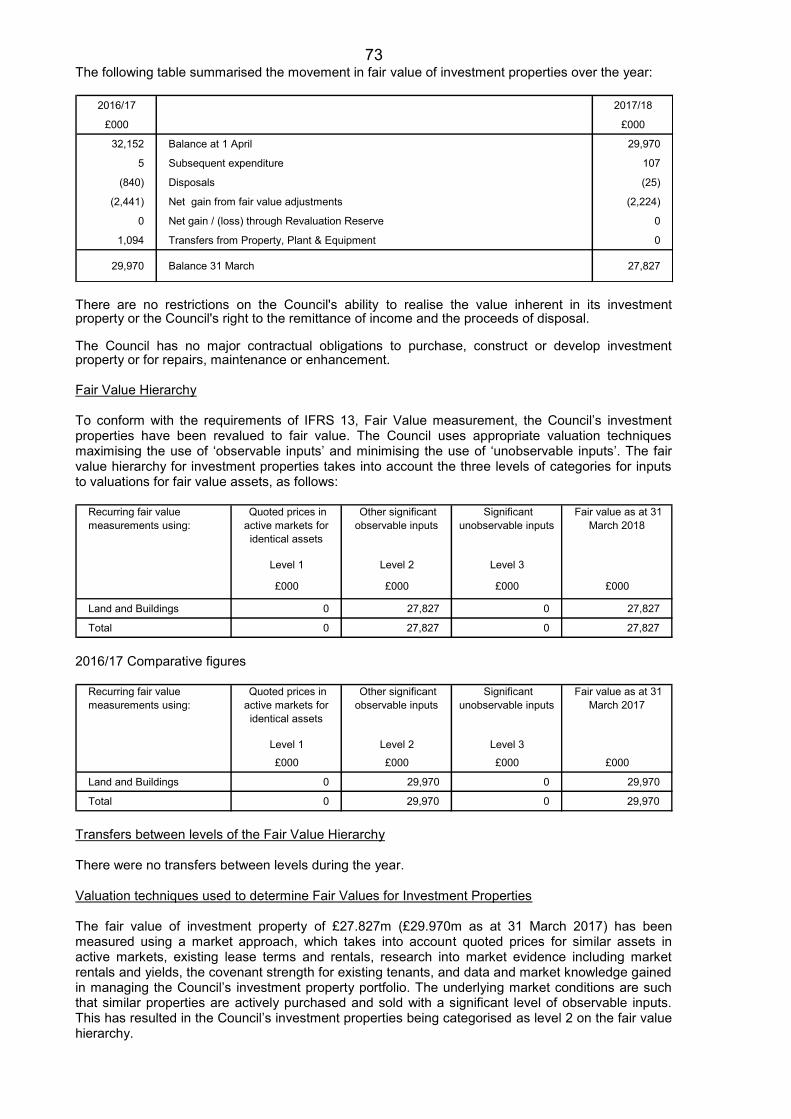
73 The following table summarised the movement in fair value of investment properties over the year:
2016/17 2017/18
£000 £000
32,152 Balance at 1 April 29,970
5 Subsequent expenditure 107
(840) Disposals (25)
(2,441) Net gain from fair value adjustments (2,224)
0 Net gain / (loss) through Revaluation Reserve 0
1,094 Transfers from Property, Plant & Equipment 0
29,970 Balance 31 March 27,827
There are no restrictions on the Council's ability to realise the value inherent in its investment property or the Council's right to the remittance of income and the proceeds of disposal. The Council has no major contractual obligations to purchase, construct or develop investment property or for repairs, maintenance or enhancement. Fair Value Hierarchy To conform with the requirements of IFRS 13, Fair Value measurement, the Council’s investment properties have been revalued to fair value. The Council uses appropriate valuation techniques maximising the use of ‘observable inputs’ and minimising the use of ‘unobservable inputs’. The fair value hierarchy for investment properties takes into account the three levels of categories for inputs to valuations for fair value assets, as follows:
Recurring fair value measurements using:
Quoted prices in active markets for identical assets
Other significant observable inputs
Significant unobservable inputs
Fair value as at 31 March 2018
Level 1 Level 2 Level 3
£000 £000 £000 £000
Land and Buildings 0 27,827 0 27,827
Total 0 27,827 0 27,827
2016/17 Comparative figures
Recurring fair value measurements using:
Quoted prices in active markets for identical assets
Other significant observable inputs
Significant unobservable inputs
Fair value as at 31 March 2017
Level 1 Level 2 Level 3£000 £000 £000 £000
Land and Buildings 0 29,970 0 29,970
Total 0 29,970 0 29,970
Transfers between levels of the Fair Value Hierarchy There were no transfers between levels during the year. Valuation techniques used to determine Fair Values for Investment Properties The fair value of investment property of £27.827m (£29.970m as at 31 March 2017) has been measured using a market approach, which takes into account quoted prices for similar assets in active markets, existing lease terms and rentals, research into market evidence including market rentals and yields, the covenant strength for existing tenants, and data and market knowledge gained in managing the Council’s investment property portfolio. The underlying market conditions are such that similar properties are actively purchased and sold with a significant level of observable inputs. This has resulted in the Council’s investment properties being categorised as level 2 on the fair value hierarchy.
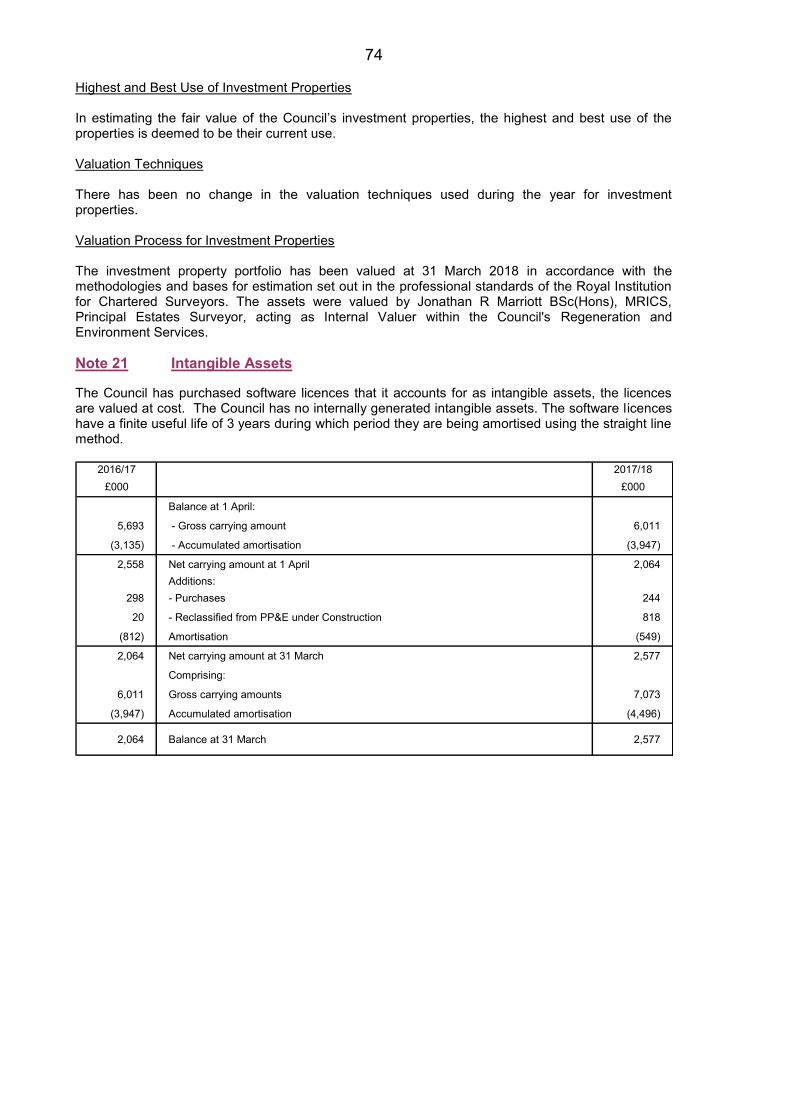
74 Highest and Best Use of Investment Properties In estimating the fair value of the Council’s investment properties, the highest and best use of the properties is deemed to be their current use. Valuation Techniques There has been no change in the valuation techniques used during the year for investment properties. Valuation Process for Investment Properties The investment property portfolio has been valued at 31 March 2018 in accordance with the methodologies and bases for estimation set out in the professional standards of the Royal Institution for Chartered Surveyors. The assets were valued by Jonathan R Marriott BSc(Hons), MRICS, Principal Estates Surveyor, acting as Internal Valuer within the Council's Regeneration and Environment Services. Note 21 Intangible Assets The Council has purchased software licences that it accounts for as intangible assets, the licences are valued at cost. The Council has no internally generated intangible assets. The software licences have a finite useful life of 3 years during which period they are being amortised using the straight line method.
2016/17 2017/18£000 £000
Balance at 1 April:
5,693 - Gross carrying amount 6,011
(3,135) - Accumulated amortisation (3,947)
2,558 Net carrying amount at 1 April 2,064Additions:
298 - Purchases 244
20 - Reclassified from PP&E under Construction 818
(812) Amortisation (549)
2,064 Net carrying amount at 31 March 2,577
Comprising:
6,011 Gross carrying amounts 7,073
(3,947) Accumulated amortisation (4,496)
2,064 Balance at 31 March 2,577
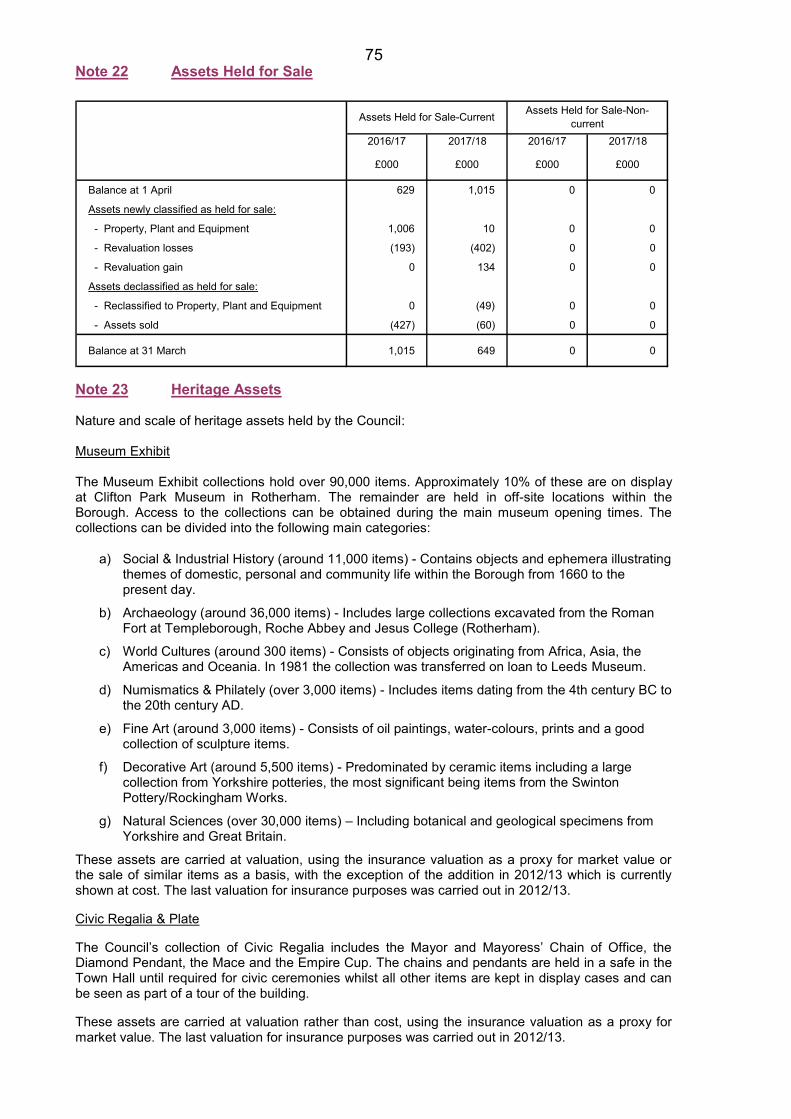
75 Note 22 Assets Held for Sale
2016/17 2017/18 2016/17 2017/18
£000 £000 £000 £000
Balance at 1 April 629 1,015 0 0
Assets newly classified as held for sale:
- Property, Plant and Equipment 1,006 10 0 0
- Revaluation losses (193) (402) 0 0
- Revaluation gain 0 134 0 0
Assets declassified as held for sale:
- Reclassified to Property, Plant and Equipment 0 (49) 0 0
- Assets sold (427) (60) 0 0
Balance at 31 March 1,015 649 0 0
Assets Held for Sale-Current Assets Held for Sale-Non-current
Note 23 Heritage Assets Nature and scale of heritage assets held by the Council: Museum Exhibit The Museum Exhibit collections hold over 90,000 items. Approximately 10% of these are on display at Clifton Park Museum in Rotherham. The remainder are held in off-site locations within the Borough. Access to the collections can be obtained during the main museum opening times. The collections can be divided into the following main categories:
a) Social & Industrial History (around 11,000 items) - Contains objects and ephemera illustrating themes of domestic, personal and community life within the Borough from 1660 to the present day.
b) Archaeology (around 36,000 items) - Includes large collections excavated from the Roman Fort at Templeborough, Roche Abbey and Jesus College (Rotherham).
c) World Cultures (around 300 items) - Consists of objects originating from Africa, Asia, the Americas and Oceania. In 1981 the collection was transferred on loan to Leeds Museum.
d) Numismatics & Philately (over 3,000 items) - Includes items dating from the 4th century BC to the 20th century AD.
e) Fine Art (around 3,000 items) - Consists of oil paintings, water-colours, prints and a good collection of sculpture items.
f) Decorative Art (around 5,500 items) - Predominated by ceramic items including a large collection from Yorkshire potteries, the most significant being items from the Swinton Pottery/Rockingham Works.
g) Natural Sciences (over 30,000 items) – Including botanical and geological specimens from Yorkshire and Great Britain.
These assets are carried at valuation, using the insurance valuation as a proxy for market value or the sale of similar items as a basis, with the exception of the addition in 2012/13 which is currently shown at cost. The last valuation for insurance purposes was carried out in 2012/13.
Civic Regalia & Plate
The Council’s collection of Civic Regalia includes the Mayor and Mayoress’ Chain of Office, the Diamond Pendant, the Mace and the Empire Cup. The chains and pendants are held in a safe in the Town Hall until required for civic ceremonies whilst all other items are kept in display cases and can be seen as part of a tour of the building.
These assets are carried at valuation rather than cost, using the insurance valuation as a proxy for market value. The last valuation for insurance purposes was carried out in 2012/13.
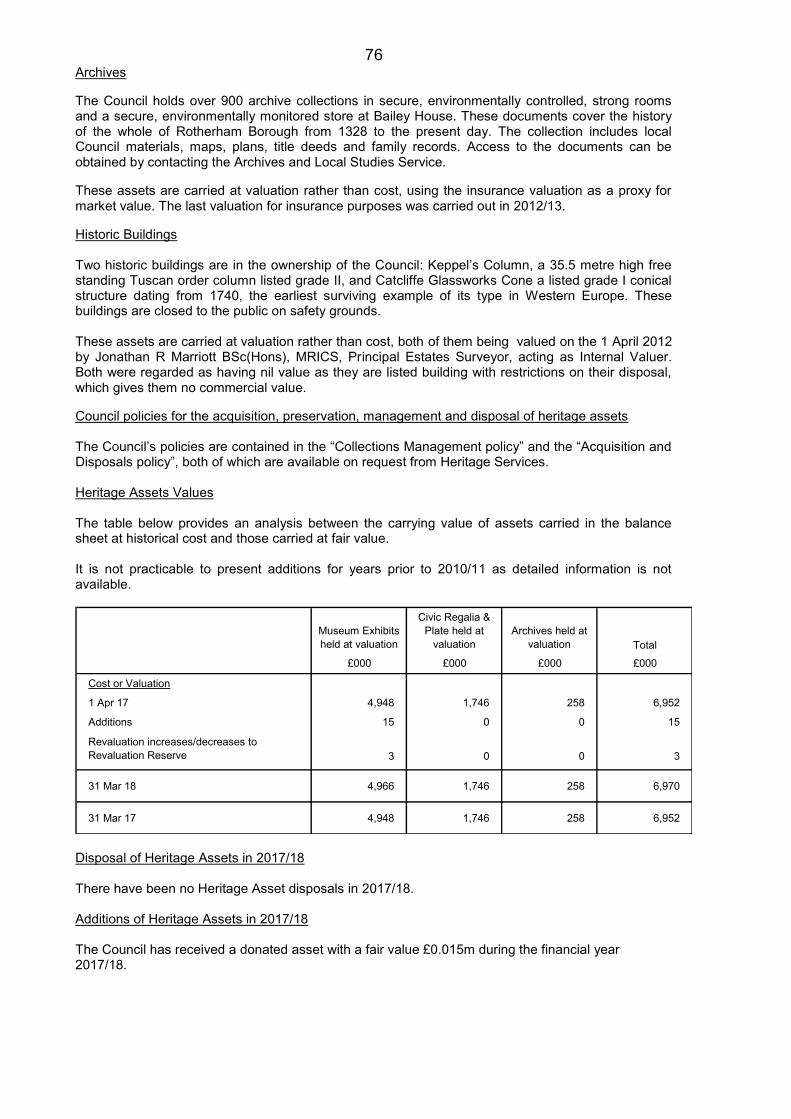
76 Archives
The Council holds over 900 archive collections in secure, environmentally controlled, strong rooms and a secure, environmentally monitored store at Bailey House. These documents cover the history of the whole of Rotherham Borough from 1328 to the present day. The collection includes local Council materials, maps, plans, title deeds and family records. Access to the documents can be obtained by contacting the Archives and Local Studies Service.
These assets are carried at valuation rather than cost, using the insurance valuation as a proxy for market value. The last valuation for insurance purposes was carried out in 2012/13.
Historic Buildings Two historic buildings are in the ownership of the Council: Keppel’s Column, a 35.5 metre high free standing Tuscan order column listed grade II, and Catcliffe Glassworks Cone a listed grade I conical structure dating from 1740, the earliest surviving example of its type in Western Europe. These buildings are closed to the public on safety grounds. These assets are carried at valuation rather than cost, both of them being valued on the 1 April 2012 by Jonathan R Marriott BSc(Hons), MRICS, Principal Estates Surveyor, acting as Internal Valuer. Both were regarded as having nil value as they are listed building with restrictions on their disposal, which gives them no commercial value.
Council policies for the acquisition, preservation, management and disposal of heritage assets The Council’s policies are contained in the “Collections Management policy” and the “Acquisition and Disposals policy”, both of which are available on request from Heritage Services. Heritage Assets Values The table below provides an analysis between the carrying value of assets carried in the balance sheet at historical cost and those carried at fair value. It is not practicable to present additions for years prior to 2010/11 as detailed information is not available.
Museum Exhibits held at valuation
Civic Regalia & Plate held at
valuationArchives held at
valuation Total£000 £000 £000 £000
Cost or Valuation
1 Apr 17 4,948 1,746 258 6,952
Additions 15 0 0 15
Revaluation increases/decreases to Revaluation Reserve 3 0 0 3
31 Mar 18 4,966 1,746 258 6,970
31 Mar 17 4,948 1,746 258 6,952
Disposal of Heritage Assets in 2017/18 There have been no Heritage Asset disposals in 2017/18. Additions of Heritage Assets in 2017/18 The Council has received a donated asset with a fair value £0.015m during the financial year 2017/18.
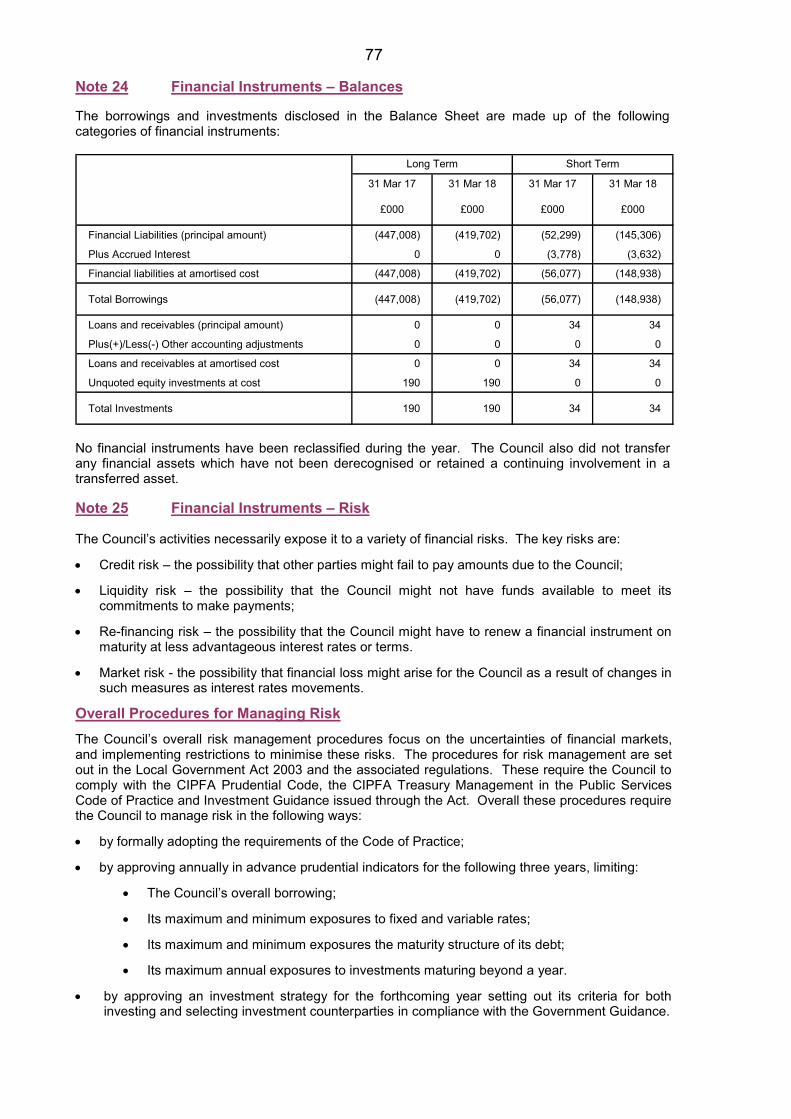
77 Note 24 Financial Instruments – Balances The borrowings and investments disclosed in the Balance Sheet are made up of the following categories of financial instruments:
31 Mar 17 31 Mar 18 31 Mar 17 31 Mar 18
£000 £000 £000 £000
Financial Liabilities (principal amount) (447,008) (419,702) (52,299) (145,306)
Plus Accrued Interest 0 0 (3,778) (3,632)
Financial liabilities at amortised cost (447,008) (419,702) (56,077) (148,938)
Total Borrowings (447,008) (419,702) (56,077) (148,938)
Loans and receivables (principal amount) 0 0 34 34
Plus(+)/Less(-) Other accounting adjustments 0 0 0 0
Loans and receivables at amortised cost 0 0 34 34
Unquoted equity investments at cost 190 190 0 0
Total Investments 190 190 34 34
Long Term Short Term
No financial instruments have been reclassified during the year. The Council also did not transfer any financial assets which have not been derecognised or retained a continuing involvement in a transferred asset. Note 25 Financial Instruments – Risk The Council’s activities necessarily expose it to a variety of financial risks. The key risks are:
Credit risk – the possibility that other parties might fail to pay amounts due to the Council;
Liquidity risk – the possibility that the Council might not have funds available to meet its commitments to make payments;
Re-financing risk – the possibility that the Council might have to renew a financial instrument on maturity at less advantageous interest rates or terms.
Market risk - the possibility that financial loss might arise for the Council as a result of changes in such measures as interest rates movements.
Overall Procedures for Managing Risk
The Council’s overall risk management procedures focus on the uncertainties of financial markets, and implementing restrictions to minimise these risks. The procedures for risk management are set out in the Local Government Act 2003 and the associated regulations. These require the Council to comply with the CIPFA Prudential Code, the CIPFA Treasury Management in the Public Services Code of Practice and Investment Guidance issued through the Act. Overall these procedures require the Council to manage risk in the following ways:
by formally adopting the requirements of the Code of Practice;
by approving annually in advance prudential indicators for the following three years, limiting:
The Council’s overall borrowing;
Its maximum and minimum exposures to fixed and variable rates;
Its maximum and minimum exposures the maturity structure of its debt;
Its maximum annual exposures to investments maturing beyond a year.
by approving an investment strategy for the forthcoming year setting out its criteria for both investing and selecting investment counterparties in compliance with the Government Guidance.
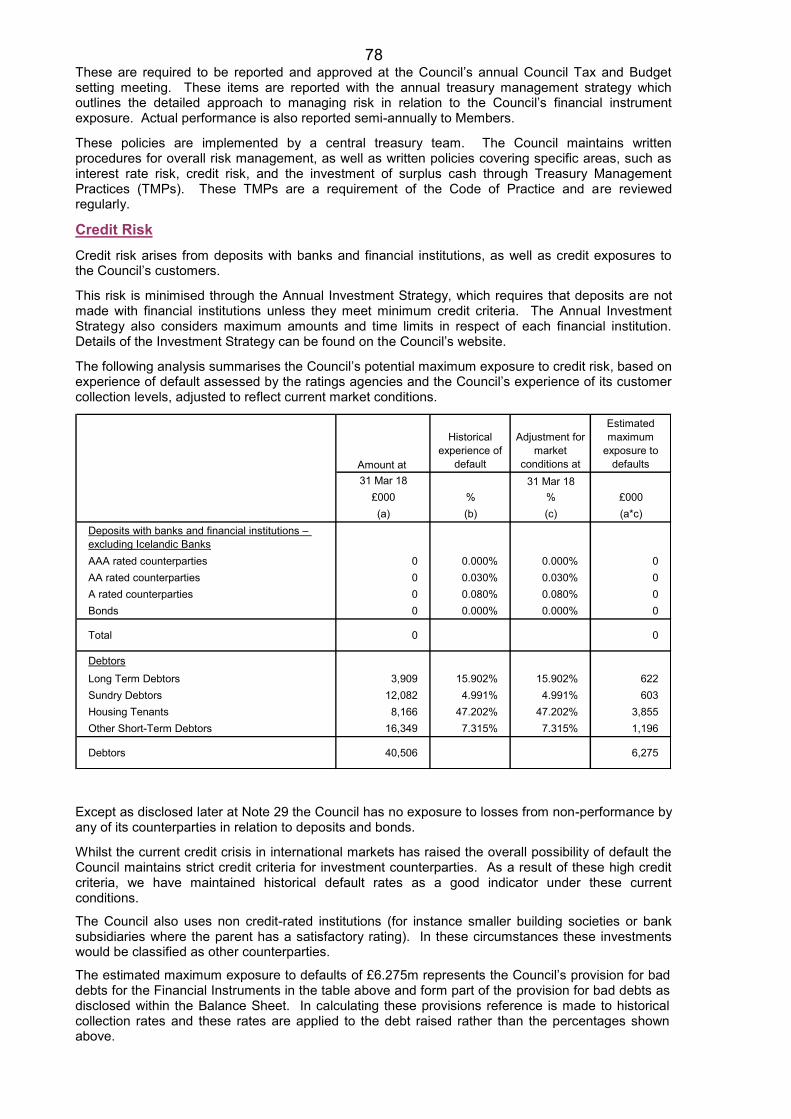
78 These are required to be reported and approved at the Council’s annual Council Tax and Budget setting meeting. These items are reported with the annual treasury management strategy which outlines the detailed approach to managing risk in relation to the Council’s financial instrument exposure. Actual performance is also reported semi-annually to Members.
These policies are implemented by a central treasury team. The Council maintains written procedures for overall risk management, as well as written policies covering specific areas, such as interest rate risk, credit risk, and the investment of surplus cash through Treasury Management Practices (TMPs). These TMPs are a requirement of the Code of Practice and are reviewed regularly.
Credit Risk
Credit risk arises from deposits with banks and financial institutions, as well as credit exposures to the Council’s customers.
This risk is minimised through the Annual Investment Strategy, which requires that deposits are not made with financial institutions unless they meet minimum credit criteria. The Annual Investment Strategy also considers maximum amounts and time limits in respect of each financial institution. Details of the Investment Strategy can be found on the Council’s website.
The following analysis summarises the Council’s potential maximum exposure to credit risk, based on experience of default assessed by the ratings agencies and the Council’s experience of its customer collection levels, adjusted to reflect current market conditions.
Amount at
Historical experience of
default
Adjustment for market
conditions at
Estimated maximum
exposure to defaults
31 Mar 18 31 Mar 18£000 % % £000(a) (b) (c) (a*c)
Deposits with banks and financial institutions – excluding Icelandic BanksAAA rated counterparties 0 0.000% 0.000% 0AA rated counterparties 0 0.030% 0.030% 0A rated counterparties 0 0.080% 0.080% 0Bonds 0 0.000% 0.000% 0
Total 0 0
DebtorsLong Term Debtors 3,909 15.902% 15.902% 622Sundry Debtors 12,082 4.991% 4.991% 603Housing Tenants 8,166 47.202% 47.202% 3,855Other Short-Term Debtors 16,349 7.315% 7.315% 1,196
Debtors 40,506 6,275
Except as disclosed later at Note 29 the Council has no exposure to losses from non-performance by any of its counterparties in relation to deposits and bonds.
Whilst the current credit crisis in international markets has raised the overall possibility of default the Council maintains strict credit criteria for investment counterparties. As a result of these high credit criteria, we have maintained historical default rates as a good indicator under these current conditions.
The Council also uses non credit-rated institutions (for instance smaller building societies or bank subsidiaries where the parent has a satisfactory rating). In these circumstances these investments would be classified as other counterparties.
The estimated maximum exposure to defaults of £6.275m represents the Council’s provision for bad debts for the Financial Instruments in the table above and form part of the provision for bad debts as disclosed within the Balance Sheet. In calculating these provisions reference is made to historical collection rates and these rates are applied to the debt raised rather than the percentages shown above.
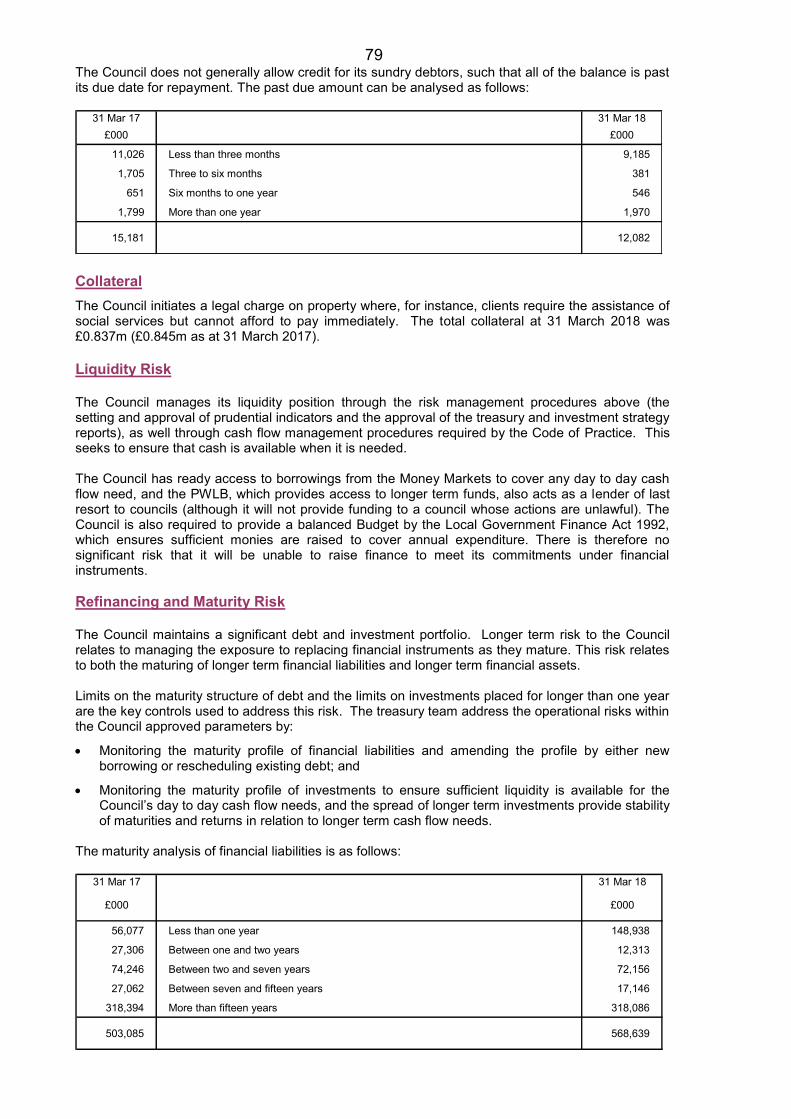
79 The Council does not generally allow credit for its sundry debtors, such that all of the balance is past its due date for repayment. The past due amount can be analysed as follows:
31 Mar 17 31 Mar 18£000 £000
11,026 Less than three months 9,185
1,705 Three to six months 381
651 Six months to one year 546
1,799 More than one year 1,970
15,181 12,082
Collateral The Council initiates a legal charge on property where, for instance, clients require the assistance of social services but cannot afford to pay immediately. The total collateral at 31 March 2018 was £0.837m (£0.845m as at 31 March 2017). Liquidity Risk The Council manages its liquidity position through the risk management procedures above (the setting and approval of prudential indicators and the approval of the treasury and investment strategy reports), as well through cash flow management procedures required by the Code of Practice. This seeks to ensure that cash is available when it is needed. The Council has ready access to borrowings from the Money Markets to cover any day to day cash flow need, and the PWLB, which provides access to longer term funds, also acts as a lender of last resort to councils (although it will not provide funding to a council whose actions are unlawful). The Council is also required to provide a balanced Budget by the Local Government Finance Act 1992, which ensures sufficient monies are raised to cover annual expenditure. There is therefore no significant risk that it will be unable to raise finance to meet its commitments under financial instruments. Refinancing and Maturity Risk The Council maintains a significant debt and investment portfolio. Longer term risk to the Council relates to managing the exposure to replacing financial instruments as they mature. This risk relates to both the maturing of longer term financial liabilities and longer term financial assets. Limits on the maturity structure of debt and the limits on investments placed for longer than one year are the key controls used to address this risk. The treasury team address the operational risks within the Council approved parameters by:
Monitoring the maturity profile of financial liabilities and amending the profile by either new borrowing or rescheduling existing debt; and
Monitoring the maturity profile of investments to ensure sufficient liquidity is available for the Council’s day to day cash flow needs, and the spread of longer term investments provide stability of maturities and returns in relation to longer term cash flow needs.
The maturity analysis of financial liabilities is as follows:
31 Mar 17 31 Mar 18
£000 £000
56,077 Less than one year 148,938
27,306 Between one and two years 12,313
74,246 Between two and seven years 72,156
27,062 Between seven and fifteen years 17,146
318,394 More than fifteen years 318,086
503,085 568,639
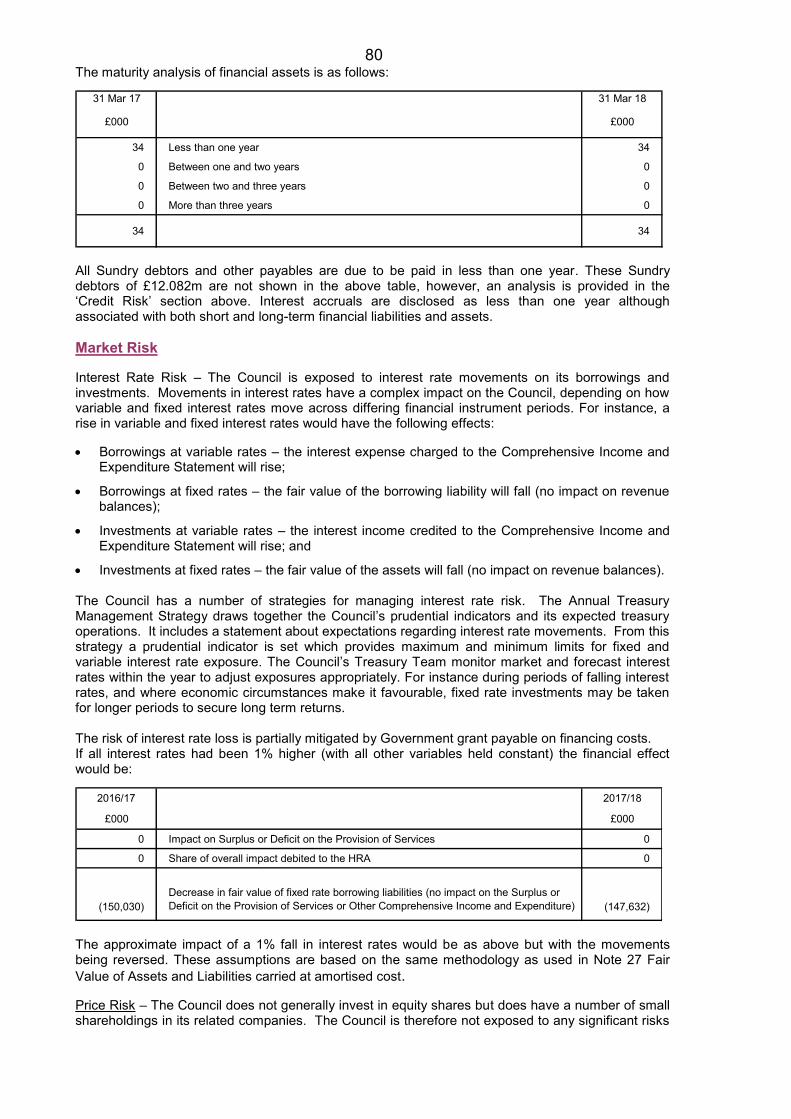
80 The maturity analysis of financial assets is as follows:
31 Mar 17 31 Mar 18
£000 £000
34 Less than one year 34
0 Between one and two years 0
0 Between two and three years 0
0 More than three years 0
34 34
All Sundry debtors and other payables are due to be paid in less than one year. These Sundry debtors of £12.082m are not shown in the above table, however, an analysis is provided in the ‘Credit Risk’ section above. Interest accruals are disclosed as less than one year although associated with both short and long-term financial liabilities and assets. Market Risk Interest Rate Risk – The Council is exposed to interest rate movements on its borrowings and investments. Movements in interest rates have a complex impact on the Council, depending on how variable and fixed interest rates move across differing financial instrument periods. For instance, a rise in variable and fixed interest rates would have the following effects: Borrowings at variable rates – the interest expense charged to the Comprehensive Income and
Expenditure Statement will rise;
Borrowings at fixed rates – the fair value of the borrowing liability will fall (no impact on revenue balances);
Investments at variable rates – the interest income credited to the Comprehensive Income and Expenditure Statement will rise; and
Investments at fixed rates – the fair value of the assets will fall (no impact on revenue balances). The Council has a number of strategies for managing interest rate risk. The Annual Treasury Management Strategy draws together the Council’s prudential indicators and its expected treasury operations. It includes a statement about expectations regarding interest rate movements. From this strategy a prudential indicator is set which provides maximum and minimum limits for fixed and variable interest rate exposure. The Council’s Treasury Team monitor market and forecast interest rates within the year to adjust exposures appropriately. For instance during periods of falling interest rates, and where economic circumstances make it favourable, fixed rate investments may be taken for longer periods to secure long term returns. The risk of interest rate loss is partially mitigated by Government grant payable on financing costs. If all interest rates had been 1% higher (with all other variables held constant) the financial effect would be:
2016/17 2017/18
£000 £000
0 Impact on Surplus or Deficit on the Provision of Services 0
0 Share of overall impact debited to the HRA 0
(150,030)Decrease in fair value of fixed rate borrowing liabilities (no impact on the Surplus or Deficit on the Provision of Services or Other Comprehensive Income and Expenditure) (147,632)
The approximate impact of a 1% fall in interest rates would be as above but with the movements being reversed. These assumptions are based on the same methodology as used in Note 27 Fair Value of Assets and Liabilities carried at amortised cost. Price Risk – The Council does not generally invest in equity shares but does have a number of small shareholdings in its related companies. The Council is therefore not exposed to any significant risks
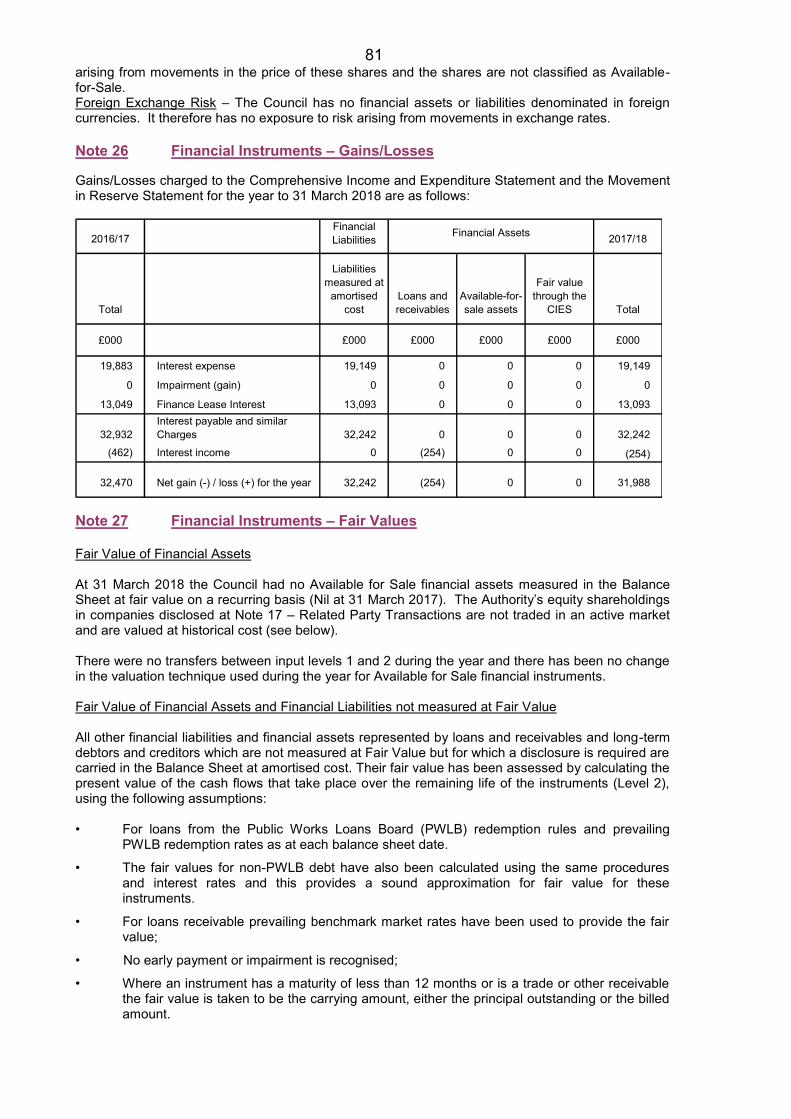
81 arising from movements in the price of these shares and the shares are not classified as Available-for-Sale. Foreign Exchange Risk – The Council has no financial assets or liabilities denominated in foreign currencies. It therefore has no exposure to risk arising from movements in exchange rates. Note 26 Financial Instruments – Gains/Losses Gains/Losses charged to the Comprehensive Income and Expenditure Statement and the Movement in Reserve Statement for the year to 31 March 2018 are as follows:
2016/17Financial Liabilities 2017/18
Total
Liabilities measured at
amortised cost
Loans and receivables
Available-for-sale assets
Fair value through the
CIES Total
£000 £000 £000 £000 £000 £000
19,883 Interest expense 19,149 0 0 0 19,149
0 Impairment (gain) 0 0 0 0 0
13,049 Finance Lease Interest 13,093 0 0 0 13,093
32,932Interest payable and similar Charges 32,242 0 0 0 32,242
(462) Interest income 0 (254) 0 0 (254)
32,470 Net gain (-) / loss (+) for the year 32,242 (254) 0 0 31,988
Financial Assets
Note 27 Financial Instruments – Fair Values Fair Value of Financial Assets At 31 March 2018 the Council had no Available for Sale financial assets measured in the Balance Sheet at fair value on a recurring basis (Nil at 31 March 2017). The Authority’s equity shareholdings in companies disclosed at Note 17 – Related Party Transactions are not traded in an active market and are valued at historical cost (see below). There were no transfers between input levels 1 and 2 during the year and there has been no change in the valuation technique used during the year for Available for Sale financial instruments. Fair Value of Financial Assets and Financial Liabilities not measured at Fair Value All other financial liabilities and financial assets represented by loans and receivables and long-term debtors and creditors which are not measured at Fair Value but for which a disclosure is required are carried in the Balance Sheet at amortised cost. Their fair value has been assessed by calculating the present value of the cash flows that take place over the remaining life of the instruments (Level 2), using the following assumptions: • For loans from the Public Works Loans Board (PWLB) redemption rules and prevailing
PWLB redemption rates as at each balance sheet date.
• The fair values for non-PWLB debt have also been calculated using the same procedures and interest rates and this provides a sound approximation for fair value for these instruments.
• For loans receivable prevailing benchmark market rates have been used to provide the fair value;
• No early payment or impairment is recognised;
• Where an instrument has a maturity of less than 12 months or is a trade or other receivable the fair value is taken to be the carrying amount, either the principal outstanding or the billed amount.
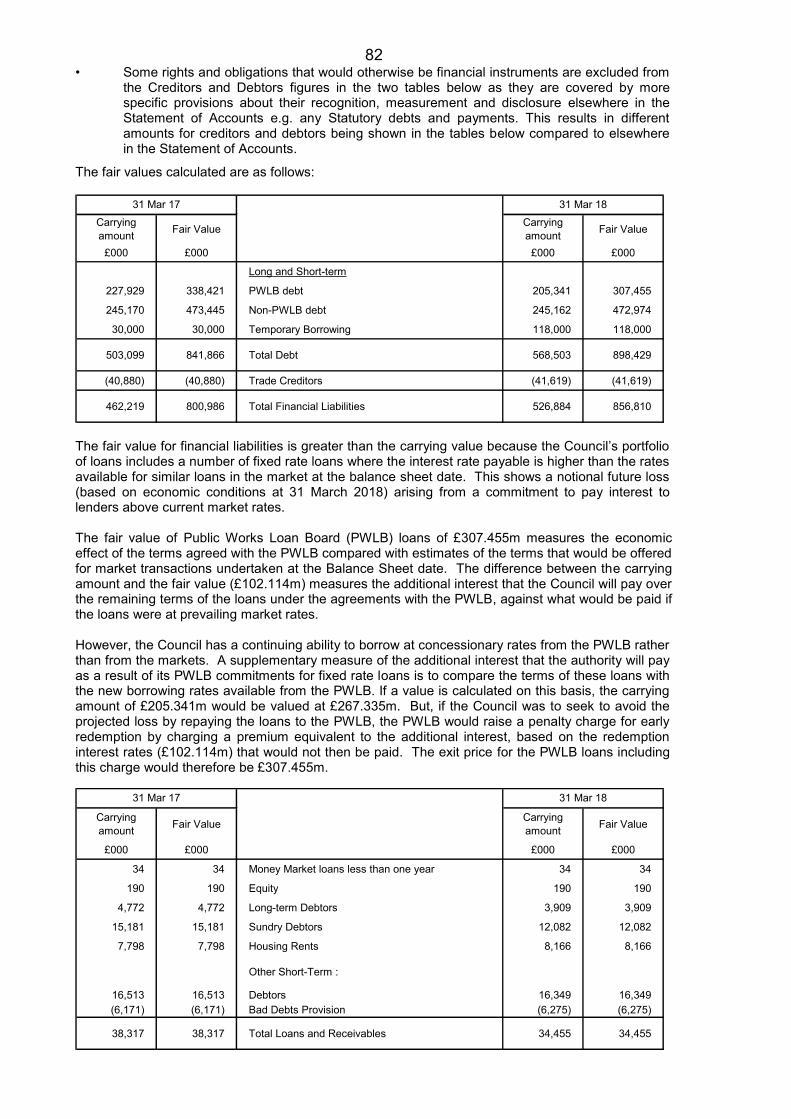
82 • Some rights and obligations that would otherwise be financial instruments are excluded from
the Creditors and Debtors figures in the two tables below as they are covered by more specific provisions about their recognition, measurement and disclosure elsewhere in the Statement of Accounts e.g. any Statutory debts and payments. This results in different amounts for creditors and debtors being shown in the tables below compared to elsewhere in the Statement of Accounts.
The fair values calculated are as follows:
Carrying amount Fair Value Carrying
amount Fair Value
£000 £000 £000 £000
Long and Short-term
227,929 338,421 PWLB debt 205,341 307,455
245,170 473,445 Non-PWLB debt 245,162 472,974
30,000 30,000 Temporary Borrowing 118,000 118,000
503,099 841,866 Total Debt 568,503 898,429
(40,880) (40,880) Trade Creditors (41,619) (41,619)
462,219 800,986 Total Financial Liabilities 526,884 856,810
31 Mar 17 31 Mar 18
The fair value for financial liabilities is greater than the carrying value because the Council’s portfolio of loans includes a number of fixed rate loans where the interest rate payable is higher than the rates available for similar loans in the market at the balance sheet date. This shows a notional future loss (based on economic conditions at 31 March 2018) arising from a commitment to pay interest to lenders above current market rates. The fair value of Public Works Loan Board (PWLB) loans of £307.455m measures the economic effect of the terms agreed with the PWLB compared with estimates of the terms that would be offered for market transactions undertaken at the Balance Sheet date. The difference between the carrying amount and the fair value (£102.114m) measures the additional interest that the Council will pay over the remaining terms of the loans under the agreements with the PWLB, against what would be paid if the loans were at prevailing market rates. However, the Council has a continuing ability to borrow at concessionary rates from the PWLB rather than from the markets. A supplementary measure of the additional interest that the authority will pay as a result of its PWLB commitments for fixed rate loans is to compare the terms of these loans with the new borrowing rates available from the PWLB. If a value is calculated on this basis, the carrying amount of £205.341m would be valued at £267.335m. But, if the Council was to seek to avoid the projected loss by repaying the loans to the PWLB, the PWLB would raise a penalty charge for early redemption by charging a premium equivalent to the additional interest, based on the redemption interest rates (£102.114m) that would not then be paid. The exit price for the PWLB loans including this charge would therefore be £307.455m.
Carrying amount Fair Value Carrying
amount Fair Value
£000 £000 £000 £000
34 34 Money Market loans less than one year 34 34
190 190 Equity 190 190
4,772 4,772 Long-term Debtors 3,909 3,909
15,181 15,181 Sundry Debtors 12,082 12,082
7,798 7,798 Housing Rents 8,166 8,166
Other Short-Term :
16,513 16,513 Debtors 16,349 16,349(6,171) (6,171) Bad Debts Provision (6,275) (6,275)
38,317 38,317 Total Loans and Receivables 34,455 34,455
31 Mar 17 31 Mar 18
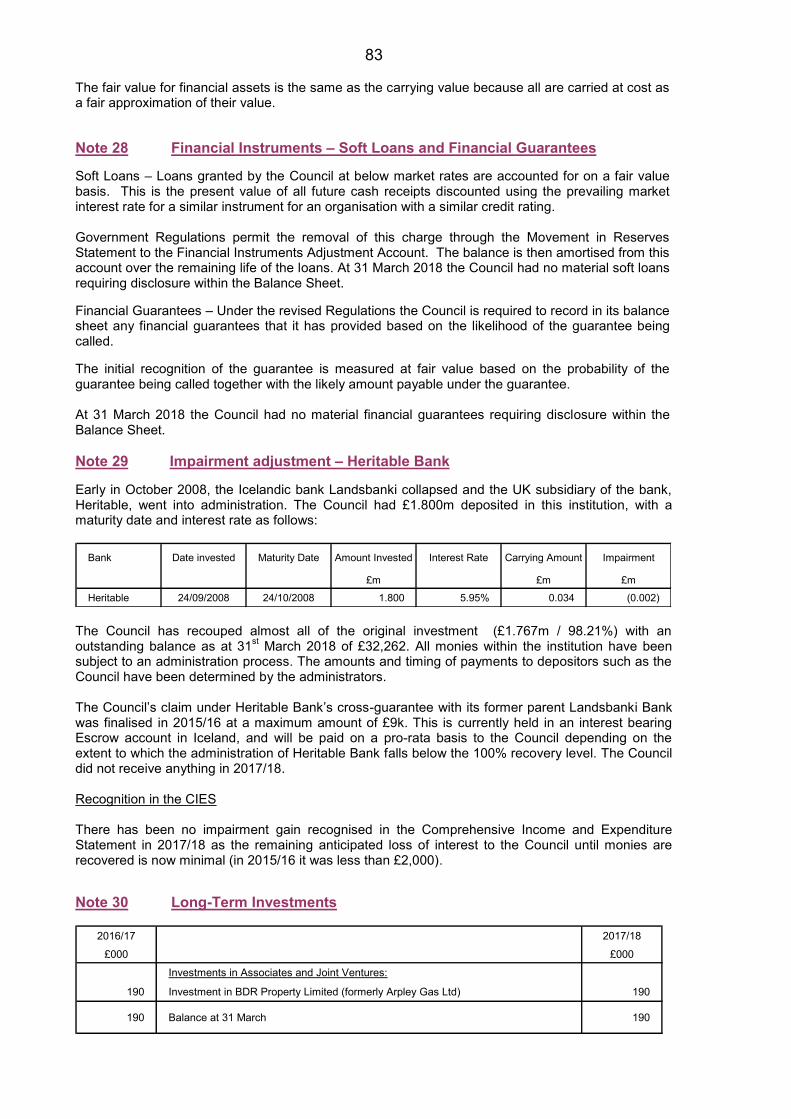
83 The fair value for financial assets is the same as the carrying value because all are carried at cost as a fair approximation of their value. Note 28 Financial Instruments – Soft Loans and Financial Guarantees Soft Loans – Loans granted by the Council at below market rates are accounted for on a fair value basis. This is the present value of all future cash receipts discounted using the prevailing market interest rate for a similar instrument for an organisation with a similar credit rating. Government Regulations permit the removal of this charge through the Movement in Reserves Statement to the Financial Instruments Adjustment Account. The balance is then amortised from this account over the remaining life of the loans. At 31 March 2018 the Council had no material soft loans requiring disclosure within the Balance Sheet. Financial Guarantees – Under the revised Regulations the Council is required to record in its balance sheet any financial guarantees that it has provided based on the likelihood of the guarantee being called. The initial recognition of the guarantee is measured at fair value based on the probability of the guarantee being called together with the likely amount payable under the guarantee. At 31 March 2018 the Council had no material financial guarantees requiring disclosure within the Balance Sheet. Note 29 Impairment adjustment – Heritable Bank Early in October 2008, the Icelandic bank Landsbanki collapsed and the UK subsidiary of the bank, Heritable, went into administration. The Council had £1.800m deposited in this institution, with a maturity date and interest rate as follows:
Bank Date invested Maturity Date Amount Invested Interest Rate Carrying Amount Impairment
£m £m £m
Heritable 24/09/2008 24/10/2008 1.800 5.95% 0.034 (0.002) The Council has recouped almost all of the original investment (£1.767m / 98.21%) with an outstanding balance as at 31st March 2018 of £32,262. All monies within the institution have been subject to an administration process. The amounts and timing of payments to depositors such as the Council have been determined by the administrators. The Council’s claim under Heritable Bank’s cross-guarantee with its former parent Landsbanki Bank was finalised in 2015/16 at a maximum amount of £9k. This is currently held in an interest bearing Escrow account in Iceland, and will be paid on a pro-rata basis to the Council depending on the extent to which the administration of Heritable Bank falls below the 100% recovery level. The Council did not receive anything in 2017/18. Recognition in the CIES There has been no impairment gain recognised in the Comprehensive Income and Expenditure Statement in 2017/18 as the remaining anticipated loss of interest to the Council until monies are recovered is now minimal (in 2015/16 it was less than £2,000). Note 30 Long-Term Investments
2016/17 2017/18
£000 £000
Investments in Associates and Joint Ventures:
190 Investment in BDR Property Limited (formerly Arpley Gas Ltd) 190
190 Balance at 31 March 190
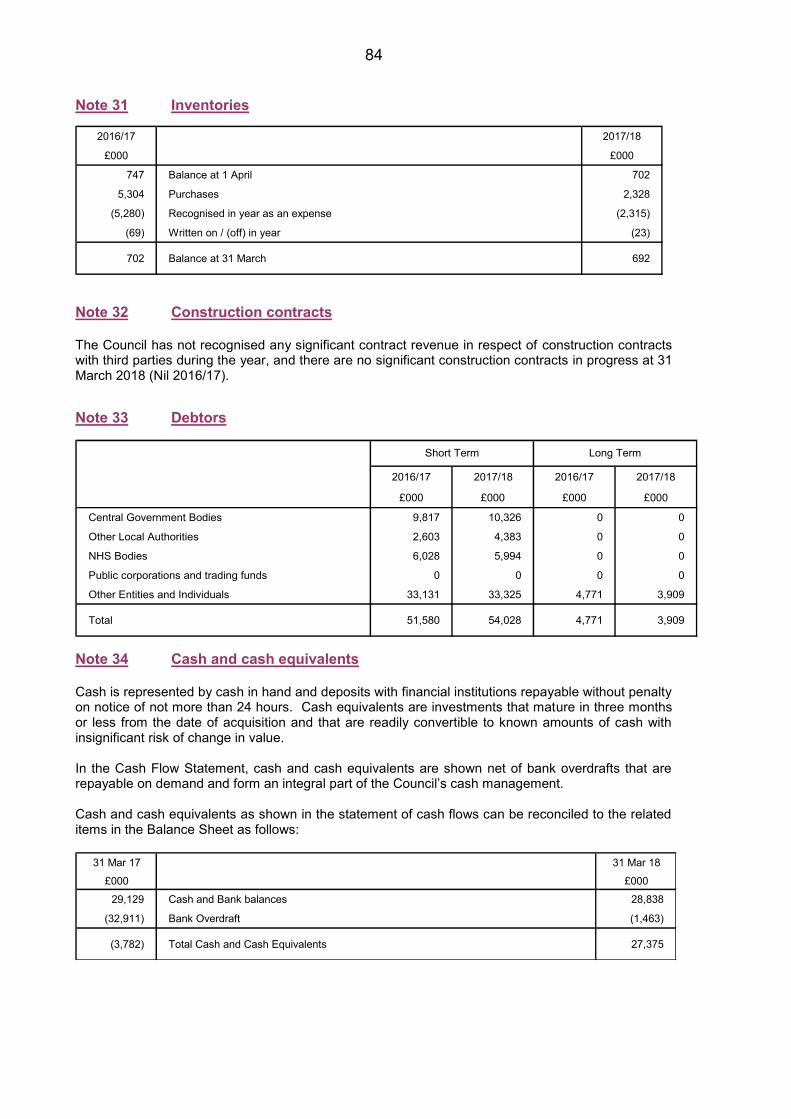
84 Note 31 Inventories
2016/17 2017/18
£000 £000
747 Balance at 1 April 702
5,304 Purchases 2,328
(5,280) Recognised in year as an expense (2,315)
(69) Written on / (off) in year (23)
702 Balance at 31 March 692
Note 32 Construction contracts The Council has not recognised any significant contract revenue in respect of construction contracts with third parties during the year, and there are no significant construction contracts in progress at 31 March 2018 (Nil 2016/17). Note 33 Debtors
2016/17 2017/18 2016/17 2017/18
£000 £000 £000 £000
Central Government Bodies 9,817 10,326 0 0
Other Local Authorities 2,603 4,383 0 0
NHS Bodies 6,028 5,994 0 0
Public corporations and trading funds 0 0 0 0
Other Entities and Individuals 33,131 33,325 4,771 3,909
Total 51,580 54,028 4,771 3,909
Long TermShort Term
Note 34 Cash and cash equivalents Cash is represented by cash in hand and deposits with financial institutions repayable without penalty on notice of not more than 24 hours. Cash equivalents are investments that mature in three months or less from the date of acquisition and that are readily convertible to known amounts of cash with insignificant risk of change in value.
In the Cash Flow Statement, cash and cash equivalents are shown net of bank overdrafts that are repayable on demand and form an integral part of the Council’s cash management. Cash and cash equivalents as shown in the statement of cash flows can be reconciled to the related items in the Balance Sheet as follows:
31 Mar 17 31 Mar 18
£000 £000
29,129 Cash and Bank balances 28,838
(32,911) Bank Overdraft (1,463)
(3,782) Total Cash and Cash Equivalents 27,375
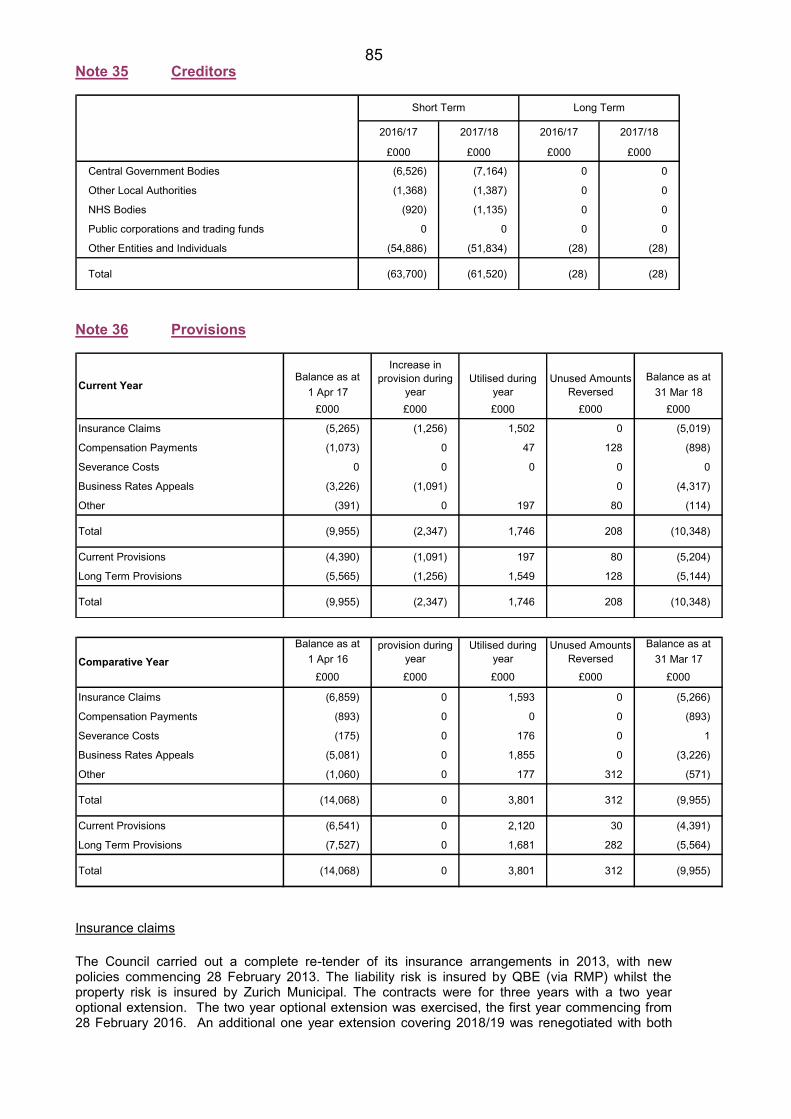
85 Note 35 Creditors
2016/17 2017/18 2016/17 2017/18
£000 £000 £000 £000
Central Government Bodies (6,526) (7,164) 0 0
Other Local Authorities (1,368) (1,387) 0 0
NHS Bodies (920) (1,135) 0 0
Public corporations and trading funds 0 0 0 0
Other Entities and Individuals (54,886) (51,834) (28) (28)
Total (63,700) (61,520) (28) (28)
Short Term Long Term
Note 36 Provisions
Balance as at Balance as at 1 Apr 17 31 Mar 18
£000 £000 £000 £000 £000
Insurance Claims (5,265) (1,256) 1,502 0 (5,019)
Compensation Payments (1,073) 0 47 128 (898)
Severance Costs 0 0 0 0 0
Business Rates Appeals (3,226) (1,091) 0 (4,317)
Other (391) 0 197 80 (114)
Total (9,955) (2,347) 1,746 208 (10,348)
Current Provisions (4,390) (1,091) 197 80 (5,204)
Long Term Provisions (5,565) (1,256) 1,549 128 (5,144)
Total (9,955) (2,347) 1,746 208 (10,348)
Current Year
Increase in provision during
yearUtilised during
yearUnused Amounts
Reversed
Balance as at Balance as at
1 Apr 16 31 Mar 17£000 £000 £000 £000 £000
Insurance Claims (6,859) 0 1,593 0 (5,266)
Compensation Payments (893) 0 0 0 (893)
Severance Costs (175) 0 176 0 1
Business Rates Appeals (5,081) 0 1,855 0 (3,226)
Other (1,060) 0 177 312 (571)
Total (14,068) 0 3,801 312 (9,955)
Current Provisions (6,541) 0 2,120 30 (4,391)
Long Term Provisions (7,527) 0 1,681 282 (5,564)
Total (14,068) 0 3,801 312 (9,955)
Increase in provision during
yearUtilised during
yearUnused Amounts
ReversedComparative Year
Insurance claims The Council carried out a complete re-tender of its insurance arrangements in 2013, with new policies commencing 28 February 2013. The liability risk is insured by QBE (via RMP) whilst the property risk is insured by Zurich Municipal. The contracts were for three years with a two year optional extension. The two year optional extension was exercised, the first year commencing from 28 February 2016. An additional one year extension covering 2018/19 was renegotiated with both
86 insurers upon expiry of the original two year option; policies will be completely re-tendered in 2018 with the new policies commencing 28 February 2019. In balancing the cost of insurance against the risk of a liability arising, the Council has elected to meet the policy excess in respect of certain types of claim (Employers Liability and Public Liability) and to co-insure or self-insure itself against other types of claim by operating an Insurance Fund. Details of the different types of claim covered by this arrangement are set out below. The Council keeps under review the best estimate of the likely liability falling on the Insurance Fund by reference to recent claims history, repudiation rates and other relevant factors and the expert advice of the Council’s legal representatives on larger more complex claims. The provision in this year’s accounts covers the estimated residual liability relating to claims settled by Municipal Mutual Insurance (MMI) which, under the terms of MMI’s Scheme of Arrangement, can no longer be met in full and therefore require a proportion to be repaid by the local authorities who were members of MMI when it went into solvent liquidation in 1992. This includes the Council. The Council continues to liaise with its insurers and legal advisors to ascertain the extent to which the Council’s insurance policies can be used to meet liabilities arising from compensation claims that have been brought in relation to child sexual exploitation cases. (a) Employers Liability and Public Liability
Since the demise of Municipal Mutual Insurance (MMI) in 1992, many authorities have been retaining and funding their liability losses, third party, highways third party and employers’ liability, up to an agreed threshold per claim. For several years, this remained static at £100,000, however, with effect from 28 February 2015, the Council now meets the first £250,000 of every settlement. In effect the Insurance Fund meets the majority of settlements determined by the insurers.
(b) Fire
The Fund acts as a co-insurer, up to a stop-loss limit of £350,000 in any one period of insurance.
The Fund bears the first £50,000 of all claims involving education, municipal and housing property.
(c) Motor
All accidental damage to our own vehicles is self-funded. The Fund recoups the cost from user departments/services via an annual charge per vehicle. There is an excess of £500 on all claims (£1,000 for thefts) which is met initially by the Fund and recharged to owning departments. Third party risks remain with the external insurer.
(d) Council Flats – Added Perils
The Fund insures blocks of flats for added perils where one or more flats have been sold under the right to buy arrangements.
(e) ICT Equipment
Where requested, schools ICT equipment is insured on the Fund on an ‘All-Risks’ basis.
(f) Other Equipment
Where requested, schools’ musical instruments, televisual and video equipment, Youth & Community equipment and office equipment are insured on the Fund on an ‘All-Risks’ basis. In addition schools can insure many other items if desired.
In addition to the above there are many smaller risks which are self-insured including:
Schools PABX Equipment ‘Time on Risk’ Cover The York and Lancaster Exhibition
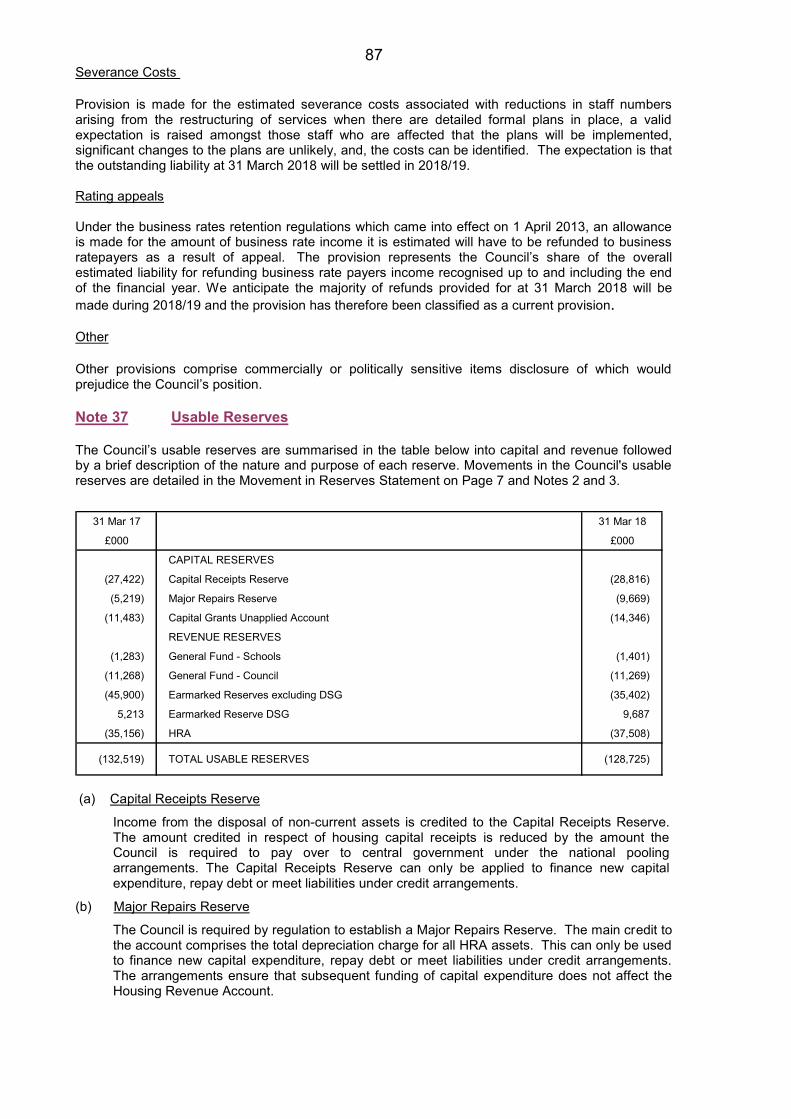
87 Severance Costs Provision is made for the estimated severance costs associated with reductions in staff numbers arising from the restructuring of services when there are detailed formal plans in place, a valid expectation is raised amongst those staff who are affected that the plans will be implemented, significant changes to the plans are unlikely, and, the costs can be identified. The expectation is that the outstanding liability at 31 March 2018 will be settled in 2018/19. Rating appeals Under the business rates retention regulations which came into effect on 1 April 2013, an allowance is made for the amount of business rate income it is estimated will have to be refunded to business ratepayers as a result of appeal. The provision represents the Council’s share of the overall estimated liability for refunding business rate payers income recognised up to and including the end of the financial year. We anticipate the majority of refunds provided for at 31 March 2018 will be made during 2018/19 and the provision has therefore been classified as a current provision. Other Other provisions comprise commercially or politically sensitive items disclosure of which would prejudice the Council’s position. Note 37 Usable Reserves The Council’s usable reserves are summarised in the table below into capital and revenue followed by a brief description of the nature and purpose of each reserve. Movements in the Council's usable reserves are detailed in the Movement in Reserves Statement on Page 7 and Notes 2 and 3.
31 Mar 17 31 Mar 18
£000 £000
CAPITAL RESERVES
(27,422) Capital Receipts Reserve (28,816)
(5,219) Major Repairs Reserve (9,669)
(11,483) Capital Grants Unapplied Account (14,346)
REVENUE RESERVES
(1,283) General Fund - Schools (1,401)
(11,268) General Fund - Council (11,269)
(45,900) Earmarked Reserves excluding DSG (35,402)
5,213 Earmarked Reserve DSG 9,687
(35,156) HRA (37,508)
(132,519) TOTAL USABLE RESERVES (128,725)
(a) Capital Receipts Reserve
Income from the disposal of non-current assets is credited to the Capital Receipts Reserve. The amount credited in respect of housing capital receipts is reduced by the amount the Council is required to pay over to central government under the national pooling arrangements. The Capital Receipts Reserve can only be applied to finance new capital expenditure, repay debt or meet liabilities under credit arrangements.
(b) Major Repairs Reserve
The Council is required by regulation to establish a Major Repairs Reserve. The main credit to the account comprises the total depreciation charge for all HRA assets. This can only be used to finance new capital expenditure, repay debt or meet liabilities under credit arrangements. The arrangements ensure that subsequent funding of capital expenditure does not affect the Housing Revenue Account.
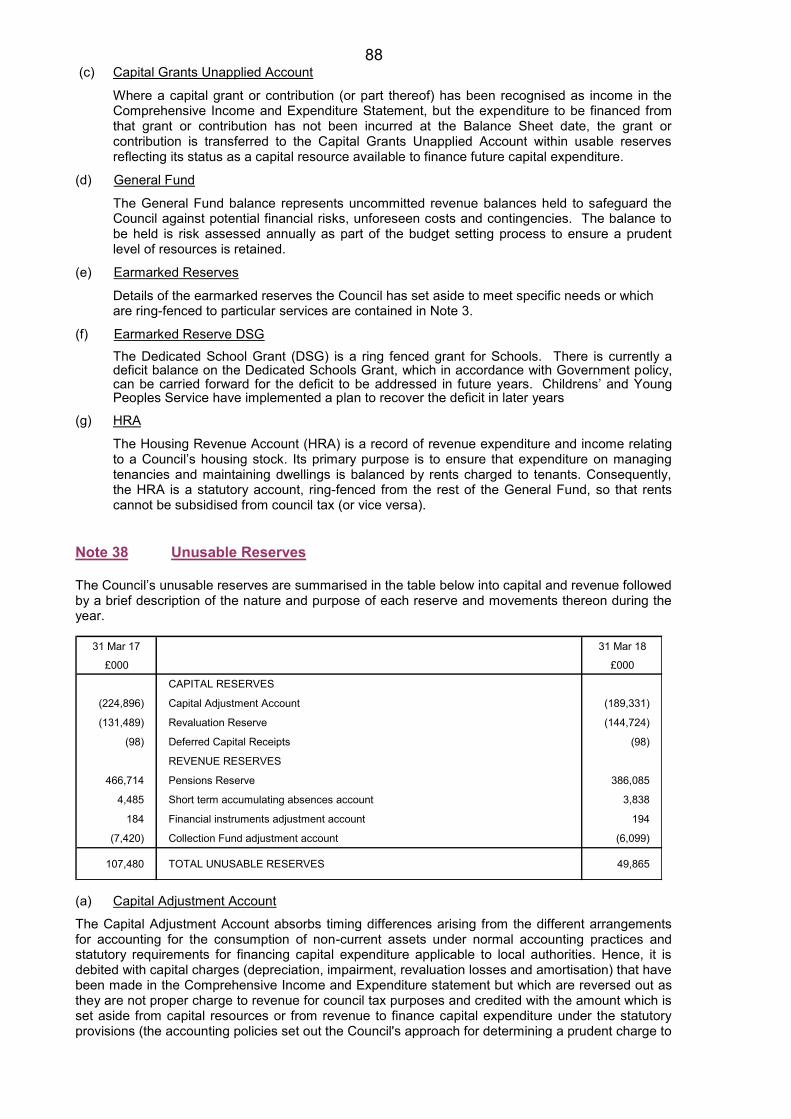
88 (c) Capital Grants Unapplied Account
Where a capital grant or contribution (or part thereof) has been recognised as income in the Comprehensive Income and Expenditure Statement, but the expenditure to be financed from that grant or contribution has not been incurred at the Balance Sheet date, the grant or contribution is transferred to the Capital Grants Unapplied Account within usable reserves reflecting its status as a capital resource available to finance future capital expenditure.
(d) General Fund
The General Fund balance represents uncommitted revenue balances held to safeguard the Council against potential financial risks, unforeseen costs and contingencies. The balance to be held is risk assessed annually as part of the budget setting process to ensure a prudent level of resources is retained.
(e) Earmarked Reserves
Details of the earmarked reserves the Council has set aside to meet specific needs or which are ring-fenced to particular services are contained in Note 3.
(f) Earmarked Reserve DSG The Dedicated School Grant (DSG) is a ring fenced grant for Schools. There is currently a deficit balance on the Dedicated Schools Grant, which in accordance with Government policy, can be carried forward for the deficit to be addressed in future years. Childrens’ and Young Peoples Service have implemented a plan to recover the deficit in later years
(g) HRA
The Housing Revenue Account (HRA) is a record of revenue expenditure and income relating to a Council’s housing stock. Its primary purpose is to ensure that expenditure on managing tenancies and maintaining dwellings is balanced by rents charged to tenants. Consequently, the HRA is a statutory account, ring-fenced from the rest of the General Fund, so that rents cannot be subsidised from council tax (or vice versa).
Note 38 Unusable Reserves The Council’s unusable reserves are summarised in the table below into capital and revenue followed by a brief description of the nature and purpose of each reserve and movements thereon during the year.
31 Mar 17 31 Mar 18
£000 £000
CAPITAL RESERVES
(224,896) Capital Adjustment Account (189,331)
(131,489) Revaluation Reserve (144,724)
(98) Deferred Capital Receipts (98)
REVENUE RESERVES
466,714 Pensions Reserve 386,085
4,485 Short term accumulating absences account 3,838
184 Financial instruments adjustment account 194
(7,420) Collection Fund adjustment account (6,099)
107,480 TOTAL UNUSABLE RESERVES 49,865
(a) Capital Adjustment Account
The Capital Adjustment Account absorbs timing differences arising from the different arrangements for accounting for the consumption of non-current assets under normal accounting practices and statutory requirements for financing capital expenditure applicable to local authorities. Hence, it is debited with capital charges (depreciation, impairment, revaluation losses and amortisation) that have been made in the Comprehensive Income and Expenditure statement but which are reversed out as they are not proper charge to revenue for council tax purposes and credited with the amount which is set aside from capital resources or from revenue to finance capital expenditure under the statutory provisions (the accounting policies set out the Council's approach for determining a prudent charge to
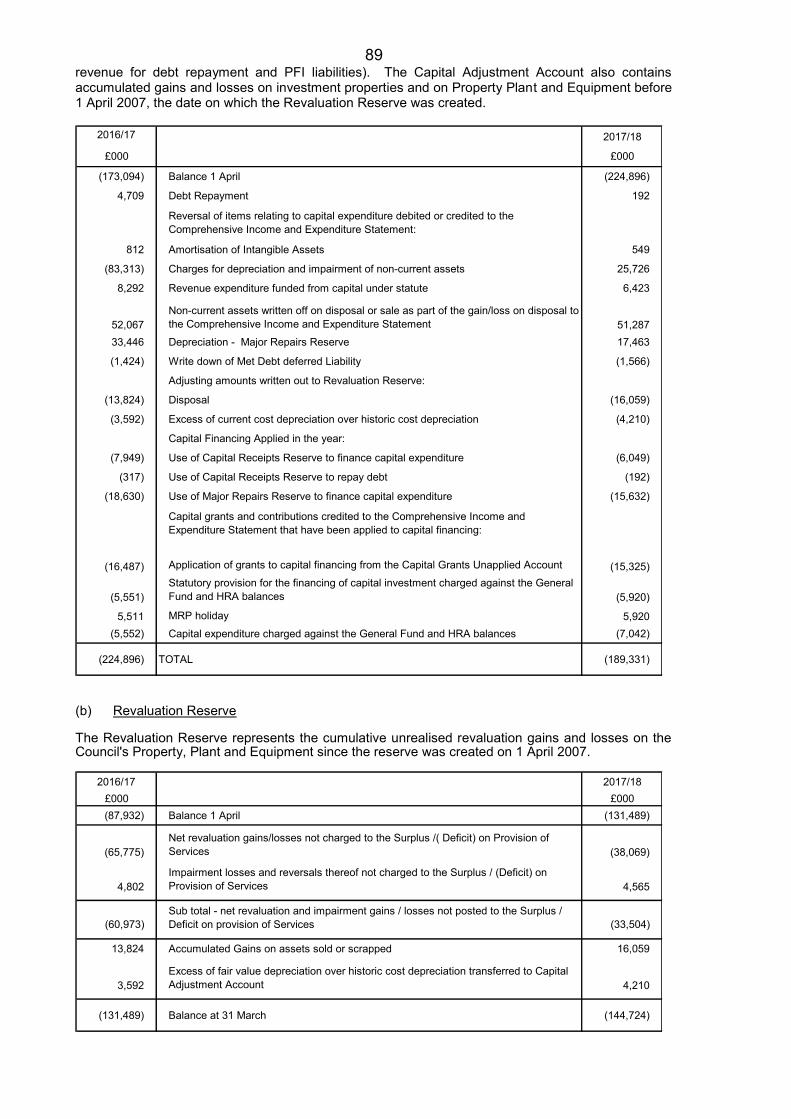
89 revenue for debt repayment and PFI liabilities). The Capital Adjustment Account also contains accumulated gains and losses on investment properties and on Property Plant and Equipment before 1 April 2007, the date on which the Revaluation Reserve was created.
2016/17 2017/18
£000 £000
(173,094) Balance 1 April (224,896)
4,709 Debt Repayment 192
Reversal of items relating to capital expenditure debited or credited to the Comprehensive Income and Expenditure Statement:
812 Amortisation of Intangible Assets 549
(83,313) Charges for depreciation and impairment of non-current assets 25,726
8,292 Revenue expenditure funded from capital under statute 6,423
52,067Non-current assets written off on disposal or sale as part of the gain/loss on disposal to the Comprehensive Income and Expenditure Statement 51,287
33,446 Depreciation - Major Repairs Reserve 17,463
(1,424) Write down of Met Debt deferred Liability (1,566)
Adjusting amounts written out to Revaluation Reserve:
(13,824) Disposal (16,059)
(3,592) Excess of current cost depreciation over historic cost depreciation (4,210)
Capital Financing Applied in the year:
(7,949) Use of Capital Receipts Reserve to finance capital expenditure (6,049)
(317) Use of Capital Receipts Reserve to repay debt (192)
(18,630) Use of Major Repairs Reserve to finance capital expenditure (15,632)
Capital grants and contributions credited to the Comprehensive Income and Expenditure Statement that have been applied to capital financing:
(16,487) Application of grants to capital financing from the Capital Grants Unapplied Account (15,325)
(5,551)Statutory provision for the financing of capital investment charged against the General Fund and HRA balances (5,920)
5,511 MRP holiday 5,920(5,552) Capital expenditure charged against the General Fund and HRA balances (7,042)
(224,896) TOTAL (189,331)
(b) Revaluation Reserve The Revaluation Reserve represents the cumulative unrealised revaluation gains and losses on the Council's Property, Plant and Equipment since the reserve was created on 1 April 2007.
2016/17 2017/18£000 £000(87,932) Balance 1 April (131,489)
(65,775)Net revaluation gains/losses not charged to the Surplus /( Deficit) on Provision of Services (38,069)
4,802Impairment losses and reversals thereof not charged to the Surplus / (Deficit) on Provision of Services 4,565
(60,973)Sub total - net revaluation and impairment gains / losses not posted to the Surplus / Deficit on provision of Services (33,504)
13,824 Accumulated Gains on assets sold or scrapped 16,059
3,592Excess of fair value depreciation over historic cost depreciation transferred to Capital Adjustment Account 4,210
(131,489) Balance at 31 March (144,724)
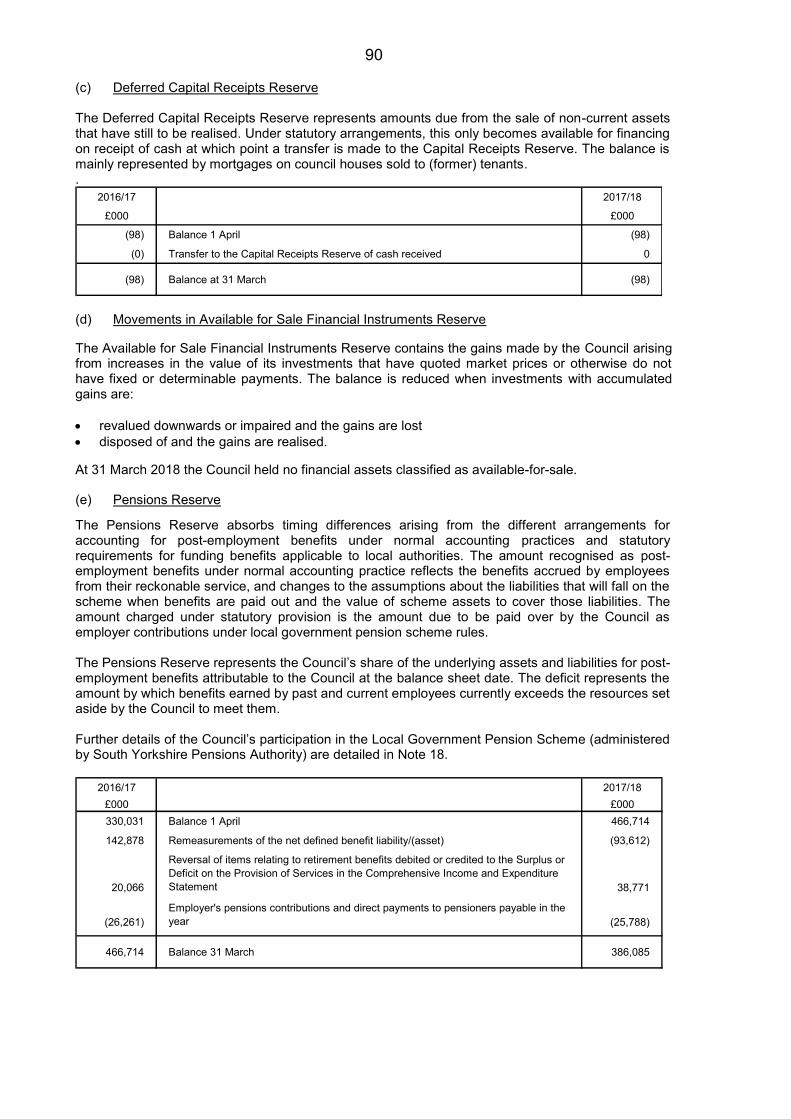
90 (c) Deferred Capital Receipts Reserve The Deferred Capital Receipts Reserve represents amounts due from the sale of non-current assets that have still to be realised. Under statutory arrangements, this only becomes available for financing on receipt of cash at which point a transfer is made to the Capital Receipts Reserve. The balance is mainly represented by mortgages on council houses sold to (former) tenants. .
2016/17 2017/18
£000 £000
(98) Balance 1 April (98)
(0) Transfer to the Capital Receipts Reserve of cash received 0
(98) Balance at 31 March (98)
(d) Movements in Available for Sale Financial Instruments Reserve The Available for Sale Financial Instruments Reserve contains the gains made by the Council arising from increases in the value of its investments that have quoted market prices or otherwise do not have fixed or determinable payments. The balance is reduced when investments with accumulated gains are: revalued downwards or impaired and the gains are lost disposed of and the gains are realised. At 31 March 2018 the Council held no financial assets classified as available-for-sale. (e) Pensions Reserve The Pensions Reserve absorbs timing differences arising from the different arrangements for accounting for post-employment benefits under normal accounting practices and statutory requirements for funding benefits applicable to local authorities. The amount recognised as post-employment benefits under normal accounting practice reflects the benefits accrued by employees from their reckonable service, and changes to the assumptions about the liabilities that will fall on the scheme when benefits are paid out and the value of scheme assets to cover those liabilities. The amount charged under statutory provision is the amount due to be paid over by the Council as employer contributions under local government pension scheme rules.
The Pensions Reserve represents the Council’s share of the underlying assets and liabilities for post-employment benefits attributable to the Council at the balance sheet date. The deficit represents the amount by which benefits earned by past and current employees currently exceeds the resources set aside by the Council to meet them.
Further details of the Council’s participation in the Local Government Pension Scheme (administered by South Yorkshire Pensions Authority) are detailed in Note 18.
2016/17 2017/18£000 £000330,031 Balance 1 April 466,714
142,878 Remeasurements of the net defined benefit liability/(asset) (93,612)
20,066
Reversal of items relating to retirement benefits debited or credited to the Surplus or Deficit on the Provision of Services in the Comprehensive Income and Expenditure Statement 38,771
(26,261)Employer's pensions contributions and direct payments to pensioners payable in the year (25,788)
466,714 Balance 31 March 386,085
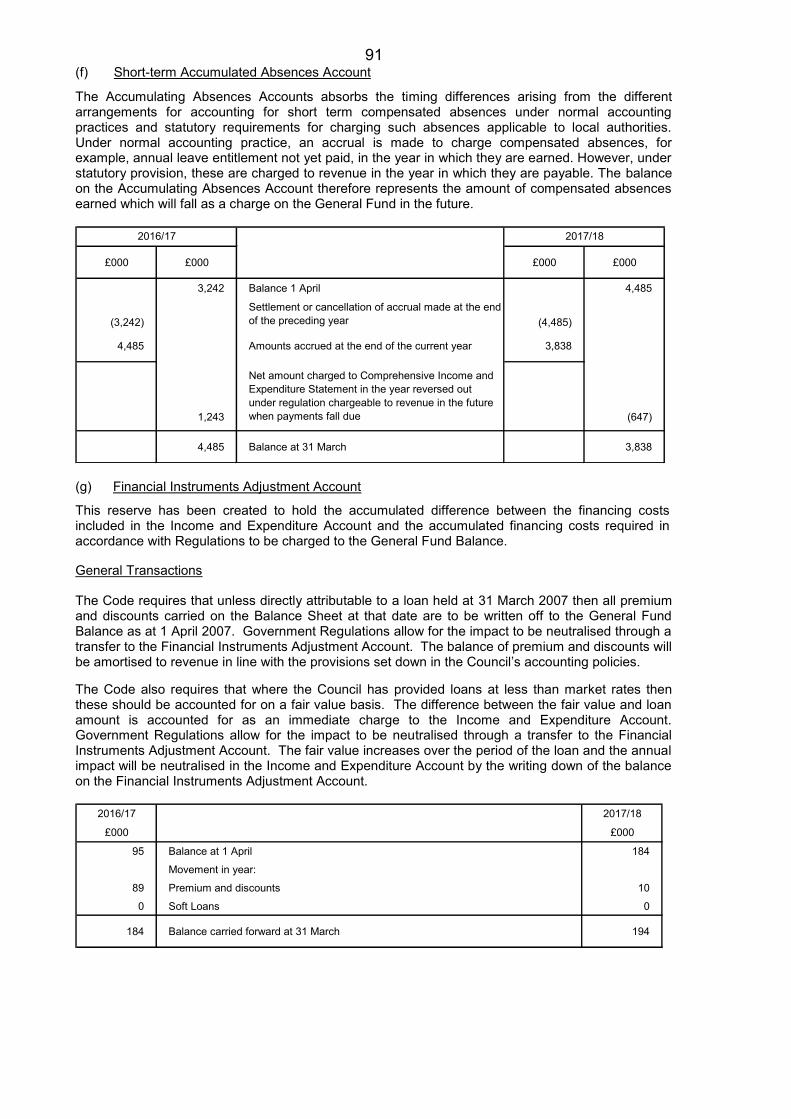
91 (f) Short-term Accumulated Absences Account
The Accumulating Absences Accounts absorbs the timing differences arising from the different arrangements for accounting for short term compensated absences under normal accounting practices and statutory requirements for charging such absences applicable to local authorities. Under normal accounting practice, an accrual is made to charge compensated absences, for example, annual leave entitlement not yet paid, in the year in which they are earned. However, under statutory provision, these are charged to revenue in the year in which they are payable. The balance on the Accumulating Absences Account therefore represents the amount of compensated absences earned which will fall as a charge on the General Fund in the future.
£000 £000 £000 £000
3,242 Balance 1 April 4,485
(3,242)Settlement or cancellation of accrual made at the end of the preceding year (4,485)
4,485 Amounts accrued at the end of the current year 3,838
1,243
Net amount charged to Comprehensive Income and Expenditure Statement in the year reversed out under regulation chargeable to revenue in the future when payments fall due (647)
4,485 Balance at 31 March 3,838
2017/182016/17
(g) Financial Instruments Adjustment Account This reserve has been created to hold the accumulated difference between the financing costs included in the Income and Expenditure Account and the accumulated financing costs required in accordance with Regulations to be charged to the General Fund Balance. General Transactions The Code requires that unless directly attributable to a loan held at 31 March 2007 then all premium and discounts carried on the Balance Sheet at that date are to be written off to the General Fund Balance as at 1 April 2007. Government Regulations allow for the impact to be neutralised through a transfer to the Financial Instruments Adjustment Account. The balance of premium and discounts will be amortised to revenue in line with the provisions set down in the Council’s accounting policies. The Code also requires that where the Council has provided loans at less than market rates then these should be accounted for on a fair value basis. The difference between the fair value and loan amount is accounted for as an immediate charge to the Income and Expenditure Account. Government Regulations allow for the impact to be neutralised through a transfer to the Financial Instruments Adjustment Account. The fair value increases over the period of the loan and the annual impact will be neutralised in the Income and Expenditure Account by the writing down of the balance on the Financial Instruments Adjustment Account.
2016/17 2017/18
£000 £000
95 Balance at 1 April 184
Movement in year:
89 Premium and discounts 10
0 Soft Loans 0
184 Balance carried forward at 31 March 194
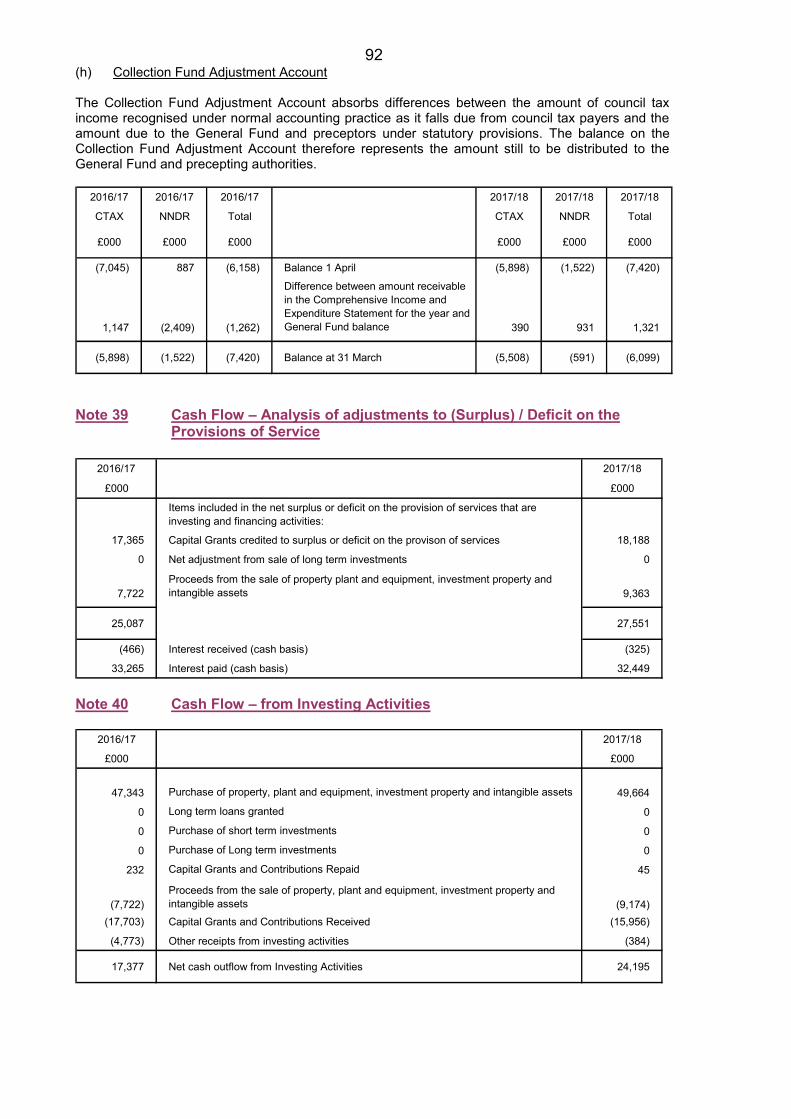
92 (h) Collection Fund Adjustment Account The Collection Fund Adjustment Account absorbs differences between the amount of council tax income recognised under normal accounting practice as it falls due from council tax payers and the amount due to the General Fund and preceptors under statutory provisions. The balance on the Collection Fund Adjustment Account therefore represents the amount still to be distributed to the General Fund and precepting authorities.
2016/17 2016/17 2016/17 2017/18 2017/18 2017/18
CTAX NNDR Total CTAX NNDR Total
£000 £000 £000 £000 £000 £000
(7,045) 887 (6,158) Balance 1 April (5,898) (1,522) (7,420)
1,147 (2,409) (1,262)
Difference between amount receivable in the Comprehensive Income and Expenditure Statement for the year and General Fund balance 390 931 1,321
(5,898) (1,522) (7,420) Balance at 31 March (5,508) (591) (6,099)
Note 39 Cash Flow – Analysis of adjustments to (Surplus) / Deficit on the
Provisions of Service
2016/17 2017/18
£000 £000
Items included in the net surplus or deficit on the provision of services that are investing and financing activities:
17,365 Capital Grants credited to surplus or deficit on the provison of services 18,188
0 Net adjustment from sale of long term investments 0
7,722Proceeds from the sale of property plant and equipment, investment property and intangible assets 9,363
25,087 27,551
(466) Interest received (cash basis) (325)
33,265 Interest paid (cash basis) 32,449 Note 40 Cash Flow – from Investing Activities
2016/17 2017/18
£000 £000
47,343 Purchase of property, plant and equipment, investment property and intangible assets 49,664
0 Long term loans granted 0
0 Purchase of short term investments 0
0 Purchase of Long term investments 0
232 Capital Grants and Contributions Repaid 45
(7,722)Proceeds from the sale of property, plant and equipment, investment property and intangible assets (9,174)
(17,703) Capital Grants and Contributions Received (15,956)
(4,773) Other receipts from investing activities (384)
17,377 Net cash outflow from Investing Activities 24,195
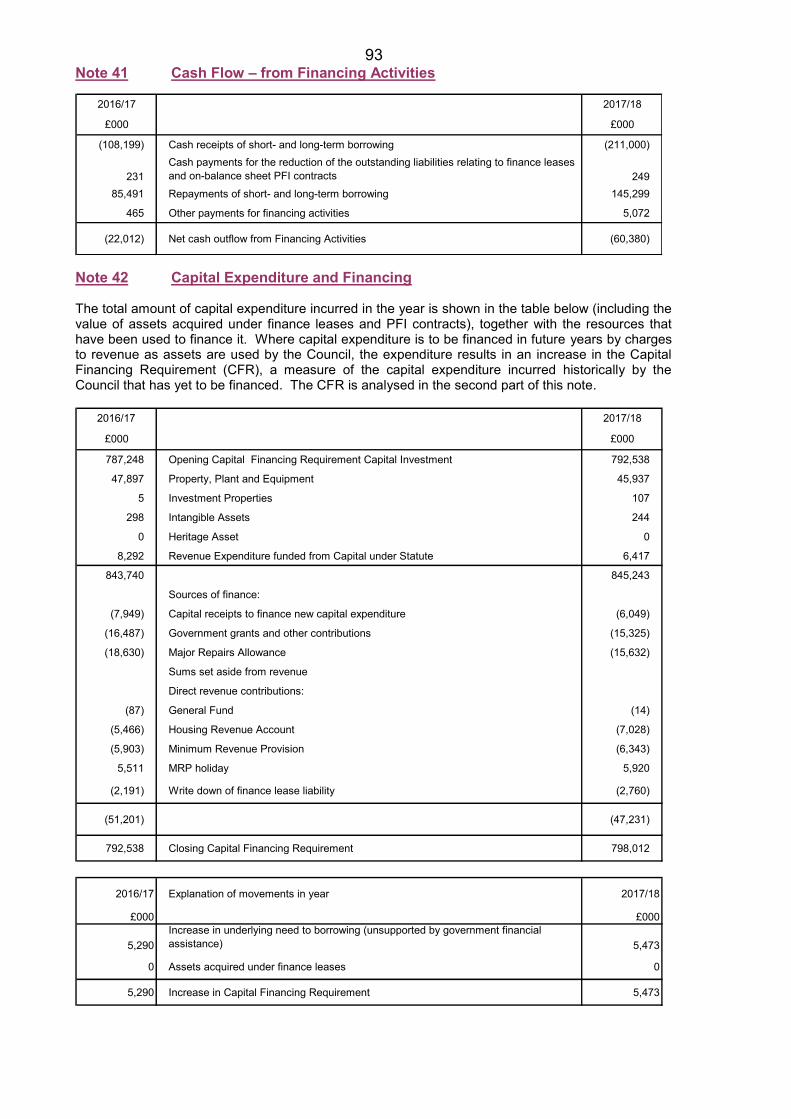
93 Note 41 Cash Flow – from Financing Activities
2016/17 2017/18
£000 £000
(108,199) Cash receipts of short- and long-term borrowing (211,000)
231Cash payments for the reduction of the outstanding liabilities relating to finance leases and on-balance sheet PFI contracts 249
85,491 Repayments of short- and long-term borrowing 145,299
465 Other payments for financing activities 5,072
(22,012) Net cash outflow from Financing Activities (60,380)
Note 42 Capital Expenditure and Financing The total amount of capital expenditure incurred in the year is shown in the table below (including the value of assets acquired under finance leases and PFI contracts), together with the resources that have been used to finance it. Where capital expenditure is to be financed in future years by charges to revenue as assets are used by the Council, the expenditure results in an increase in the Capital Financing Requirement (CFR), a measure of the capital expenditure incurred historically by the Council that has yet to be financed. The CFR is analysed in the second part of this note.
2016/17 2017/18
£000 £000
787,248 Opening Capital Financing Requirement Capital Investment 792,538
47,897 Property, Plant and Equipment 45,937
5 Investment Properties 107
298 Intangible Assets 244
0 Heritage Asset 0
8,292 Revenue Expenditure funded from Capital under Statute 6,417
843,740 845,243
Sources of finance:
(7,949) Capital receipts to finance new capital expenditure (6,049)
(16,487) Government grants and other contributions (15,325)
(18,630) Major Repairs Allowance (15,632)
Sums set aside from revenue
Direct revenue contributions:
(87) General Fund (14)
(5,466) Housing Revenue Account (7,028)
(5,903) Minimum Revenue Provision (6,343)
5,511 MRP holiday 5,920
(2,191) Write down of finance lease liability (2,760)
(51,201) (47,231)
792,538 Closing Capital Financing Requirement 798,012
2016/17 Explanation of movements in year 2017/18
£000 £000
5,290Increase in underlying need to borrowing (unsupported by government financial assistance) 5,473
0 Assets acquired under finance leases 0
5,290 Increase in Capital Financing Requirement 5,473
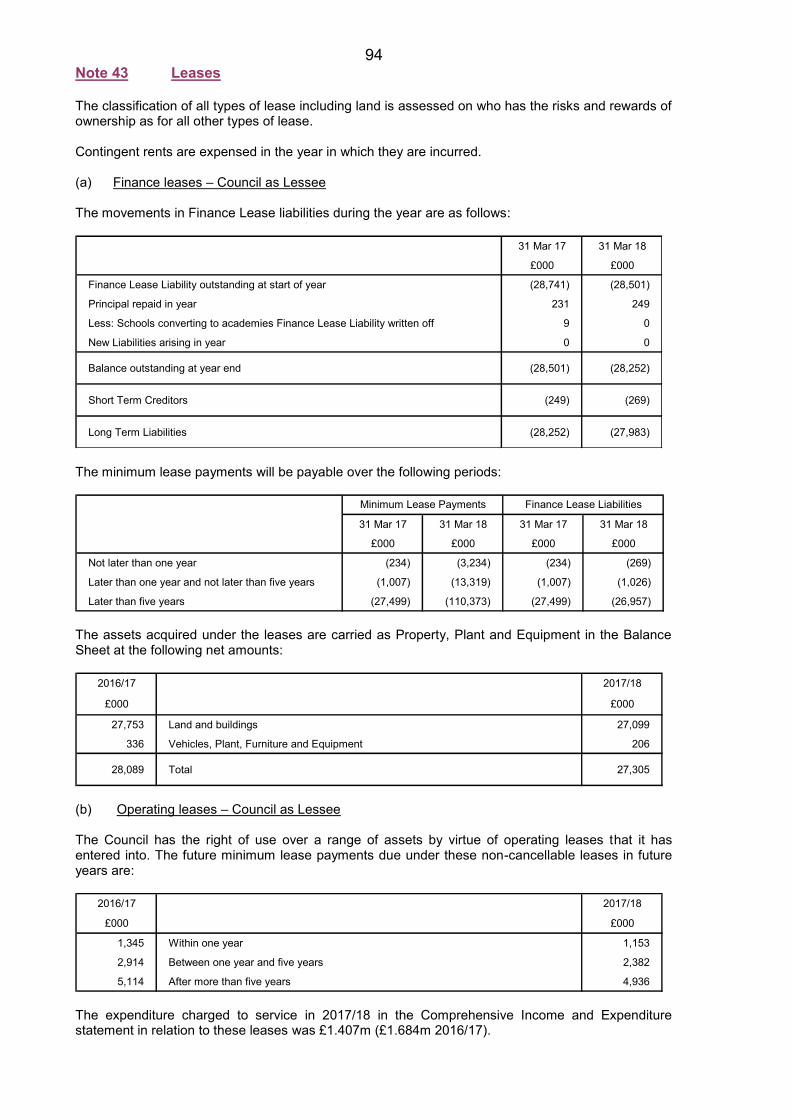
94 Note 43 Leases The classification of all types of lease including land is assessed on who has the risks and rewards of ownership as for all other types of lease. Contingent rents are expensed in the year in which they are incurred. (a) Finance leases – Council as Lessee The movements in Finance Lease liabilities during the year are as follows:
31 Mar 17 31 Mar 18
£000 £000
Finance Lease Liability outstanding at start of year (28,741) (28,501)
Principal repaid in year 231 249
Less: Schools converting to academies Finance Lease Liability written off 9 0
New Liabilities arising in year 0 0
Balance outstanding at year end (28,501) (28,252)
Short Term Creditors (249) (269)
Long Term Liabilities (28,252) (27,983)
The minimum lease payments will be payable over the following periods:
31 Mar 17 31 Mar 18 31 Mar 17 31 Mar 18
£000 £000 £000 £000
Not later than one year (234) (3,234) (234) (269)
Later than one year and not later than five years (1,007) (13,319) (1,007) (1,026)
Later than five years (27,499) (110,373) (27,499) (26,957)
Minimum Lease Payments Finance Lease Liabilities
The assets acquired under the leases are carried as Property, Plant and Equipment in the Balance Sheet at the following net amounts:
2016/17 2017/18
£000 £000
27,753 Land and buildings 27,099
336 Vehicles, Plant, Furniture and Equipment 206
28,089 Total 27,305
(b) Operating leases – Council as Lessee The Council has the right of use over a range of assets by virtue of operating leases that it has entered into. The future minimum lease payments due under these non-cancellable leases in future years are:
2016/17 2017/18
£000 £000
1,345 Within one year 1,153
2,914 Between one year and five years 2,382
5,114 After more than five years 4,936
The expenditure charged to service in 2017/18 in the Comprehensive Income and Expenditure statement in relation to these leases was £1.407m (£1.684m 2016/17).
95 (c) Finance leases – Council as Lessor The Council has leased out property to Thurcroft Junior School, land on which the Council’s former Civic buildings were situated and land on which the former Doncaster Gate building was situated. The former is being leased out on a peppercorn rent. The minimum leased payments in respect of the latter two were received in full as a premia. As a consequence, there is no net investment in finance lease receivable to bring onto the balance sheet. (d) Operating leases – Council as Lessor Most of the property and equipment leased out by the Council meets the definition of investment property. The rental income earned from leasing out these investment properties is disclosed in Note 20. Note 44 Private Finance Initiative and Similar Contracts As at 31 March 2018, the Council has in place three long-term contracts under Private Finance Initiative (PFI) arrangements, one of which, the Waste PFI, is a joint contract with Barnsley and Doncaster Councils. In addition, it has in place one partnership agreement. As a result of a change to the way in which PFI Schemes and Similar Contracts were accounted for in 2009/10 on transition to IFRS, assets within the PFI Schemes or Similar Contracts were brought on Balance Sheet. The movement in the carrying value of these assets is disclosed in the Property Plant and Equipment note (Note 19a). The note below provides a brief description of each scheme and outstanding obligations. (a) Private Finance Initiatives - Schools PFI The contract for the provision of 8 primary and 6 secondary schools commenced on 1 April 2004 with an end date of 31 March 2034, and a capital value of £96m. All the schools were completed in line with the original programme. At the expiry of the contract the schools transfer back to the Council for nil consideration, with the exception of 8 PFI schools, 3 primary and 5 secondary schools which have converted to academy trusts and therefore transfer to the individual trusts under 125 lease arrangements with the Council. The agreed government funding is being received and the Authority has established a fund to manage income and expenditure over the rest of the 30 years of these arrangements. Payments during the year totalled £15.638m and are subject to availability and performance-related deductions and contractually agreed inflation adjustments. In the same period the Council received £6.223m of PFI grant in support of this project. (b) Private Finance Initiatives – Sports and Leisure PFI The Sport and Leisure Facilities Regeneration Programme and Maltby Joint Service Centre PFI involves the construction of 3 new combined swimming pools and dry leisure centres, one stand-alone swimming pool and a joint service centre. The contract with DC Projects (Rotherham) Ltd became operational in August 2008 and has a capital value of £38m. The contract expires on 31 October 2041, when all the assets transfer back to the Council for nil consideration. £24.954m of PFI Credits have been awarded to support the scheme. All 5 facilities are operational. Payments during the year totalled £4.729m. In the same period the Council received £1.811m of PFI grant in support of this project. (c) Bereavement Services Partnership - Dignity The Council signed a partnership agreement with Dignity Funerals Limited in July 2008, who now manage the Borough’s bereavement services on the Council’s behalf. The contract commenced in August 2008 and operates for a period of 35 years at which point all the Assets revert back to the Council for nil consideration. This is a partnership that will improve the provision of bereavement services to the Rotherham public, with significant investment having taken place on the crematorium facility and the wider East Herringthorpe site. (d) Waste Management PFI The Council’s joint Waste PFI Contract, along with Barnsley and Doncaster Councils, with 3SE (Shanks, Scottish and Southern Energy) became operational in July 2015. The contract is providing
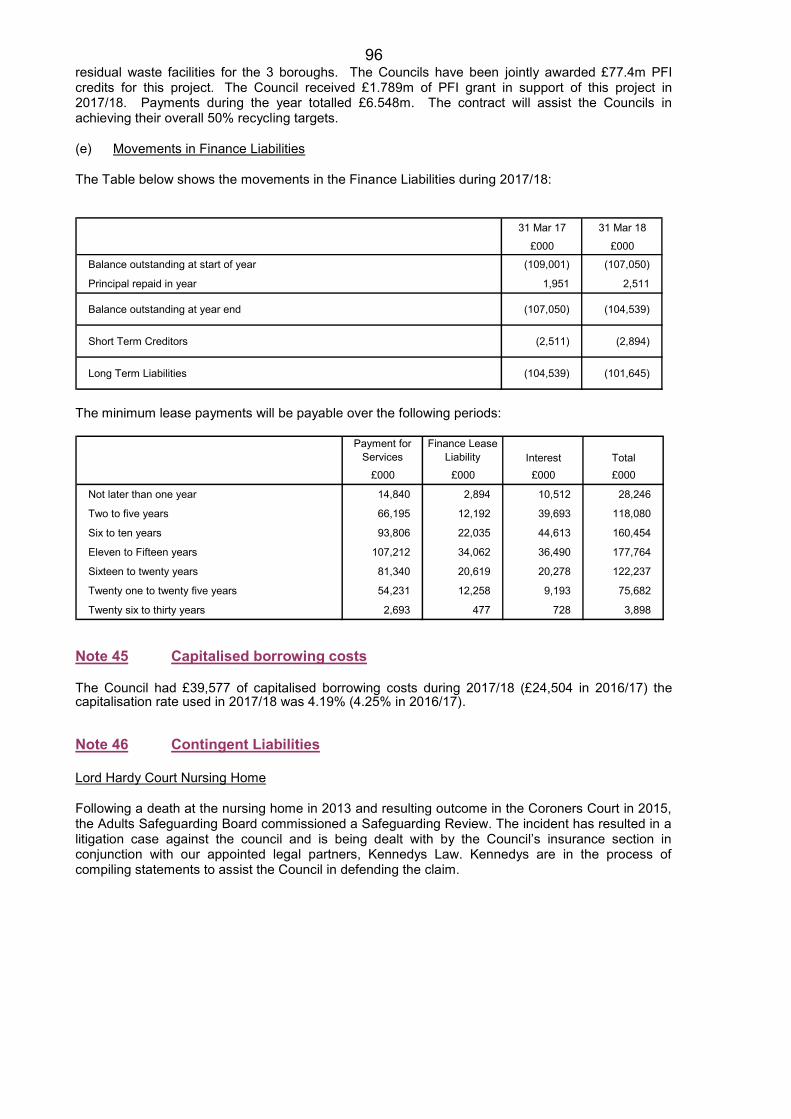
96 residual waste facilities for the 3 boroughs. The Councils have been jointly awarded £77.4m PFI credits for this project. The Council received £1.789m of PFI grant in support of this project in 2017/18. Payments during the year totalled £6.548m. The contract will assist the Councils in achieving their overall 50% recycling targets. (e) Movements in Finance Liabilities The Table below shows the movements in the Finance Liabilities during 2017/18:
31 Mar 17 31 Mar 18
£000 £000
Balance outstanding at start of year (109,001) (107,050)
Principal repaid in year 1,951 2,511
Balance outstanding at year end (107,050) (104,539)
Short Term Creditors (2,511) (2,894)
Long Term Liabilities (104,539) (101,645)
The minimum lease payments will be payable over the following periods:
Payment for Services
Finance Lease Liability Interest Total
£000 £000 £000 £000
Not later than one year 14,840 2,894 10,512 28,246
Two to five years 66,195 12,192 39,693 118,080
Six to ten years 93,806 22,035 44,613 160,454
Eleven to Fifteen years 107,212 34,062 36,490 177,764
Sixteen to twenty years 81,340 20,619 20,278 122,237
Twenty one to twenty five years 54,231 12,258 9,193 75,682
Twenty six to thirty years 2,693 477 728 3,898 Note 45 Capitalised borrowing costs The Council had £39,577 of capitalised borrowing costs during 2017/18 (£24,504 in 2016/17) the capitalisation rate used in 2017/18 was 4.19% (4.25% in 2016/17). Note 46 Contingent Liabilities Lord Hardy Court Nursing Home Following a death at the nursing home in 2013 and resulting outcome in the Coroners Court in 2015, the Adults Safeguarding Board commissioned a Safeguarding Review. The incident has resulted in a litigation case against the council and is being dealt with by the Council’s insurance section in conjunction with our appointed legal partners, Kennedys Law. Kennedys are in the process of compiling statements to assist the Council in defending the claim.
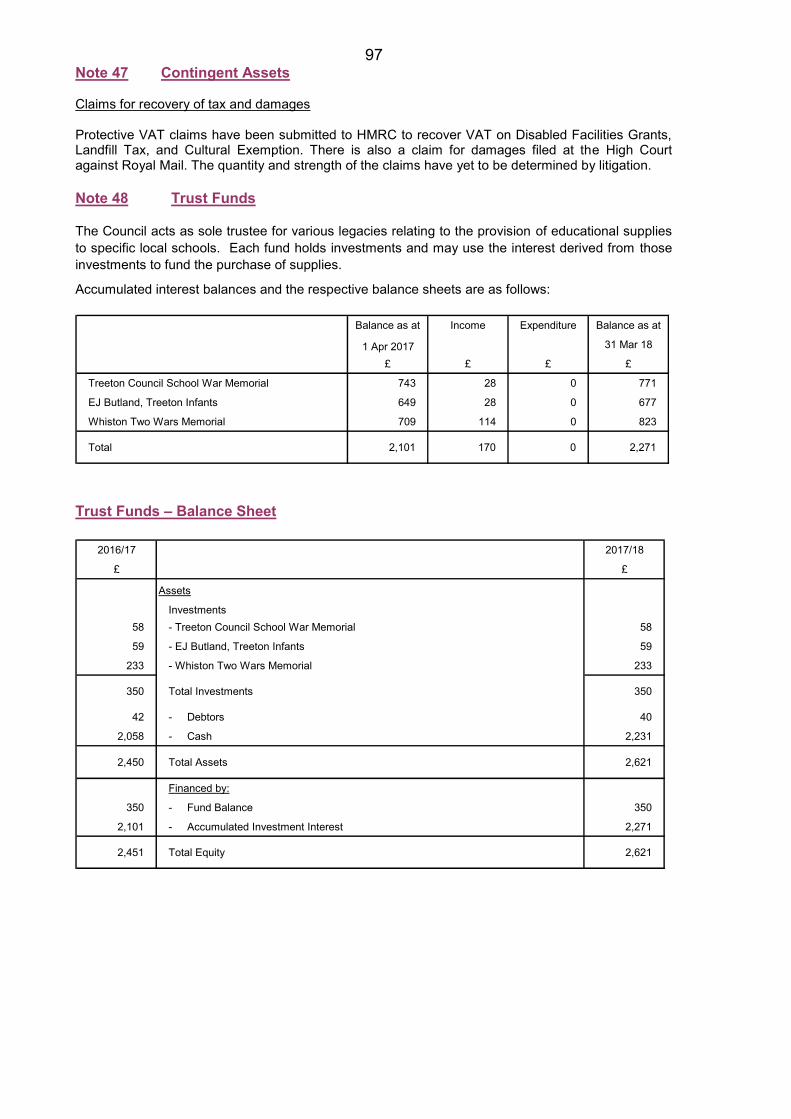
97 Note 47 Contingent Assets Claims for recovery of tax and damages Protective VAT claims have been submitted to HMRC to recover VAT on Disabled Facilities Grants, Landfill Tax, and Cultural Exemption. There is also a claim for damages filed at the High Court against Royal Mail. The quantity and strength of the claims have yet to be determined by litigation. Note 48 Trust Funds The Council acts as sole trustee for various legacies relating to the provision of educational supplies to specific local schools. Each fund holds investments and may use the interest derived from those investments to fund the purchase of supplies. Accumulated interest balances and the respective balance sheets are as follows:
Balance as at Income Expenditure Balance as at
1 Apr 2017 31 Mar 18
£ £ £ £
Treeton Council School War Memorial 743 28 0 771
EJ Butland, Treeton Infants 649 28 0 677
Whiston Two Wars Memorial 709 114 0 823
Total 2,101 170 0 2,271
Trust Funds – Balance Sheet
2016/17 2017/18
£ £
Assets
Investments58 - Treeton Council School War Memorial 58
59 - EJ Butland, Treeton Infants 59
233 - Whiston Two Wars Memorial 233
350 Total Investments 350
42 - Debtors 40
2,058 - Cash 2,231
2,450 Total Assets 2,621
Financed by:
350 - Fund Balance 350
2,101 - Accumulated Investment Interest 2,271
2,451 Total Equity 2,621
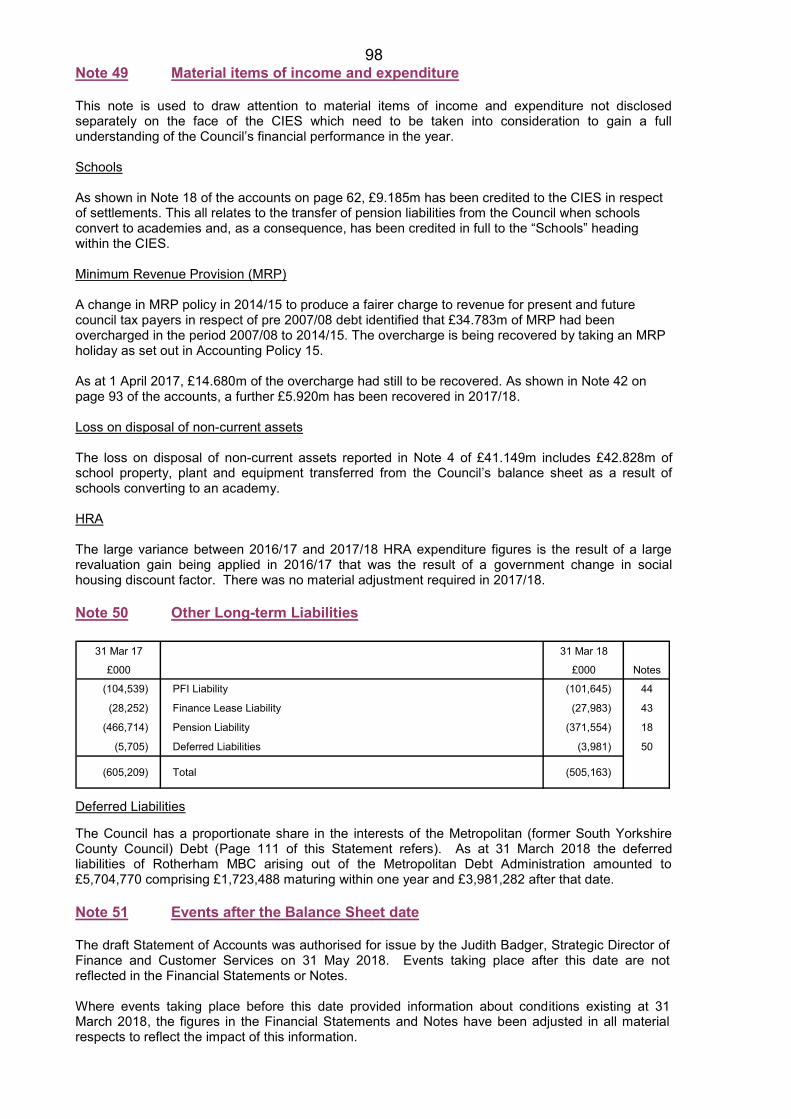
98 Note 49 Material items of income and expenditure This note is used to draw attention to material items of income and expenditure not disclosed separately on the face of the CIES which need to be taken into consideration to gain a full understanding of the Council’s financial performance in the year. Schools As shown in Note 18 of the accounts on page 62, £9.185m has been credited to the CIES in respect of settlements. This all relates to the transfer of pension liabilities from the Council when schools convert to academies and, as a consequence, has been credited in full to the “Schools” heading within the CIES. Minimum Revenue Provision (MRP) A change in MRP policy in 2014/15 to produce a fairer charge to revenue for present and future council tax payers in respect of pre 2007/08 debt identified that £34.783m of MRP had been overcharged in the period 2007/08 to 2014/15. The overcharge is being recovered by taking an MRP holiday as set out in Accounting Policy 15. As at 1 April 2017, £14.680m of the overcharge had still to be recovered. As shown in Note 42 on page 93 of the accounts, a further £5.920m has been recovered in 2017/18. Loss on disposal of non-current assets The loss on disposal of non-current assets reported in Note 4 of £41.149m includes £42.828m of school property, plant and equipment transferred from the Council’s balance sheet as a result of schools converting to an academy. HRA The large variance between 2016/17 and 2017/18 HRA expenditure figures is the result of a large revaluation gain being applied in 2016/17 that was the result of a government change in social housing discount factor. There was no material adjustment required in 2017/18. Note 50 Other Long-term Liabilities
31 Mar 17 31 Mar 18
£000 £000 Notes
(104,539) PFI Liability (101,645) 44
(28,252) Finance Lease Liability (27,983) 43
(466,714) Pension Liability (371,554) 18
(5,705) Deferred Liabilities (3,981) 50
(605,209) Total (505,163)
Deferred Liabilities The Council has a proportionate share in the interests of the Metropolitan (former South Yorkshire County Council) Debt (Page 111 of this Statement refers). As at 31 March 2018 the deferred liabilities of Rotherham MBC arising out of the Metropolitan Debt Administration amounted to £5,704,770 comprising £1,723,488 maturing within one year and £3,981,282 after that date. Note 51 Events after the Balance Sheet date The draft Statement of Accounts was authorised for issue by the Judith Badger, Strategic Director of Finance and Customer Services on 31 May 2018. Events taking place after this date are not reflected in the Financial Statements or Notes. Where events taking place before this date provided information about conditions existing at 31 March 2018, the figures in the Financial Statements and Notes have been adjusted in all material respects to reflect the impact of this information.
99 Other Financial Statements and Notes to the Other Financial Statements
Housing Revenue Account (HRA) The Collection Fund Income and Expenditure Account Metropolitan Debt Administration
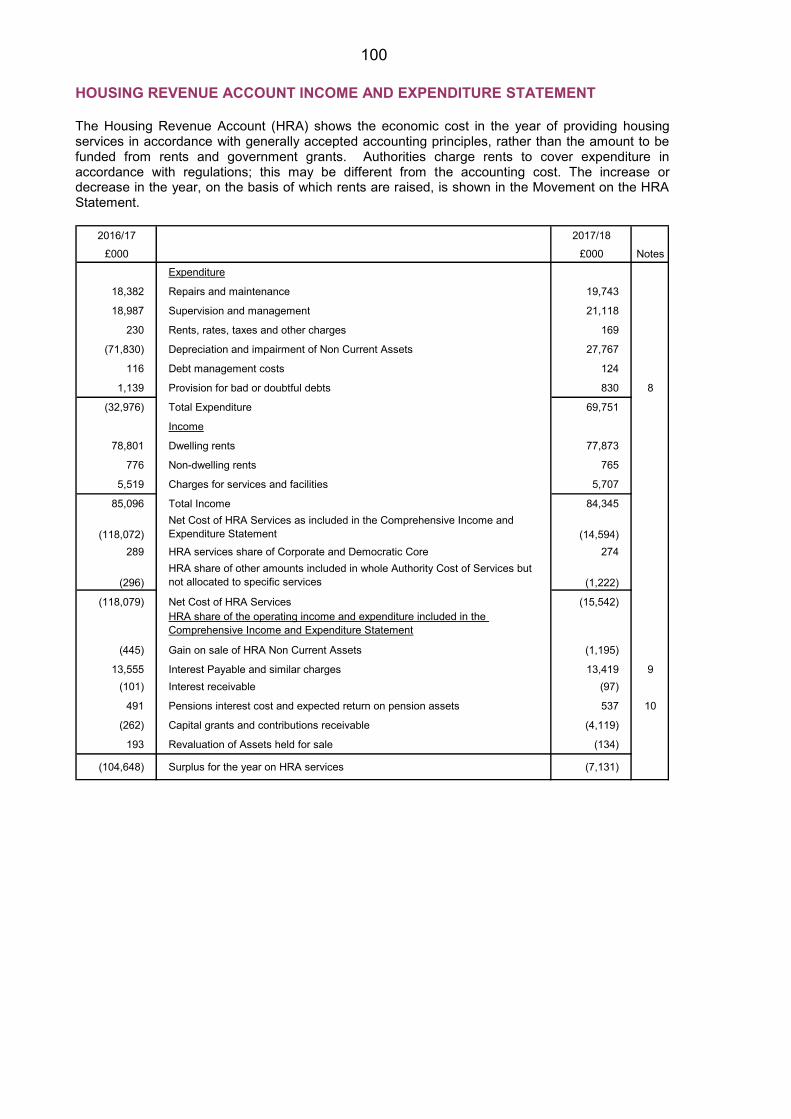
100 HOUSING REVENUE ACCOUNT INCOME AND EXPENDITURE STATEMENT The Housing Revenue Account (HRA) shows the economic cost in the year of providing housing services in accordance with generally accepted accounting principles, rather than the amount to be funded from rents and government grants. Authorities charge rents to cover expenditure in accordance with regulations; this may be different from the accounting cost. The increase or decrease in the year, on the basis of which rents are raised, is shown in the Movement on the HRA Statement.
2016/17 2017/18
£000 £000 Notes
Expenditure
18,382 Repairs and maintenance 19,743
18,987 Supervision and management 21,118
230 Rents, rates, taxes and other charges 169
(71,830) Depreciation and impairment of Non Current Assets 27,767
116 Debt management costs 124
1,139 Provision for bad or doubtful debts 830 8
(32,976) Total Expenditure 69,751
Income
78,801 Dwelling rents 77,873
776 Non-dwelling rents 765
5,519 Charges for services and facilities 5,707
85,096 Total Income 84,345
(118,072)Net Cost of HRA Services as included in the Comprehensive Income and Expenditure Statement (14,594)
289 HRA services share of Corporate and Democratic Core 274
(296)HRA share of other amounts included in whole Authority Cost of Services but not allocated to specific services (1,222)
(118,079) Net Cost of HRA Services (15,542)HRA share of the operating income and expenditure included in the Comprehensive Income and Expenditure Statement
(445) Gain on sale of HRA Non Current Assets (1,195)
13,555 Interest Payable and similar charges 13,419 9(101) Interest receivable (97)
491 Pensions interest cost and expected return on pension assets 537 10
(262) Capital grants and contributions receivable (4,119)
193 Revaluation of Assets held for sale (134)
(104,648) Surplus for the year on HRA services (7,131)
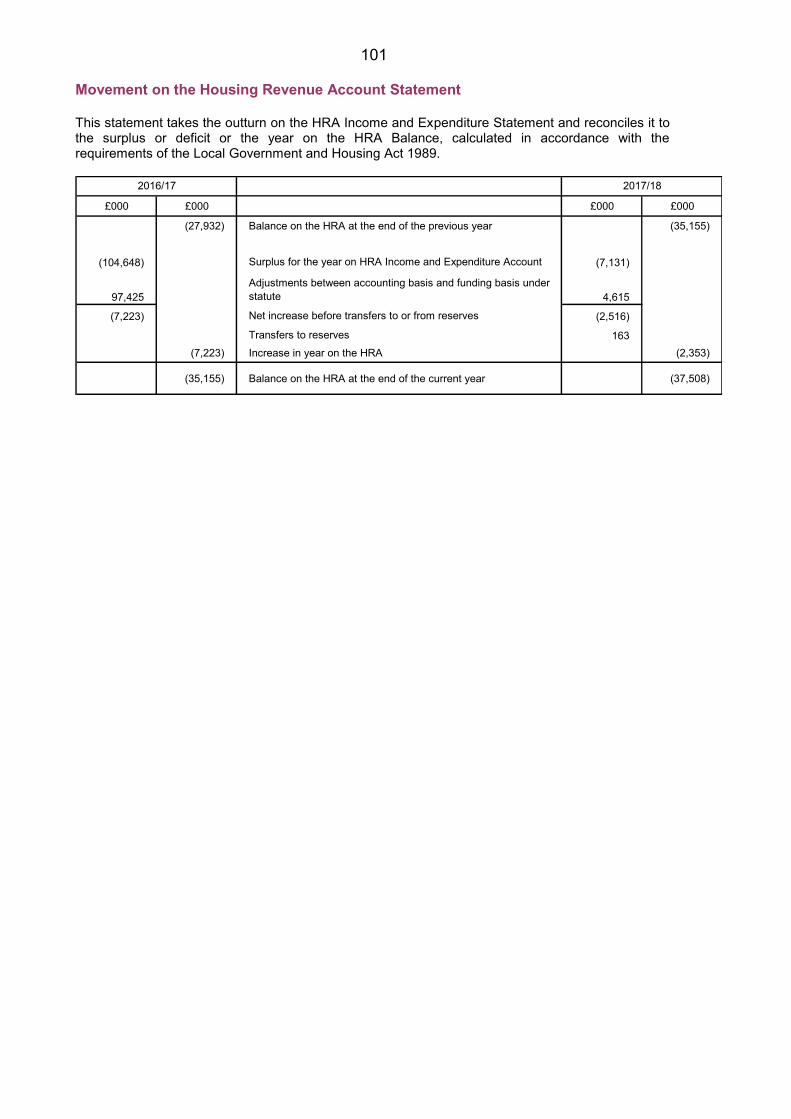
101 Movement on the Housing Revenue Account Statement This statement takes the outturn on the HRA Income and Expenditure Statement and reconciles it to the surplus or deficit or the year on the HRA Balance, calculated in accordance with the requirements of the Local Government and Housing Act 1989.
£000 £000 £000 £000
(27,932) Balance on the HRA at the end of the previous year (35,155)
(104,648) Surplus for the year on HRA Income and Expenditure Account (7,131)
97,425Adjustments between accounting basis and funding basis under statute 4,615
(7,223) Net increase before transfers to or from reserves (2,516)
Transfers to reserves 163(7,223) Increase in year on the HRA (2,353)
(35,155) Balance on the HRA at the end of the current year (37,508)
2016/17 2017/18
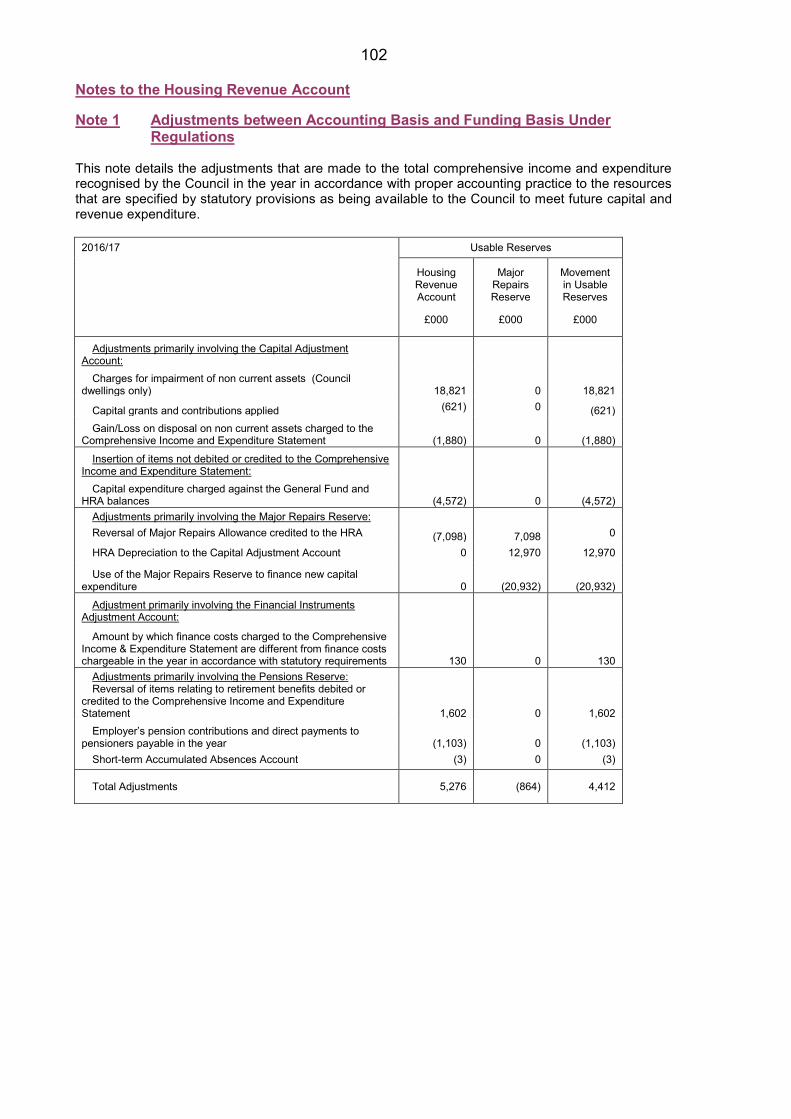
102 Notes to the Housing Revenue Account
Note 1 Adjustments between Accounting Basis and Funding Basis Under
Regulations This note details the adjustments that are made to the total comprehensive income and expenditure recognised by the Council in the year in accordance with proper accounting practice to the resources that are specified by statutory provisions as being available to the Council to meet future capital and revenue expenditure.
2016/17 Usable Reserves
Housing Revenue Account
Major Repairs Reserve
Movement in Usable Reserves
£000 £000 £000
Adjustments primarily involving the Capital Adjustment Account:
Charges for impairment of non current assets (Council dwellings only) 18,821 0 18,821
Capital grants and contributions applied (621) 0 (621) Gain/Loss on disposal on non current assets charged to the
Comprehensive Income and Expenditure Statement (1,880) 0 (1,880)
Insertion of items not debited or credited to the Comprehensive Income and Expenditure Statement:
Capital expenditure charged against the General Fund and HRA balances (4,572) 0 (4,572)
Adjustments primarily involving the Major Repairs Reserve: Reversal of Major Repairs Allowance credited to the HRA (7,098) 7,098 0
HRA Depreciation to the Capital Adjustment Account 0 12,970 12,970
Use of the Major Repairs Reserve to finance new capital expenditure 0 (20,932) (20,932)
Adjustment primarily involving the Financial Instruments Adjustment Account:
Amount by which finance costs charged to the Comprehensive Income & Expenditure Statement are different from finance costs chargeable in the year in accordance with statutory requirements 130 0 130
Adjustments primarily involving the Pensions Reserve: Reversal of items relating to retirement benefits debited or
credited to the Comprehensive Income and Expenditure Statement 1,602 0 1,602
Employer’s pension contributions and direct payments to pensioners payable in the year (1,103) 0 (1,103)
Short-term Accumulated Absences Account (3) 0 (3)
Total Adjustments 5,276 (864) 4,412
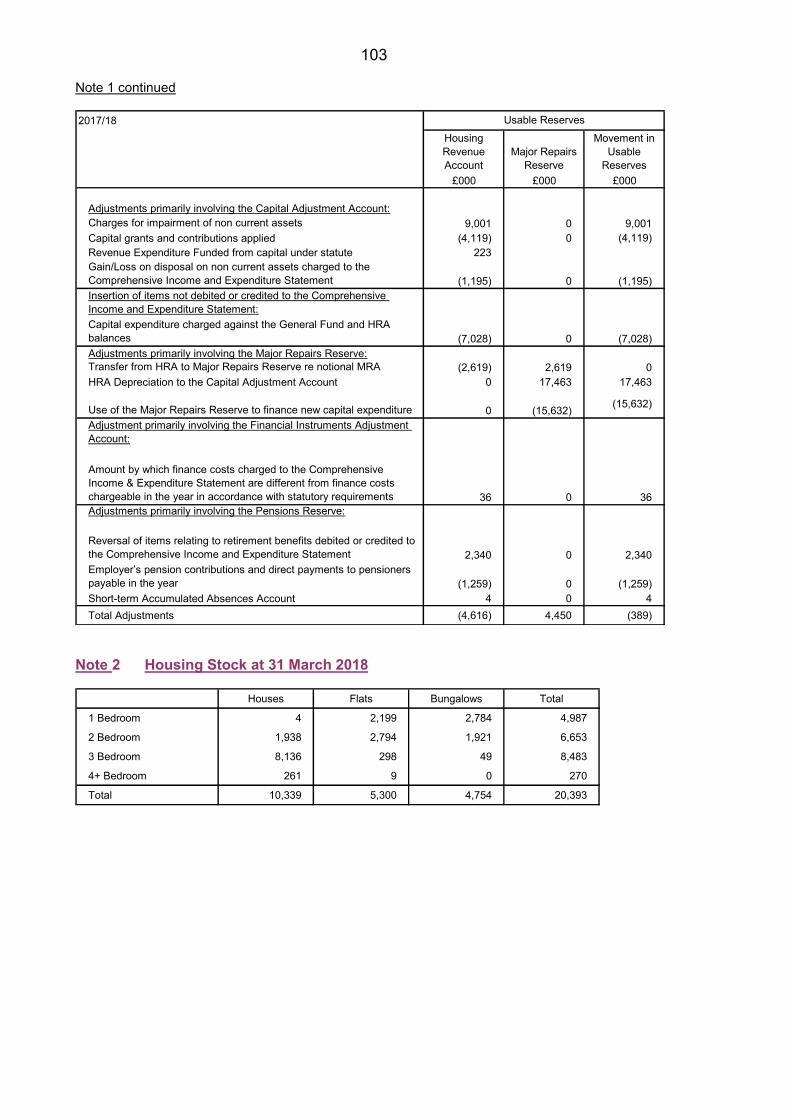
103 Note 1 continued 2017/18
Housing Revenue Account
Major Repairs Reserve
Movement in Usable
Reserves£000 £000 £000
Adjustments primarily involving the Capital Adjustment Account:Charges for impairment of non current assets 9,001 0 9,001Capital grants and contributions applied (4,119) 0 (4,119)Revenue Expenditure Funded from capital under statute 223Gain/Loss on disposal on non current assets charged to the Comprehensive Income and Expenditure Statement (1,195) 0 (1,195)Insertion of items not debited or credited to the Comprehensive Income and Expenditure Statement:Capital expenditure charged against the General Fund and HRA balances (7,028) 0 (7,028)Adjustments primarily involving the Major Repairs Reserve:Transfer from HRA to Major Repairs Reserve re notional MRA (2,619) 2,619 0HRA Depreciation to the Capital Adjustment Account 0 17,463 17,463
Use of the Major Repairs Reserve to finance new capital expenditure 0 (15,632) (15,632)
Adjustment primarily involving the Financial Instruments Adjustment Account:
Amount by which finance costs charged to the Comprehensive Income & Expenditure Statement are different from finance costs chargeable in the year in accordance with statutory requirements 36 0 36Adjustments primarily involving the Pensions Reserve:
Reversal of items relating to retirement benefits debited or credited to the Comprehensive Income and Expenditure Statement 2,340 0 2,340Employer’s pension contributions and direct payments to pensioners payable in the year (1,259) 0 (1,259)Short-term Accumulated Absences Account 4 0 4Total Adjustments (4,616) 4,450 (389)
Usable Reserves
Note 2 Housing Stock at 31 March 2018
Houses Flats Bungalows Total
1 Bedroom 4 2,199 2,784 4,987
2 Bedroom 1,938 2,794 1,921 6,653
3 Bedroom 8,136 298 49 8,483
4+ Bedroom 261 9 0 270
Total 10,339 5,300 4,754 20,393
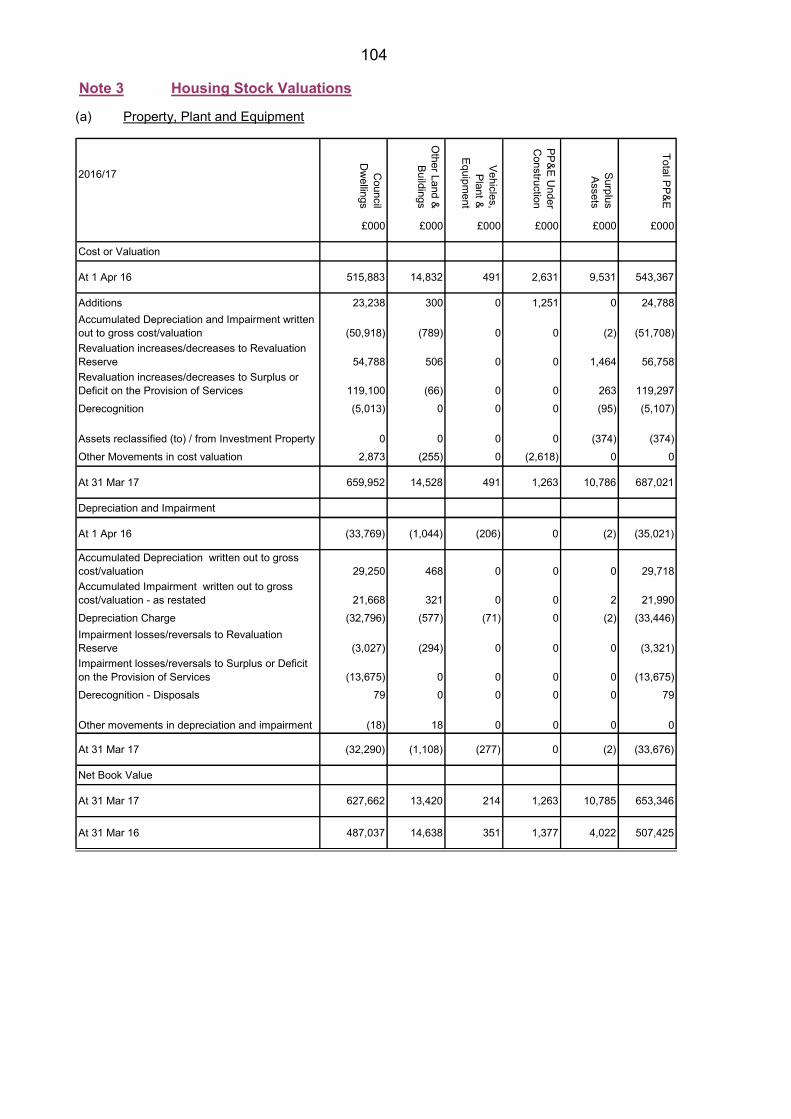
104 Note 3 Housing Stock Valuations (a) Property, Plant and Equipment
2016/17 Council
Dw
ellings
Other Land &
Buildings
Vehicles, Plant &
Equipment
PP&E Under
Construction
Surplus Assets
Total PP&E
£000 £000 £000 £000 £000 £000
Cost or Valuation
At 1 Apr 16 515,883 14,832 491 2,631 9,531 543,367
Additions 23,238 300 0 1,251 0 24,788Accumulated Depreciation and Impairment written out to gross cost/valuation (50,918) (789) 0 0 (2) (51,708)Revaluation increases/decreases to Revaluation Reserve 54,788 506 0 0 1,464 56,758Revaluation increases/decreases to Surplus or Deficit on the Provision of Services 119,100 (66) 0 0 263 119,297Derecognition (5,013) 0 0 0 (95) (5,107)
Assets reclassified (to) / from Investment Property 0 0 0 0 (374) (374)Other Movements in cost valuation 2,873 (255) 0 (2,618) 0 0
At 31 Mar 17 659,952 14,528 491 1,263 10,786 687,021
Depreciation and Impairment
At 1 Apr 16 (33,769) (1,044) (206) 0 (2) (35,021)
Accumulated Depreciation written out to gross cost/valuation 29,250 468 0 0 0 29,718Accumulated Impairment written out to gross cost/valuation - as restated 21,668 321 0 0 2 21,990Depreciation Charge (32,796) (577) (71) 0 (2) (33,446)Impairment losses/reversals to Revaluation Reserve (3,027) (294) 0 0 0 (3,321)Impairment losses/reversals to Surplus or Deficit on the Provision of Services (13,675) 0 0 0 0 (13,675)Derecognition - Disposals 79 0 0 0 0 79
Other movements in depreciation and impairment (18) 18 0 0 0 0
At 31 Mar 17 (32,290) (1,108) (277) 0 (2) (33,676)
Net Book Value
At 31 Mar 17 627,662 13,420 214 1,263 10,785 653,346
At 31 Mar 16 487,037 14,638 351 1,377 4,022 507,425
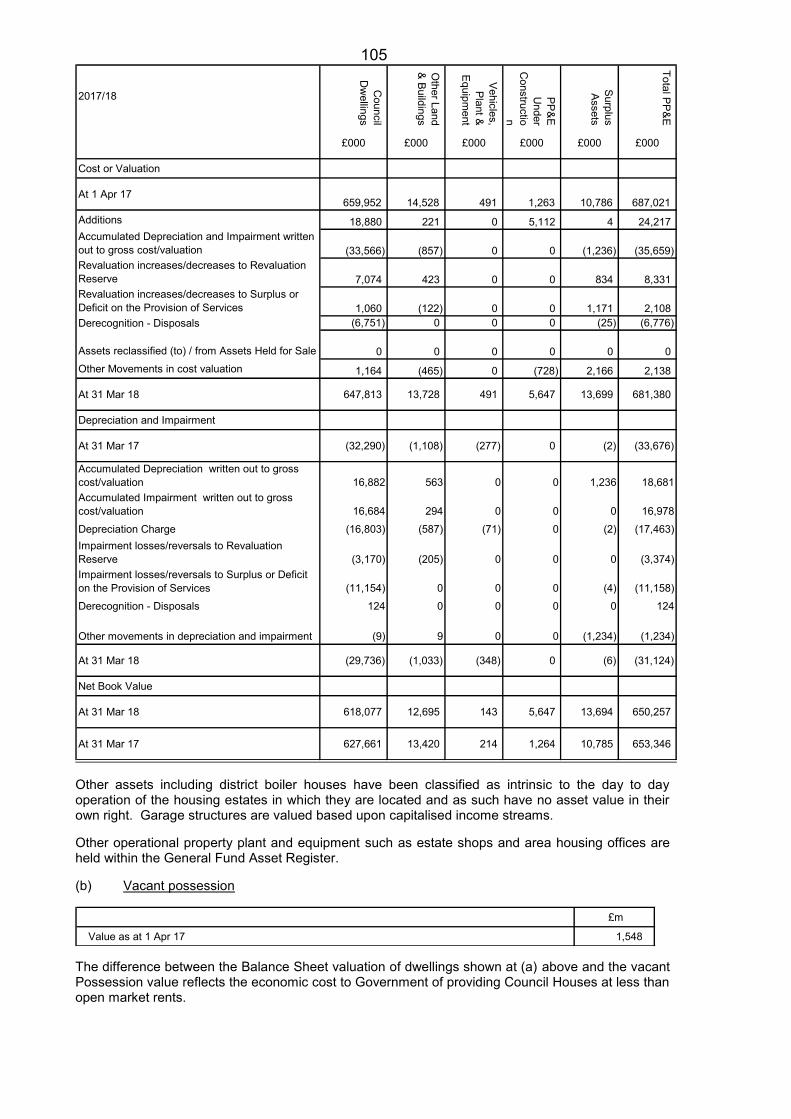
105
2017/18
Council
Dw
ellings
Other Land
& Buildings
Vehicles, Plant &
Equipment
PP&E U
nder C
onstruction
Surplus Assets
Total PP&E
£000 £000 £000 £000 £000 £000
Cost or Valuation
At 1 Apr 17659,952 14,528 491 1,263 10,786 687,021
Additions 18,880 221 0 5,112 4 24,217 Accumulated Depreciation and Impairment written out to gross cost/valuation (33,566) (857) 0 0 (1,236) (35,659)Revaluation increases/decreases to Revaluation Reserve 7,074 423 0 0 834 8,331 Revaluation increases/decreases to Surplus or Deficit on the Provision of Services 1,060 (122) 0 0 1,171 2,108 Derecognition - Disposals (6,751) 0 0 0 (25) (6,776)
Assets reclassified (to) / from Assets Held for Sale 0 0 0 0 0 0 Other Movements in cost valuation 1,164 (465) 0 (728) 2,166 2,138
At 31 Mar 18 647,813 13,728 491 5,647 13,699 681,380
Depreciation and Impairment
At 31 Mar 17 (32,290) (1,108) (277) 0 (2) (33,676)
Accumulated Depreciation written out to gross cost/valuation 16,882 563 0 0 1,236 18,681 Accumulated Impairment written out to gross cost/valuation 16,684 294 0 0 0 16,978 Depreciation Charge (16,803) (587) (71) 0 (2) (17,463)Impairment losses/reversals to Revaluation Reserve (3,170) (205) 0 0 0 (3,374)Impairment losses/reversals to Surplus or Deficit on the Provision of Services (11,154) 0 0 0 (4) (11,158)Derecognition - Disposals 124 0 0 0 0 124
Other movements in depreciation and impairment (9) 9 0 0 (1,234) (1,234)
At 31 Mar 18 (29,736) (1,033) (348) 0 (6) (31,124)
Net Book Value
At 31 Mar 18 618,077 12,695 143 5,647 13,694 650,257
At 31 Mar 17 627,661 13,420 214 1,264 10,785 653,346
Other assets including district boiler houses have been classified as intrinsic to the day to day operation of the housing estates in which they are located and as such have no asset value in their own right. Garage structures are valued based upon capitalised income streams. Other operational property plant and equipment such as estate shops and area housing offices are held within the General Fund Asset Register. (b) Vacant possession
£m
Value as at 1 Apr 17 1,548 The difference between the Balance Sheet valuation of dwellings shown at (a) above and the vacant Possession value reflects the economic cost to Government of providing Council Houses at less than open market rents.
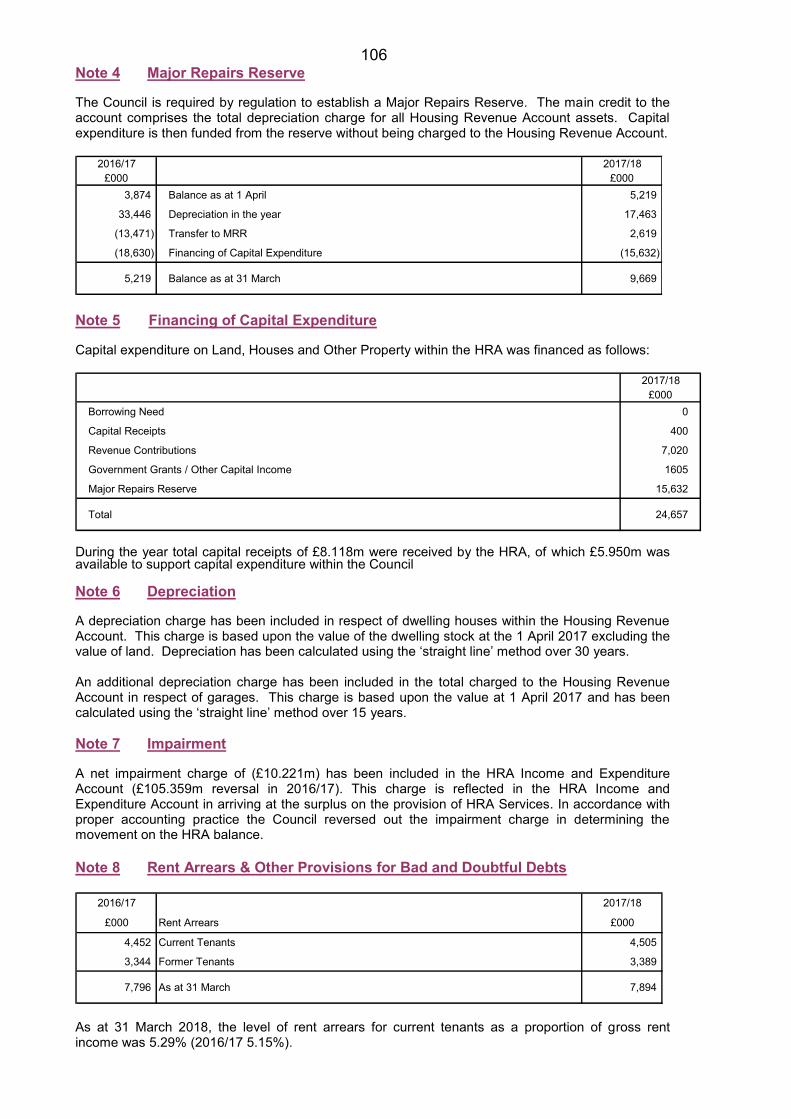
106 Note 4 Major Repairs Reserve The Council is required by regulation to establish a Major Repairs Reserve. The main credit to the account comprises the total depreciation charge for all Housing Revenue Account assets. Capital expenditure is then funded from the reserve without being charged to the Housing Revenue Account.
2016/17 2017/18£000 £000
3,874 Balance as at 1 April 5,219
33,446 Depreciation in the year 17,463
(13,471) Transfer to MRR 2,619
(18,630) Financing of Capital Expenditure (15,632)
5,219 Balance as at 31 March 9,669
Note 5 Financing of Capital Expenditure Capital expenditure on Land, Houses and Other Property within the HRA was financed as follows:
2017/18£000
Borrowing Need 0
Capital Receipts 400
Revenue Contributions 7,020
Government Grants / Other Capital Income 1605
Major Repairs Reserve 15,632
Total 24,657
During the year total capital receipts of £8.118m were received by the HRA, of which £5.950m was available to support capital expenditure within the Council Note 6 Depreciation A depreciation charge has been included in respect of dwelling houses within the Housing Revenue Account. This charge is based upon the value of the dwelling stock at the 1 April 2017 excluding the value of land. Depreciation has been calculated using the ‘straight line’ method over 30 years. An additional depreciation charge has been included in the total charged to the Housing Revenue Account in respect of garages. This charge is based upon the value at 1 April 2017 and has been calculated using the ‘straight line’ method over 15 years. Note 7 Impairment A net impairment charge of (£10.221m) has been included in the HRA Income and Expenditure Account (£105.359m reversal in 2016/17). This charge is reflected in the HRA Income and Expenditure Account in arriving at the surplus on the provision of HRA Services. In accordance with proper accounting practice the Council reversed out the impairment charge in determining the movement on the HRA balance. Note 8 Rent Arrears & Other Provisions for Bad and Doubtful Debts
2016/17 2017/18
£000 Rent Arrears £000
4,452 Current Tenants 4,505
3,344 Former Tenants 3,389
7,796 As at 31 March 7,894
As at 31 March 2018, the level of rent arrears for current tenants as a proportion of gross rent income was 5.29% (2016/17 5.15%).
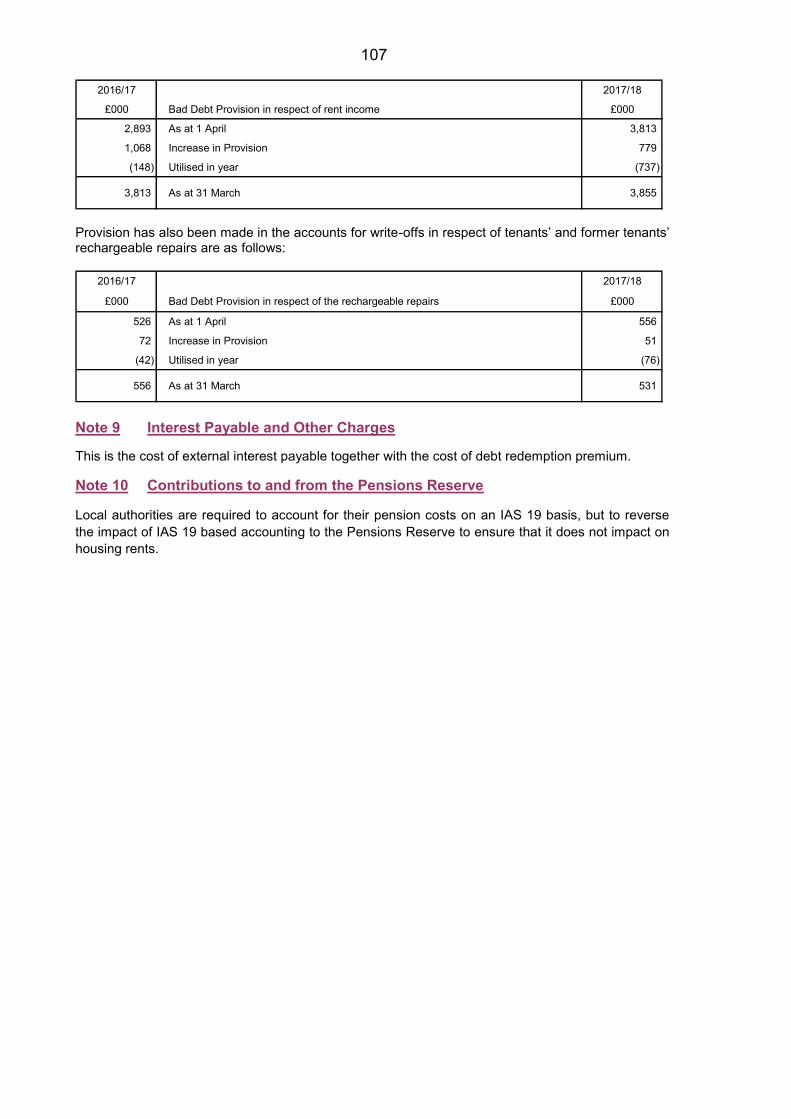
107
2016/17 2017/18
£000 Bad Debt Provision in respect of rent income £000
2,893 As at 1 April 3,813
1,068 Increase in Provision 779
(148) Utilised in year (737)
3,813 As at 31 March 3,855
Provision has also been made in the accounts for write-offs in respect of tenants’ and former tenants’ rechargeable repairs are as follows:
2016/17 2017/18
£000 Bad Debt Provision in respect of the rechargeable repairs £000
526 As at 1 April 556
72 Increase in Provision 51
(42) Utilised in year (76)
556 As at 31 March 531
Note 9 Interest Payable and Other Charges This is the cost of external interest payable together with the cost of debt redemption premium. Note 10 Contributions to and from the Pensions Reserve Local authorities are required to account for their pension costs on an IAS 19 basis, but to reverse the impact of IAS 19 based accounting to the Pensions Reserve to ensure that it does not impact on housing rents.
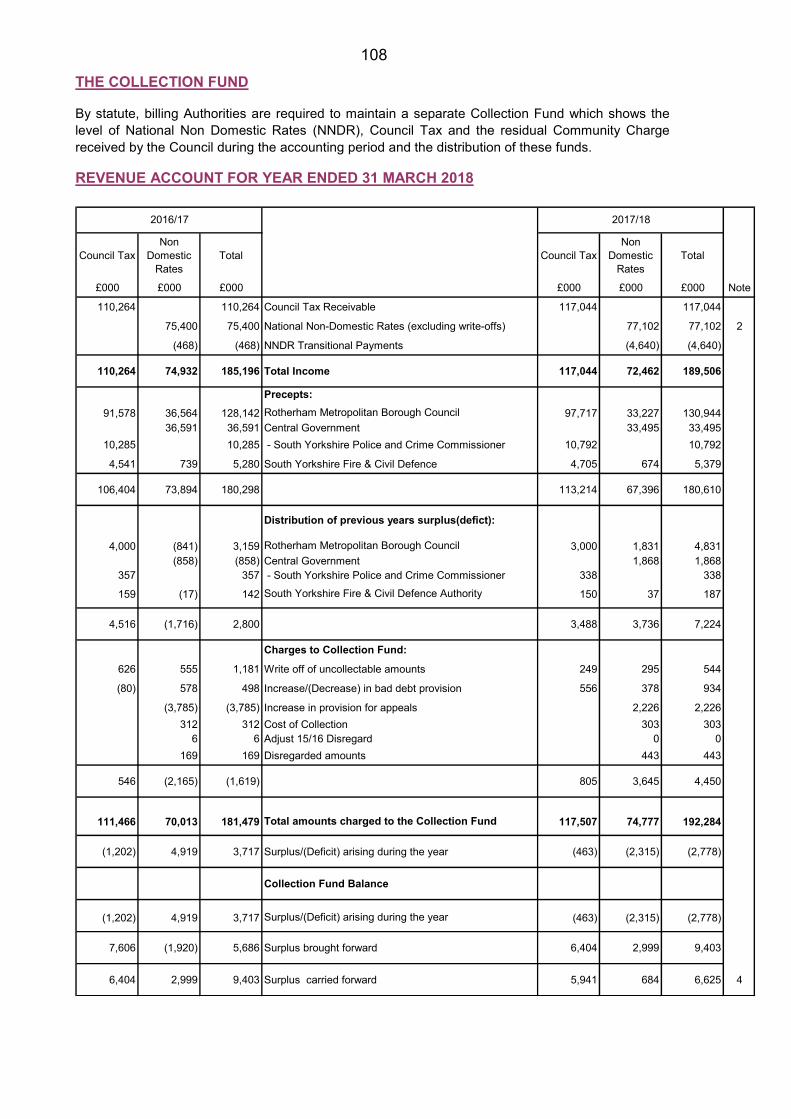
108 THE COLLECTION FUND By statute, billing Authorities are required to maintain a separate Collection Fund which shows the level of National Non Domestic Rates (NNDR), Council Tax and the residual Community Charge received by the Council during the accounting period and the distribution of these funds. REVENUE ACCOUNT FOR YEAR ENDED 31 MARCH 2018
Council TaxNon
Domestic Rates
Total Council TaxNon
Domestic Rates
Total
£000 £000 £000 £000 £000 £000 Note
110,264 110,264 Council Tax Receivable 117,044 117,044
75,400 75,400 National Non-Domestic Rates (excluding write-offs) 77,102 77,102 2
(468) (468) NNDR Transitional Payments (4,640) (4,640)
110,264 74,932 185,196 Total Income 117,044 72,462 189,506
Precepts:91,578 36,564 128,142 Rotherham Metropolitan Borough Council 97,717 33,227 130,944
36,591 36,591 Central Government 33,495 33,49510,285 10,285 - South Yorkshire Police and Crime Commissioner 10,792 10,792
4,541 739 5,280 South Yorkshire Fire & Civil Defence 4,705 674 5,379
106,404 73,894 180,298 113,214 67,396 180,610
Distribution of previous years surplus(defict):
4,000 (841) 3,159 Rotherham Metropolitan Borough Council 3,000 1,831 4,831(858) (858) Central Government 1,868 1,868
357 357 - South Yorkshire Police and Crime Commissioner 338 338
159 (17) 142 South Yorkshire Fire & Civil Defence Authority 150 37 187
4,516 (1,716) 2,800 3,488 3,736 7,224
Charges to Collection Fund:
626 555 1,181 Write off of uncollectable amounts 249 295 544
(80) 578 498 Increase/(Decrease) in bad debt provision 556 378 934
(3,785) (3,785) Increase in provision for appeals 2,226 2,226312 312 Cost of Collection 303 303
6 6 Adjust 15/16 Disregard 0 0169 169 Disregarded amounts 443 443
546 (2,165) (1,619) 805 3,645 4,450
111,466 70,013 181,479 Total amounts charged to the Collection Fund 117,507 74,777 192,284
(1,202) 4,919 3,717 Surplus/(Deficit) arising during the year (463) (2,315) (2,778)
Collection Fund Balance
(1,202) 4,919 3,717 Surplus/(Deficit) arising during the year (463) (2,315) (2,778)
7,606 (1,920) 5,686 Surplus brought forward 6,404 2,999 9,403
6,404 2,999 9,403 Surplus carried forward 5,941 684 6,625 4
2016/17 2017/18
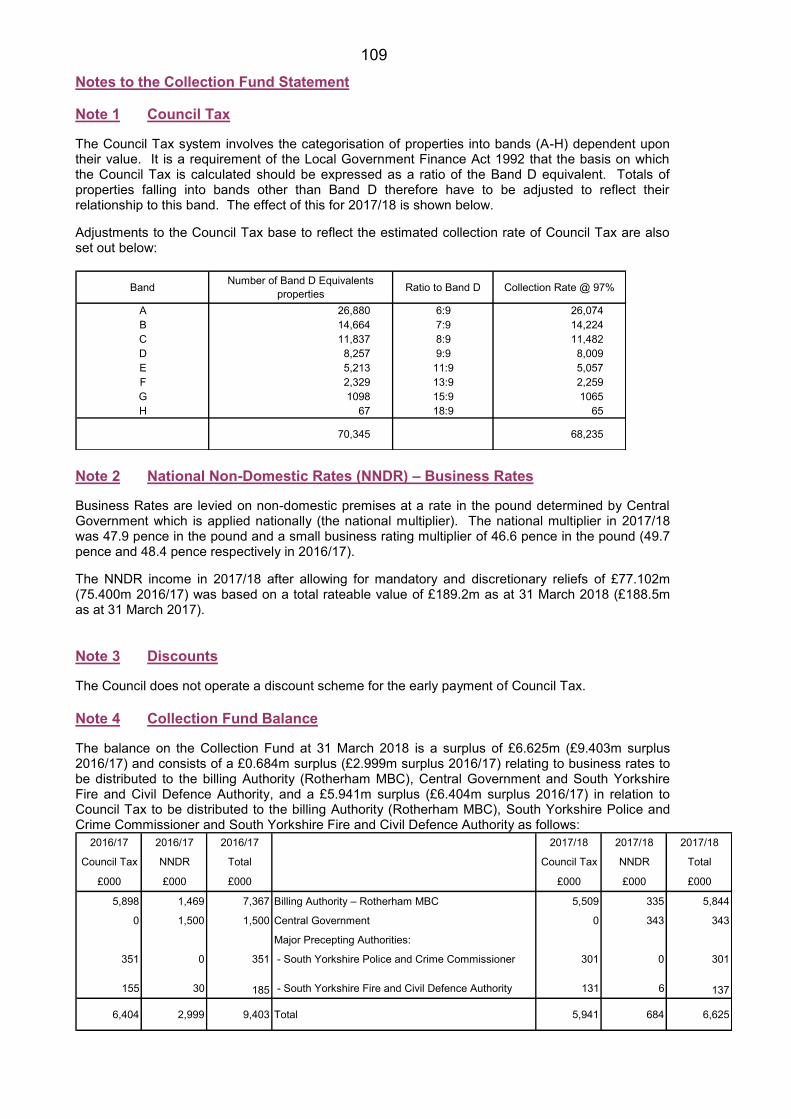
109 Notes to the Collection Fund Statement Note 1 Council Tax The Council Tax system involves the categorisation of properties into bands (A-H) dependent upon their value. It is a requirement of the Local Government Finance Act 1992 that the basis on which the Council Tax is calculated should be expressed as a ratio of the Band D equivalent. Totals of properties falling into bands other than Band D therefore have to be adjusted to reflect their relationship to this band. The effect of this for 2017/18 is shown below. Adjustments to the Council Tax base to reflect the estimated collection rate of Council Tax are also set out below:
Band Number of Band D Equivalents properties Ratio to Band D Collection Rate @ 97%
A 26,880 6:9 26,074B 14,664 7:9 14,224C 11,837 8:9 11,482D 8,257 9:9 8,009E 5,213 11:9 5,057F 2,329 13:9 2,259G 1098 15:9 1065H 67 18:9 65
70,345 68,235
Note 2 National Non-Domestic Rates (NNDR) – Business Rates Business Rates are levied on non-domestic premises at a rate in the pound determined by Central Government which is applied nationally (the national multiplier). The national multiplier in 2017/18 was 47.9 pence in the pound and a small business rating multiplier of 46.6 pence in the pound (49.7 pence and 48.4 pence respectively in 2016/17). The NNDR income in 2017/18 after allowing for mandatory and discretionary reliefs of £77.102m (75.400m 2016/17) was based on a total rateable value of £189.2m as at 31 March 2018 (£188.5m as at 31 March 2017). Note 3 Discounts
The Council does not operate a discount scheme for the early payment of Council Tax. Note 4 Collection Fund Balance
The balance on the Collection Fund at 31 March 2018 is a surplus of £6.625m (£9.403m surplus 2016/17) and consists of a £0.684m surplus (£2.999m surplus 2016/17) relating to business rates to be distributed to the billing Authority (Rotherham MBC), Central Government and South Yorkshire Fire and Civil Defence Authority, and a £5.941m surplus (£6.404m surplus 2016/17) in relation to Council Tax to be distributed to the billing Authority (Rotherham MBC), South Yorkshire Police and Crime Commissioner and South Yorkshire Fire and Civil Defence Authority as follows:
2016/17 2016/17 2016/17 2017/18 2017/18 2017/18
Council Tax NNDR Total Council Tax NNDR Total
£000 £000 £000 £000 £000 £000
5,898 1,469 7,367 Billing Authority – Rotherham MBC 5,509 335 5,844
0 1,500 1,500 Central Government 0 343 343
Major Precepting Authorities:
351 0 351 - South Yorkshire Police and Crime Commissioner 301 0 301
155 30 185 - South Yorkshire Fire and Civil Defence Authority 131 6 137
6,404 2,999 9,403 Total 5,941 684 6,625
110 Note 5 Parish Precepts
Precept demands are issued by the parishes on the Council as Billing Council. In turn the Council issues a precept on the Collection Fund for the year inclusive of the parish precepts payable. The payment of the parish precepts appears as a charge in the Comprehensive Income and Expenditure Account (see Note 4 Other Operating Expenditure).
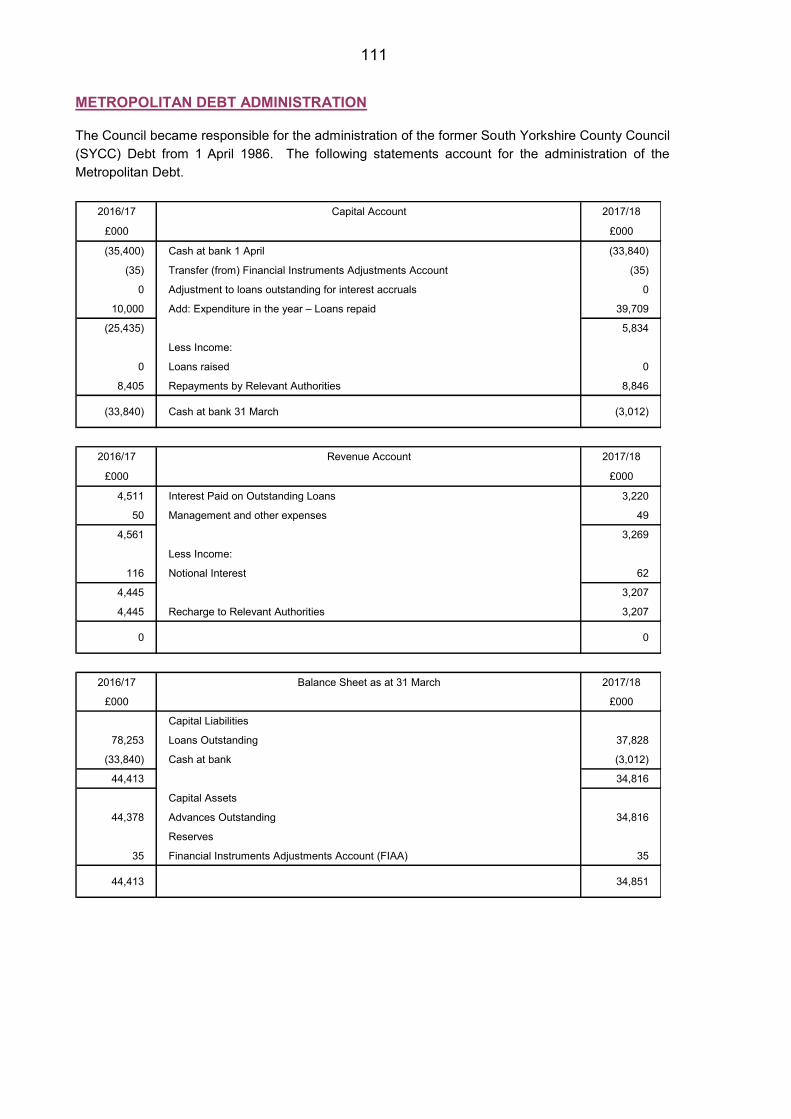
111 METROPOLITAN DEBT ADMINISTRATION
The Council became responsible for the administration of the former South Yorkshire County Council (SYCC) Debt from 1 April 1986. The following statements account for the administration of the Metropolitan Debt.
2016/17 Capital Account 2017/18
£000 £000
(35,400) Cash at bank 1 April (33,840)
(35) Transfer (from) Financial Instruments Adjustments Account (35)
0 Adjustment to loans outstanding for interest accruals 0
10,000 Add: Expenditure in the year – Loans repaid 39,709
(25,435) 5,834
Less Income:
0 Loans raised 0
8,405 Repayments by Relevant Authorities 8,846
(33,840) Cash at bank 31 March (3,012)
2016/17 Revenue Account 2017/18
£000 £000
4,511 Interest Paid on Outstanding Loans 3,220
50 Management and other expenses 49
4,561 3,269
Less Income:
116 Notional Interest 62
4,445 3,207
4,445 Recharge to Relevant Authorities 3,207
0 0
2016/17 Balance Sheet as at 31 March 2017/18
£000 £000
Capital Liabilities
78,253 Loans Outstanding 37,828
(33,840) Cash at bank (3,012)
44,413 34,816
Capital Assets
44,378 Advances Outstanding 34,816
Reserves
35 Financial Instruments Adjustments Account (FIAA) 35
44,413 34,851
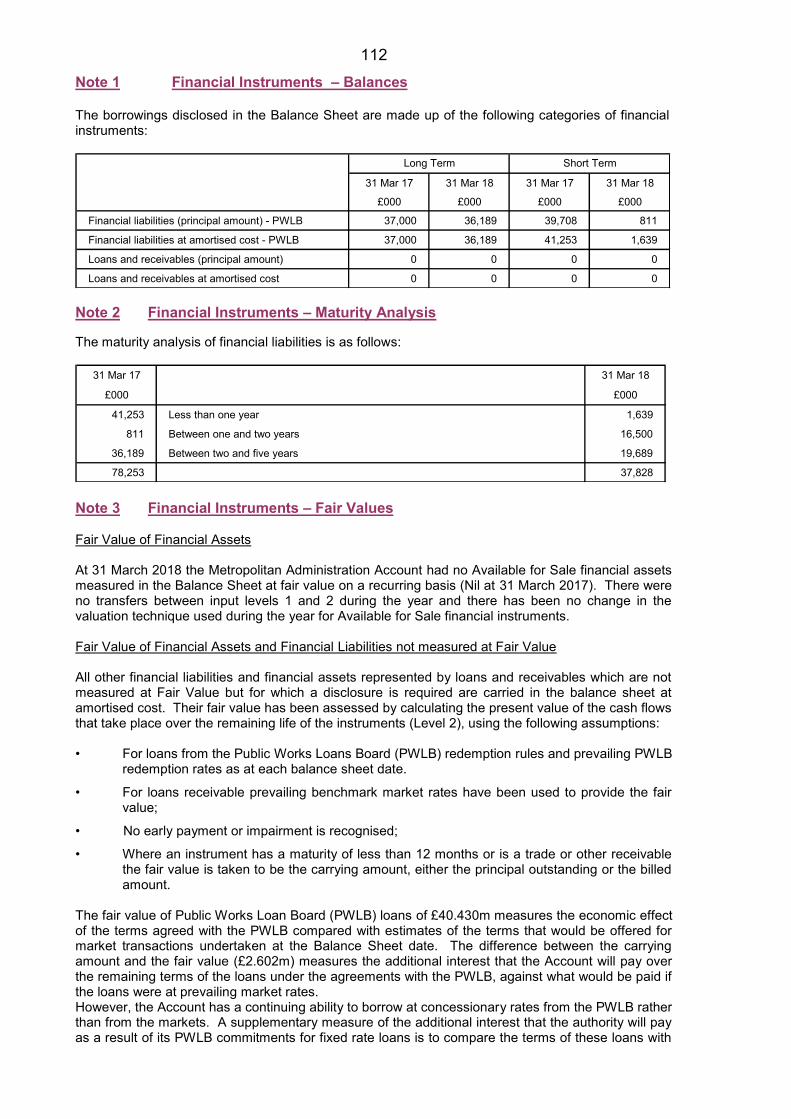
112 Note 1 Financial Instruments – Balances The borrowings disclosed in the Balance Sheet are made up of the following categories of financial instruments:
31 Mar 17 31 Mar 18 31 Mar 17 31 Mar 18
£000 £000 £000 £000
Financial liabilities (principal amount) - PWLB 37,000 36,189 39,708 811
Financial liabilities at amortised cost - PWLB 37,000 36,189 41,253 1,639
Loans and receivables (principal amount) 0 0 0 0
Loans and receivables at amortised cost 0 0 0 0
Long Term Short Term
Note 2 Financial Instruments – Maturity Analysis The maturity analysis of financial liabilities is as follows:
31 Mar 17 31 Mar 18
£000 £000
41,253 Less than one year 1,639
811 Between one and two years 16,500
36,189 Between two and five years 19,689
78,253 37,828 Note 3 Financial Instruments – Fair Values Fair Value of Financial Assets At 31 March 2018 the Metropolitan Administration Account had no Available for Sale financial assets measured in the Balance Sheet at fair value on a recurring basis (Nil at 31 March 2017). There were no transfers between input levels 1 and 2 during the year and there has been no change in the valuation technique used during the year for Available for Sale financial instruments. Fair Value of Financial Assets and Financial Liabilities not measured at Fair Value All other financial liabilities and financial assets represented by loans and receivables which are not measured at Fair Value but for which a disclosure is required are carried in the balance sheet at amortised cost. Their fair value has been assessed by calculating the present value of the cash flows that take place over the remaining life of the instruments (Level 2), using the following assumptions: • For loans from the Public Works Loans Board (PWLB) redemption rules and prevailing PWLB
redemption rates as at each balance sheet date.
• For loans receivable prevailing benchmark market rates have been used to provide the fair value;
• No early payment or impairment is recognised;
• Where an instrument has a maturity of less than 12 months or is a trade or other receivable the fair value is taken to be the carrying amount, either the principal outstanding or the billed amount.
The fair value of Public Works Loan Board (PWLB) loans of £40.430m measures the economic effect of the terms agreed with the PWLB compared with estimates of the terms that would be offered for market transactions undertaken at the Balance Sheet date. The difference between the carrying amount and the fair value (£2.602m) measures the additional interest that the Account will pay over the remaining terms of the loans under the agreements with the PWLB, against what would be paid if the loans were at prevailing market rates. However, the Account has a continuing ability to borrow at concessionary rates from the PWLB rather than from the markets. A supplementary measure of the additional interest that the authority will pay as a result of its PWLB commitments for fixed rate loans is to compare the terms of these loans with
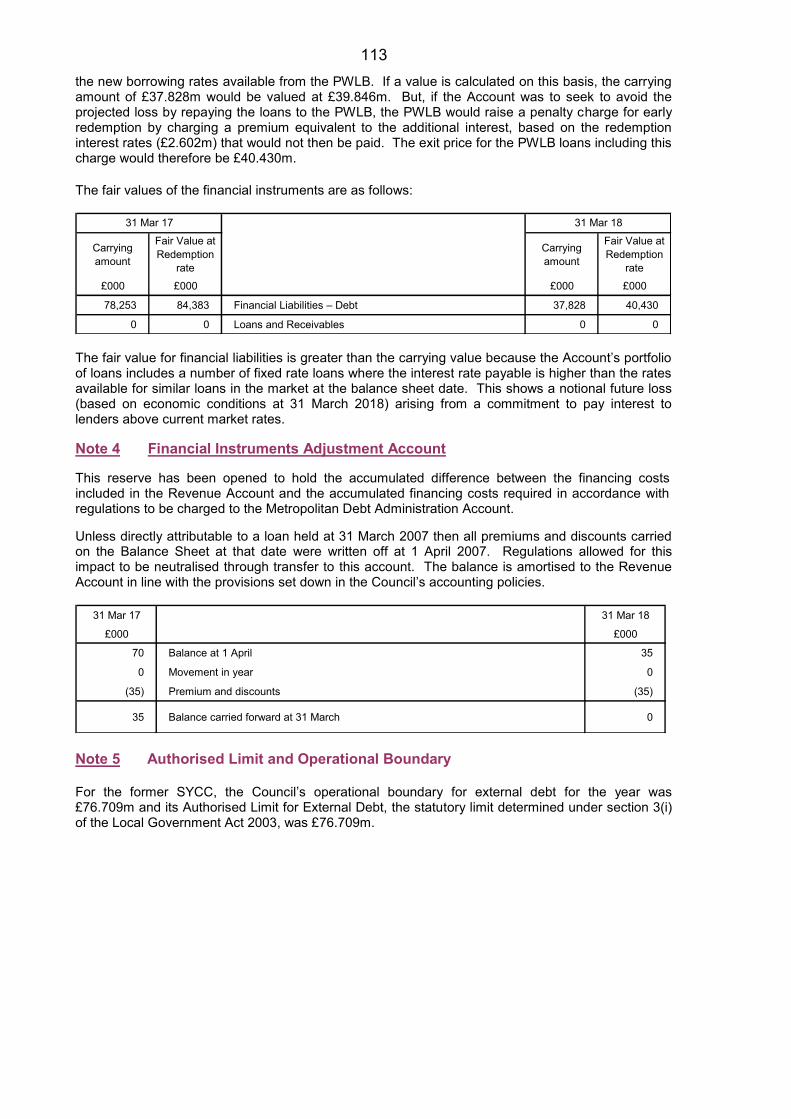
113 the new borrowing rates available from the PWLB. If a value is calculated on this basis, the carrying amount of £37.828m would be valued at £39.846m. But, if the Account was to seek to avoid the projected loss by repaying the loans to the PWLB, the PWLB would raise a penalty charge for early redemption by charging a premium equivalent to the additional interest, based on the redemption interest rates (£2.602m) that would not then be paid. The exit price for the PWLB loans including this charge would therefore be £40.430m. The fair values of the financial instruments are as follows:
Carrying amount
Fair Value at Redemption
rate
Carrying amount
Fair Value at Redemption
rate£000 £000 £000 £000
78,253 84,383 Financial Liabilities – Debt 37,828 40,430
0 0 Loans and Receivables 0 0
31 Mar 17 31 Mar 18
The fair value for financial liabilities is greater than the carrying value because the Account’s portfolio of loans includes a number of fixed rate loans where the interest rate payable is higher than the rates available for similar loans in the market at the balance sheet date. This shows a notional future loss (based on economic conditions at 31 March 2018) arising from a commitment to pay interest to lenders above current market rates. Note 4 Financial Instruments Adjustment Account This reserve has been opened to hold the accumulated difference between the financing costs included in the Revenue Account and the accumulated financing costs required in accordance with regulations to be charged to the Metropolitan Debt Administration Account. Unless directly attributable to a loan held at 31 March 2007 then all premiums and discounts carried on the Balance Sheet at that date were written off at 1 April 2007. Regulations allowed for this impact to be neutralised through transfer to this account. The balance is amortised to the Revenue Account in line with the provisions set down in the Council’s accounting policies.
31 Mar 17 31 Mar 18
£000 £000
70 Balance at 1 April 35
0 Movement in year 0
(35) Premium and discounts (35)
35 Balance carried forward at 31 March 0
Note 5 Authorised Limit and Operational Boundary For the former SYCC, the Council’s operational boundary for external debt for the year was £76.709m and its Authorised Limit for External Debt, the statutory limit determined under section 3(i) of the Local Government Act 2003, was £76.709m.

114
Independent auditor’s report to the members of Rotherham Metropolitan Borough Council We have audited the financial statements of Rotherham Metropolitan Borough Council for the year ended 31 March 2013 on pages 12 to 133. The financial reporting framework that has been applied in their preparation is applicable law and the CIPFA/LASAAC Code of Practice on Local Council Accounting in the United Kingdom 2012/13. This report is made solely to the members of the Council, as a body, in accordance with Part II of the Audit Commission Act 1998. Our audit work has been undertaken so that we might state to the members of the Council, as a body, those matters we are required to state to them in an auditor’s report and for no other purpose. To the fullest extent permitted by law, we do not accept or assume responsibility to anyone other than the members of the Council, as a body, for our audit work, for this report, or for the opinions we have formed. Respective responsibilities of the Strategic Director of Finance and Customer Services and auditor As explained more fully in the Statement of the Strategic Director of Finance and Customer Services Responsibilities, the Strategic Director of Finance and Customer Services is responsible for the preparation of the Statement of Accounts, which includes the financial statements, in accordance with proper practices as set out in the CIPFA/LASAAC Code of Practice on Local Council Accounting in the United Kingdom, and for being satisfied that they give a true and fair view. Our responsibility is to audit, and express an opinion on, the financial statements in accordance with applicable law and International Standards on Auditing (UK and Ireland). Those standards require us to comply with the Auditing Practices Board’s Ethical Standards for Auditors. Scope of the audit of the financial statements An audit involves obtaining evidence about the amounts and disclosures in the financial statements sufficient to give reasonable assurance that the financial statements are free from material misstatement, whether caused by fraud or error. This includes an assessment of whether the accounting policies are appropriate to the Council’s circumstances and have been consistently applied and adequately disclosed; the reasonableness of significant accounting estimates made by the Strategic Director of Finance and Customer Services and the overall presentation of the financial statements. In addition, we read all the financial and non-financial information in the Explanatory Foreword to identify material inconsistencies with the audited financial statements. If we become aware of any apparent material misstatements or inconsistencies we consider the implications for our report. Opinion on financial statements In our opinion the financial statements:
give a true and fair view of the financial position of the Council as at 31 March 2013 and of the
Council’s expenditure and income for the year then ended;
Been prepared properly in accordance with the CIPFA/LASAAC Code of Practice on Local
Council Accounting in the United Kingdom 2012/13.
Matters on which we are required to report by exception

115 The Code of Audit Practice 2010 for Local Government Bodies requires us to report to you if:
the annual governance statement which accompanies the financial statements does not reflect
compliance with ‘Delivering Good Governance in Local Government: a Framework’ published by
CIPFA/SOLACE in June 2007; or
the information given in the explanatory foreword for the financial year for which the financial
statements are prepared is not consistent with the financial statements; or
any matters have been reported in the public interest under section 8 of Audit Commission Act
1998 in the course of, or at the conclusion of, the audit; or
any recommendations have been made under section 11 of the Audit Commission Act 1998; or
Any other special powers of the auditor have been exercised under the Audit Commission Act
1998.
We have nothing to report in respect of these matters
Conclusion on Rotherham Metropolitan Borough Council’s arrangements for securing economy, efficiency and effectiveness in the use of resources Council’s responsibilities The Council is responsible for putting in place proper arrangements to secure economy, efficiency and effectiveness in its use of resources, to ensure proper stewardship and governance, and to review regularly the adequacy and effectiveness of these arrangements. Auditor’s responsibilities We are required under Section 5 of the Audit Commission Act 1998 to satisfy ourselves that the Council has made proper arrangements for securing economy, efficiency and effectiveness in its use of resources. The Code of Audit Practice issued by the Audit Commission requires us to report to you our conclusion relating to proper arrangements, having regard to relevant criteria specified by the Audit Commission. We report if significant matters have come to our attention which prevent us from concluding that the Council has put in place proper arrangements for securing economy, efficiency and effectiveness in its use of resources. We are not required to consider, nor have we considered, whether all aspects of the Council’s arrangements for securing economy, efficiency and effectiveness in its use of resources are operating effectively. Scope of the review of arrangements for securing economy, efficiency and effectiveness in the use of resources We have undertaken our audit in accordance with the Code of Audit Practice, having regard to the We certify that we have completed the audit of the financial statements of,
116 GLOSSARY
This listing will help Members and other readers to understand the terminology used within the Statement of Accounts.
ACCOUNTING PERIOD The period of time covered by the accounts, normally a period of twelve months commencing on 1 April. The end of the accounting period is the Balance Sheet date. ACCRUALS Sums included in the final accounts to recognise revenue and capital income and expenditure earned or incurred in the financial year, but for which actual payment had not been received or made as at 31 March. ADDED YEARS A discretionary award increasing the value of pensions for retiring employees aged 50 or over subject to specific conditions. Employers’ must exercise this discretion in accordance with the national regulations and the Council’s own policies. ASSET An asset is a resource controlled by the Council as a result of past events from which future economic benefits or service potential is expected to flow to the Council. - A current asset is an amount which is expected to be realised within 12 months. - A non-current asset is an amount which is expected to be realised after more than 12 months. AUDIT OF ACCOUNTS An independent examination of the Council’s financial affairs. BALANCE SHEET A statement of the recorded assets, liabilities and other balances at the end of the accounting period. BORROWING Government support for capital investment is described as either Supported Capital Expenditure (Revenue) known as SCE(R) or Supported Capital Expenditure (Capital Grant) known as SCE(C). SCE can be further classified as either Single Capital Pot (SCP) or ring-fenced. BUDGET The forecast of net revenue and capital expenditure over the accounting period. CAPITAL ADJUSTMENT ACCOUNT An account maintained to provide a balancing mechanism between the different rates at which assets are depreciated and are financed through the capital controls system. CAPITAL CHARGE A charge made to service revenue accounts to reflect the cost of Non-Current Assets used in the provision of services.
117
CAPITAL EXPENDITURE Expenditure on the acquisition of a fixed asset, which will be used in providing services beyond the current accounting period, or expenditure which adds to and not merely maintains the value of an existing fixed asset. CAPITAL FINANCING Funds rose to pay for capital expenditure. There are various methods of financing capital expenditure including borrowing, leasing, direct revenue financing, usable capital receipts, capital grants, capital contributions, revenue reserves and earmarked reserves. CAPITAL PROGRAMME The capital schemes the Council intends to carry out over a specific period of time. CAPITAL RECEIPT The proceeds from the disposal of land or other Non-Current Assets. Proportions of capital receipts can be used to finance new capital expenditure, within rules set down by the government but they cannot be used to finance revenue expenditure. CIPFA The Chartered Institute of Public Finance and Accountancy COLLECTION FUND A separate fund that records the income and expenditure relating to Council Tax and non-domestic rates. COMMUNITY ASSETS Assets that the Council intends to hold in perpetuity, that have no determinable useful life and that may have restrictions on their disposal. Examples of community assets are parks and historical buildings. CONSISTENCY The concept that the accounting treatment of like items within an accounting period and from one period to the next are the same. CONTINGENT ASSET A contingent asset is a possible asset arising from past events whose existence will be confirmed only by the occurrence of one or more uncertain future events not wholly within the Council’s control. CONTINGENT LIABILITY A contingent liability is either: - A possible obligation arising from past events whose existence will be confirmed only by the occurrence of one or more uncertain future events not wholly within the Council’s control; or - A present obligation arising from past events where it is not probable that a transfer of economic benefits will be required, or the amount of the obligation cannot be measured with sufficient reliability. COUNCIL TAX A banded property tax that is levied on domestic properties. The banding is based on assessed property values at 1 April 1991.
118
CREDITOR Amount owed by the Council for work done, goods received or services rendered within the accounting period, but for which payment has not been made by the end of that accounting period. CURRENT SERVICE COST (PENSIONS) The increase in the present value of a defined benefits pension scheme’s liabilities, expected to arise from employee service in the current period. DEBTOR Amount owed to the Council for works done, goods received or services rendered within the accounting period, but for which payment has not been received by the end of that accounting period. DEFINED BENEFIT PENSION SCHEME Pension schemes in which the benefits received by the participants are independent of the contributions paid and are not directly related to the investments of the scheme. DEPRECIATION The measure of the cost of wearing out, consumption or other reduction in the useful economic life of the Council’s Non-Current Assets during the accounting period, whether from use, the passage of time or obsolescence through technical or other changes. DISCRETIONARY BENEFITS (PENSIONS) Retirement benefits, which the employer has no legal, contractual or constructive obligation to award and are awarded under the Council’s discretionary powers such as the Local Government (Discretionary Payments) Regulations 1996.
DEDICATED SCHOOLS GRANT (DSG) A ring-fenced grant for Schools paid by the Department for Education and Skills (DfES) to the Local Council; it replaces the Schools Formula Spending Share (FSS).
EARMARKED RESERVE A sum set aside in a reserve for a specific purpose. EQUITY The Council’s value of total assets less total liabilities. EVENTS AFTER THE BALANCE SHEET DATE Events after the Balance Sheet date are those events, favourable or unfavourable, that occur between the Balance Sheet date and the date when the Statement of Accounts is authorised for issue. EXCEPTIONAL ITEMS Material items which derive from events or transactions that fall within the ordinary activities of the Council and which need to be disclosed separately by virtue of their size or incidence to give fair presentation of the accounts. FAIR VALUE The fair value of an asset is the price at which it could be exchanged in an arm’s length transaction less, where applicable, any grants receivable towards the purchase or use of the asset.
119 FEES AND CHARGES Income arising from the provision of services e.g. the use of leisure facilities. FINANCIAL INSTRUMENTS ADJUSTMENT ACCOUNT This reserve has been created under the SORP 2007 to hold the accumulated difference between the financing costs included in the Income and Expenditure Account and the accumulated financing costs required in accordance with Regulations to be charged to the General Fund Balance. FINANCE LEASE A lease that transfers substantially all of the risks and rewards of ownership of a fixed asset to the lessee. GENERAL FUND SERVICES Comprises all services provided by the Council with the exception of services relating to the provision of local Council housing – which are accounted for in the Housing Revenue Account. The net cost of General Fund services is met by council tax, Government Grants and Business Rates. GOING CONCERN The concept that the Statement of Accounts is prepared on the assumption that the Council will continue in operational existence for the foreseeable future. GOVERNMENT GRANTS Grants made by the government towards either revenue or capital expenditure in return for past or future compliance with certain conditions relating to the activities of the Council. These grants may be specific to a particular scheme or may support the revenue spend of the Council in general. HERITAGE ASSETS Heritage assets are those assets that are intended to be preserved in trust for future generations because of their cultural, environmental or historical associations. HOUSING BENEFITS A system of financial assistance to individuals towards certain housing costs administered by authorities and subsidised by central government.
HOUSING REVENUE ACCOUNT (HRA) A separate account to the General Fund, which includes the income and expenditure arising from the provision of housing accommodation by the Council. IMPAIRMENT A reduction in the value of a fixed asset to below its carrying amount on the Balance Sheet. COMPREHENSIVE INCOME AND EXPENDITURE STATEMENT The revenue account of the Council that reports the net cost for the year of the functions for which it is responsible and demonstrates how that cost has been financed from precepts, grants and other income.
INFRASTRUCTURE ASSETS Non-Current Assets belonging to the Council that cannot be transferred or sold, on which expenditure is only recoverable by the continued use of the asset created. Examples are highways, footpaths and bridges.
120 INVENTORIES Items of raw materials and stores a Council has procured and holds in expectation of future use. Examples are consumable stores, raw materials and products and services in intermediate stages of completion. INTANGIBLE ASSETS An intangible (non-physical) item may be defined as an asset when access to the future economic benefits it represents is controlled by the reporting entity. This Council’s intangible assets comprise computer software licences. NET INTEREST EXPENSE (PENSIONS) For a defined benefit scheme, the expected increase during the period in the present value of the scheme liabilities because the benefits are one period closer to settlement less interest income earned on plan assets. INVESTMENTS A long-term investment is an investment that is intended to be held for use on a continuing basis in the activities of the Council. Investments should be so classified only where an intention to hold the investments for the long term can clearly be demonstrated or where there are restrictions as to the investor’s ability to dispose of the investment. INVESTMENTS (PENSION FUND) The investments of the Pension Fund will be accounted for in the statements of that fund. However, authorities are also required to disclose, as part of the disclosure requirements relating to retirement benefits, the attributable share of the pension scheme assets associated with their underlying obligations. LIABILITY A liability is a present obligation arising from a past event, the settlement of which is expected to result in an outflow of resources. A liability is where the Council owes payment to an individual or another organisation. - A current liability is an amount which is expected to be settled within 12 months. - A non-current liability is an amount which is expected to be settled after more than 12 months. LIQUID RESOURCES Current asset investments that are readily disposable by the Council without disrupting its business and are either: - Readily convertible to known amounts of cash at or close to the carrying amount; or -Traded in an active market LONG-TERM CONTRACT A contract entered into for the design, manufacture or construction of a single substantial asset or the provision of a service (or a combination of assets or services which together constitute a single project), where the time taken to substantially complete the contract is such that the contract activity falls into more than one accounting period. MATERIALITY The concept that the Statement of Accounts should include all amounts which, if omitted, or mis-stated, could be expected to lead to a distortion of the financial statements and ultimately mislead a user of the accounts.
121
MAJOR REPAIRS RESERVE The Council is required by regulation to establish a Major Repairs Reserve. The main credit to the account comprises the total depreciation charge for all Housing Revenue Account assets. Capital expenditure is then funded from the reserve without being charged to the Housing Revenue Account. MINIMUM REVENUE PROVISION (MRP) The minimum amount which must be charged to the revenue account each year in order to provide for the repayment of loans and other amounts borrowed by the Council. NET BOOK VALUE The amount at which property, plant and equipment are included in the Balance Sheet, i.e. their historical costs or current value less the cumulative amounts provided for depreciation. NET DEBT The Council’s borrowings less cash and liquid resources. NET EXPENDITURE Gross expenditure less specific grants and income for charging for services. NET REALISABLE VALUE The open market value of an asset in its existing use less any expenses incurred in realising the asset. NON-DISTRIBUTED COSTS
These are overheads for which no user now benefits and as such are not apportioned to services NATIONAL NON-DOMESTIC RATES (NNDR) The National Non-Domestic Rate is a levy on businesses, based on a national rate in the pound set by the government and multiplied by the assessed rateable value of the premises they occupy. It is collected by the Council on behalf of the Council, Central Government, and South Yorkshire Fire and Civil Defence Council with surplus and deficits being shared in the ratio specified by Business Rates Retention Regulations. OPERATING LEASE A lease where the ownership of the fixed asset remains with the lessor. PAST SERVICE COST (PENSIONS) For a defined benefit pension scheme, the increase in the present value of the scheme liabilities related to employee service in prior periods arising in the current period as a result of the introduction of, or improvement to retirement benefits. PENSION SCHEME LIABILITIES The liabilities of a defined benefit pension scheme for outgoings due after the valuation date. Scheme liabilities measured during the projected unit method reflect valuation date. PRECEPT The levy made by precepting authorities by billing authorities, requiring the latter to collect income from Council Tax on their behalf.
122
PRIOR YEAR ADJUSTMENT Material adjustments applicable to previous years arising from changes in accounting policies or from the correction of fundamental errors. This does not include normal recurring corrections or adjustments of accounting estimates made in prior years. PRIVATE FINANCE IMITATIVE (PFI) A contract in which the private sector is responsible for supplying services that traditionally have been provided by the Council. The Council will pay for the provision of this service, which is often linked to availability, performance and levels of usage. PROPERTY, PLANT AND EQUIPMENT Tangible assets used by the Council in the provision of services that yield benefits to the Council for a period of more than one year. PROVISION An amount put aside in the accounts for future liabilities or losses which are certain or very likely to occur but the amounts or dates of when they will arise are uncertain.
PRUDENCE Requires that revenue is not anticipated until realisation can be assessed with reasonable certainty. Provision is made for all known liabilities whether the amount is certain or can only be estimated in light of the information available. PRUDENTIAL CODE Under the prudential framework, local authorities make their own decisions how much and what capital investment to undertake, based on their judgement on affordability, prudence and strategic objectives. In making their decisions, finance teams are required to take account of the CIPFA Prudential Code. RATEABLE VALUE The annual assumed rental of a hereditament, which is used for NDR purposes. RELATED PARTIES There is a detailed definition of related parties in IAS24. For the Council’s purposes related parties are deemed to include the Council’s members, the Chief Executive, its Directors and their close family and household members. RELATED PARTY TRANSACTIONS The Code of Practice on Local Authority Accounting requires the disclosure of any material transactions between the Council and related parties to ensure that stakeholders are aware when these transactions occur and the amount and implications of such. RE-MEASUREMENTS For a defined benefit pension scheme, the re-measurements comprise: (a) Changes in actuarial surpluses or deficits that arise because:
Events have not coincided with the actuarial assumptions made for the last valuation (experience gains and losses); or The actuarial assumptions have changed
(b) Return on plan assets excluding interest income which forms part of the pensions net interest expense
123 All sums paid to or receivable by an employee and sums due by way of expenses allowances (as far as those sums are chargeable to UK income tax) and the money value of any other benefits. Received other than in cash. Pension contributions payable by the employer are excluded. RESERVES The accumulation of surpluses, deficits and appropriations over past years. Reserves of a revenue nature are available and can be spent or earmarked at the discretion of the Council. Some capital reserves such as the fixed asset restatement account cannot be used to meet current expenditure. RESIDUAL VALUE The net realisable value of an asset at the end of its useful life. RETIREMENT BENEFITS All forms of consideration given by an employer in exchange for services rendered by employees that are payable after the completion of employment REVALUATION RESERVE Records unrealised revaluation gains arising (since 1 April 2007) from holding Non-Current Assets. REVENUE EXPENDITURE The day-to-day expenses of providing services. REVENUE EXPENDITURE FUNDED FROM CAPITAL UNDER STATUTE Legislation allows some items to be funded from capital resources that under IFRS and normal accounting practice would be charged to Surplus or Deficit on Provision of Services. REVENUE SUPPORT GRANT A grant paid by Central Government to authorities, contributing towards the general cost of their services. TEMPORARY BORROWING Money borrowed for a period of less than one year. TRUST FUNDS Funds administered by the Council for such purposes as prizes, charities, specific projects and on behalf of minors. USEFUL ECONOMIC LIFE (UEL) The period over which the Council will derive benefits form the use of a fixed asset. WORK IN PROGRESS (WIP) The cost of work performed on an uncompleted project at the end of the financial year.
124
A summary of this document can be made available in your language and in alternative formats such as Braille, large print, electronic and audio-tape versions. Contact us at: Email: [email protected]
‘’If you or someone you know needs help to understand or read this document, please contact us’’: : 01709 254510 :[email protected]
Minicom: 01709 823536