Embed Size (px)
Citation preview
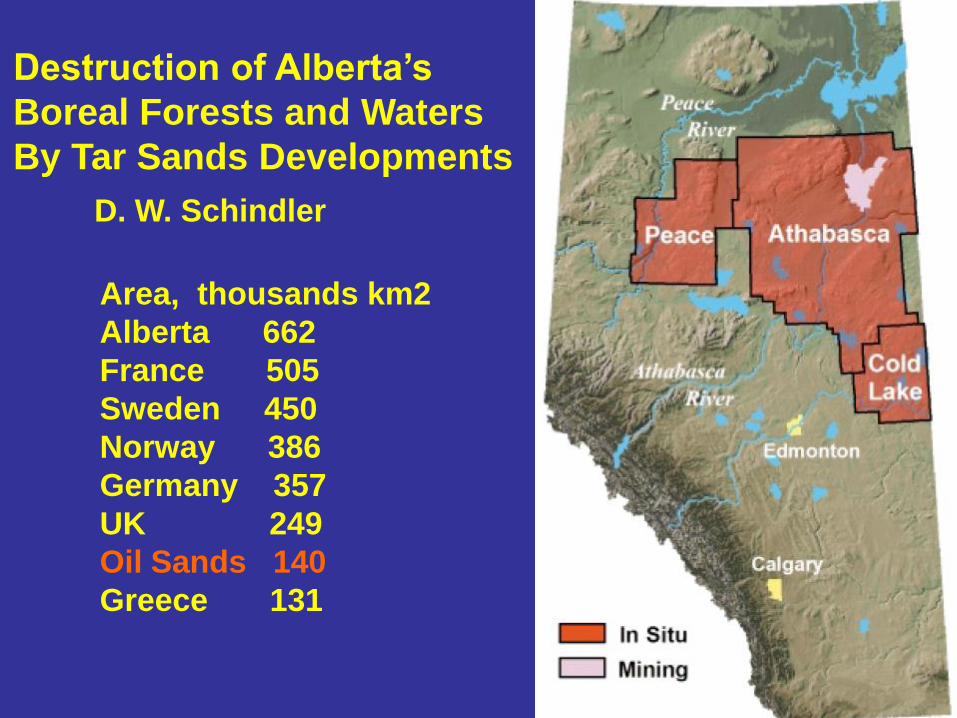
Destruction of Alberta’s
Boreal Forests and Waters
By Tar Sands Developments
D. W. Schindler
Area, thousands km2
Alberta 662
France 505
Sweden 450
Norway 386
Germany 357
UK 249
Oil Sands 140
Greece 131
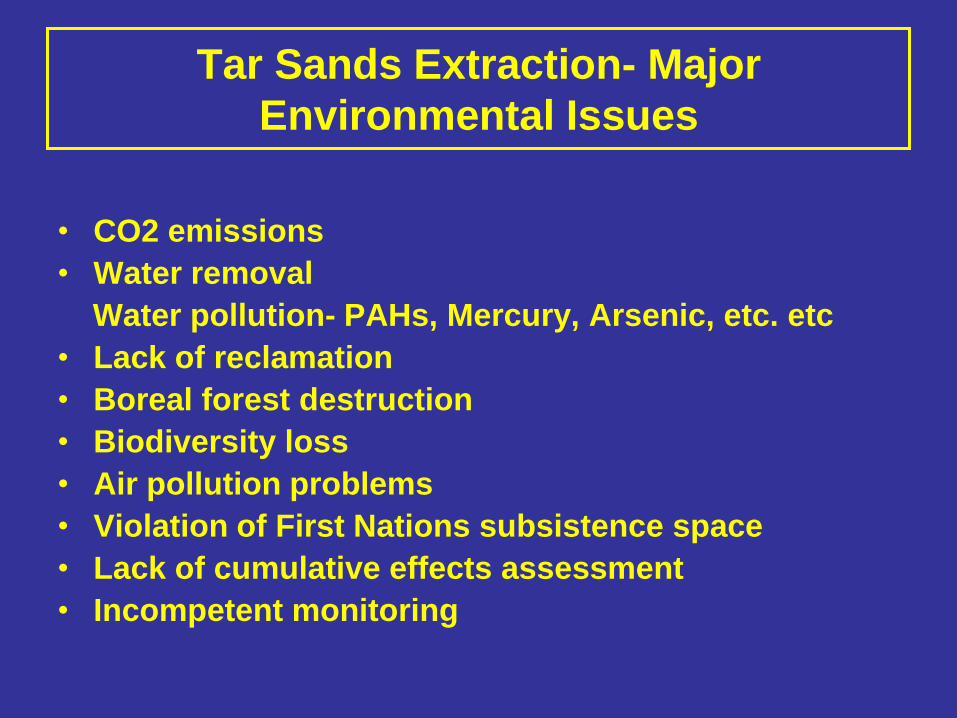
Tar Sands Extraction- Major
Environmental Issues
• CO2 emissions
• Water removal
Water pollution- PAHs, Mercury, Arsenic, etc. etc
• Lack of reclamation
• Boreal forest destruction
• Biodiversity loss
• Air pollution problems
• Violation of First Nations subsistence space
• Lack of cumulative effects assessment
• Incompetent monitoring
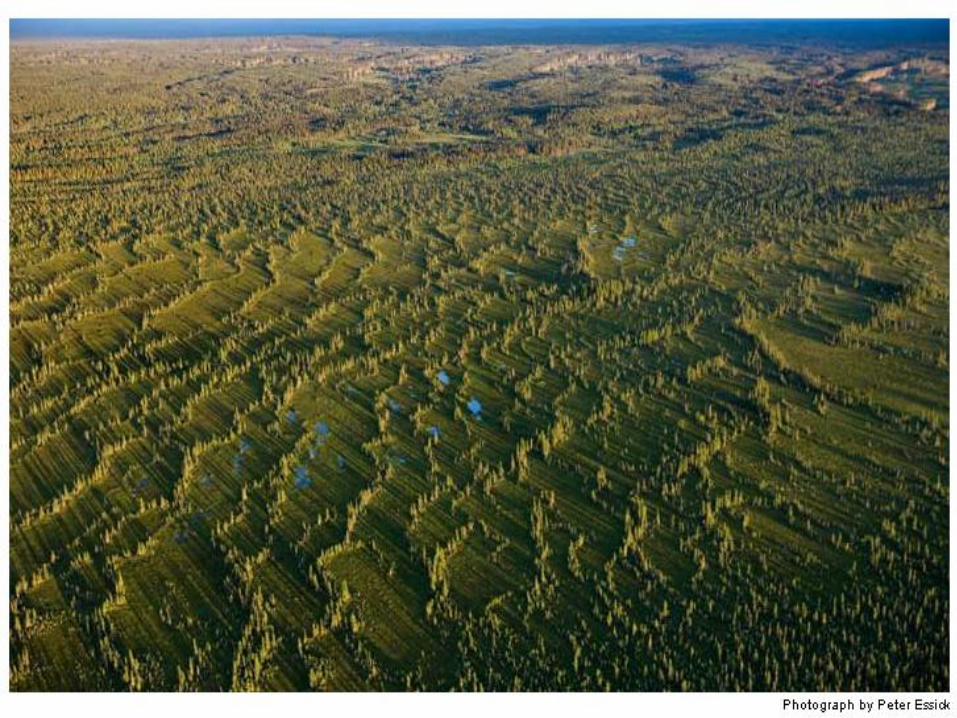
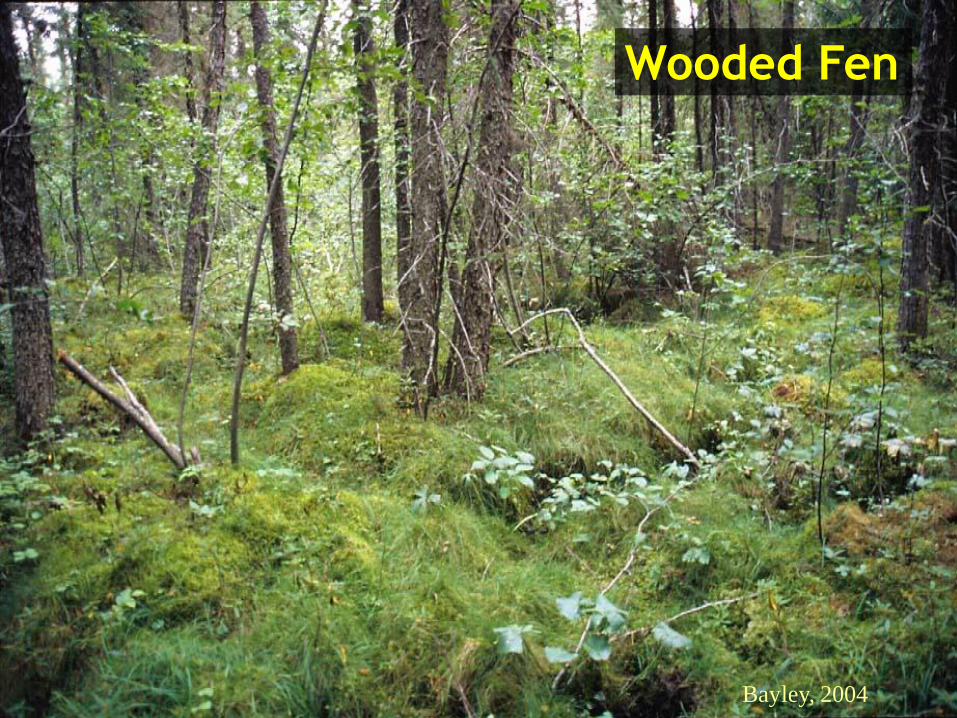
Wooded Fen
Bayley, 2004
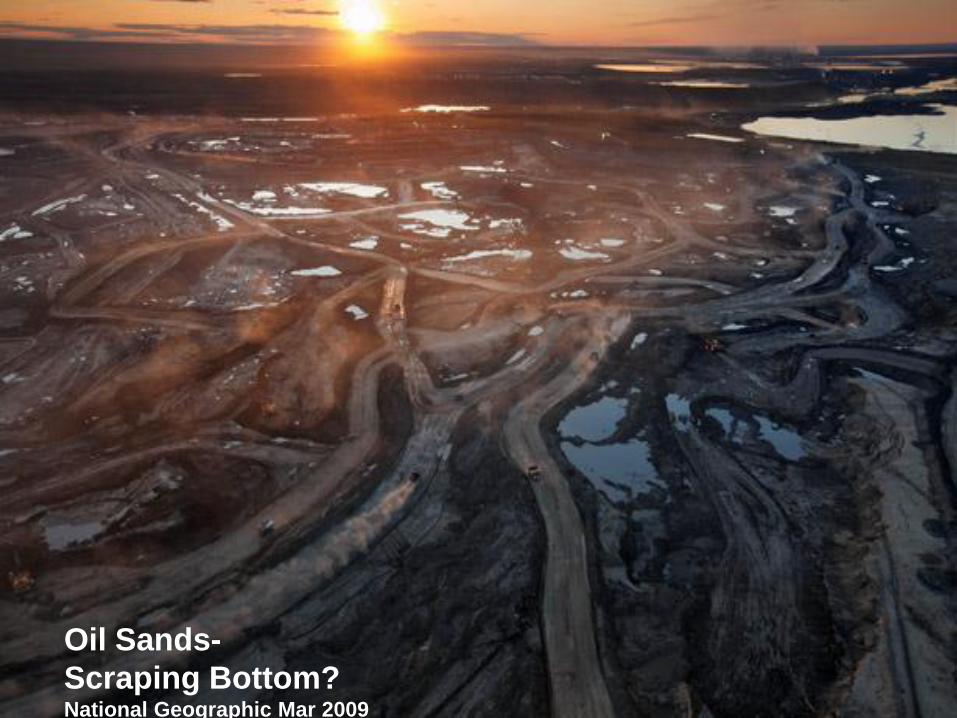
Oil Sands-
Scraping Bottom?National Geographic Mar 2009

We need to get the message out….!
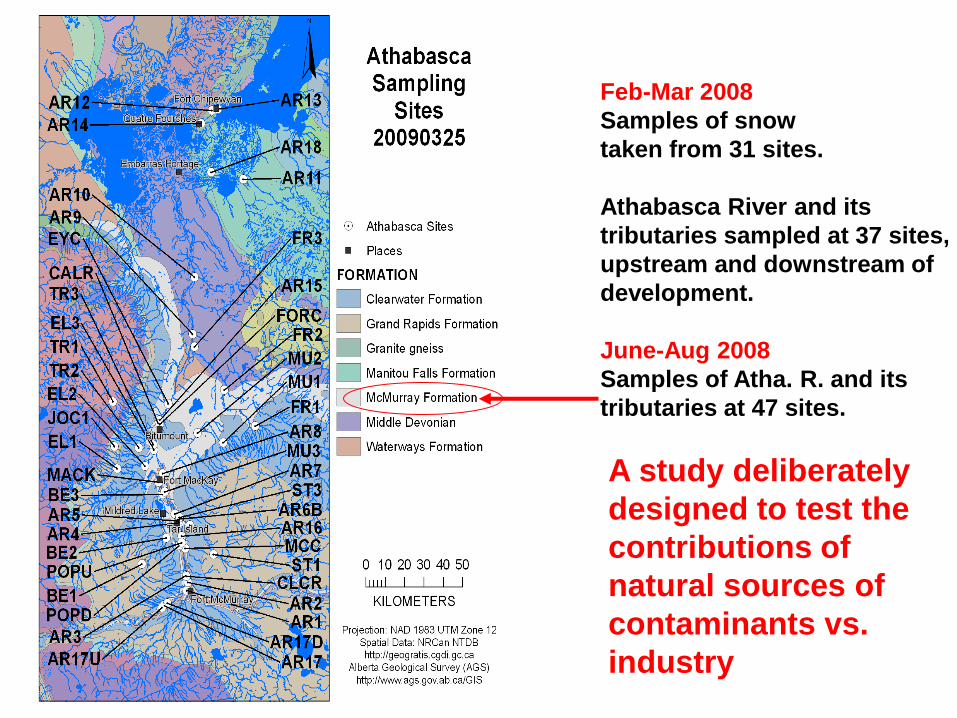
Feb-Mar 2008
Samples of snow
taken from 31 sites.
Athabasca River and its
tributaries sampled at 37 sites,
upstream and downstream of
development.
June-Aug 2008
Samples of Atha. R. and its
tributaries at 47 sites.
A study deliberately
designed to test the
contributions of
natural sources of
contaminants vs.
industry
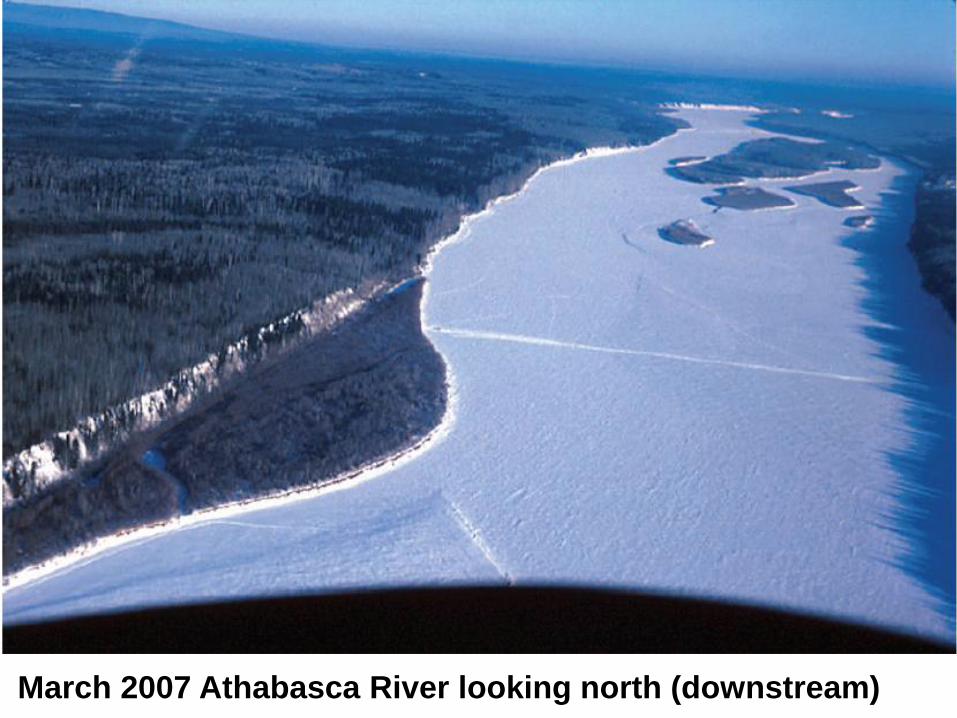
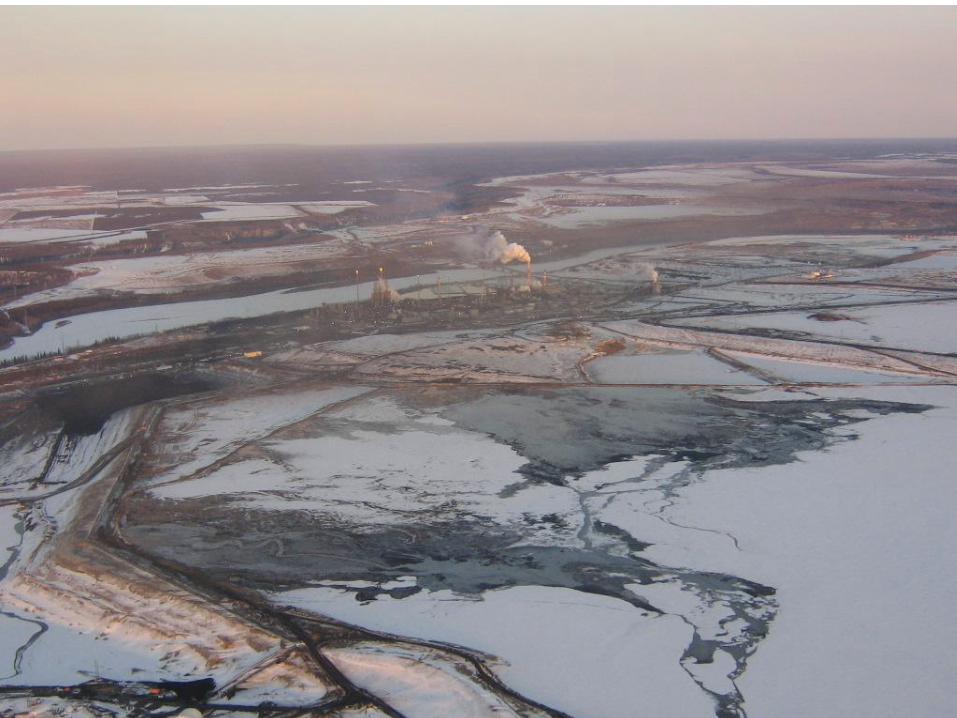
March 2007 Athabasca River looking north (downstream)
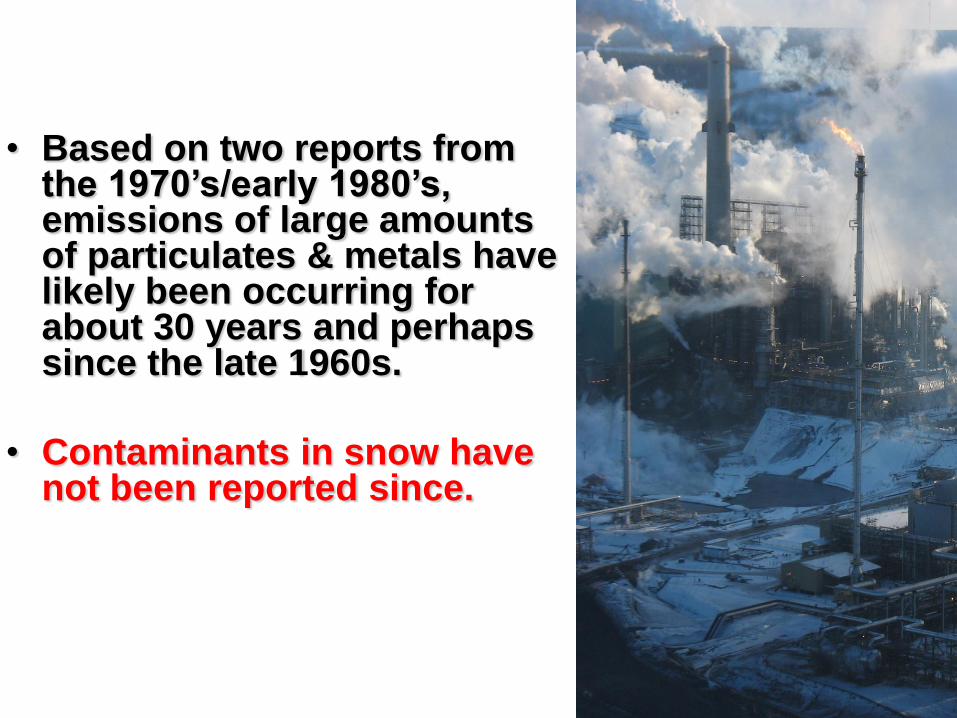
• Based on two reports from the 1970’s/early 1980’s, emissions of large amounts of particulates & metals have likely been occurring for about 30 years and perhaps since the late 1960s.
• Contaminants in snow have not been reported since.

MU 3
Snow profile,
Muskeg River,
March 2008
Snow was
sampled at 31
sites, representing
four months of
deposition.
Snow Results
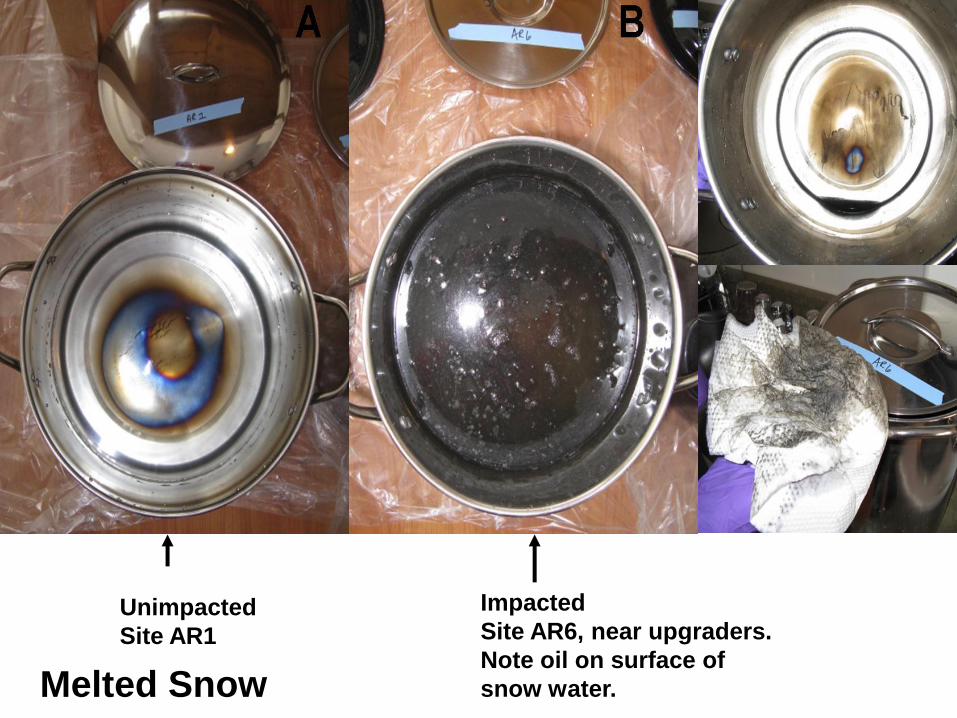
Unimpacted
Site AR1
Impacted
Site AR6, near upgraders.
Note oil on surface of
snow water.Melted Snow
226 km
4 21 6 2 3 20 24 43 26 49 28
1
6
18
12 8
32
38
74 km
38 6
25
23
1110
20
17
12 14 12
8
25
9
14
10 2146
5218
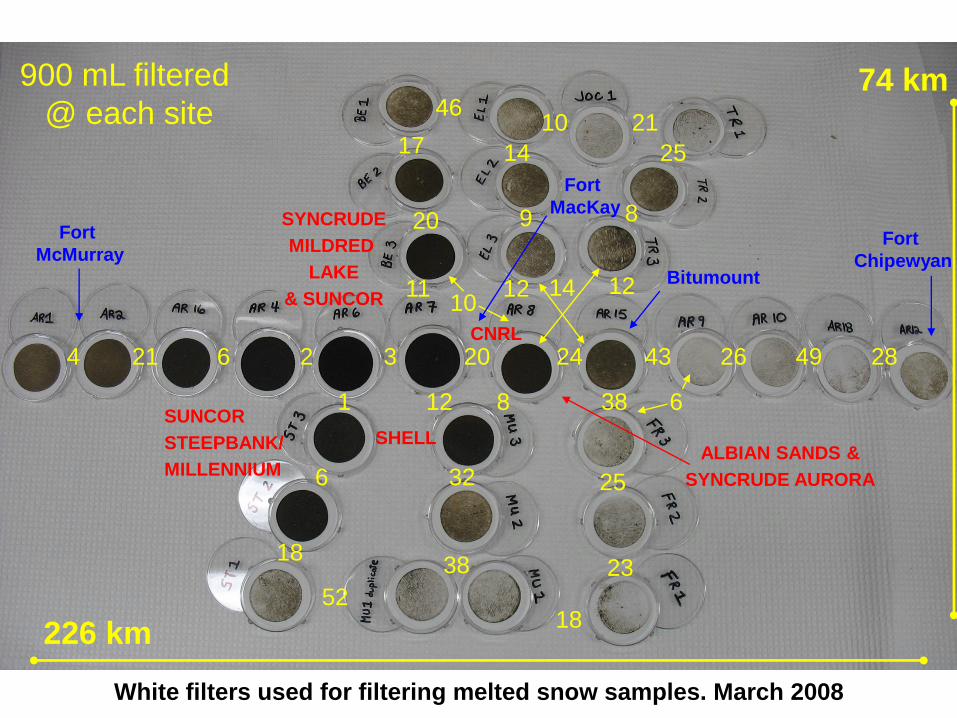
900 mL filtered
@ each site
Fort
McMurrayFort
Chipewyan
SYNCRUDE
MILDRED
LAKE
& SUNCOR
ALBIAN SANDS &
SYNCRUDE AURORA
CNRL
SUNCOR
STEEPBANK/
MILLENNIUM
SHELL
Bitumount
Fort
MacKay
White filters used for filtering melted snow samples. March 2008
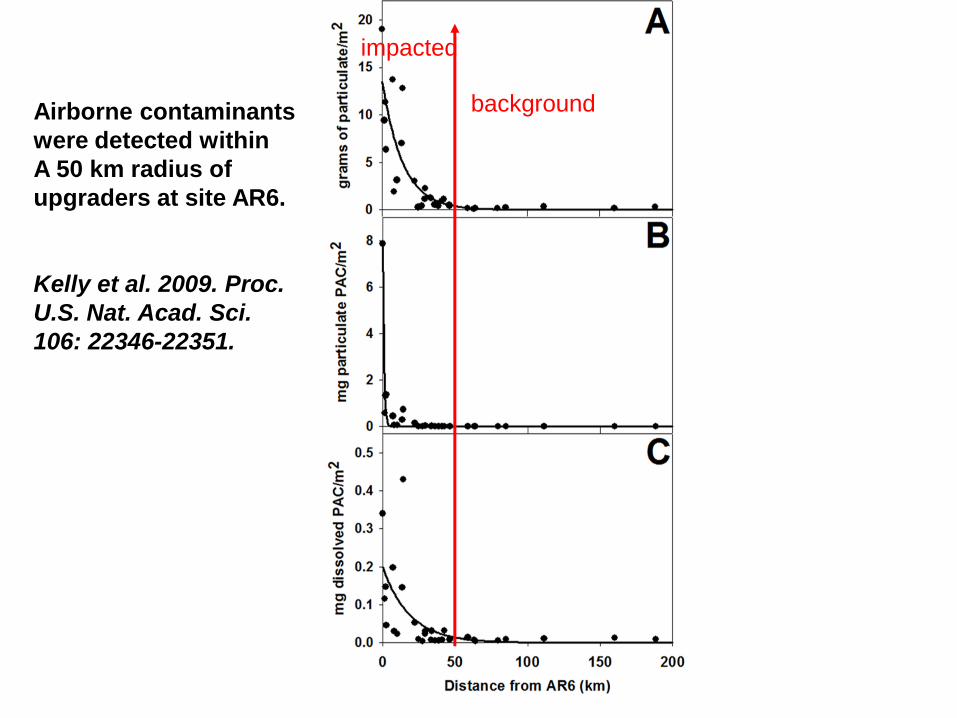
Airborne contaminants
were detected within
A 50 km radius of
upgraders at site AR6.
Kelly et al. 2009. Proc.
U.S. Nat. Acad. Sci.
106: 22346-22351.
impacted
background
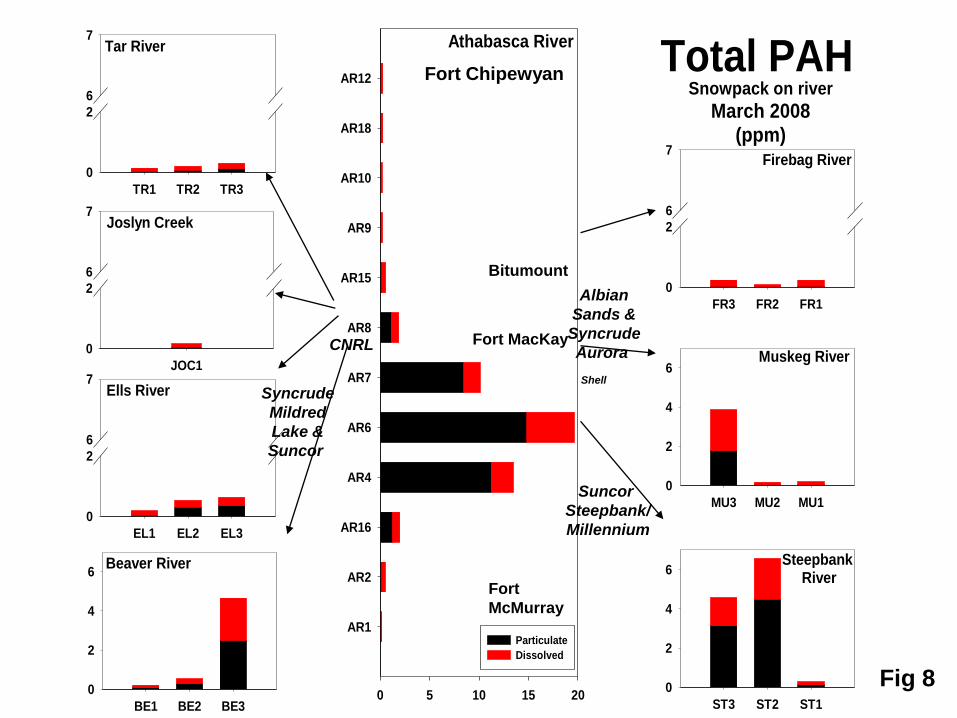
Total PAH
0 5 10 15 20
AR1
AR2
AR16
AR4
AR6
AR7
AR8
AR15
AR9
AR10
AR18
AR12
Particulate
Dissolved
Athabasca River
Beaver River
BE1 BE2 BE3
0
2
4
6
Ells River
EL1 EL2 EL3
0
2
6
7
Tar River
TR1 TR2 TR3
0
2
6
7
Joslyn Creek
JOC1
0
2
6
7
Steepbank River
ST3 ST2 ST1
0
2
4
6
Muskeg River
MU3 MU2 MU1
0
2
4
6
Firebag River
FR3 FR2 FR1
0
2
6
7
Snowpack on river
March 2008(ppm)
Fort
McMurray
Fort Chipewyan
Fort MacKay
Bitumount
Suncor
Steepbank/
Millennium
Syncrude
Mildred
Lake &
Suncor
Albian
Sands &
Syncrude
Aurora
Shell
CNRL
Fig 8
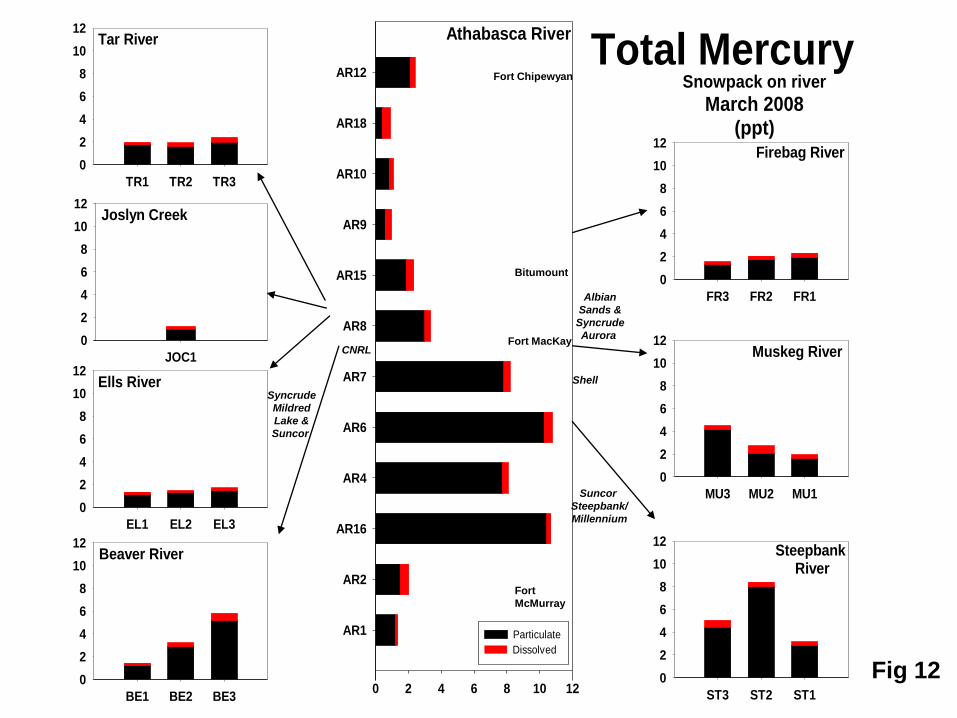
Total Mercury
0 2 4 6 8 10 12
AR1
AR2
AR16
AR4
AR6
AR7
AR8
AR15
AR9
AR10
AR18
AR12
Athabasca River
Beaver River
BE1 BE2 BE3
0
2
4
6
8
10
12
Ells River
EL1 EL2 EL3
0
2
4
6
8
10
12
Tar River
TR1 TR2 TR3
0
2
4
6
8
10
12
Joslyn Creek
JOC1
0
2
4
6
8
10
12
Steepbank River
ST3 ST2 ST1
0
2
4
6
8
10
12
Muskeg River
MU3 MU2 MU1
0
2
4
6
8
10
12
Firebag River
FR3 FR2 FR1
0
2
4
6
8
10
12
Snowpack on river
March 2008(ppt)
Particulate
Dissolved
Fort
McMurray
Fort Chipewyan
Fort MacKay
Bitumount
Suncor
Steepbank/
Millennium
Syncrude
Mildred
Lake &
Suncor
Albian
Sands &
Syncrude
Aurora
Shell
CNRL
Fig 12
Ar
se
nic
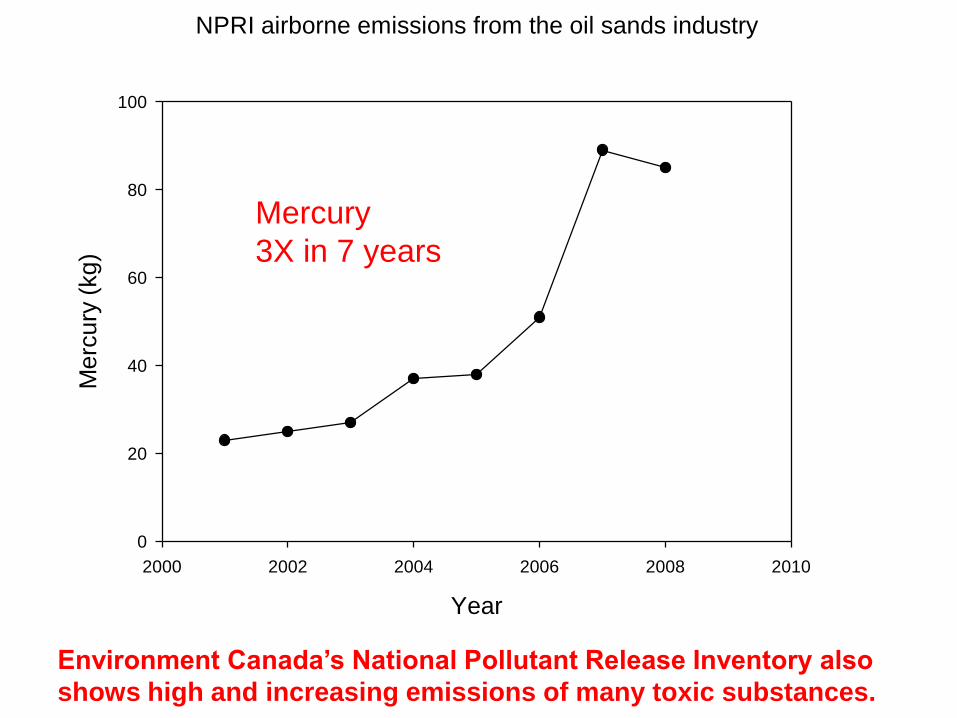
Environment Canada’s National Pollutant Release Inventory also
shows high and increasing emissions of many toxic substances.
3X increase in 4 years
NPRI airborne emissions from the oil sands industry
Year
2000 2002 2004 2006 2008 2010
Me
rcu
ry (
kg
)
0
20
40
60
80
100
Mercury
3X in 7 years
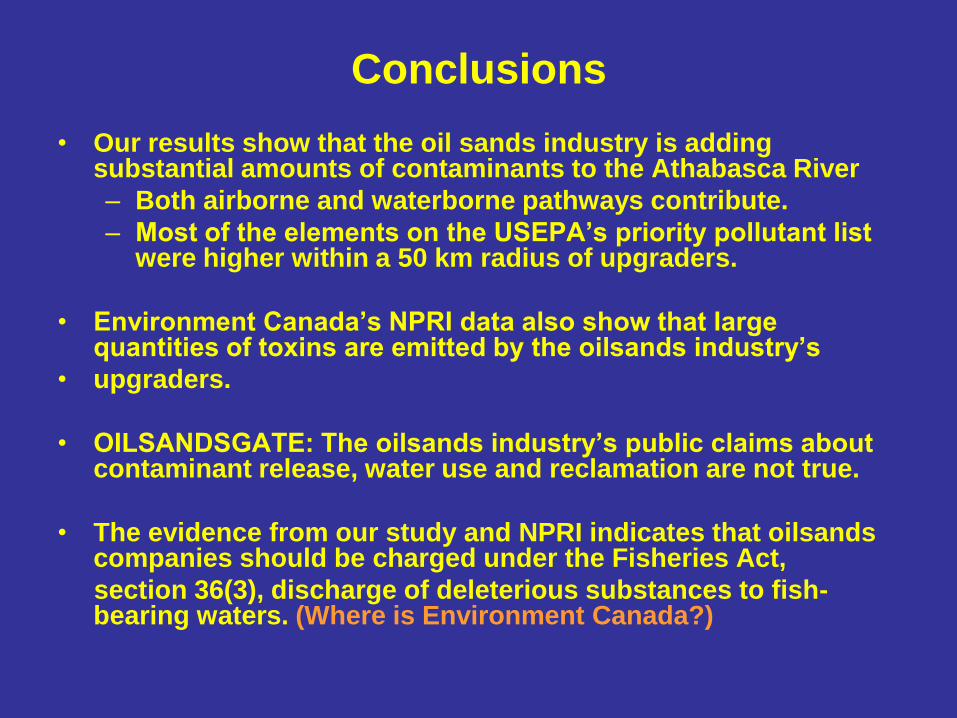
Conclusions
• Our results show that the oil sands industry is adding substantial amounts of contaminants to the Athabasca River
– Both airborne and waterborne pathways contribute.
– Most of the elements on the USEPA’s priority pollutant list were higher within a 50 km radius of upgraders.
• Environment Canada’s NPRI data also show that large quantities of toxins are emitted by the oilsands industry’s
• upgraders.
• OILSANDSGATE: The oilsands industry’s public claims about contaminant release, water use and reclamation are not true.
• The evidence from our study and NPRI indicates that oilsands companies should be charged under the Fisheries Act,
section 36(3), discharge of deleterious substances to fish-bearing waters. (Where is Environment Canada?)
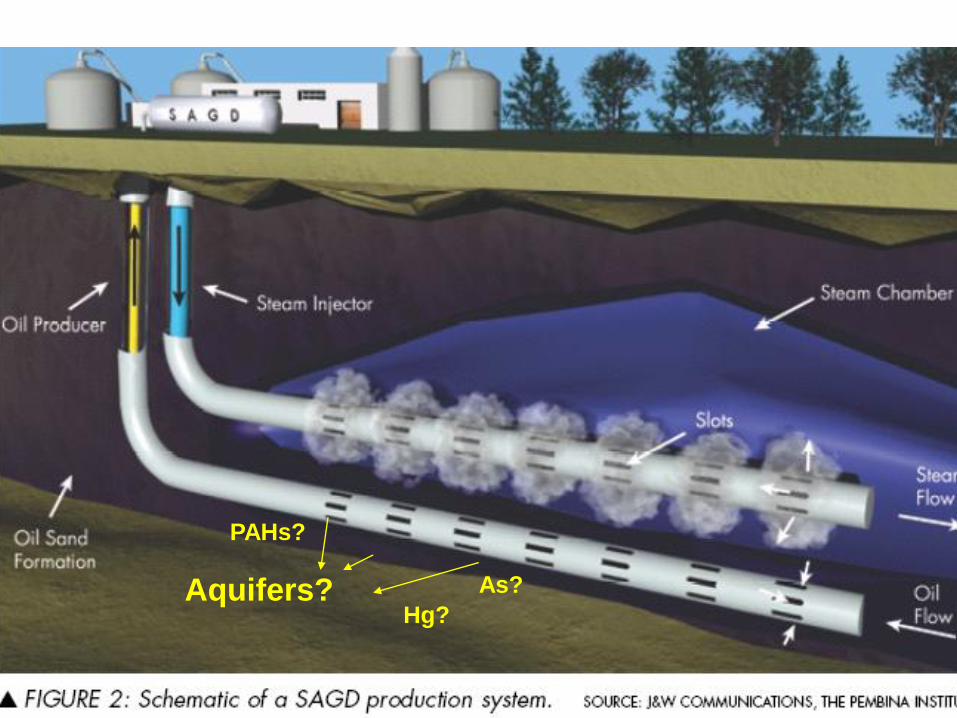
Aquifers?
PAHs?
As?
Hg?
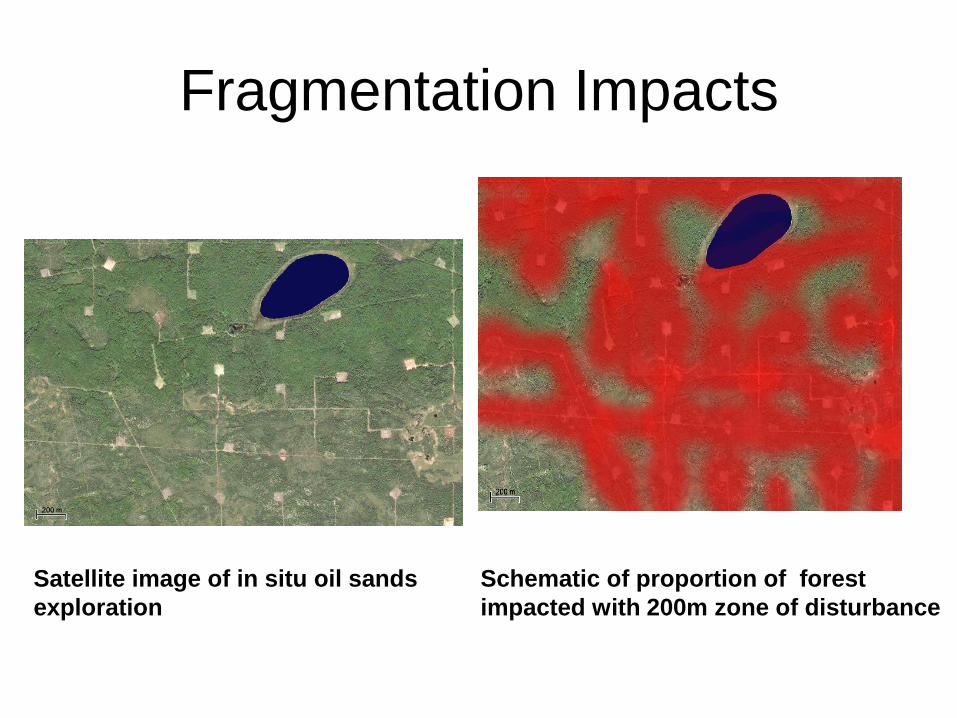
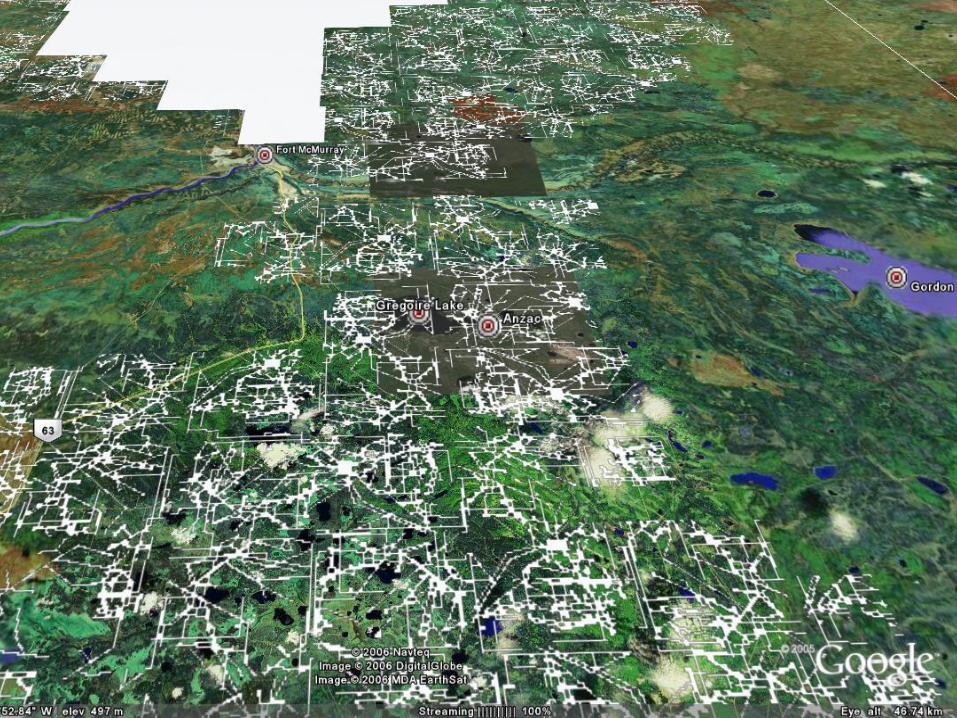
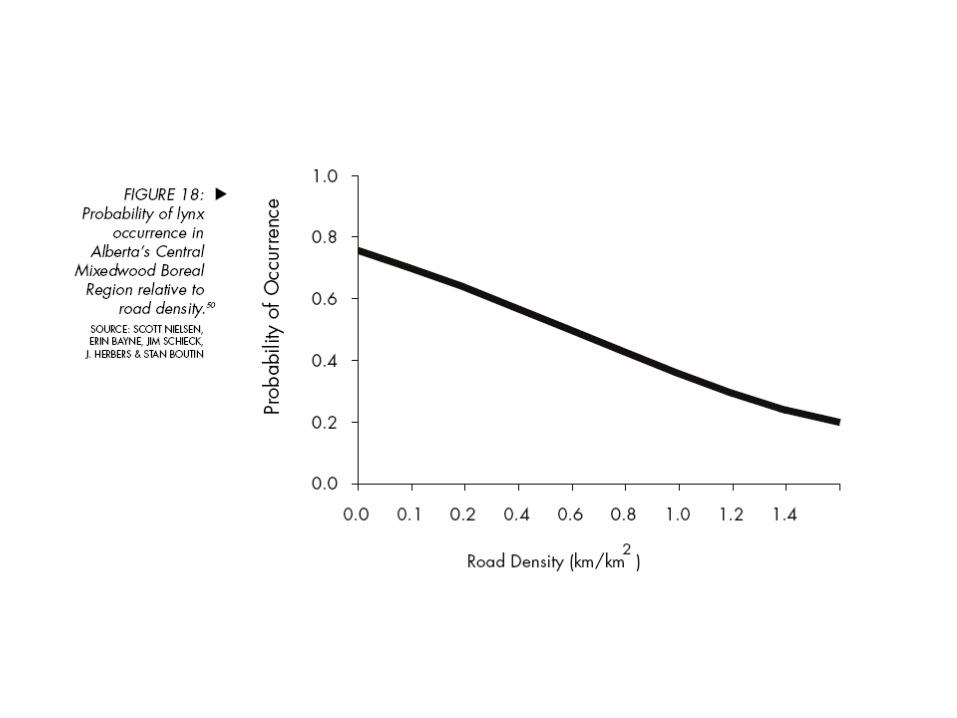
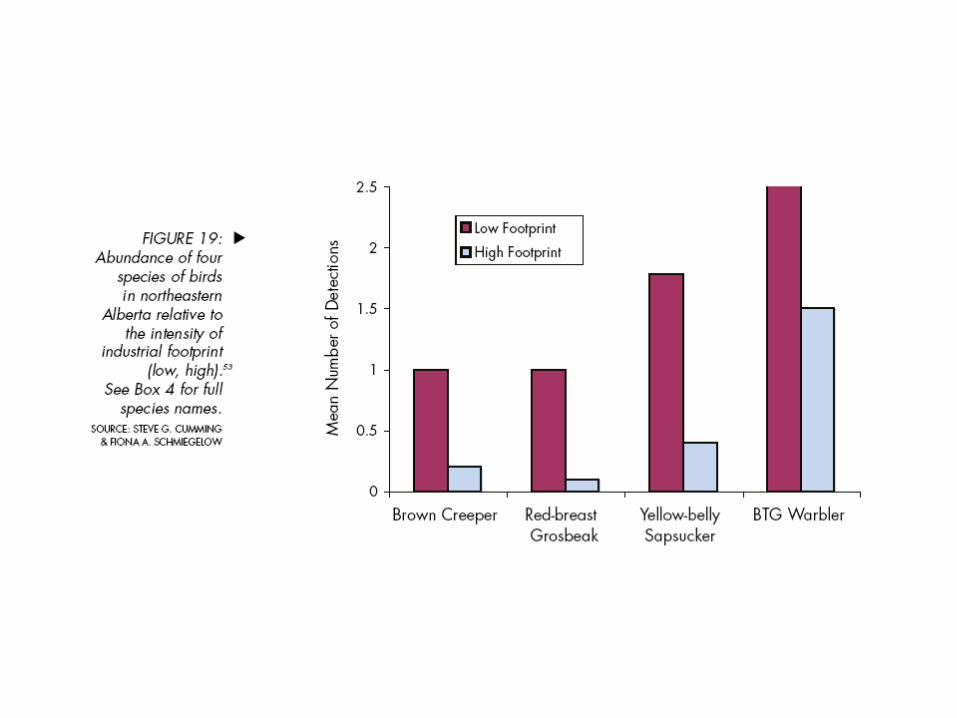
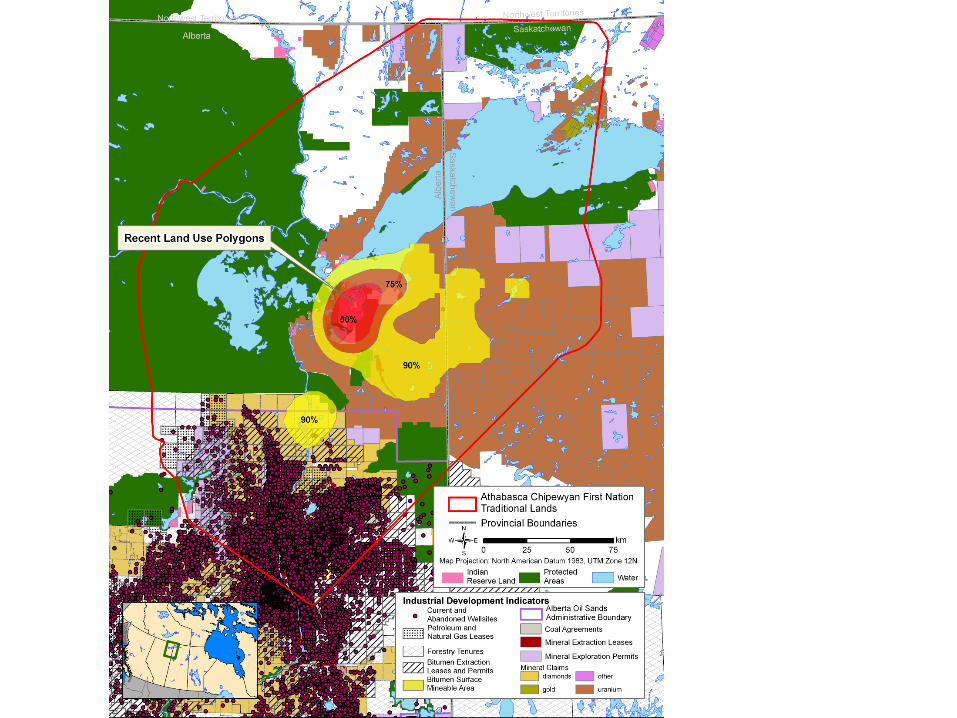
Fragmentation Impacts
Satellite image of in situ oil sands
exploration
Schematic of proportion of forest
impacted with 200m zone of disturbance
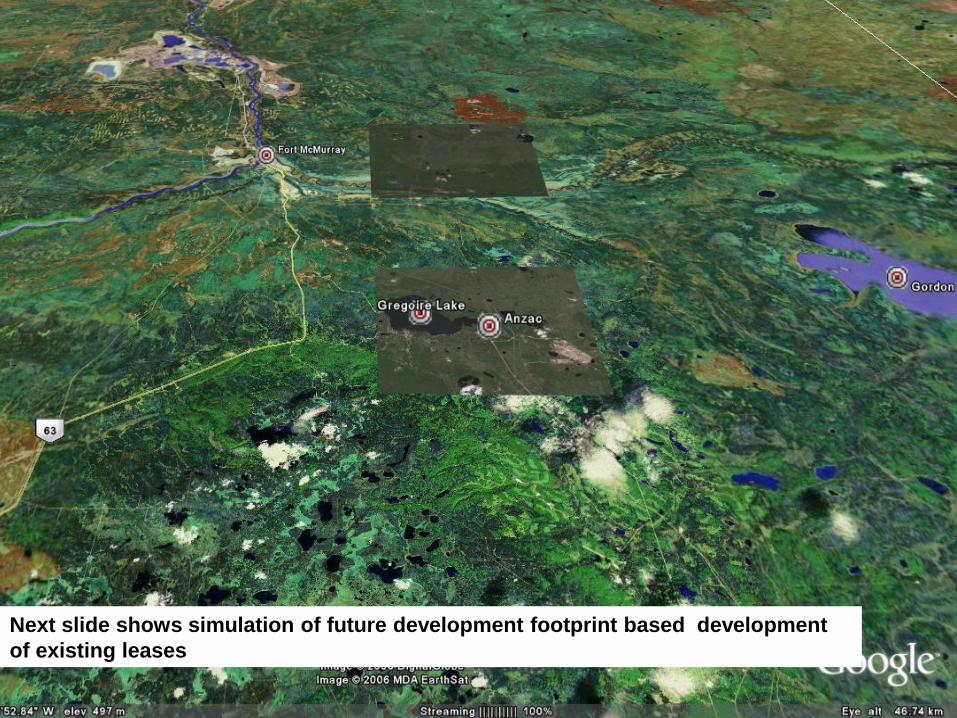
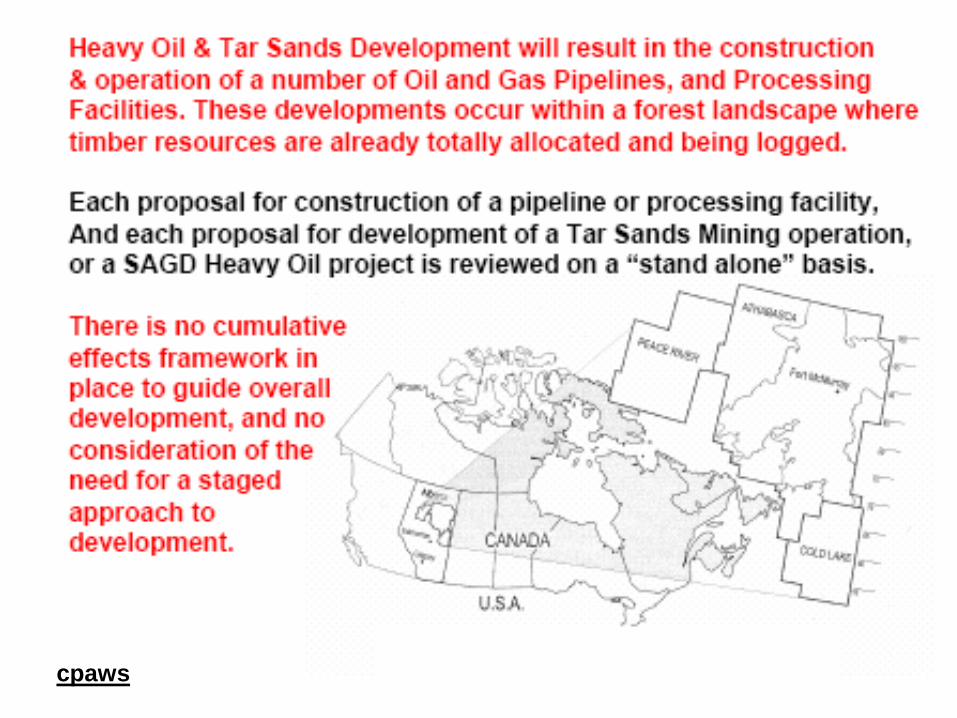
Next slide shows simulation of future development footprint based development
of existing leases
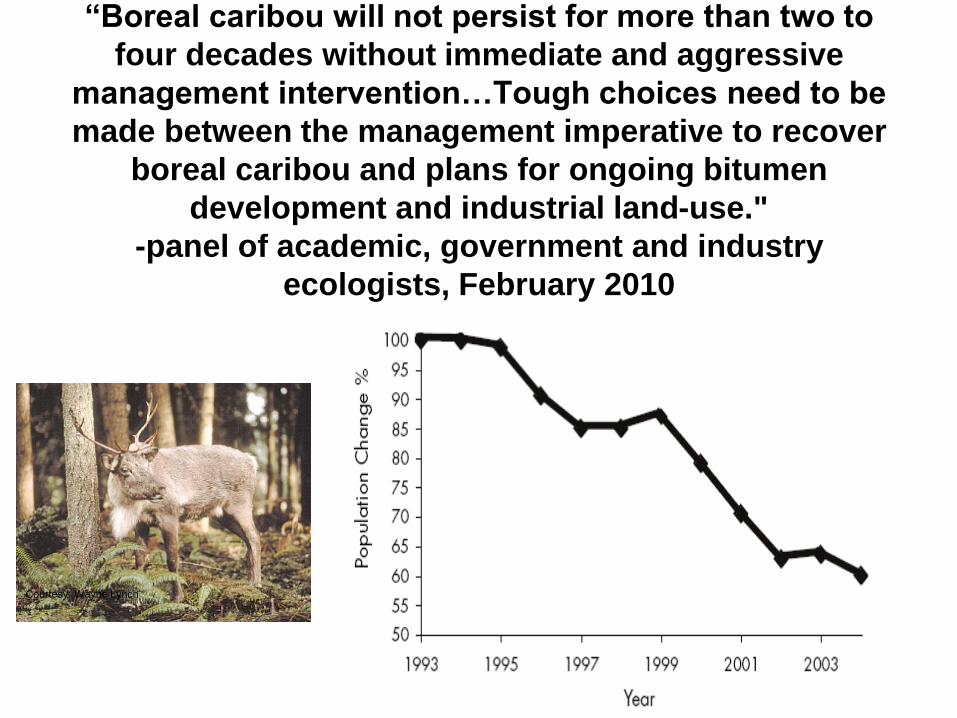
“Boreal caribou will not persist for more than two to
four decades without immediate and aggressive
management intervention…Tough choices need to be
made between the management imperative to recover
boreal caribou and plans for ongoing bitumen
development and industrial land-use."
-panel of academic, government and industry
ecologists, February 2010
Courtesy: Wayne Lynch
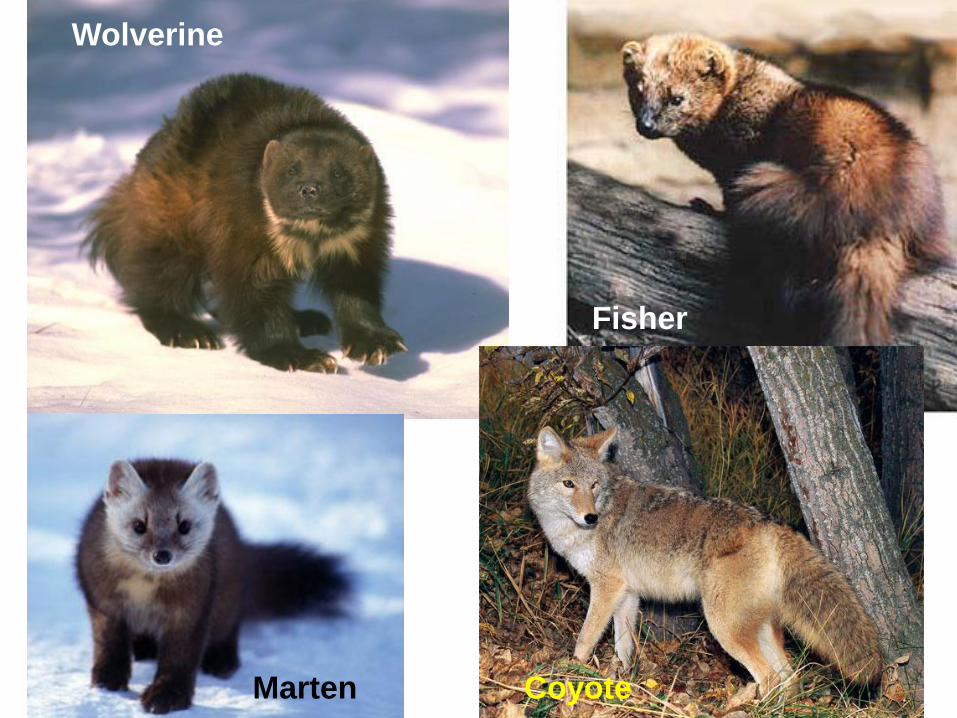
Wolverine
Marten
Fisher
Coyote

cpaws