Embed Size (px)
Citation preview
Aggregate expenditures & aggregate demand
Chapters 10 and 11
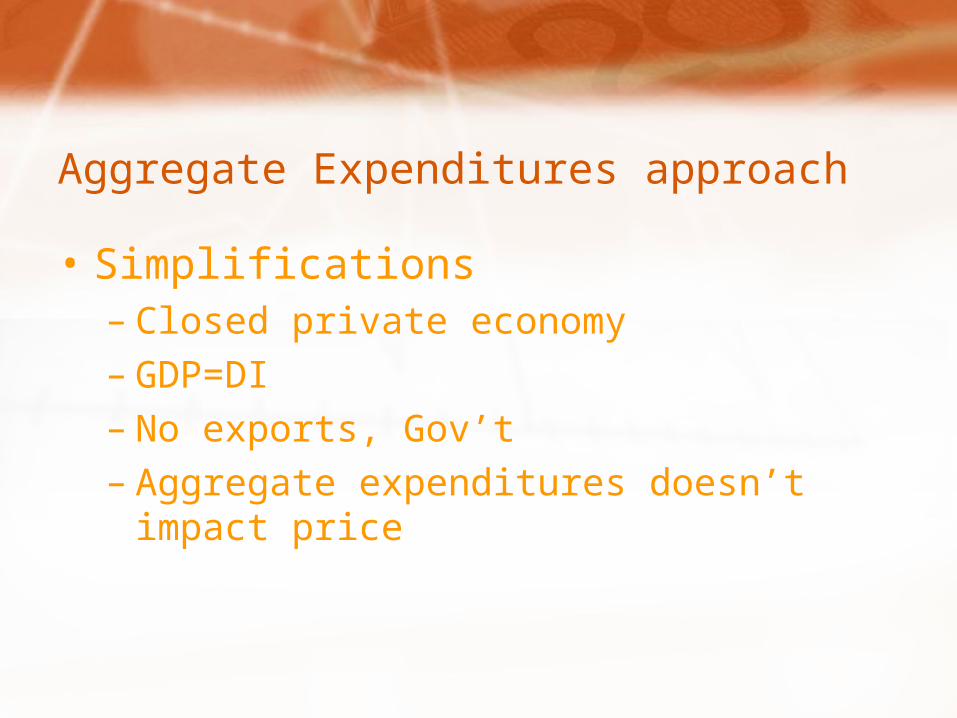
Aggregate Expenditures approach
• Simplifications– Closed private economy– GDP=DI– No exports, Gov’t– Aggregate expenditures doesn’t impact price
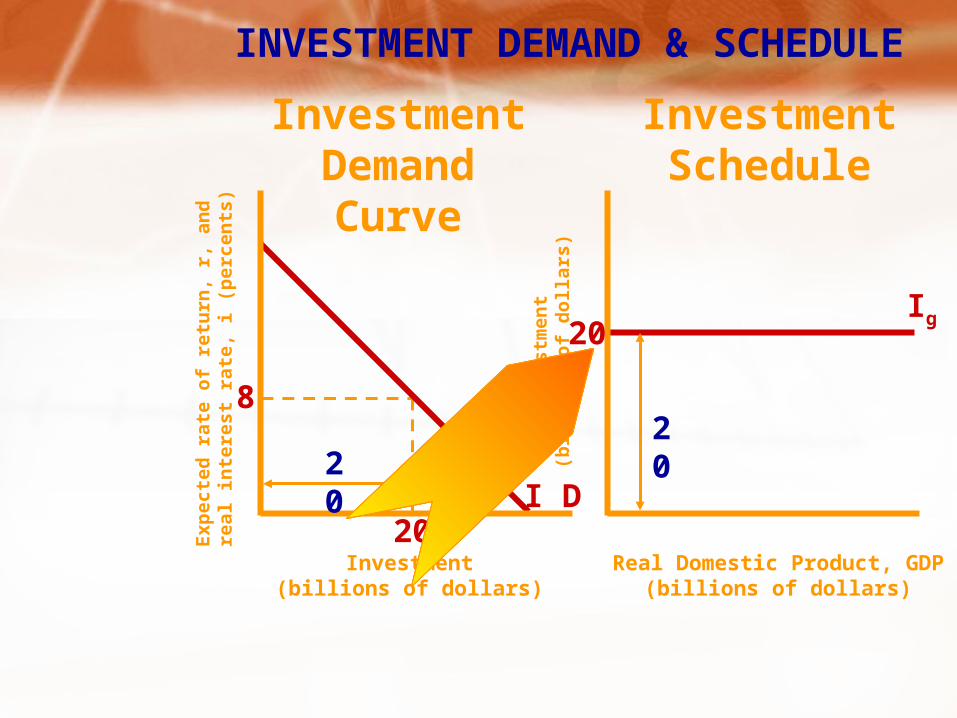
INVESTMENT DEMAND & SCHEDULE
Exp
ecte
d r
ate
of
retu
rn,
r, a
nd
real
in
tere
st r
ate,
i (
per
cen
ts)
Inve
stm
ent
(bil
lio
ns
of
do
lla
rs)
Investment(billions of dollars)
20
8
20
Real Domestic Product, GDP(billions of dollars)
I D
Ig
InvestmentDemandCurve
InvestmentSchedule
2020
Pri
vate
sp
end
ing
, C +
I g
(bill
ion
s o
f d
olla
rs)
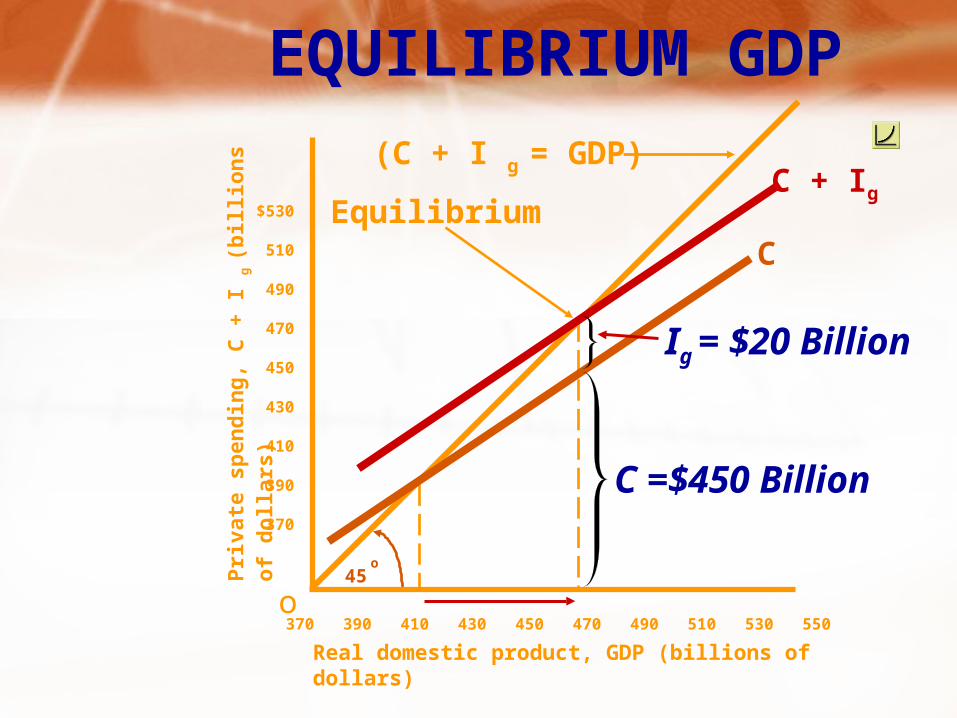
o45
o
C
C + Ig
Ig = $20 Billion
Equilibrium
Real domestic product, GDP (billions of dollars)
370 390 410 430 450 470 490 510 530 550
(C + I g = GDP)
EQUILIBRIUM GDP
C =$450 Billion
$530
510
490
470
450
430
410
390
370
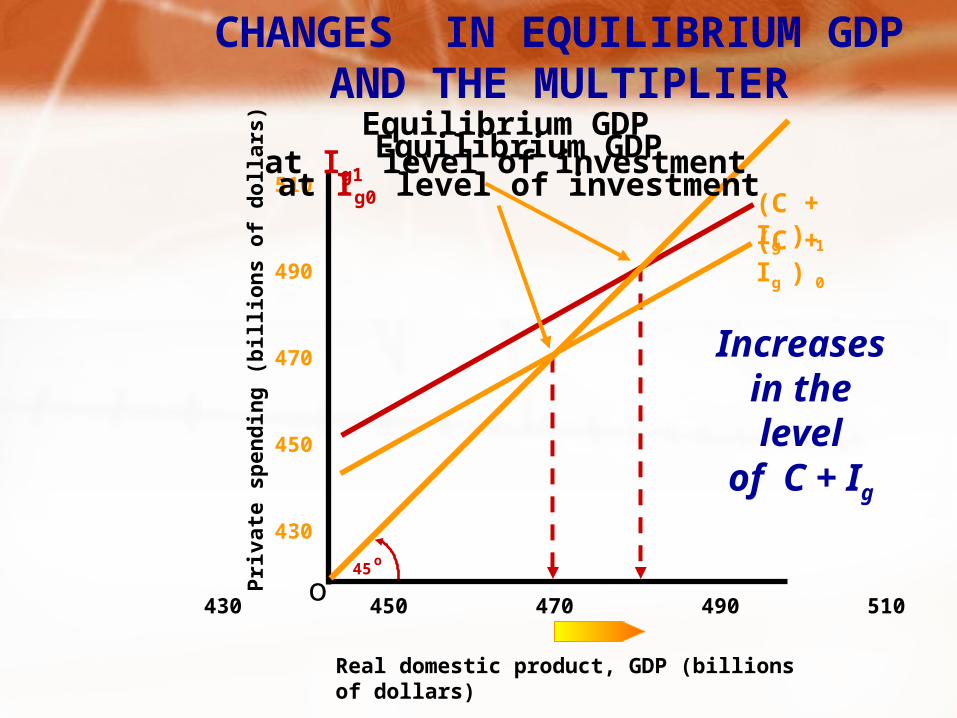
CHANGES IN EQUILIBRIUM GDPAND THE MULTIPLIER
Pri
vate
sp
end
ing
(b
illio
ns
of
do
llars
)
o45
o
Real domestic product, GDP (billions of dollars)
510
490
470
450
430
430 450 470 490 510
(C + Ig ) 0
(C + Ig ) 1
Equilibrium GDPat Ig0 level of investment
Equilibrium GDPat Ig1 level of investment
Increasesin the levelof C + Ig
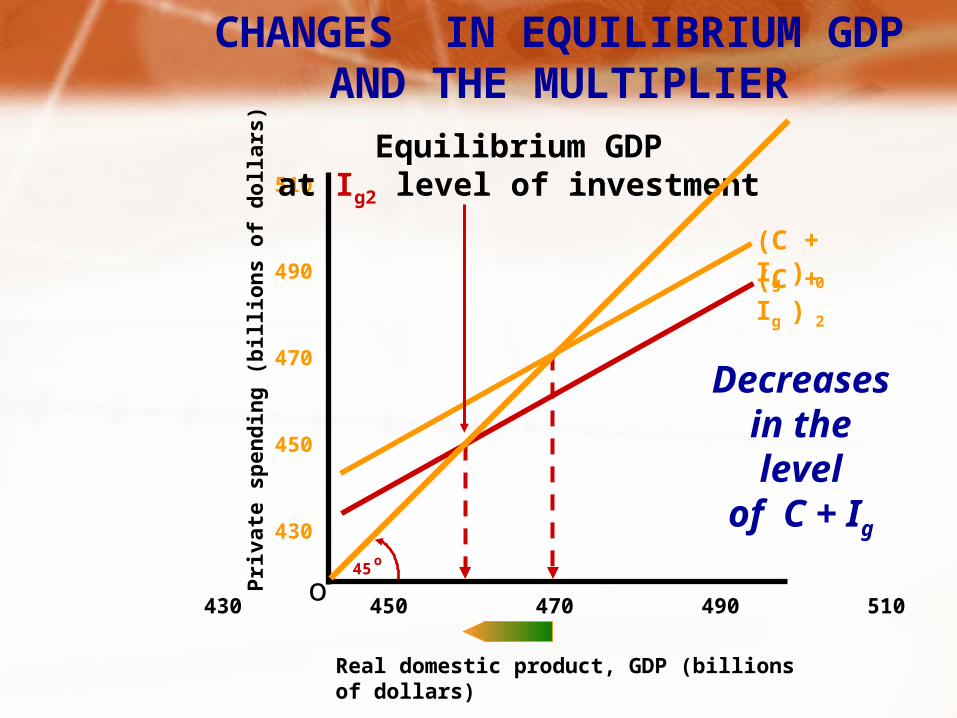
CHANGES IN EQUILIBRIUM GDPAND THE MULTIPLIER
Pri
vate
sp
end
ing
(b
illio
ns
of
do
llars
)
o45
o
Real domestic product, GDP (billions of dollars)
510
490
470
450
430
430 450 470 490 510
Equilibrium GDPat Ig2 level of investment
(C + Ig ) 0
(C + Ig ) 2
Decreasesin the levelof C + Ig
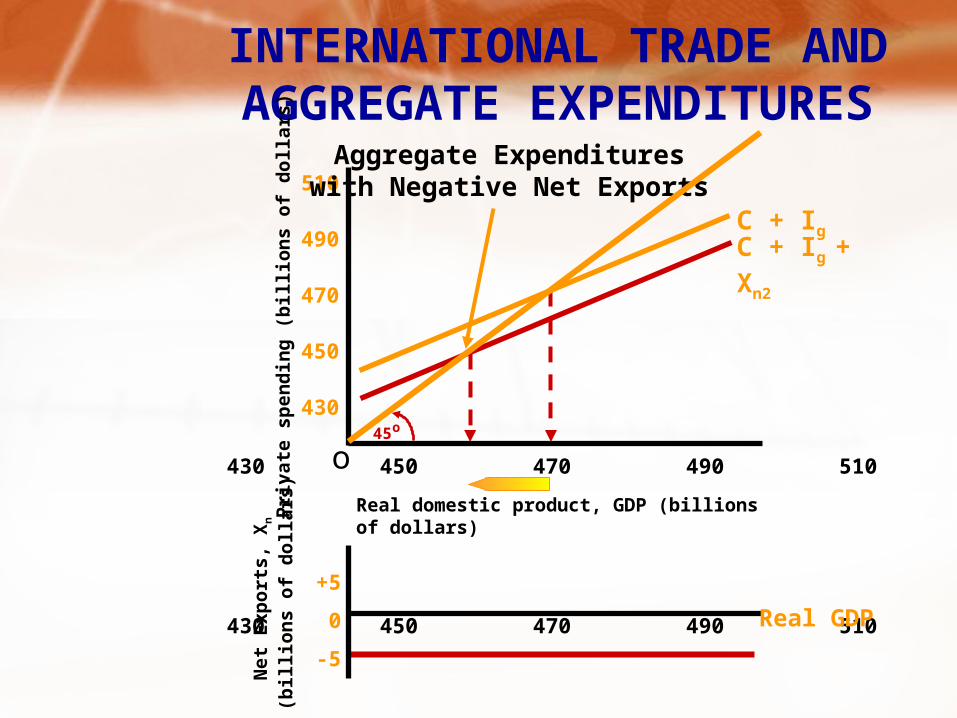
INTERNATIONAL TRADE AND AGGREGATE EXPENDITURES
Pri
vate
sp
end
ing
(b
illi
on
s o
f d
oll
ars)
o45o
Real domestic product, GDP (billions of dollars)
510
490
470
450
430
430 450 470 490 510
Aggregate Expenditureswith Negative Net Exports
C + Ig C + Ig + Xn2
Net
Exp
ort
s, X
n
(bil
lio
ns
of
do
lla
rs)
+5
0
-5
430 450 470 490 510 Real GDP
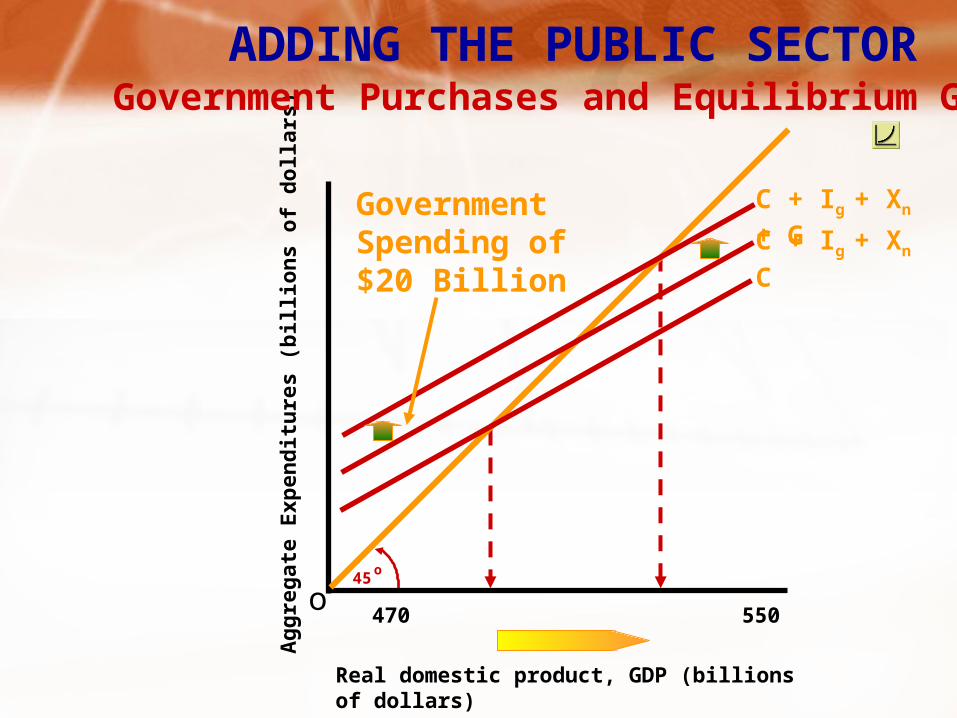
ADDING THE PUBLIC SECTOR
Ag
gre
gat
e E
xpen
dit
ure
s (b
illio
ns
of
do
llars
)
o45
o
Real domestic product, GDP (billions of dollars)
470 550
C
C + Ig + Xn
C + Ig + Xn + GGovernmentSpending of$20 Billion
Government Purchases and Equilibrium GDP
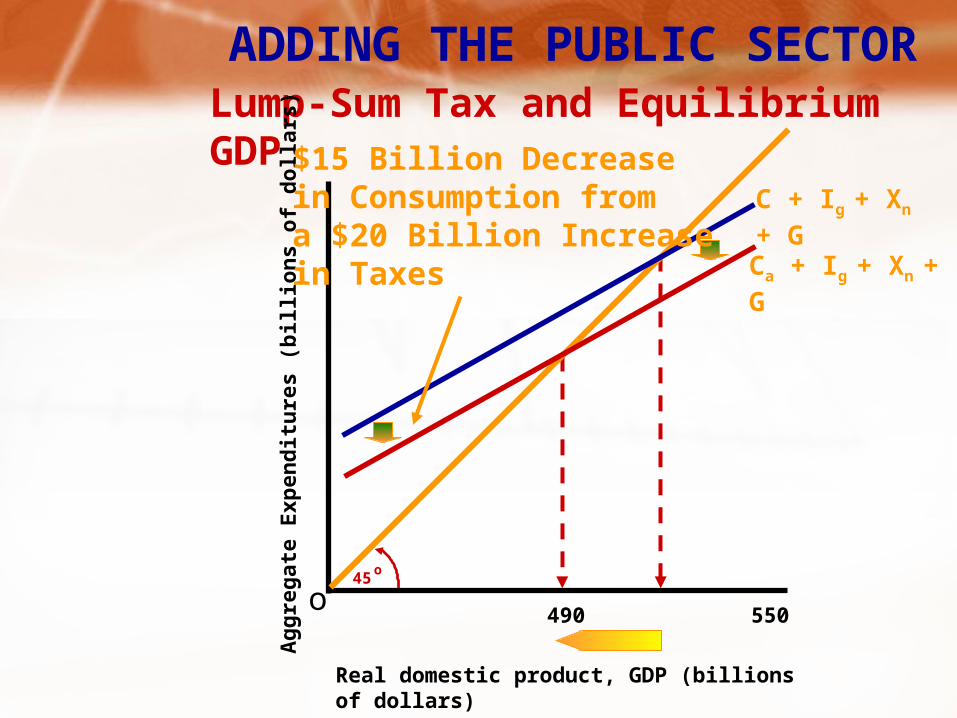
ADDING THE PUBLIC SECTORLump-Sum Tax and Equilibrium GDP
Ag
gre
gat
e E
xpen
dit
ure
s (b
illio
ns
of
do
llars
)
o45
o
Real domestic product, GDP (billions of dollars)
490 550
C + Ig + Xn + G
Ca + Ig + Xn + G
$15 Billion Decreasein Consumption froma $20 Billion Increasein Taxes
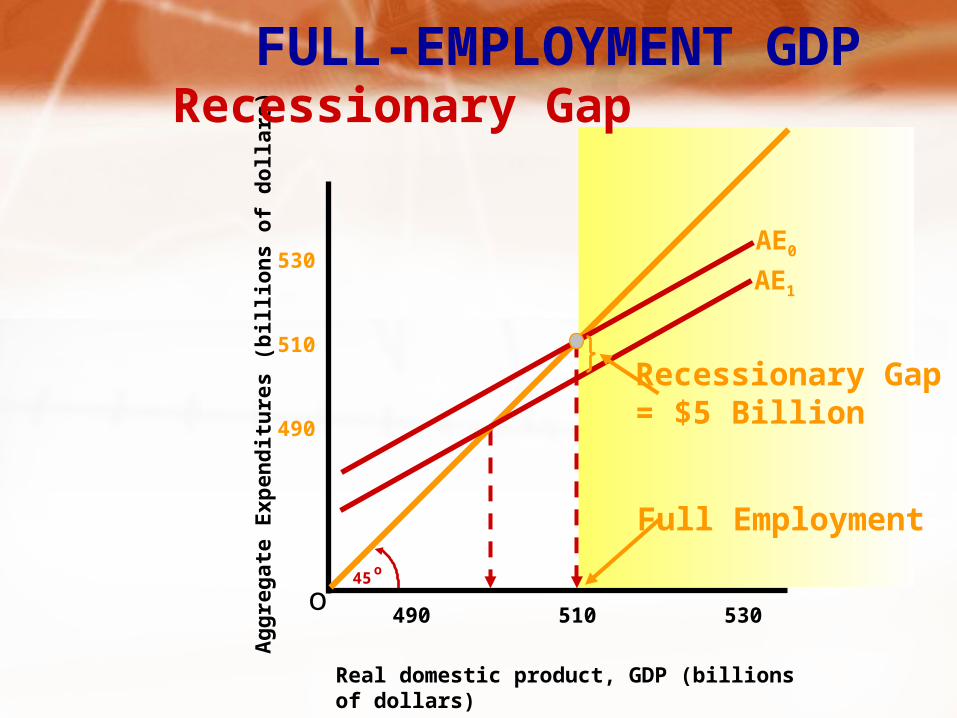
FULL-EMPLOYMENT GDP
Ag
gre
gat
e E
xpen
dit
ure
s (b
illio
ns
of
do
llars
)
o45
o
Real domestic product, GDP (billions of dollars)
490 510 530
AE0
Recessionary Gap
AE1
530
510
490
Recessionary Gap= $5 Billion
Full Employment
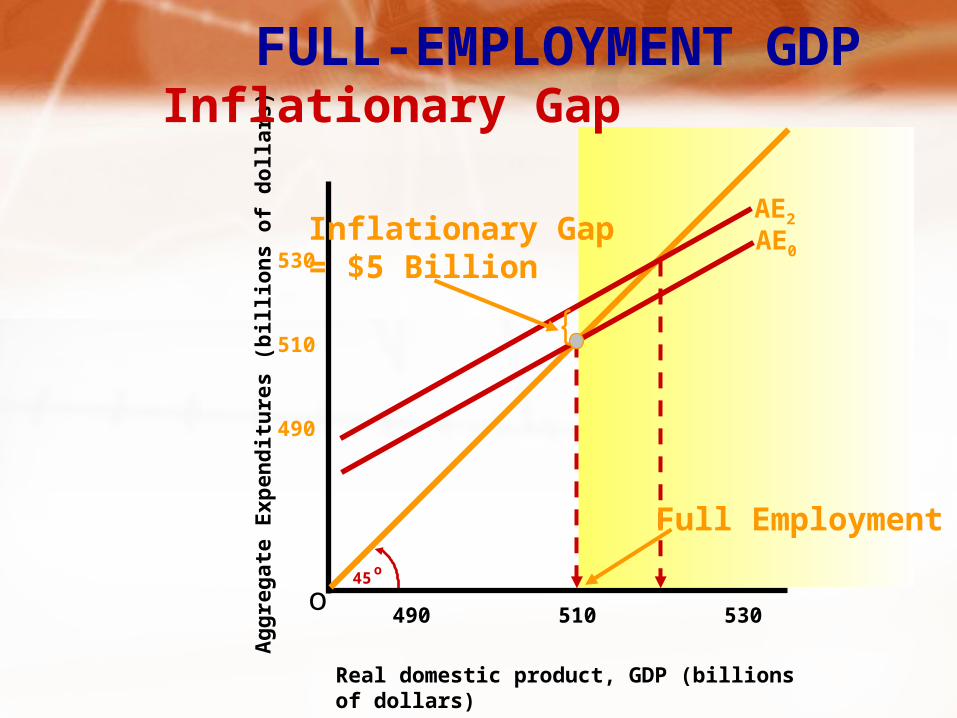
FULL-EMPLOYMENT GDP
Ag
gre
gat
e E
xpen
dit
ure
s (b
illio
ns
of
do
llars
)
o45
o
Real domestic product, GDP (billions of dollars)
490 510 530
AE0
Inflationary Gap
AE2
530
510
490
Inflationary Gap= $5 Billion
Full Employment
PROBLEMS WITH AGGREGATE EXPENDITURES APPROACH
• Does Not Show Price-Level Changes• Ignores Premature Demand-Pull Inflation• Limited Real GDP to the Full-Employment
Level• Does not Deal with Cost-Push Inflation• Does not Allow for “Self-correction”
Defined: •Amounts of Real Output•Buyers Collectively Desire •At Each Possible Price Level
AGGREGATE DEMAND
Aggregate Demand CurveDown Sloping Due To:
•Real-Balances Effect•Interest-Rate Effect•Foreign Purchases Effect
Graphically…
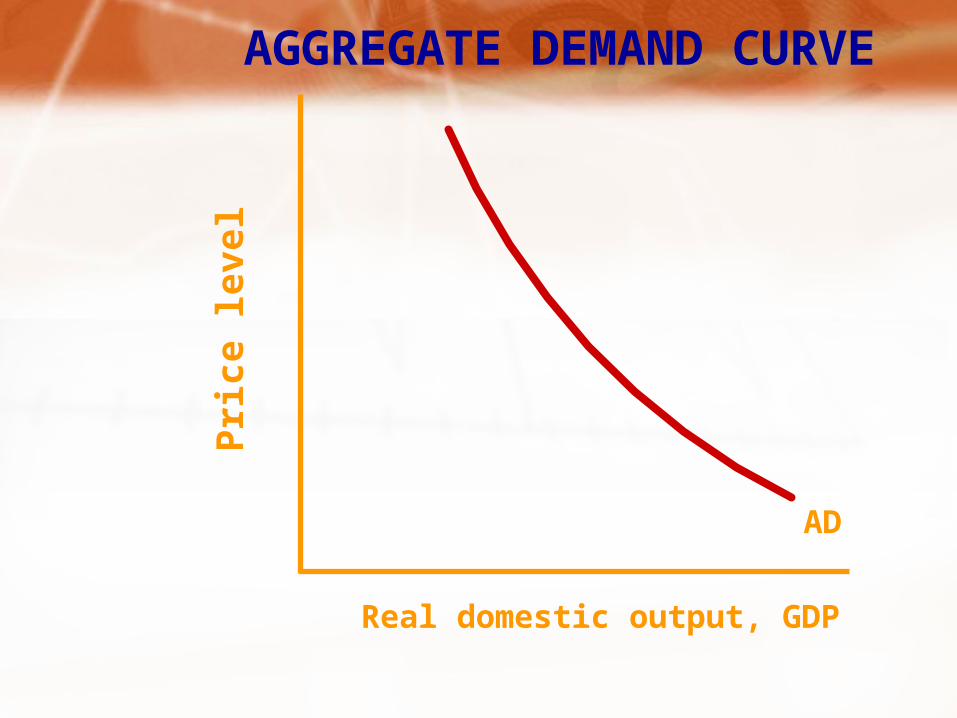
AGGREGATE DEMAND CURVE
Pri
ce le
vel
Real domestic output, GDP
AD
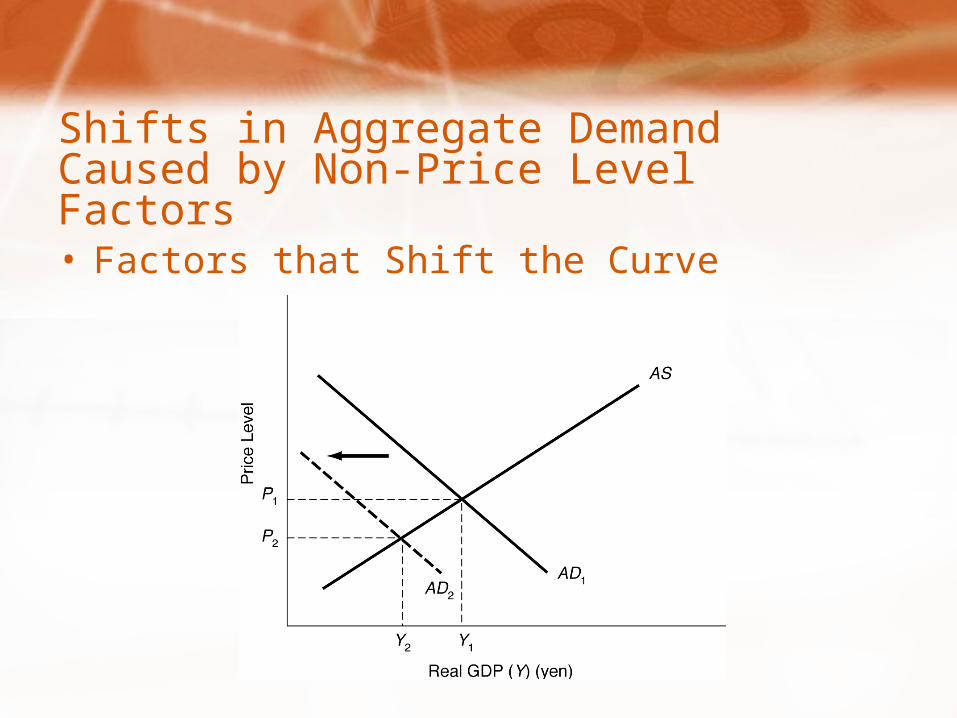
Shifts in Aggregate Demand Caused by Non-Price Level Factors
• Factors that Shift the Curve

Change in Consumer Spending
• Consumer Wealth• Consumer
Expectations• Household
Indebtedness• Taxes
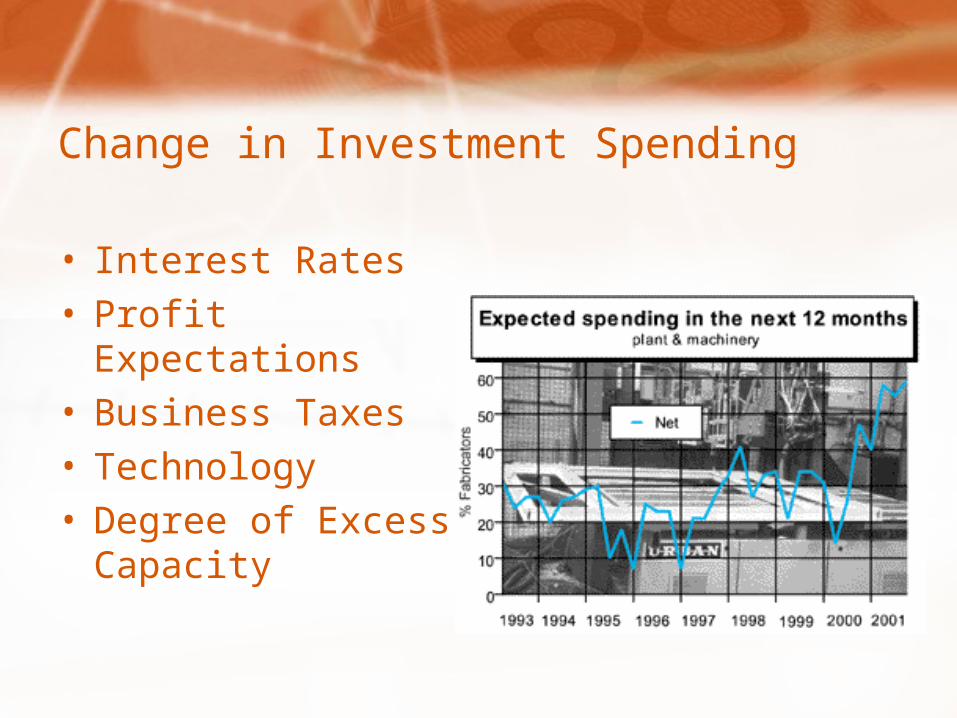
Change in Investment Spending
• Interest Rates• Profit Expectations• Business Taxes• Technology• Degree of Excess
Capacity

Change in Government Spending
• Desire to add or deduct from government supported programs.

Net Export Spending
• Increased exports----Increased AD
• Based on
• 1- national income abroad
• 2-exchange rates
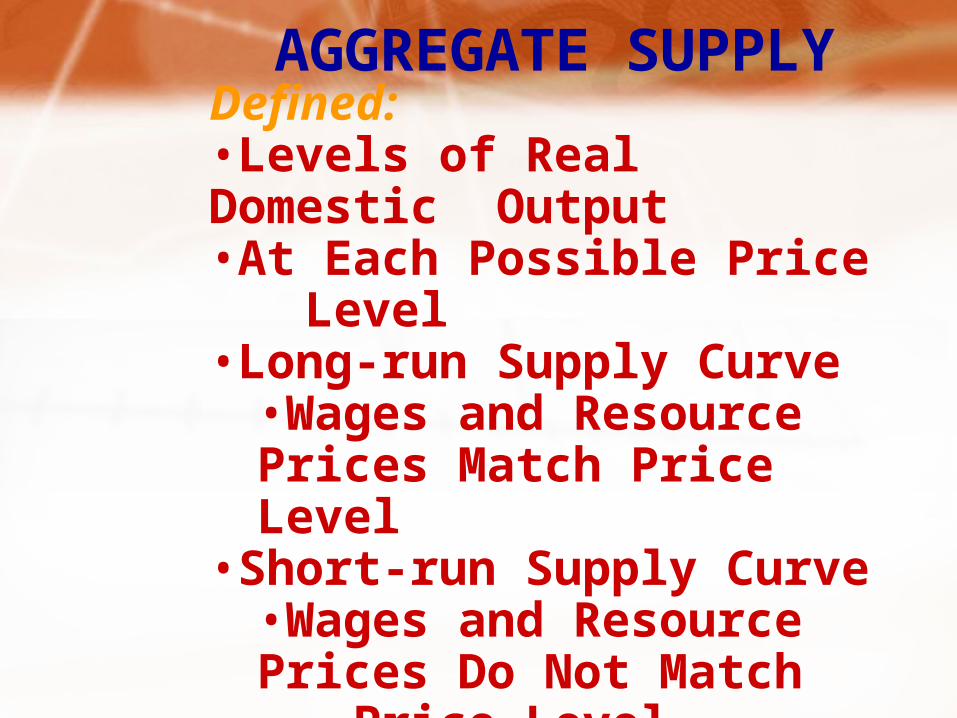
AGGREGATE SUPPLYDefined: •Levels of Real Domestic Output•At Each Possible Price Level•Long-run Supply Curve
•Wages and Resource Prices Match Price Level
•Short-run Supply Curve•Wages and Resource Prices Do Not Match Price Level
AGGREGATE SUPPLY
Pric
e le
vel
Real domestic output, GDPQ
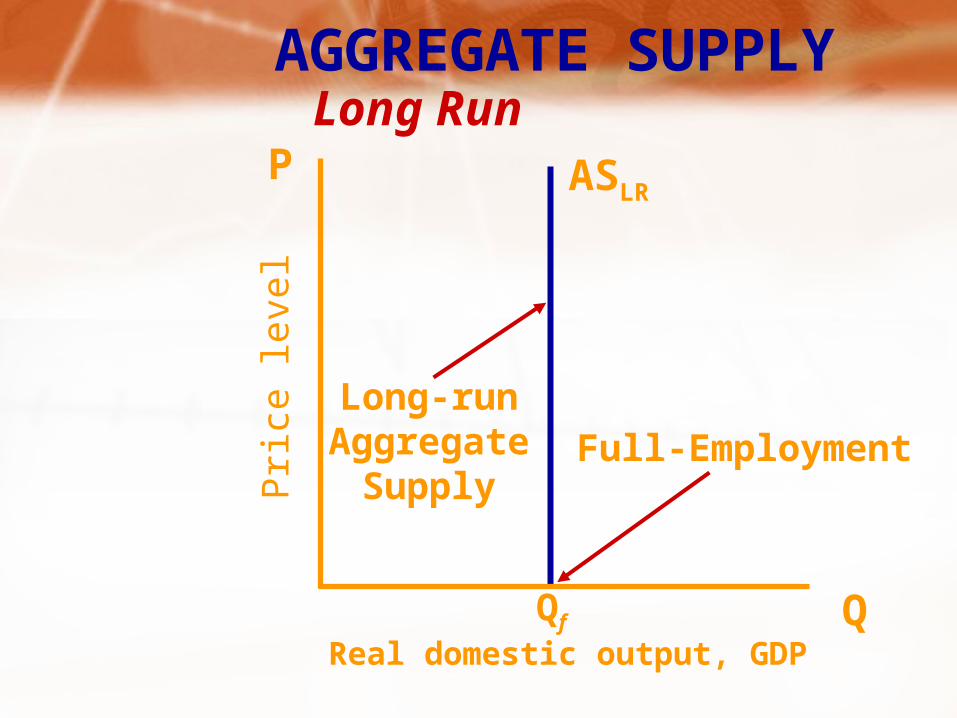
PLong Run
ASLR
Long-runAggregate
Supply
Qf
Full-Employment
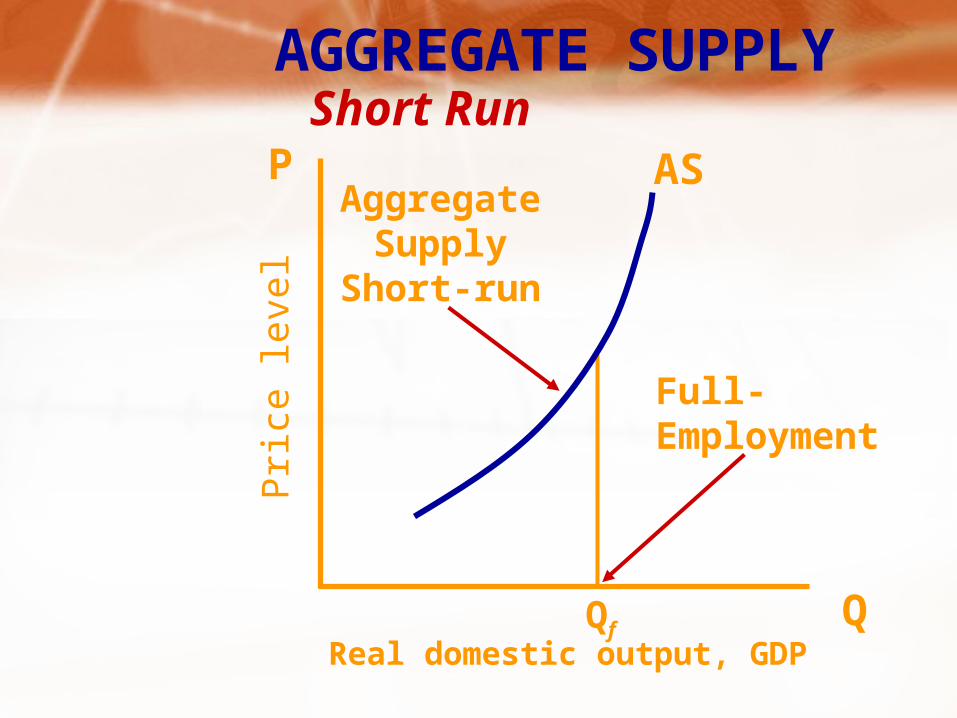
AGGREGATE SUPPLY
Pric
e le
vel
Real domestic output, GDPQ
PShort Run
ASAggregate
SupplyShort-run
Qf
Full-Employment
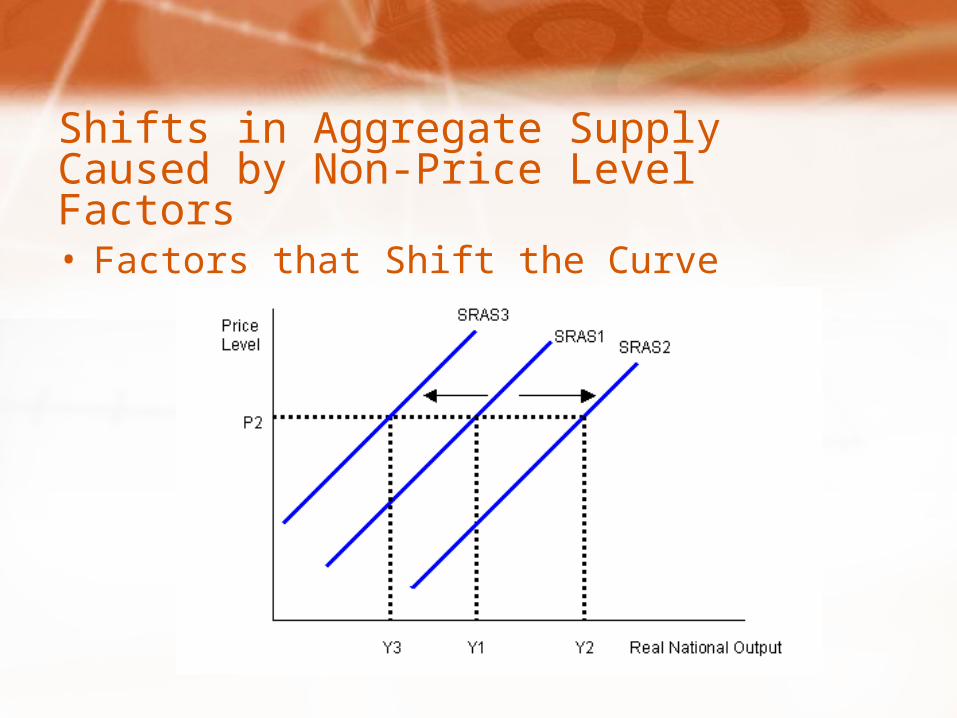
Shifts in Aggregate Supply Caused by Non-Price Level Factors
• Factors that Shift the Curve
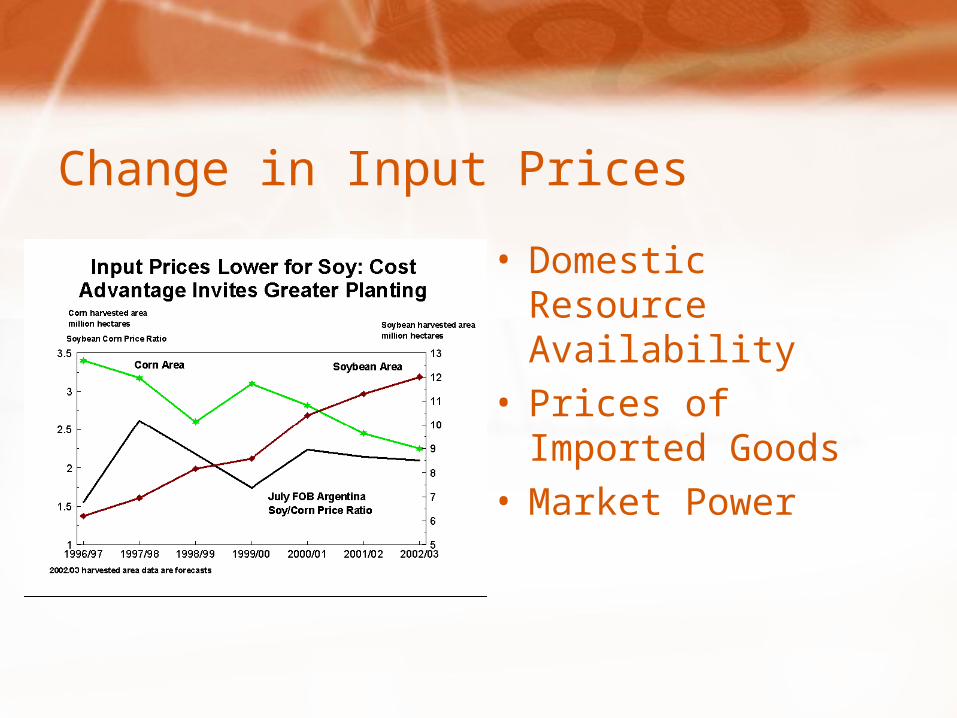
Change in Input Prices
• Domestic Resource Availability
• Prices of Imported Goods
• Market Power

Change in Productivity
• Effect of Training Programs
• Technology Gains

Change in Legal-Institutional Environments
• Business Taxes• Business Subsidies• Government
Regulation
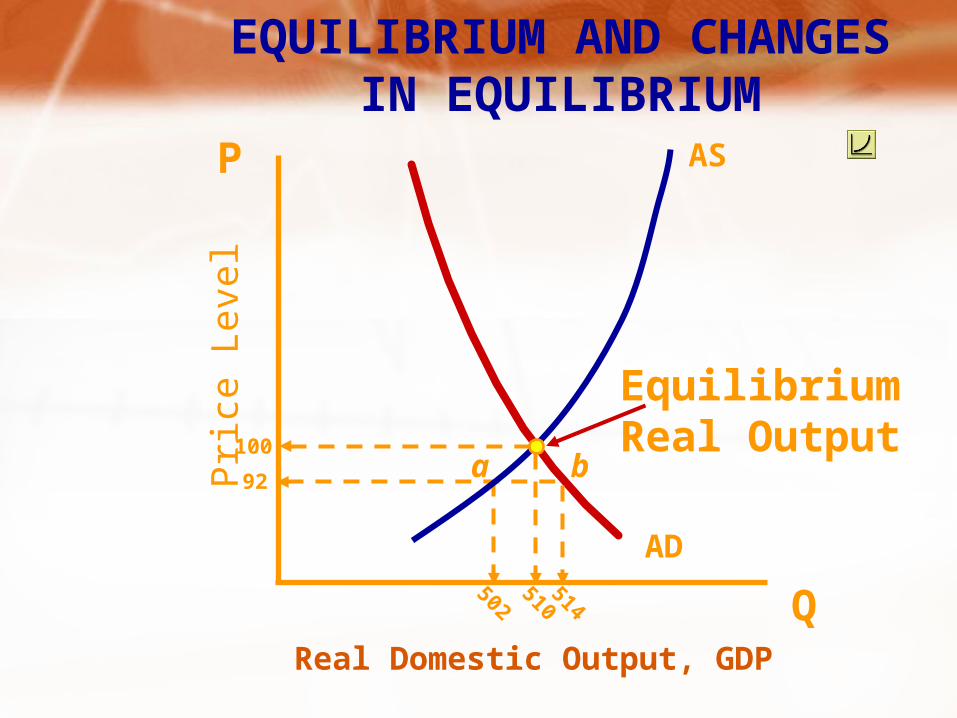
Pric
e Le
vel
Real Domestic Output, GDP
Q
P AS
AD510
502514
EQUILIBRIUM AND CHANGESIN EQUILIBRIUM
92
100a b
EquilibriumReal Output
Pric
e Le
vel
Real Domestic Output, GDP
Q
P ASAD1
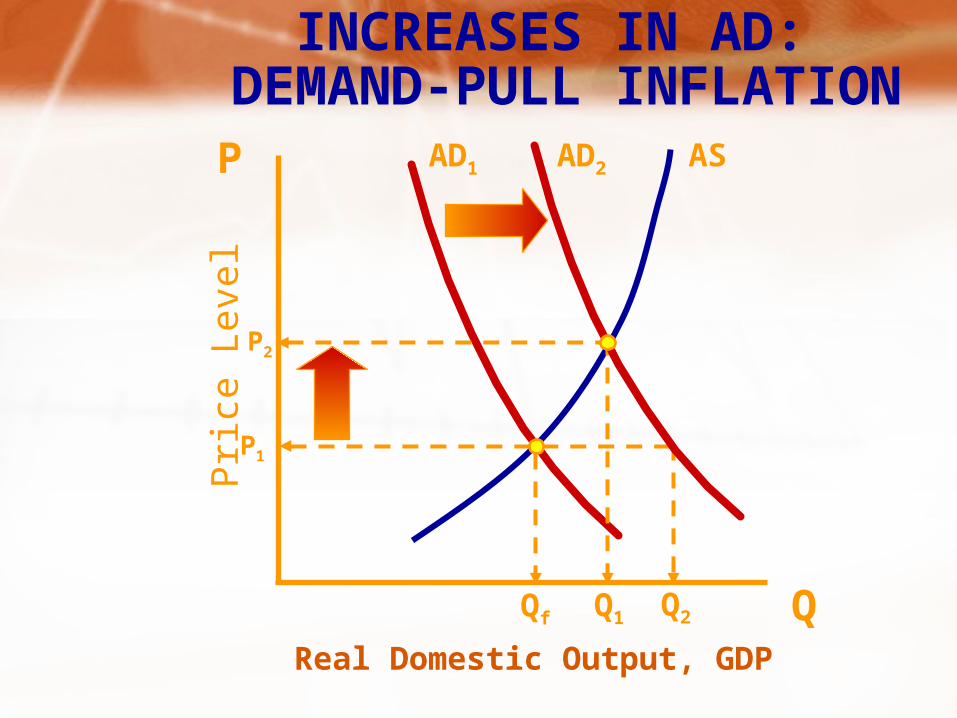
INCREASES IN AD: DEMAND-PULL INFLATION
P2
P1
AD2
Qf Q1 Q2
Pric
e Le
vel
Real Domestic Output, GDP
Q
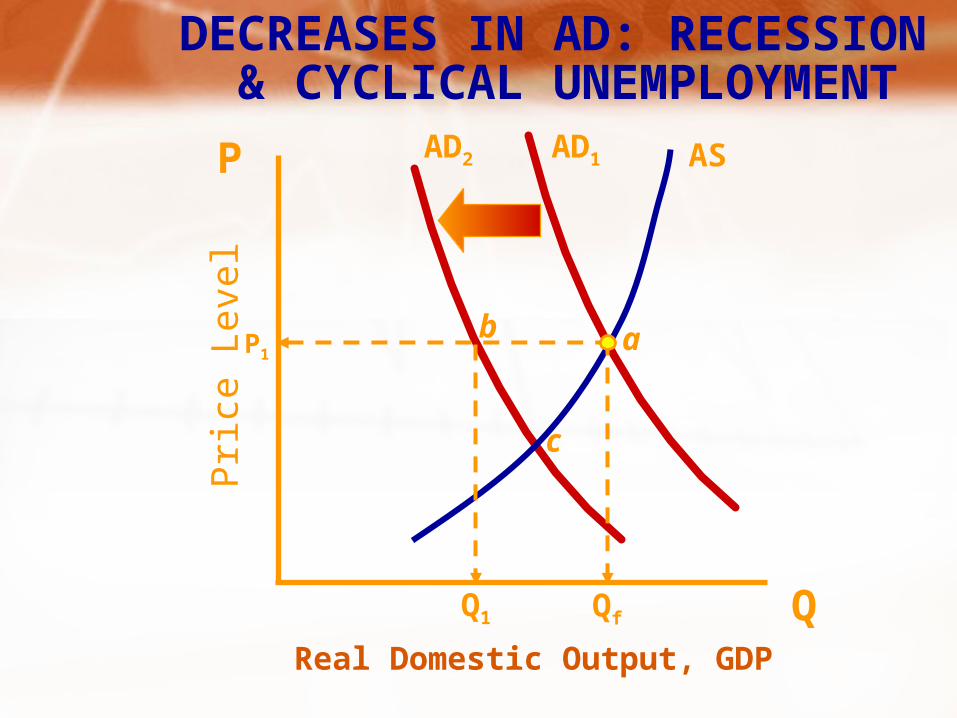
P ASAD1
DECREASES IN AD: RECESSION & CYCLICAL UNEMPLOYMENT
P1
AD2
QfQ1
a
c
b
Ratchet Effect
• At full employment• AD declines
– GDP declines but price does not– “sticky” prices
• Wage contracts• Efficiency wages• Min. wage• Menu cost• Fear price wars
Pric
e Le
vel
Real Domestic Output, GDP
Q
P AS1
AD1
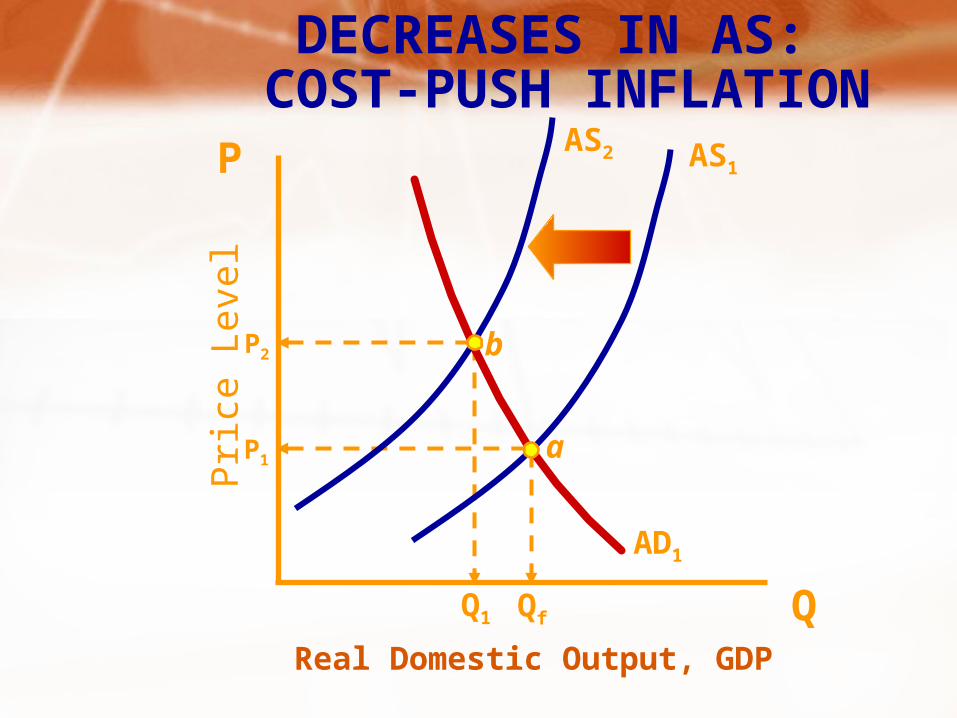
DECREASES IN AS: COST-PUSH INFLATION
P2
QfQ1
a
b
AS2
P1
Pric
e Le
vel
Real Domestic Output, GDPQ
P AS1
AD1
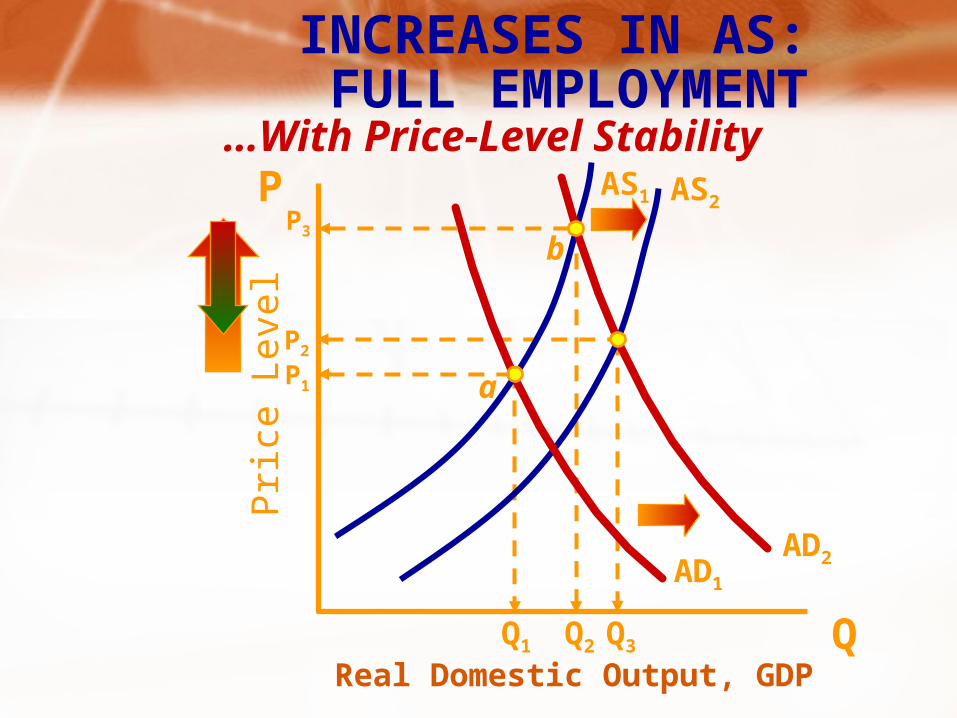
INCREASES IN AS: FULL EMPLOYMENT
P1
Q2Q1
a
b
AS2
P2
…With Price-Level Stability
AD2
P3
Q3