Embed Size (px)
Citation preview
Agency MBS: Market Overview and Relative Value During the. past week,. 30-year production coupon MBS. have. outperformed their Treasury and swap hedges by 3-4 ticks. As the 10-year Treasury rallied 10-12bp and
implied volatilities declined over the week following the release of the July. employment data last Friday, the overall sentiment in the MBS market had improved
substantially and FN 3.0s-4.0s are outperforming Treasuries by another 3-4 ticks
today. Annaly reduced its exposure toMBS by $12.8bn in 20'13, which brings the
cumulative decline in agency MBS holdings of all REITs during the 20'13 to $27bn.
Agency MBS: When Will the Market Feel the Taper Impact? While we believe that there is only 4-5bp upside left from reversal of the MBS spread
widening that could be attributed to convexity-related selling during the recent selloff,
weak seasonals for home sales starting in October may offset the negative impact of
the Fed's tapering for a few months. While most investors agree the gross issuance
of agency MBS should be only about $100-11 Obn per month at current mortgage rate
levels, it is interesting that the net issuance. of MBS is also likely to be sharply lower
over the next few months as home. sales show a significant seasonality. (almost 30%
variation from the Oct-Mar period to the. Apr-Sep period).
Agency MBS: July Prepays and Short-term Projections The. aggregate agency. prepays declined for the second consecutive month with 30-
year Fannie prepays declining by 9%. in July. This decline in aggregate speeds was
in-line with our expectations but HARP speeds were. faster than our projections. The.
net issuance of agency MBS was $30bn while the total pay-downs on Fed's portfolio
were about $22bln in July. We expect aggregate Fannie prepays to drop 18% month
over-month in August because of a continued sharp drop-oft in refinance index and
the day-count remaining flat. We expect most of this prepay drop to be concentrated
in lower coupons with prepays on HARP eligible cohorts remaining fairly stable.
Mortgage Credit Prices in the non-agency sector remained largely unchanged from the previous week
and most supply came. from hedge funds and COO liquidations. We analyze the
recent trends. in housing and revise our HPA forecast to + 10.5% in 2013, +4.5% in
2014 and +3%. in 2015, Separately. regarding Eminent Domain, three trustees
initiated a lawsuit against the city of Richmond and MRP this week and it appears
that the prices. being offered are. significantly. lower. than what was. stated in MRP's
marketing materials.
CMBS: Vornado, Skyline, Rouse After a slow start to the week, CMBS spreads finished unchanged to marginally
tighter, despite continued talk of Fed tapering which caused equities to trade lower.
Benchmark GG 1 0 spreads closed 2bp tighter on the week, finishing at 149bp over
swaps. This week we continue our coverage of REIT earnings, providing updates on
Vornado Realty Trust and Rouse Properties. Notably, Vornado provided commentary
on the pending modification of the $678mn Skyline Portfolio loan which is largely in
line with our expectations. Rouse outlined their future financing plans, and we believe
they may choose to prepay a subset of CMBS-related loans ..
9 AUGUST 2013
Fixed. Income Research . Strategists
Ohmsatya Ravi. +12126672338 [email protected]
Pratik K. Gupta +1 212667 1403 [email protected]
Dhivya Krishna +1 212 667 2183 [email protected]
Arun Manohar + 1 212 667 9360 [email protected]
Paul Nikodem +12126672130 [email protected]
Lea Overby +12126679479 [email protected]
Steven Romasko +1 2122984854 [email protected]
This report can be accessed electronically vi a: www.nomura.com/research or. on Bloomberg (NOMA)
Nomura Securities International Inc.
See Disclosure Appendix A-1 for the Analyst Certification and Other Important Disclosures
Nomura 1 Securitized Products Weekly
Contents
Agency MBS: Market Overview and Relative. Value a Recent Performance. and Market Flows. 3
Agency. MBS: When Will the. Market Feel the Impact of Tapering? 4
Relative. Value in the Agency Passthrough Market 6.
New Issue. Hybrid ARM Valuations 7.
Agency MBS: July Prepays and Short-term Projections 8
Lower Coupons Prepays 8
Post-HARP Credit-Impaired Cohorts 9
Higher Coupons Prepays 1 0
Ginnie Mae 11
Short-term Projections 12
Mortgage Credit 15
Market Color 15
Mortgage Litigation 15
News 16
Eminent Domain update 16.
Renewed push to refinance underwater PLS borrowers 17
Housing Update 18
Appendix 23
CMBS Markets. 25
Vornado,. Skyline, Rouse 25
In the. news. 27
Rouse reports second quarter earnings 27
Vornado. reports second quarter earnings 31
2.
Page 89 of 259 9 August. 2013
Nomura 1 Securitized Products. Weekly
Agency MBS: Market Overview and Relative Value
Recent Performance and Market Flows
During the past week, 30-year production coupon MBS (FN 3.5s and 4.0s} have outperformed
their Treasury and swap hedges by 3-4 ticks (Thursday-Thursday closes) . As the 1 0-year
Treasury rallied 1 0-12bp and implied volatilities declined over the week following the release of
the July employment data last Friday, the overall sentiment in the MBS market has improved
substantially and FN 3.0s-4.0s are outperforming Treasuries by another 3-4 ticks today.
Although there is no significant private investor group, other than the Fed, providing a strong
demand for agency MBS, the daily purchases of MBS by the Fed are more than enough to
offset the daily originator selling. The OW 2.5s/FN 3. 0s and the OW 3.0s/FN 3.5s swaps have
lost 2-3 ticks over the past week but the 15-year/30-year coupon swaps continue to look quite
rich to our models. The GN/ FN 3.0s-4.0s swaps have appreciated 3-4 ticks over the week. The
Fed was a net buyer of $15.5bn agency MBS over the week ending August 7.
Earlier this week,. Annaly (NL Y} reported its earnings for 20'13. and published a stockholder
supplement which gives some useful information about the state of its MBS portfolio after the
sharp selloff in rates in 20'13. Annaly reduced its exposure to agency MBS by $12.8bn in
20'13, which brings the cumulative decline in Annaly's agency MBS portfolio during 1 H'13 to
$27bn (in terms of face value}. However, a portion of the decline in Annaly's portfolio during the
10'13 may have occurred more to make room for their purchase of Crexus than because of the
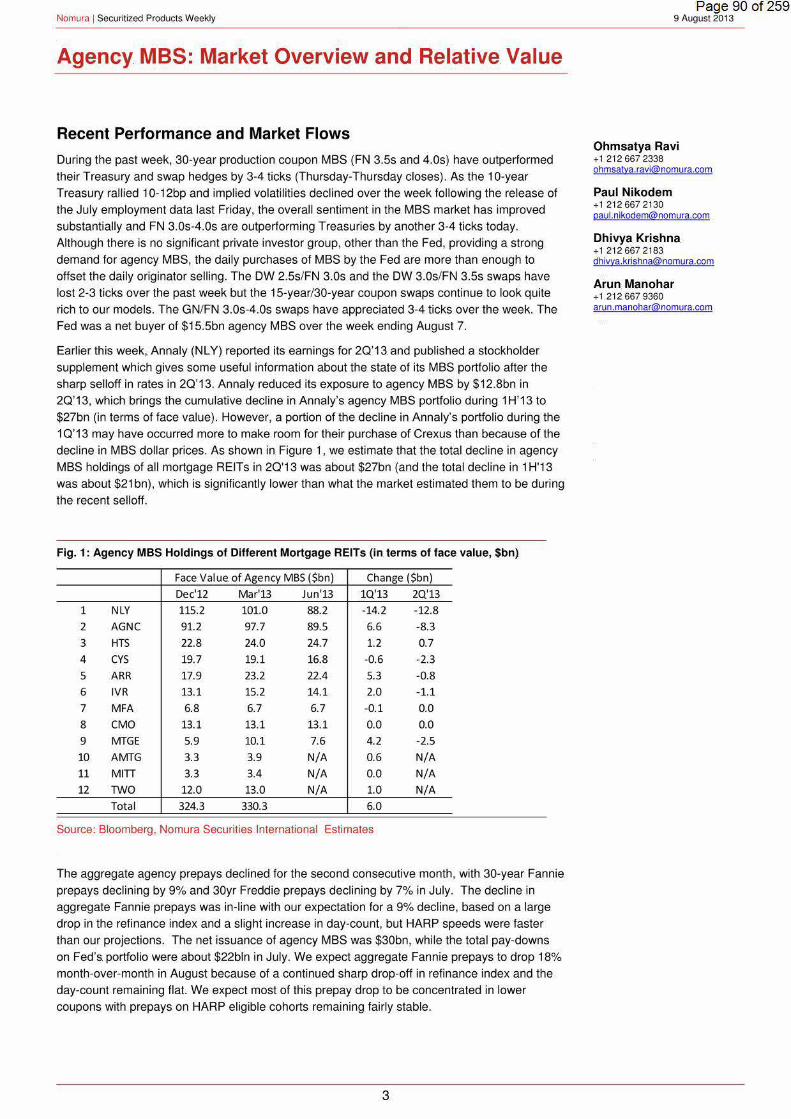
decline in MBS dollar prices. As shown in Figure 1, we estimate that the total decline in agency
MBS holdings of all mortgage REITs in 20'13 was about $27bn (and the total decline in 1H'13
was about $21 bn}, which is significantly lower than what the market estimated them to be during
the recent selloff.
Fig. 1: Agency MBS Holdings of Different Mortgage REITs (in terms of face value, $bn)
Face Value. of Agency MBS ($bn) Change ($bn)
Dec'12 Mar'13 Jun'13 1Q'13 2Q'13
1 NLY 115.2 101.0 88.2 -14.2 -12.8
2 AGNC 91.2 97.7 89.5 6.6 -8.3
3 HTS 22.8 24.0 24.7 1.2 0.7
4 CYS 19.7 19.1 16.8 -0.6 -2.3
5 ARR 17.9 23.2 22.4 5.3 -0.8
6 IVR 13.1 15.2 14.1 2.0 -1.1
7 MFA 6.8 6.7 6.7 -0.1 0.0
8 CMO 13.1 13.1 13.1 0.0 0.0
9 MTGE 5.9 10.1 7.6 4.2 -2.5
10 AMTG 3.3 3.9 N/A 0.6 N/A
11 MITI 3.3 3.4 N/A 0.0 N/A
12 TWO 12.0 13.0 N/A 1.0 N/A
Total 324.3 330.3 6.0
Source: Bloomberg, Nomura Securities International Estimates
The aggregate agency prepays declined for the second consecutive month , with 30-year Fannie
prepays declining by 9% and 30yr Freddie prepays declining by 7% in July. The decline in
aggregate Fannie prepays was in-line with our expectation for a 9% decline, based on a large
drop in the refinance index and a slight increase in day-count, but HARP speeds were faster
than our projections. The net issuance of agency MBS was $30bn, while the total pay-downs
on Fed's. portfolio were about $22bln in July. We expect aggregate Fannie prepays to drop 18%
month-over-month in August because of a continued sharp drop-off in refinance index and the
day-count remaining flat. We expect most of this prepay drop to be concentrated in lower
coupons with prepays on HARP eligible cohorts remaining fairly stable.
3.
Page 90 of 259 9 August. 2013
Ohmsatya Ravi + 1 212 667 2338. [email protected].
Paul Nikodem +1 2126672130 [email protected].
Dhivya Krishna +1 212667 2183. [email protected]
Arun. Manohar + 1. 212 667 9360 [email protected].

Nomura 1 Securitized Products. Weekly
Agency MBS: When Will. the. Market Feel. the. Impact of Tapering?
Agency MBS. spreads appear to be following the trends seen after several. major selloffs over
the. past 1 0 years, when MBS spreads tightened back to pre-convexity hedging related activity
levels within two to three months. after the. end of selloffs .. Production coupon MBS spreads have.
already tightened by 13-14bp since. hitting their recent wides on July 5. While we believe that
there is only 4-Sbp upside left from reversal of the MBS spread widening that could be attributed
to convexity-related sell ing during. the recent selloff, we wonder whether weak seasonals for
home. sales starting in October will offset the negative impact of the. Fed's. tapering of its QE3
purchases on MBS spreads for a few months.
Fig. 2: Changes in. Dollar Prices of. TBAs, 5-year and 1 0-year Treasuries. and Swap Rates
Changes in Prices and Rates
17-May 5-Jul 8-Aug 5/17-7/5 7/5-8/8 Total
FNCL 3. 0s 102-17+ 94-28+ 97-06+ (7-21) 2·10 (5·11)
FNCL 3.5s 105-05+ 98-30+ 101-02+ (6-07) 2-04 (4-03)
FNCL4.0s 106-07+ 102-03+ 104-07+ (4·04) 2· 04 (2-00)
5-yr Treasury 0.83% 1.61% 1.36% 88bp ·25bp 63bp
10-yr Treasury 1.95% 2.74% 2.59% 79bp -15bp 64bp
5-yrSwap 0.99% 1.82% 1.54% 83bp -28bp SSbp
10-yrSwap 2.09% 2.99"/o 2.77% 90bp -22bp 68bp
3mo*10yr Swaption Vol (bp) 71bp 122bp 93bp 51bp -29bp 22bp
3yr*10yr Swaption Vol (bp) 86bp 106bp 102bp 20bp -4bp 16bp
Prices on 5/17 are for June settle, Prices on 7/5 are for July settle; Prices on 8/8 are for Aug settle.
Source: Bloomberg, YieldBook, Nomura Securities International Estimates
Our base. case scenario is that the Fed wil l start tapering its. MBS purchase program after the
FOMC meeting in September and end its purchase program around the middle. of next year.
This baseline scenario should lead the Fed to. add another $260bn agency MBS (net
purchases) before. the purchase program actually ends next year. However,. just as the Fed
starts tapering of its MBS purchases, seasonals for. agency MBS issuance are set to improve
significantly ..
While. most investors. agree the gross issuance of agency MBS. should be only about $1 00·
11 Obn per month at current mortgage rate. levels, it is interesting that the. net issuance of MBS is.
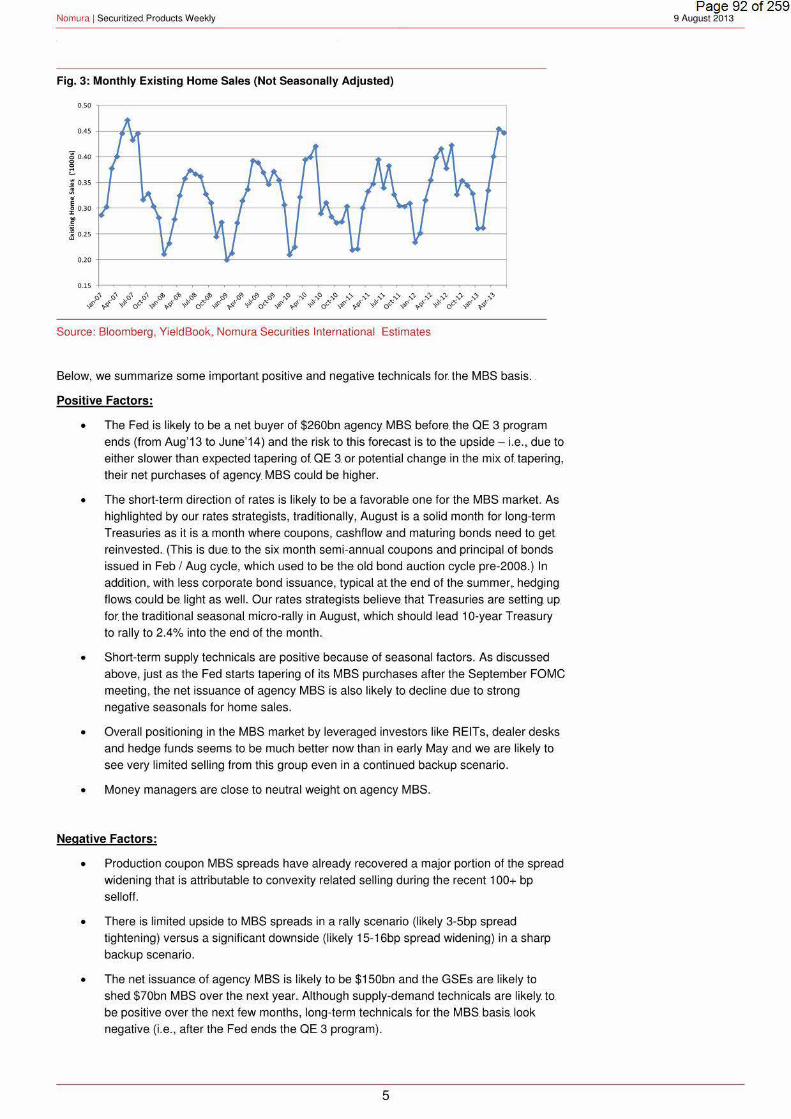
also likely to be sharply lower over the next few months. As. shown in Figure 3, home sales
show a significant seasonality (almost 30% variation from the Oct-Mar period to the Apr-Sep
period) and,. as. a consequence, the net issuance of agency MBS during this timeframe should
be. a lot less than we have been seeing. recently (of course, over a one-year period, seasonals
wash. out). Thus, although the annual net issuance of agency MBS. is likely to be around $1 25·
150bn over the. next year, over the six-month period of Oct'13-Mar'14, it is likely to be around
$60-72bn only (annualized rate) or $5·6bn per month. For reference, the. net issuance of agency
MBS over the first seven months of 2013 was. $130bn (or $18.6bn per month) .. This decline in
net issuance of agency MBS should offset the impact of the tapering of the Fed's MBS
purchase program and, in combination with the likely lower gross issuance, should offset the
negative impact of the tapering of QE3 purchases on MBS spreads for a few months.
Essentially, both. gross. and net issuance of agency MBS should be a lot lower from Oct'13 to
Mar'14 than over the past six to. seven months.
4
Page 91 of 259 9 August. 2013
Nomura 1 Securitized Products Weekly
Fig. 3~ Monthly Existing Home Sales (Not Seasonally Adjusted)
~ 0.40
c ;- 0.35 -HL--t-----JL-\----I----¥-+--;~t---~...v-t--4---HII..--I----l ~ " ~ 0.30 ~-----A~-f---1i--JL----'If---1--IA,----'t-.._--lll--l-----\-l--l .S ] 025
Source: Bloomberg, YieldBook,. Nomura Securities International Estimates
Below, we summarize some important positive and negative technicals for. the MBS basis ..
Positive Factors:
• The Fed is likely to be a net buyer of $260bn agency MBS before. the QE 3 program ends (from Aug'13 to June'14) and the risk to this forecast is to the upside - i.e., due to
either slower than expected tapering of QE 3. or potential change in the mix of tapering, their net purchases of agency MBS could be higher.
• The short-term direction of rates is likely to be a favorable one for the MBS market. As
highlighted by our rates strategists, traditionally, August is a solid month for long-term
Treasuries as it is. a month where coupons, cashflow and maturing bonds need to get
reinvested .. (This is due. to the six month semi-annual coupons and principal of bonds
issued in Feb I Aug cycle, which. used to be the. old bond auction cycle pre-2008.) In
addition,. with less corporate bond issuance, typical. at the end of the summer,. hedging
flows. could be. light as well. Our rates strategists believe. that Treasuries are setting. up
for the traditional seasonal. micro-rally in August, which should lead 1 0-year Treasury
to rally to 2.4% into the end of the month ..
• Short-term supply technicals are positive because of seasonal factors. As discussed
above, just as the Fed starts tapering of its MBS purchases after the September FOMC
meeting, the net issuance of agency MBS is also likely to decline due to strong
negative seasonals for home sales.
• Overall positioning in the MBS market by leveraged investors like REITs, dealer desks
and hedge funds seems to be much better now than in early May and we are likely to
see very limited selling from this group even in a continued backup scenario.
• Money managers. are close to neutral weight on agency MBS.
Negative Factors:
• Production coupon MBS spreads have already recovered a major portion of the spread
widening that is attributable to convexity related selling during the recent 1 00+ bp
sell off.
• There is limited upside to MBS spreads in a rally scenario (likely 3-5bp spread
tightening) versus a significant downside (likely 15-16bp spread widening) in a sharp
backup scenario.
• The net issuance. of. agency MBS is likely to be $150bn and the GSEs are. likely to
shed $70bn MBS over the. next year. Although supply-demand technicals are likely. to.
be. positive over the next few months, long-term technicals for. the MBS. basis. look
negative. (i.e., after the Fed ends the QE 3 program).
5
Page 92 of 259 9August 2013
Nomura 1 Securitized Products Weekly
• Domestic banks are likely to be a lot less active than before in the agency MBS market
due to regulations related to unrealized gains/losses. At the same time, there are no
indications that overseas investors will be active buyers of MBS.
• It is. not clear. who the marginal buyer of MBS will be. after. the. Fed ends the. QE 3.
program. Money managers stil l run the risk of. substantial redemptions if the. rates.
market sells. off again ..
From a short-term perspective,. the most important determinant of MBS spreads will be. the.
direction of interest rates. If the 1 0-year Treasury remains below 2.75%, Fed's MBS purchases
should overwhelm the net issuance and nominal spreads of production coupon MBS should
continue to tighten. Our rates strategists believe that Treasuries are setting up for the traditional seasonal micro-rally in August which should lead the 1 0-year Treasury to rally to 2.4% into the
end of the month. We view this scenario of 1 0-year Treasury yields as a fairly favorable one to MBS spreads and believe that the combination of sharply lower originator selling along with the
reinvestment needs of. MBS investors and Fed's MBS purchases will lead spreads to tighten
from their. current levels. Thus,. we continue to recommend a modest overweight on agency
MBS, but acknowledge that MBS spreads could widen substantially if the rates. market sells off
from here.
From a long-term perspective (i.e., after the Fed's purchase program ends), agency MBS
spreads are. likely to settle down at wider levels than historical averages as. long-term
supply/demand technicals appear to be weak. As discussed in our prior weekly reports, there is
a sharp pickup in the net issuance of agency MBS over the past few months and the GSEs are
continuing to reduce their MBS exposure. The organic growth in the MBS market coupled with
the reduction in GSE holdings mean the rest of the market may have to absorb up to $220-
$250bn agency MBS per year. Although MBS spreads don't look rich, it is. not obvious who will
be the marginal buyers of agency MBS after the QE 3 program ends.
Relative Value in the Agency Passthrough Market
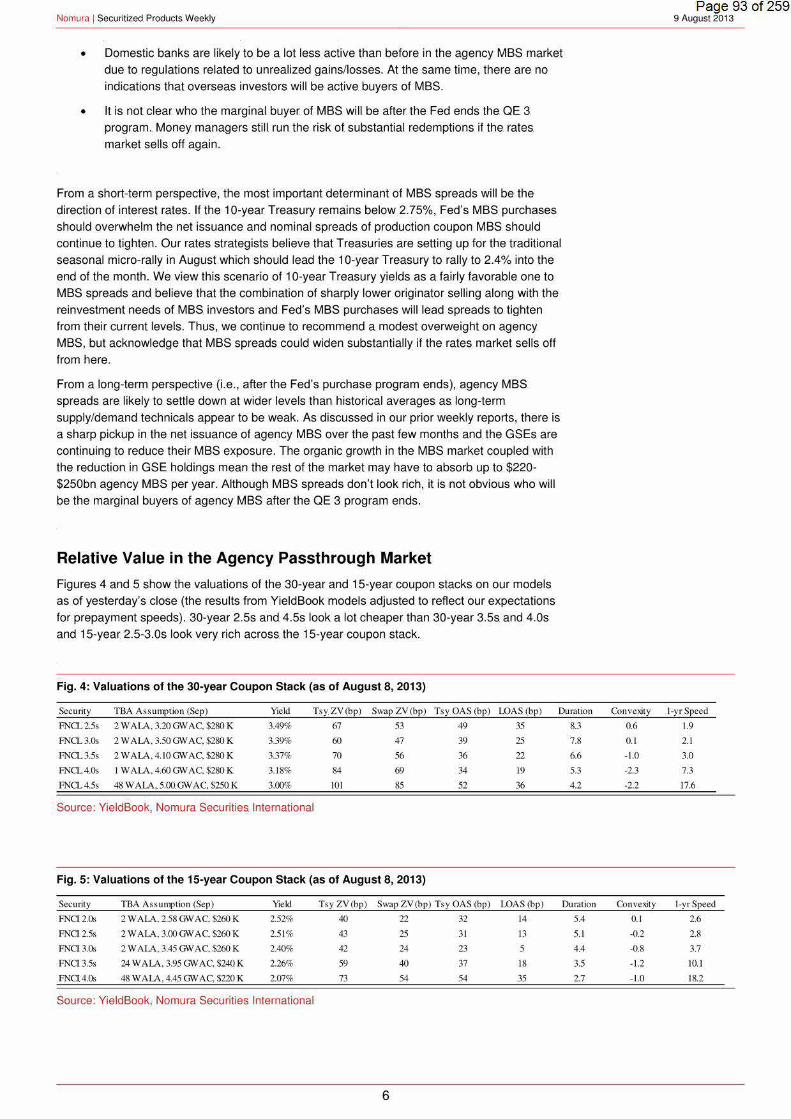
Figures 4 and 5 show the valuations of the 30-year and 15-year coupon stacks on our models as of yesterday's close (the results. from Yield Book models. adjusted to reflect our expectations
for prepayment speeds). 30-year 2.5s and 4.5s look a lot cheaper than 30-year 3.5s. and 4.0s
and 15-year 2.5-3.0s look very rich across. the 15-year coupon stack ..
Fig. 4: Valuations of the 30-year Coupon Stack (as of August 8, 201 3)
Security TBA Ass umption (Sep) Yield TsyZV(bp) Swap ZV(bp) Tsy OAS(bp) LOAS (bp) Duration
FNCL2.5s 2 W ALA. 3.20 GW AC. $280 K 3.49% 67 53 49 35 8.3
FNCL3.0s 2 WALA. 3.50GWAC,$280 K 3.39% 60 47 39 25 7.8
FNCL3.5s 2 W ALA. 4.10 GW AC. $280 K 3.37% 70 56 36 22 6.6
FNCL40s 1 WALA. 4.60GWAC.$280K 3.18% 84 69 34 19 5.3
FNCL4.5s 48 W ALA, 5.00. G\V A C. $250. K 3.00% 101 85 52 36 4.2
Source: YieldBook, Nomura Securities International
Fig. 5: Valuations of the 15-year Coupon Stack (as of August 8, 201 3)
Security TBA Assumption (Sep) Y.e ld Ts y ZV(bp) Swap ZV (b p) Tsy OAS (bp) LOAS(bp) Duration
FNC12.0s 2 W ALA. 2.58 GW A C. $260 K 2.52% 40 22 32 t4 SA FNCI2.5s 2 WALA, 3.00GW AC.$260 K 2.5 1% 43 25 31 13 5.1
FNC13.0s 2 W ALA, 3.45 G\VAC. $260 K 2.40% 42 24 23 5 4.4
FNC13.5s 24 W ALA. 3.95 GW AC, $240 K 2.26% 59 40 37 18 3.5
FNCl 4.0s 48 W ALA, 4.45 G\V A C. $220 K 2.07% 73 54 54 35 2.7
Source: YieldBook, Nomura Securities International
6
Convexity
0.6
0.1
-1.0
-2.3
-2.2
Convexity
0.1
-0.2
-0.8
-1.2
-1.0
Page 93 of 259 9 August. 2013
1-yrSpeed
1.9
2.1
3.0
7.3
17.6
1-yr Speed
2.6
2.8
3.7
10.1
18.2
Nomura 1 Securitized Products. Weekly
New Issue Hybrid ARM Valuations.
Aggregate Hybrid ARM issuance picked up in. July although much of. the increase. came. from Ginnie Mae .. GN ARM issuance jumped from around $900mn. in June to over $1 .8bn in July. The sharpest increase in Conventional ARMs was. in the 7/t sector with issuance. increasing from $1 .5bn to. nearly $1.8bn .. The. Hybrid ARM sector. has generally suffered from a lack of liquidity and. weak bank demand .. However. as. investors. are increasingly worried about a continued sell off in interest rates, shorter duration assets. like Hybrid ARMs. could benefit from increased sponsorship.
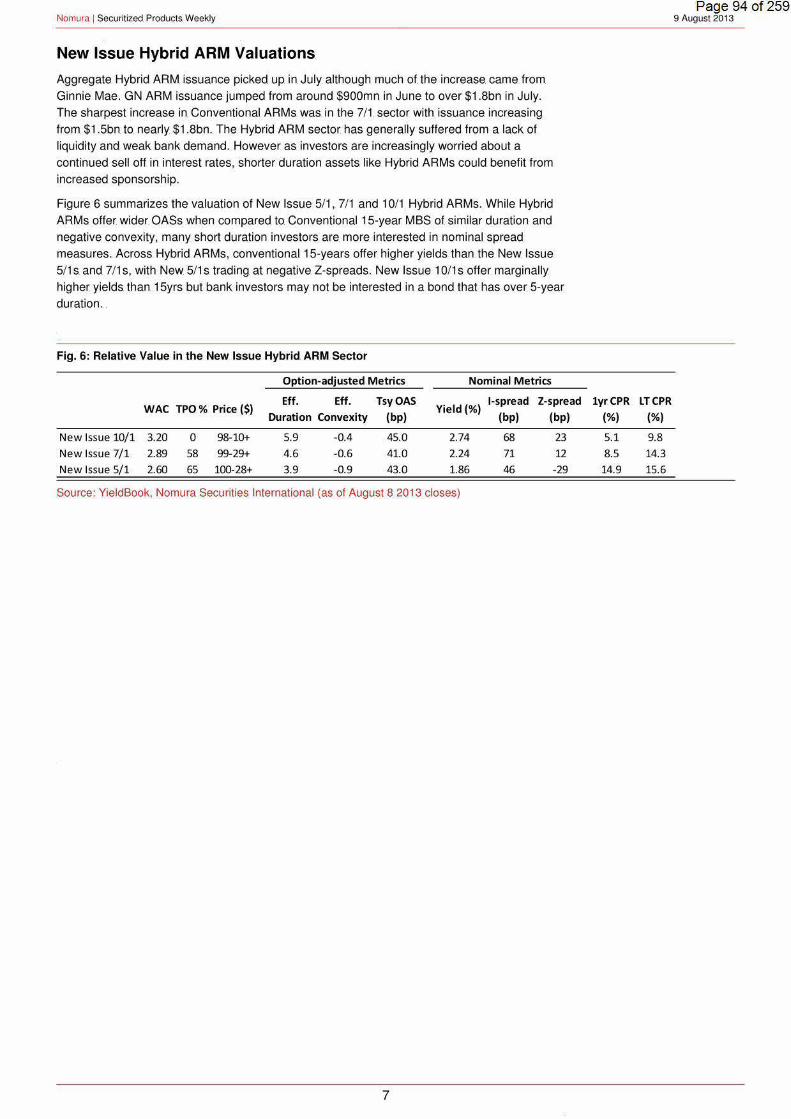
Figure 6 summarizes. the valuation. of New Issue 5/1, 7/1 and 10/1 Hybrid ARMs .. While. Hybrid ARMs. offer. wider OASs when compared to Conventional 15-year MBS of. similar duration and negative convexity, many short duration. investors are. more. interested in. nominal spread measures. Across. Hybrid ARMs, conventional15-years offer. higher yields than. the New Issue. 5/1 s. and 7/1 s, with New 5/1 s. trading. at negative Z-spreads. New Issue 10/1 s offer marginally higher. yields than 15yrs but bank investors may not be. interested in a bond that has. over. 5-year duration ...
Fig. 6: Relative Value in the New Issue Hybrid ARM Sector
Option-adjusted Metrics Nominal Metrics
WAC TPO % Price($) Eff. Eft. TsyOAS
Yield(%) !-spread Z-spread
Duration Convexity (bp) (bp) (bp)
New Issue 10/1 3.20 0 98-10+ 5.9 -0.4 45.0 2.74 68 23
New Issue 7/1 2.89 58 99-29+ 4.6 -0.6 41.0 2.24 71 12
New Issue 5/1 2.60 65 100-28+ 3.9 -0.9 43.0 1.86 46 -29
Source: YieldBook, Nomura Securities International (as of August 8 2013 closes)
7
lyrCPR
(%)
5.1
8.5
14.9
LTCPR
(%)
9.8
14.3
15.6
Page 94 of 259 9 August. 2013
Nomura 1 Securitized Products Weekly
Agency MBS: July Prepays and Short-term Projections
Aggregate prepays declined for the second consecutive month with 30-year Fannie prepays
dropping by 9% to 22.5 CPR and 30-year Freddie prepays dropping by 7% to 24.2 CPR. 15-
year prepays dropped by 15% across both the agencies. Broadly, prepays were in-l ine with our
expectations based on the increase in mortgage rates and the corresponding decline in refi
index. The drop due to these. factors overwhelmed the effect of a 2-day increase in day-count.
However, higher coupons increased marginally likely due to the impact of the higher day-count.
Some interesting trends observed in the recent print include:
• lower Coupon Prepays: Prepays declined sharply on the lower coupons with 2011
FN 3.5s dropping 31 % to 13.7 CPR and 2010 FN 4.0s dropping 18% to 20.2 CPR.
While TPO and Retail prepays have. mostly converged for 3.5s, TPO still. continues to
prepay around 3-4 CPR faster than Retail. in 4.0s . .
• HARP Prepays: Broadly, prepays on FN 5.5s and higher coupons increased, while
those on FN 5.0s declined by 1-3%, with 2008 FN 5.0s coming in at 51.8 CPR (down
3%) and 2008 FN 5.5s at 51.9 CPR (up 1 %). Across servicers, prepays continued to
decline on Chase loans, while Bank of America/Nationstar Freddie loans are prepaying
the fastest.
• Seasoned Cohorts: Prepays on seasoned vintages surprised this month. Across most
cohorts, prepays were flat to marginally higher despite the backup in mortgage rates,
with 2003 FN 5.0s increasing 1% to 37.5 CPR and 2003 FN 5.5s increasing 4% to 35.7
CPR. It appears that the higher day count is keeping these prepays elevated as well.
Additionally, at current levels of the 15-year mortgage rate, borrowers may be actively
choosing to refinance into a shorter term loan as a means of reducing the overall
interest payments.
• Ginnie. Mae: Aggregate prepays on GN Is increased by 1% to 23.8 CPR, while
aggregate prepays on GN lis declined by 13% to 15.8 CPR. This divergence can be
explained by the difference in involuntary prepays across GN I and II. Prepays on
lower coupon 2011 and 2012 vintage GN II 3.5s declined around 24%, comparable
with that observed for conventional loans. Prepays on the pre-May 2009 Chase
cohorts surprised this month, while Wells prepays continued to decline.
• Fed Paydowns: Paydowns on the. Fed's. MBS. portfolio are. estimated to be around
$22bn in July.
• Issuance: Gross issuance of agency MBS in July was $145bn while the net issuance
was $30bn.
Lower Coupons Prepays
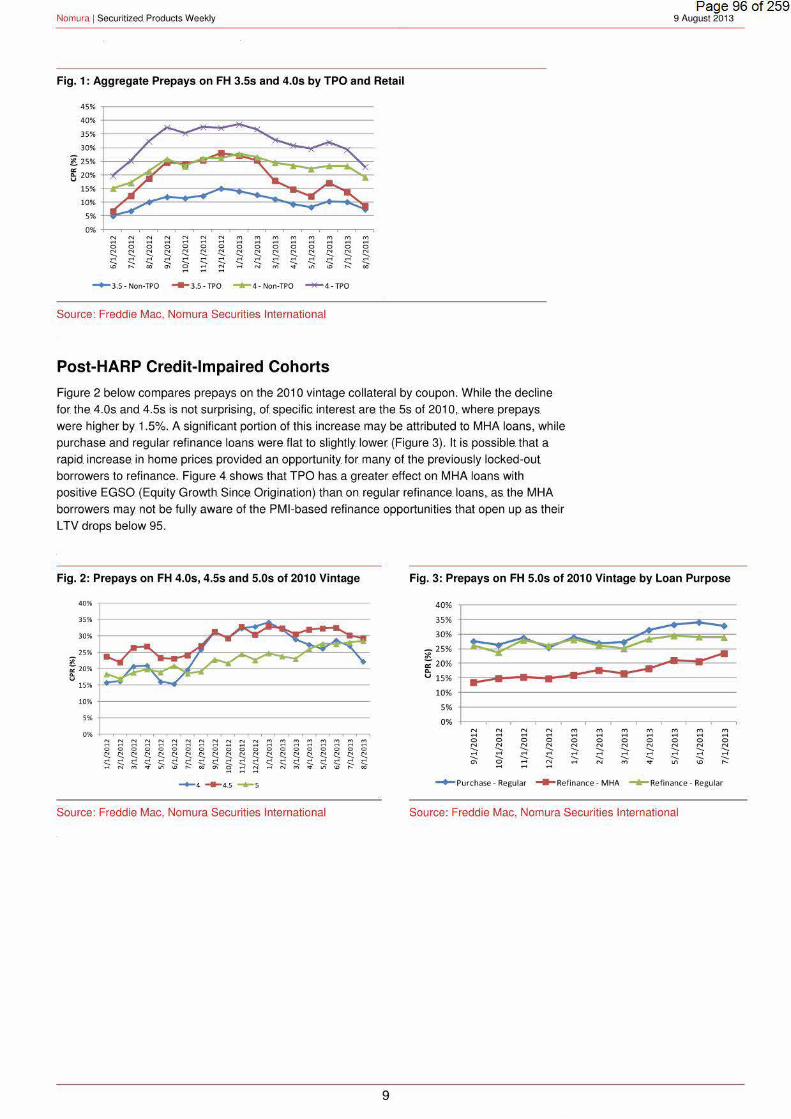
Prepays declined sharply on the lower coupons with 2011 FN 3.5s dropping 31% to 13.7 CPR
and 2010 FN. 4.0s dropping 18% to 20.2 CPR. Figure 1 shows prepays on Freddie TPO and
Retail loans by coupon (3.5s and 4.0s). It is interesting to note that TPO prepays have finally
converged with those of Retail for 3.5s, while TPO 4.0s continue to prepay around 3-4 CPR
faster than Retail loans. As the incentive declines, it is reasonable to expect that the effect of
TPO on prepays diminishes. Similarly, one can expect TPO 4.0s to decline faster than Retail
4.0s over the next few months and eventually converge.
8
Page 95 of 259 9 August. 2013
Dhivya Krishna +1 212 667 2183 [email protected]
Arun Manohar. + 1 212.667 9360 [email protected]
Paul. Nikodem +1 212.667 2130 [email protected]
Nomura 1 Securitized Products Weekly
Fig. 1: Aggregate Prepays on FH 3.5s and 4.0s. by TPO. and Retail
~ ::! ::! ::! ~ ::! N ~ ~ ~ ~ ~ "' ~ ~ ... ... ~ 0 ~ ~ 0 0 0 ~ ~ ~ ~ ~ 0 ~ ~ N N s ~ N ;::;- ?: ;::;- ;::;- ..... ;::;- ;::;- ..... ..... ;::;- ..... ..... ;::;-<:! % ... ... <:! ... ..... ..... ..... ;::;- ;::;- ..... ..... ..... ..... ..... ..... "' ... eo "' ::: .... ... N M .,.
"' "' ... eo
--3.5 · Non·TPO - 3.5-TPO --4 - Non-TPO - 4- TPO
Source: Freddie Mac, Nomura Securities International
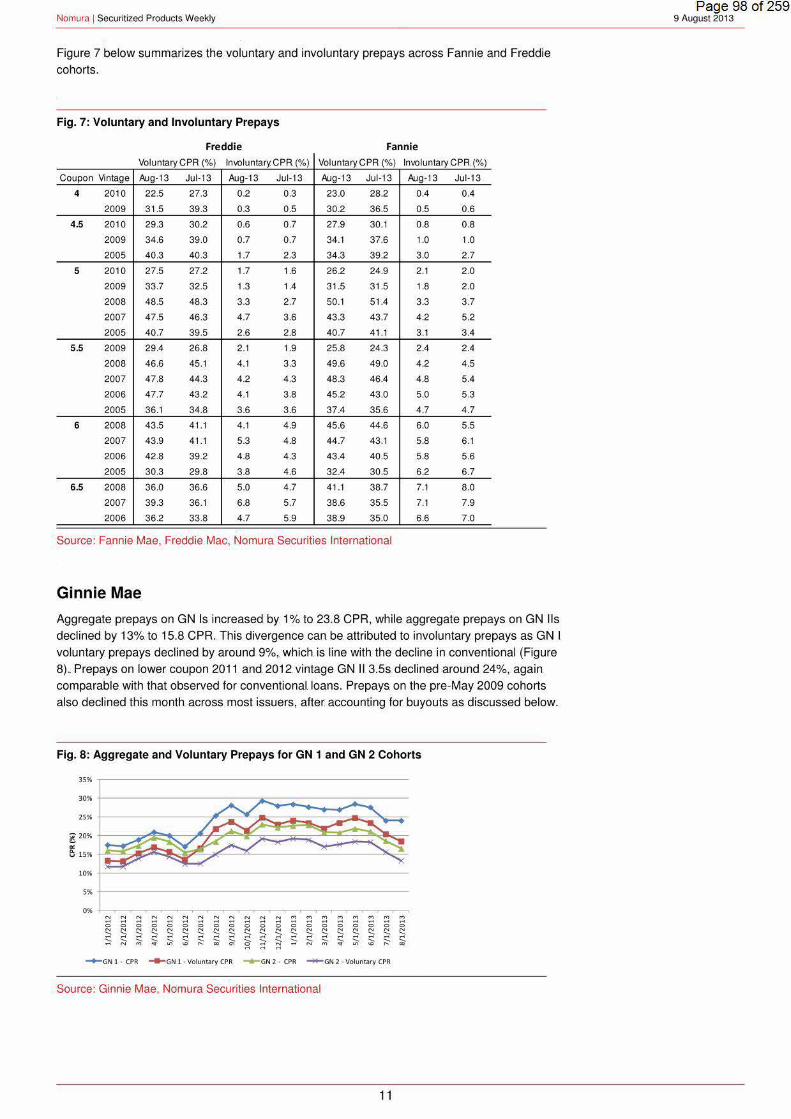
Post-HARP Credit-Impaired Cohorts
Figure 2 below compares prepays on the 2010 vintage collateral. by coupon. While the decline
for. the. 4. 0s and 4.5s is not surprising, of. specific interest are. the. 5s. of 2010, where. prepays
were higher by 1.5% .. A significant portion of this. increase. may be. attributed to MHA loans, while.
purchase and regular refinance loans were. flat to slightly lower (Figure 3). It is. possible that a
rapid increase. in home prices provided an opportunity fo r. many of. the. previously locked-out
borrowers to. refinance .. Figure 4. shows. that TPO has. a greater. effect on. MHA loans. with
positive EGSO (Equity Growth Since Origination) than on regular refinance. loans,. as the MHA
borrowers may not be fully aware. of the. PMI-based refinance opportunities that open up as their
LTV drops below 95.
Page 96 of 259 9August 2013
Fig. 2: Prepays on FH 4. 0s, 4.5s and 5.0s. of 2010. Vintage Fig, 3:. Prepays on FH 5.0s of 2010 Vintage by Loan Purpose
"' N N :::: "' :::: N N :::: "' "' N ~ "' ~ ~ "' ~ ~ ... ... ... c: ... c: ... 0 0 0 0 0 0 0 0 0 0 0 0 0 0 0 0 0
~ '::! ~ ~ ~
'::! '::! s s ~ § s s ~ ~ ~ '::! ~ ~ % .. ~ % ;;; ;;; ~ .. ~
-+-4 --4.5 --5
Source: Freddie Mac, Nomura Securities International
"' ... 0 s ;;;
9
40%
35%
30%
~ 25% ;- 20% Q.
.... 15%
10%
5%
0%
.. ......
.-~
N N .... .... 0 0 N N ..... ' .... .... ' ' "' 0 ....
-N ... 0 N
' .... ' .... ...
~Purchase · Regular
..--N ~ ... .... .... 0 0 0 N N N
' ' ' .... .... ... ' ';::;- ' N N ...
..... Refinance · MHA
~ ~
~ -- - .,.A ........
M M ... M ~ .... .... .... .... 0 0 0 0 0 N N N N N
' ' ' ' ;::;-.... .... .... .... ' ' ' ' ' M .,. .,.,
"' ... - Re finance · Regu lar
Source: Freddie Mac, Nomura Securities International

Nomura 1 Securitized Products Weekly
Fig •. 4: Prepays by. EGSO. and TPO. for Refinance. Loans. (May-Aug 2013)
50%
45% 40%
35%
~ 30% ~ 25% D. u 20%
15% 10%
5%
0%
:,......-...
·5
/ ~
~~ ..,- __. ...,___.,..-
0 5 10 15
Equity Growth Since, Origination (%)
~MHA · Retai i ---MHA· TPO ...... Regular -Retai l ~Regular·TPO
Source: Freddie Mac, Nomura Securities International.
Higher Coupons Prepays
Prepays on higher coupons stood out across. the coupon stack as prepays were. mostly
unchanged to marginally higher compared with. the sharp decline witnessed on the lower
coupons. Broadly, prepays on FN 5.5s. and higher coupons increased, while those on FN 5.0s
declined by 1-3%, with 2008. FN 5.0s coming in at 51.8 CPR (down 3%). and 2008 FN 5.5s at
51 .9 CPR (up 1 %).
Figure 5. shows the month-over-month change in voluntary prepays for 5.0s and higher
coupons. While there are some variations across vintages, the. change in FN and FH 5.0s was
lower compared with that for the 5.5s and higher coupons. We can attribute this difference to
the greater rate effect on the lower coupon, which potentially compensated for some of the day
count impact. HARP. prepays increased across. most servicers. this. month, with Chase prepays
actually declining despite the higher day count (Figure 6). This. is likely to be the first conclusive
sign of burnout in HARP prepays. Also,. it is possible that prepays on Fannie. transferred
collateral slowed this month. and we. should receive some confirmation in next few days.
Special servicers.like Nationstar. and Green Tree are likely to be capacity constrained as they
are seeking to. find refinancing opportunities in their recently acquired portfolios. The TBW
portfolio transferred over to Nationstar this month . The impact of this transfer should be less
severe because prepays on TBW loans already witnessed a spike during Mar-Jun 2013
(possibly because Cenlar had tied up with Quicken and some of the better credit borrowers
have already been refinanced). However, this transfer should keep capacity tight and delay the
onset of any burnout for Nationstar HARP loans.
Page 97 of 259 9 August. 2013
Fig. 5: Monthly Change in Voluntary Prepays by Cohort Fig. 6: Prepays on FH 2006-08 Vintage Loans by Servicer
12%
~ 10% a: D.
8% u .5
6% <II .. " 4% ..
.1:. v
2% '5 "
I
I • • I I I I I I I I II I I I I I
0% 0
~ -2% I I I ••
<II . > '? -4% '5 " 0 ::E
i l ~ l ~ l i l ~ ~ l ~ l i l i l "' i li li l"' ...... 0 0 0 0 0 0 0 0 0 0 0 0 0 0 0 0 0 0 0 0 0 0 0 0 0 0 0 N N N N N N N N N N N N N N
s 5.5 6
• Freddie • Fannie
Source: Fannie Mae, Freddie Mac, Nomura Securities International
i li l"' 0 0 0 0 0 0 N N N
6.5
10
60% .A-.. .....
50% • -40%
_..... ~ ...- ~ ~ ;; 30% D. .~ v
20%
10%
0% N N :::: ::: ::: ::1 ::: ~ ~ ~ ~ ... ... 0 0 ~ 0 0 0 0 0 s 0 0 N N s N s s ~ s N .... .... ::. ;:, .... ... ... .... .... .... ....
~ ::. ;::;- .... .... .... .... .... .... ;:: ... M <t ~ "' ... co ... ~Bank of America ~Chase - Wells Fargo
- Nationstar -Ill-Others --BayView
Source: Fannie Mae, Freddie Mac, Nomura Securities International
Nomura 1 Securitized Products. Weekly
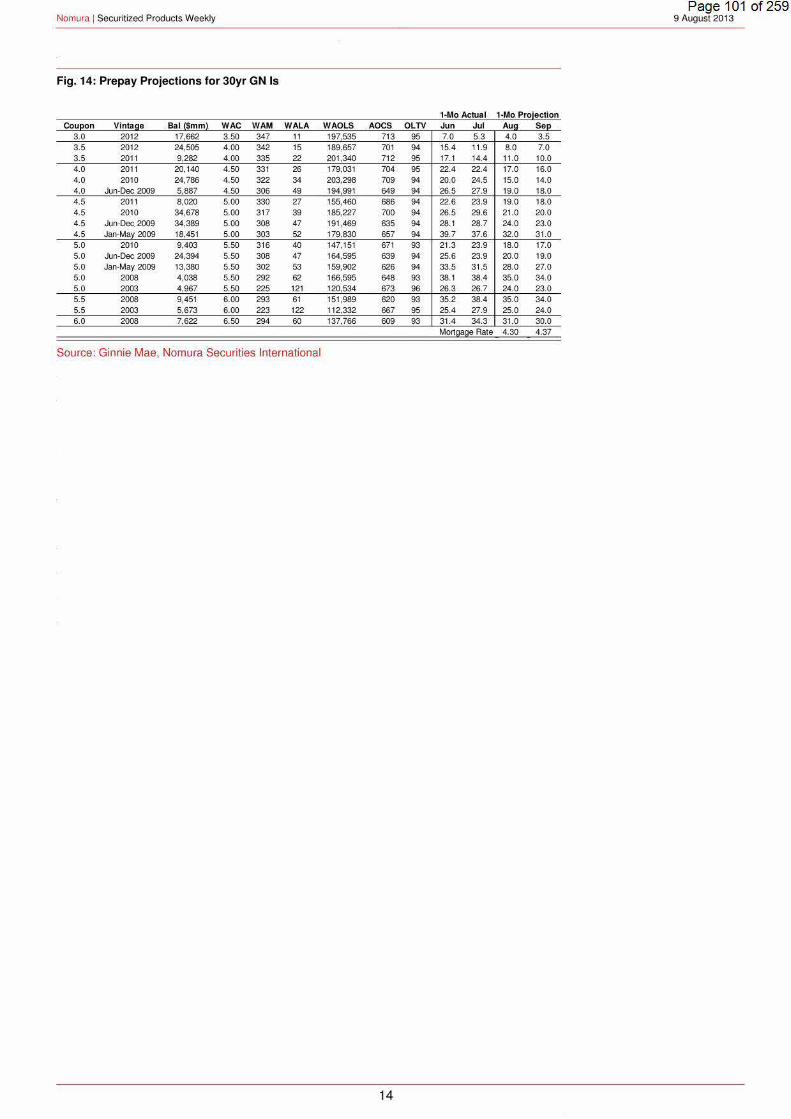
Figure 7 below summarizes. the voluntary and involuntary prepays across Fannie and Freddie cohorts.
Fig. 7: Voluntary and Involuntary Prepays
Freddie Fannie
Voluntary CPR(%) lniiOiuntary. CPR.(%) Voluntary CPR (%) lniiOiuntary CPR.(%)
Coupon Vintage Aug-13 Jul-13 Aug-13 Jul-1 3 Aug-13 Jul-13 Aug-1 3 Jul-13
4 2010 22.5 27.3 0.2 0.3 23.0 28.2 0.4 0.4
2009 31.5 39.3 0.3 0.5 30.2 36.5 0.5 0.6
4.5 2010 29.3 30.2 0.6 0.7 27.9 30.1 0.8 0.8
2009 34.6 39.0 0.7 0.7 34.1 37.6 1.0 1.0
2005 403 40.3 1.7 23 34.3 39 2 3.0 2.7
5 2010 27.5 27.2 1.7 1.6 26.2 24.9 2. 1 2.0
2009 33.7 32.5 1.3 1.4 31 .5 31.5 1.8 2 .0
2008 48.5 48.3 3.3 2.7 50.1 51 .4 3.3 3.7
2007 475 463 4.7 36 43.3 43.7 4.2 5.2
2005 40.7 39.5 2.6 2.8 40.7 41.1 3.1 3.4
5.5 2009 29.4 26.8 2.1 1.9 25.8 24.3 2.4 2.4
2008 46.6 45.1 4.1 3.3 49.6 49.0 4.2 4.5
2007 47.8 44.3 4.2 4.3 48.3 46.4 4.8 5.4
2006 47.7 432 4.1 38 452 430 5.0 5.3
2005 36.1 34.8 3.6 3.6 37.4 35.6 4.7 4.7
6 2008 43.5 4 1.1 4.1 4.9 45.6 44.6 6.0 5.5
2007 43.9 41.1 5.3 4.8 44.7 43.1 5.8 6.1
2006 42.8 39.2 4.8 4.3 43.4 40.5 58 5.6
2005 30.3 29.8 3.8 4.6 32.4 305 6.2 6 .7
6.5 2008 36.0 36.6 5.0 4.7 41.1 38.7 7. 1 8 .0
2007 39.3 36.1 6.8 5.7 38.6 35.5 7.1 7.9
2006 362 338 4.7 5.9 38.9 350 6.6 7.0
Source: Fannie Mae, Freddie Mac, Nomura Securities International
Ginnie Mae
Aggregate prepays on GN Is increased by 1% to 23.8. CPR,. while aggregate prepays on GN lis
declined by 13% to 15.8. CPR.. This divergence can be. attributed to involuntary prepays as GN I.
voluntary. prepays declined by around 9%,. which. is line with the decline in conventional (Figure
8) .. Prepays on lower coupon 2011 and 2012. vintage GN II 3.5s. declined around 24%, again
comparable with that observed for conventional. loans. Prepays. on the pre-May 2009 cohorts
also declined this month across most issuers, after accounting for. buyouts as discussed below.
Fig. 8: Aggregate and Voluntary Prepays for GN 1 and GN 2 Cohorts
0% N "' "' ::: "' "' "' N N "' "' N ~ ~ ~ ~ ~ ~ ~ ~ ~ 0 ~ ~ ~ ~ ~ ~ ~ ~
0 0 0 0 s 0 0 0 s. ~ 0 0 0 0 0 0 0 0 0
~
~ ~ ~ s ~ s ~ ~ ~ ~ ~
~ s ~ ~ ~ s ~ ;;, ~ .., £ ~ <:: ~ % :::: "' --GNl· CPR __...GN 1 · Voluntary CPR ...... GN2 · CPR - GN 2 · Voluntary CPR
Source: Ginnie Mae, Nomura Securities International
11
Page 98 of 259 9 August. 2013

Nomura 1 Securitized Products Weekly
Prepays on the. pre-May 2009. vintage Wells loans continued the decline. that we have been
highlighting over the past few months 1• The biggest surprise this. month was. the sharp jump in
S.Os and higher Chase loans. This increase does not appear to be due to buyouts. For instance,
in 2008 GN I S.Os, Wells FHA prepays declined by around 17%, while Chase FHA prepays
increased 40%. There is some uncertainty around factors driving the sharp increase in Chase
prepays for 2008 and prior vintages. Until we receive further information, we assume that this
spike will reverse the following month.
Page 99 of 259 9 August. 2013
Fig. 9: Prepays on Jan-May 2009 GN I 4.5s. FHA Loans by Issuer Fig. 10: Prepays on 2008 GN.I 5.0s FHA Loans by Issuer
10%
0% ~ ~ ~ ~ ~ ~ "' ~ :::: ~ :::: "' ~ ::l "' ::l ::l "' ::l ... ... ... ... 0 0 0 0 0 0 0 0 2 0 5 0 0 0
~ 0 0 s 0
~ "' s !::! s s s s "' !::! !::! s s s ~ .._ ::. .._ ... ... .... ... ~ ... .._ .._ .._ .._ .._ .._ .._ .._ .._ .._ .._ .._ .._ .._ .._ .._
"' M <t ., <D .... ()() "' ~ ... :::: .... "' M <t "' <D .... ()() ... --SofA ..... Chase ....,_Citi ~Other.lssuers -!!!-Wells
Source: Ginnie Mae, Nomura Securities International
70% .--------------------------------------------
60% +---------------~~L---~--~~~~~------
50% +-------------~~~~~~-------a~----~~~
g 4o% ~-----------~~~~,r:s~~iG~~~~~-t~ "' ~ 30% ~--~~~~--~~------------------~L-~~~
20% ilii,:J:~~ ...: ____________ __ 10% ~~----~~--------------------------------
0%
"' "' N "' "' "' N "' :::: N N :::l "' :::l :::l "' "' :::l M ... ... ... ... ... ... ... ... ... ... ... ... ... ... 2 0 0 0 0 0 0 0 0 0 0 0 0 0 0 0 2 0 0
N "' N N N N N N N !::! "' "' N "' N "' "' ::. ::. .._ ::. ::. ::. ::. ::. ::. ::. ::. ::. ::. ::. ::. ::. .._ .._ .... ... ... ... ..... ..... ..... .._ ..... ..... .._ .._ .._ ..... ..... ::. ..... .._ .._ ..... ..... .._ .._ N "' <t "' "' .... «> "' ~ ;:: :::: N "' .. "' "' " 00
--SofA ~Chase ....,_Citi ~Other. Issuers ~Wells
Source: Ginnie Mae, Nomura Securities International
Involuntary Prepays: This. month, Bank of America bought out loans. from lower coupons (4.0s,
4.5s and S.Os), while. Chase buyouts picked up in 6.5s. this month.
Fig. 11: Involuntary Prepays on GN 1 Loans by Issuer
30% r---------------------------------------------25% +-----~--------------------------------------
~ ~20% +-+-~~-------------------------------------<>. u
~ 15% +-+-~1--------------------------------------c " ] 10%
SAC Chase Wells
Source: Ginnie Mae, Nomura Securities International
Short-term Projections .
We. expect aggregate. Fannie prepays in August to drop 18% month-over-month because of a
continued sharp drop-off in refinance index and the. day-count remaining. flat. We expect most of.
this prepay drop to be concentrated in lower coupons with prepays. on HARP eligible cohorts. to
be fai rly stable .. Figures 12-14 show our cohort-level projections.
'Section titled 'Update on GNMA Prepays', published on 31 May 2013
12

Nomura 1 Securitized Products Weekly Page 1 00 of 259
9 August. 2013
Fig. 12: Prepay Projections for 30yr FN
1-Mo 1-Mo Actual P rojection
Coupon Vintage Bat ($mm) WAC WAM WALA WACLS FICO LTV Jun Jut Aug Sep
3.0 2012 151,301 3.59 347 10 267,020 769 71 6.8 5.5 4.5 4.0
3.5 2012 195, 166 4.01 342 14 . 239,985 759 74 13.4 9.8 6.0 5.0 3.5 2011 33,513 4.03 333 22 243,646 771 70 19.7 13.7 8 .0 7.0 35 2010 13,728 4.12 320 33 229,039 772 70 22.8 18.1 12.0 10.0 4.0 2012 62,413 4.47 339 15 . 200,009 738 79 15.4 13.3 9.0 8 .0 4.0 2011 73,968 4.47 330 25 224,094 759 74 24.6 20.2 14.0 12.0 4.0 2010 64,500 4.49 319 34 223,662 764 72 28.5 23.3 17.0 15.0 4.0 2009 42,348 4.55 300 50 . 208,916 765 67 36.9 30.5 2.2.0 19.0 4.5 2012 7,086 4.96 338 17 169,182 725 81 16.1 14.3 10.0 9.0 4.5 2011 62,344 4.93 327 26 203,833 748 76 25.5 232 18.0 16.0 4.5 2010 63,273 4.94 315 38 2 14,782 753 74 30.7 28.5 23.0 21.0 4.5 2009 91,581 4.93 302 49 206, 125 757 71 38.2 34.8 27.0 24.0 4.5 2003 6,576 5.07 228 120 135,948 731 69 37.0 36.8 32.0 290 5.0 2011 19,827 5.37 327 27 .191,819 729 81 23.5 23.1 20.0 19.0 5.0 2010 34,754 5.36 314 39 204,908 734 79 26.4 27.9 24.0 22.5 5.0 2009 28,260 5.42 305 48 190,812 740 76 32.9 32.8 28.0 26.0 5.0 2008 11,992 5.66 289 63 .186,749 735 73 53.2 51.8 46.0 43.0 5.0 2005 21,423 5.64 254 97 158,334 723 71 43.2 42.6 380 35.0 5.0 2004 12,509 5.55 238 110 . 143,872 722 72 38.7 37.9 33.0 31.0 5.0 2003 28,885 5.50 226 120 .127,998 720 70 37.1 37.5 33.0 31.0 5.5 2008 20,028 6.04 290 63 179,202 728 75 51.3 51 .8 49.0 46.0 5.5 2007 18,693 6.14 278 74 . 176,908 719 73 49.4 50.8 48.5 45.0 5.5 2006 9,086 6.16 266 86 .1 68,361 718 72 46.0 48.0 45.5 43.0 5.5 2005 21,542 5.98 253 97 142,851 71 1 73 38.6 40.4 385 36.0 5.5 2004 17,737 5.94 240 109 . 133,245 712 73 36.0 37.9 36.0 34.0 5.5 2003 30,344 5.94 225 122 117,895 714 72 34.2 35.6 34.0 32.0 6.0 2008 11,475 6.54 290 62 163,412 714 78 47.7 488 46.5 44.0 6.0 2007 25,307 6.57 280 73 . 161,468 707 77 46.6 48.0 45.5 43.0 6.0 2006 19,482 6.56 266 85 152,081 708 75 43.9 46.7 44.5 42.0 60 2005 6,230 650 255 96 121,835 700 78 35.0 365 34.5 33.0 6.0 2004 7,737 6.44 239 110 . 114,017 699 78 32.3 32.5 31.0 32.0 6.0 2003 6,472 6.49 226 122 105,161 702 75 30.2 31 .1 29.5 28.0 6.5 2007 7,587 7.06 280 73 135,479 692 81 40.4 42.8 40.5 38.5 6.5 2006 8,798 7.02 266 85 . 127,480 697 79 39.5 42.9 41.0 38.5
Mortgage Rate 4.30 4.37
Source: Fannie Mae, Nomura Securities International
Fig. 13: Prepay Projections for 15yr FN
1-Mo. 1 Mo Actual - Projection
Coupon Vintage Bat ($mm) WAC WAM WALA .WACLS. FICO LTV Jun Jut Aug Sep 2.5 2012 76,108 3.00 166 11 218,891 770 64 11.5 7.5 4.5 4.0 3.0 2012 44,986 3.45 162 15 . 184,041 762 65 15.2 11.5 8.0 7.0 3.0 2011 27,569 3.45 154 22 .. 188,297 no 63 21 .4 15.9 11.0 100 3.0 2010 3,473 3.58 142 33 160,354 773 62 21.5 18.5 15.0 13.5 3.5 2012 7,448 3.97 159 16 .. 135,046 749 67 13.3 13.9 11.5 10.5 3.5 2011 26,335 3.91 149 26 162,672 762 64 23.3 21.0 17.5 16.0 3.5 2010 2 1,093 3.92 14 1 34 156,720 769 62 27.3 24.2 20.0 18.0 4.0 2011 13,183 4.37 148 27 140,905 753 64 25.9 24.6 22.0 20.0 4.0 2010 17,047 4.41 136 38 136, 178 759 63 31.3 30.0 27.0 25.0 4.0 2009 13,927 4.48 124 49 124,582 761 60 34.4 33.7 31.0 290 4.0 2003 3,592 4.55 55 120 .53,314 742 59 22.2 24.3 22.0 20.5 4.5 2010 4,334 4.85 135 39 118,998 744 66 28.1 29.6 28.0 26.0 4.5 2009 6,666 4.89 125 49 111,937 748 63 31.1 32.6 31.0 29.0 4.5 2008 2,652 5.06 110 64 .. 108,775 744 61 39.2 37.6 35.5 330 4.5 2004 3,510 4.97 64 111 . 62,993 732 59 24.0 24.2 22.5 21.0 4.5 2003 12000 4.96 54 121 . 49.496 736 59 22.2 23.4 22.0 21.0 5.0 2008 2,569 5.57 11 1 63 . 94,365 734 62 34.5 36.2 34.0 32.0 5.0 2005 2,691 5.49 n 97 70,516 728 60 25.2 24.8 23.0 21.0 5.0 2004 2,785 5.43 66 109 58,632 721 61 20.2 22.2 21.0 200 5.0 2003 7,962 5.45 53 122 44,419 727 60 21.0 21.9 21.0 20.0
Mortgage Rate 3.35 3.40
Source: Fannie Mae, Nomura Securities International
13
Nomura 1 Securitized Products. Weekly Page 1 01 of 259
9 August. 2013
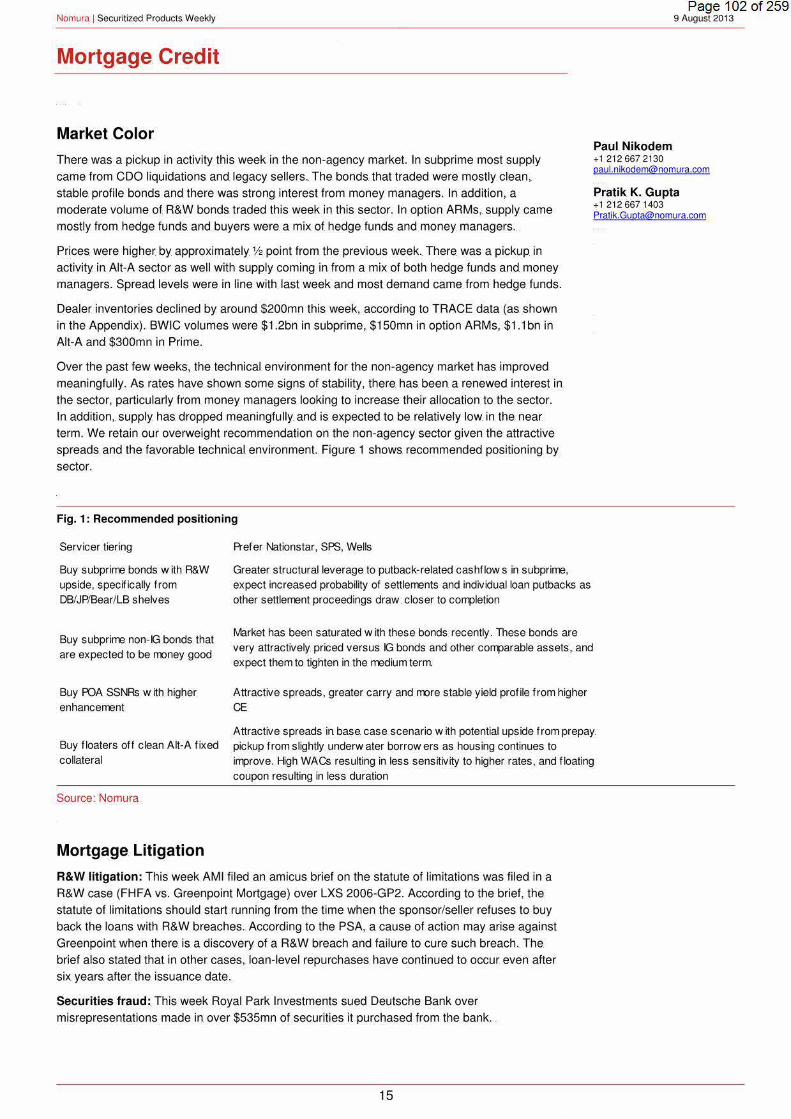
Fig. 14: Prepay Projections for. 30yr GN Is.
1 Mo Actual 1 Mo Projection Coupon Vintage . Bat ($mm). WAC WAM WALA WAOLS. . AOCS OLTV Jun Jut Aug Sep
3.0 2012 17,662 3.50 347 11 197,535 713 95 7.0 5.3 4.0 3.5 3.5 2012 24,505 4.00 342 15 189,657 701 94 15.4 11 .9 8.0 7.0 3.5 2011 9,282 4.00 335 22 201,340 712 95 17.1 14.4 11.0 10.0 4.0 2011 20,140 4.50 331 26 179,031 704 95 22.4 22.4 17.0 16.0 4.0 2010 24,786 4.50 322 34 203,298 709 94 20.0 24.5 15.0 14.0 4.0 Jun-Dec. 2009 5,887 4.50 306 49 194,991 649 94 26.5 27.9 19.0 18.0 4.5 2011 8,020 5.00 330 27 155,460 686 94 22.6 23.9 19.0 18.0 4.5 2010 34,678 5.00 3 17 39 185,227 700 94 26.5 29.6 21.0 20.0 4.5 Jun-Dec. 2009 34,389 5.00 308 47 191,469 635 94 28.1 28.7 24.0 23.0 4.5 Jan-May 2009 18,451 5.00 303 52 179,830 657 94 39.7 37.6 32.0 31.0 5.0 2010 9,403 5.50 3 16 40 147,1 51 671 93 21 .3 23.9 18.0 17.0 5.0 Jun-Dec 2009 24,394 5.50 308 47 164,595 639 94 25.6 23.9 20.0 19.0 5.0 Jan-May. 2009 13,380 5.50 302 53 159,902 626 94 33.5 3 1.5 28.0 27.0 5.0 2008 4,038 5.50 292 62 166,595 648 93 38.1 38.4 35.0 34.0 5.0 2003 4,967 5.50 225 121 120,534 673 96 26.3 26.7 24.0 23.0 5.5 2008 9,451 6.00 293 61 151,989 620 93 35.2 38.4 35.0 34.0 5.5 2003 5,673 6.00 223 122 112,332 667 95 25.4 27.9 25.0 24.0 6.0 2008 7,622 6.50 294 60 137,766 609 93 31 .4 34.3 31.0 30.0
Mortgage Rate 4.30 4.37
Source: Ginnie Mae, Nomura Securities International
14
Nomura 1 Securitized Products Weekly Page 1 02 of 259
9 August. 2013
Mortgage Credit
Market Color Paul. Nikodem
There was a pickup in activity this week in the non-agency market. In subprime most supply
came. from COO liquidations and legacy sellers .. The bonds. that traded were mostly clean,.
stable. profile bonds and there was strong interest from money managers. In addition,. a
moderate volume of. R&W bonds. traded this week in this sector. In option ARMs,. supply came
mostly from hedge funds. and buyers were. a mix of. hedge funds and money managers.
+1 212667 2130. [email protected]
Pratik K. Gupta +1 212667. 1403 [email protected]
Prices. were higher by approximately V2 point from the previous week .. There. was a pickup in
activity in Alt-A sector as well with supply coming in from a mix of both hedge funds and money
managers. Spread levels were in line with last week and most demand came from hedge funds.
Dealer inventories declined by around $200mn this week, according to TRACE data (as shown
in the Appendix). BWIC volumes were $1 .2bn in subprime, $150mn in option ARMs, $1.1 bn in
Alt-A and $300mn in Prime.
Over the past few weeks, the technical environment for the non-agency market has improved
meaningfully. As rates have shown some signs of stability, there has. been a renewed interest in
the sector, particularly from money managers looking to increase their allocation to the. sector.
In addition,. supply has dropped meaningfully and is expected to be relatively low in the. near
term .. We retain our overweight recommendation on the non-agency sector given the attractive
spreads and the favorable technical environment.. Figure 1 shows. recommended positioning by
sector.
Fig. 1: Recommended positioning
Servicer tiering
Buy subprime bonds with R&W upside, specifically from DB/JP/Bear/LB shelves
Buy subprime non-IG bonds that are expected to be money good
Buy POA SSNRs w ith higher enhancement
Buy floaters off clean Alt-A fixed collateral
Source: Nomura
Mortgage Litigation
Prefer Nationstar, SPS, Wells
Greater structural leverage to putback-related cashflow s in subprime, expect increased probability of settlements and individual loan putbacks as other settlement proceedings draw. closer to colll>letion
lv1arket has been saturated w ith these bonds recently. These bonds are very attractively. priced versus IG bonds and other COill>arable assets, and expect them to tighten in the medium term.
Attractive spreads, greater carry and more stable yield profile from higher CE
Attractive spreads in base. case scenario with potential upside from prepay pickup from slightly underwater borrowers as housing continues to illl>rove. High WACs resulting in less sensitivity to higher rates, and floating coupon resulting in less duration
R&W litigation: This week AMI filed an amicus brief on the statute of limitations was filed in a
R&W case (FHFA vs. Greenpoint Mortgage) over LXS 2006-GP2. According to the brief, the
statute of limitations should start running from the time when the sponsor/seller refuses to buy
back the loans with R&W breaches. According to the PSA, a cause of action may arise against
Greenpoint when there. is a discovery of a R&W breach and fai lure to cure. such breach. The.
brief also stated that in other cases, loan-level repurchases have continued to. occur even after
six years after. the. issuance date.
Securities fraud: This week Royal Park Investments sued Deutsche Bank over
misrepresentations made in over $535mn of securities it purchased from the bank . .
15
Nomura 1 Securitized Products Weekly
Separately, Allstate discontinued a securities fraud lawsuit against Goldman Sachs over
fraudulent representations and warranties. in over $123mn securities. it had purchased from the.
bank, possibly due to a settlement.
The. Department of. Justice. and SEC filed a civil. lawsuit against Bank of. America over. securities.
fraud involving the $835mn BOAMS 2008-A deal.. The. complaint alleged that a significant
percentage of. loans. were. originated through the wholesale. channel, a fact that was not
disclosed to the buyers, the Federal Home Loan Bank of San Francisco and Wachovia. Bank of
America also decided not to perform any due diligence. on the loans underlying the deal as such
reviews on previous deals had identified more than 40% of the loans to breach. BoA's
underwriting guidelines, causing them to be removed from those deals ..
Additionally, JP. Morgan disclosed in its. recent 10-0 filing that it may be the. subject of. a similar
lawsuit over securities. sold from 2005 to 2007. In May, the. Justice Department had preliminary
concluded that the bank had violated civil securities laws. over subprime and Alt-A bonds issued
by the bank.
News.
Mortgage Delinquencies declines: According to the. latest MBA national delinquency survey,
delinquencies continued to. fall. nationwide. and dropped to 6.96%. which is the lowest since. mid-
2008 .. Foreclosure. inventory also. declined. to. 3.3%. compared with 4.4% last year. However,. the
rate of new foreclosures. in New York hit an all-time. high. and foreclosure rate. in judicial states.
was. three times. the foreclosure. rate. in non-judicial. states (5.59% vs .. 1.86%)
PPIP report: According to the latest PPIP quarterly report, all the nine funds. have been wound
down, having distributed all the proceeds and repaid all. Treasury equity and debt. The Treasury
recovered its initial investment of $18.6 bn ($12.3 bn debt and. $6.3 bn equity) and realized a
profit of. $3.8 bn.
Asking prices decrease: According to a report by Trulia, asking. home prices decreased by
0.3% m-o-m and increased by 11% y-o-y. This is. the first month over month decrease in asking
prices since. November. 2012 and is. likely a result of higher rates and lower investor demand.
Eminent Domain update
Last week the city of Richmond, California initiated contact with servicers to buy loans out of
RMBS trusts and threatened to use Eminent Domain as. a backup measure.
Over the past week, a lawsuit was filed in the. US District Court of Northern California against
the. city of. Richmond by RMBS trustees. Bank of. New York Mellon,. Deutsche. Bank and Wells
Fargo seeking an injunction to. this proposal. According to the. lawsuit, out of the 624.1oans, 85%
are. not in any stage of the foreclosure process and 81% never. had a notice of. default or. are
now current, and. thus. the seizure. program would not address. the harms. that they seek to.
prevent.. In addition, the FHFA stated that it is also. considering. legal action and is considering
prohibiting the. GSEs from doing. business in cities that use. Eminent Domain to seize. loans ..
Of the 624.1oans. that the city of. Richmond is seeking to. buy back, 180 are non-performing and
unlikely to quali fy for a FHA refinance, casting doubts on the viability of the plan for. this subset.
Based on the subset of eligible loans2. we find in the CoreLogic database, the. average
delinquency depth of the delinquent loans in Richmond is 24 months. with around 77% of. the
loans. being delinquent for more than six months; the majority of. these delinquent borrowers
would. likely not qualify for FHA underwriting criteria,. which requires some evidence. of. positive
credit historl. Without the. ability to. refinance. these. loans. into. FHA, it is not obvious how MRP
would be. able. to help borrowers. through modifications and make the. plan economically viable
at the same time .. ln addition,. without the FHA refinance. the. only way that MRP could make the.
seizure of delinquent loans profitable is by paying significantly lower than the market price. of the.
property. and engaging in a whole loan sale.
2 Owner occupied, first lien, LTV < 110% of the CL TV 3 FHA underwriting criteria requires evidence of ability to pay, including a clean recent pay history on existing mortgages or compensating factors for delinquent loans. Recently originated FHA loans had an average FICO exceeding 700.
16
Page 1 03 of 259 9. August 2013.
Nomura 1 Securitized Products. Weekly
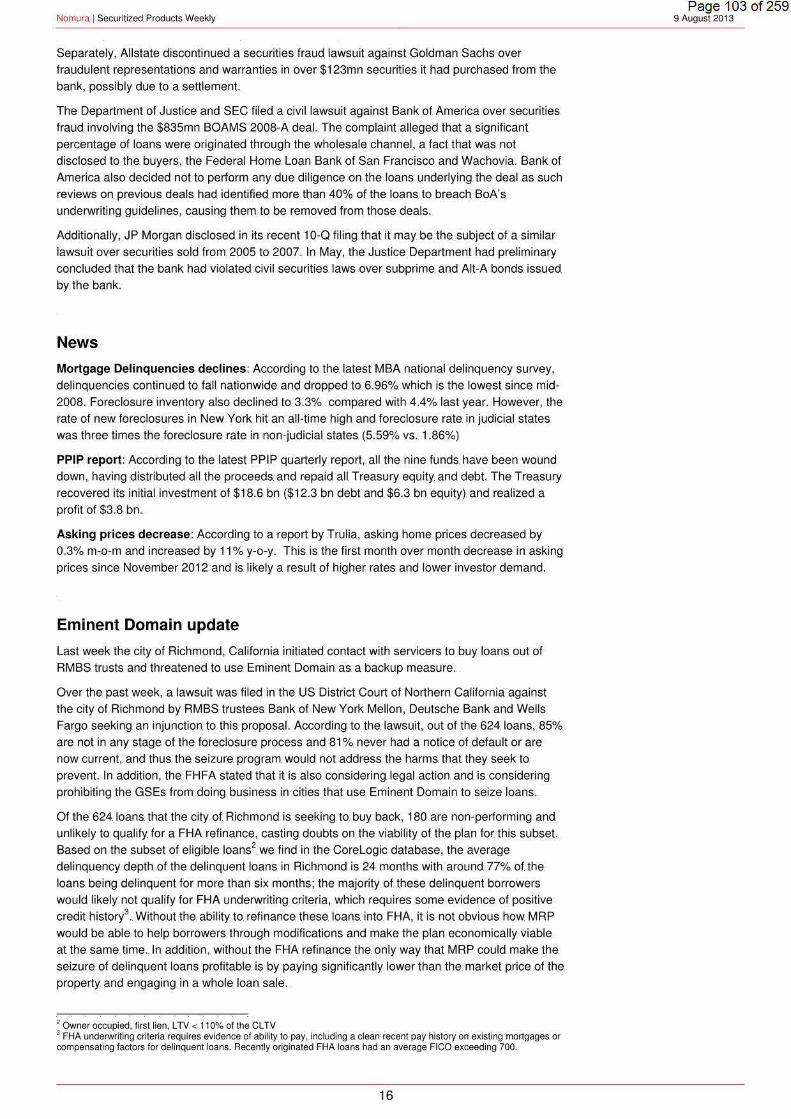
According to data cited in the BNY Mellon lawsuit,. the price for delinquent/foreclosure loans
appears to be. significantly below the. 80% of updated home. price threshold cited in MRP
presentation materials. Figure 2 shows the average price offered. as. a percent of loan balance
and updated home price (using zipcode-level HPI. indices). Even after adjusting for. the margin
of error. associated with the HPI. indices and distressed home price discounts, it appears that the
offered price for delinquent loans are approximately 40-53% of the. updated value of the home,
and for loans in foreclosure, around 30-42% of the value of the home - significantly lower. than
the 80% of home price valuation numbers that were discussed in the proposal.
Fig. 2: Average price offered as. a. percentage of. loan. balance. and home price (for deals with BNYM. as trustee)
Current status Avg LTV l'v1onths Loan. Px (as %.of Px (%as. of. updated
dq Count balance) home price)
Current 114 71 64% 69%
Delinquent 123 7 27 34% 39%
Foreclosure 120 10 3 27% 32%
Source: BNYM complaint, Loan Performance, Nomura
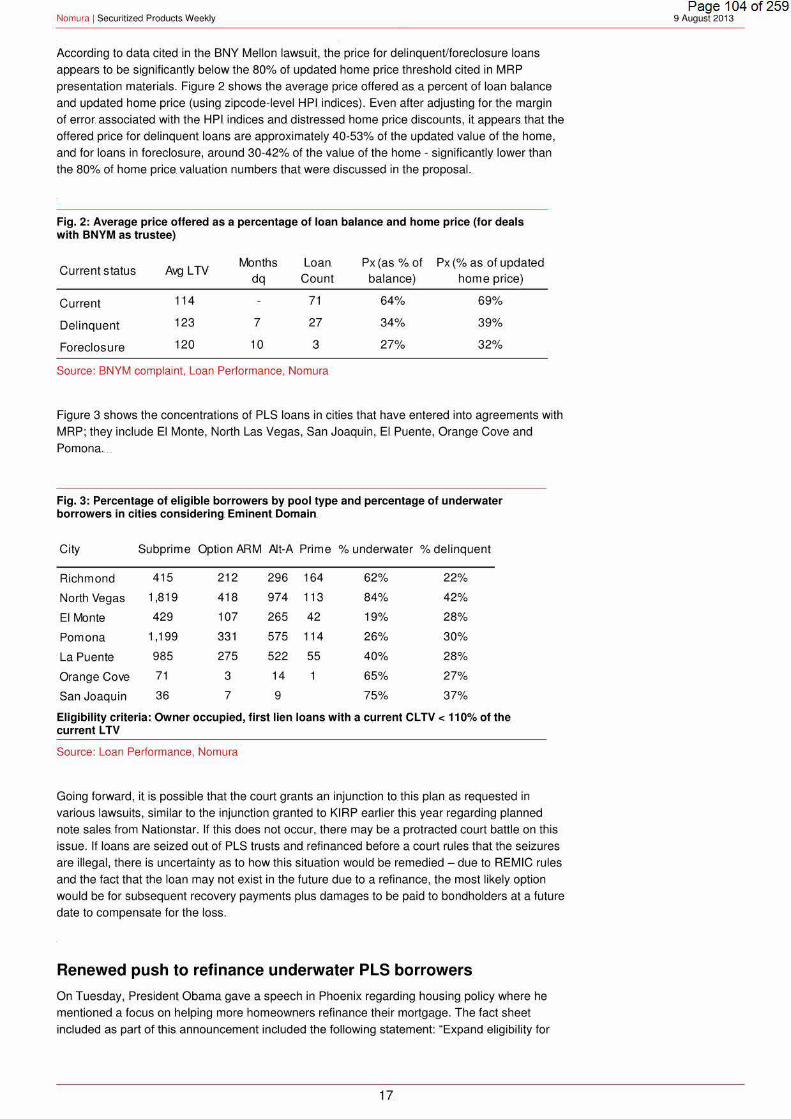
Figure 3 shows. the concentrations of. PLS loans in cities that have entered into agreements with
MRP; they include. El Monte, North. Las Vegas, San Joaquin, El. Puente, Orange Cove. and
Pomona . ..
Fig. 3: Percentage of elig ible borrowers by pool type and. percentage of underwater borrowers. in cities considering Eminent Domain.
City Subprime Option ARM Alt-A Prime % underwater %delinquent
Richmond 415 212 296 164 62% 22%
North Vegas 1,819 418 974 113 84% 42%
Ell'v1onte 429 107 265 42 19% 28%
Pomona 1,199 331 575 114 26% 30%
La Puente 985 275 522 55 40% 28%
Orange Cove 71 3 14 65% 27%
San Joaquin 36 7 9 75% 37%
Elig ibility criteria:. Owner. occupied, first lien. loans with a current CLTV < 110% of the current LTV
Source: Loan Performance, Nomura
Going forward, it is possible that the court grants an injunction to. this plan as requested in
various. lawsuits,. similar to the injunction granted to KIRP earlier this. year. regarding planned
note. sales. from Nationstar. If this does not occur,. there. may be a protracted court battle on this
issue. If loans. are seized out of PLS trusts and refinanced before a court rules that the seizures
are illegal, there is uncertainty as to how this situation would be remedied- due to. REMIC rules
and the fact that the loan may not exist in the future due to a refinance, the most likely option
would be for subsequent recovery payments plus damages to be paid to bondholders at a future
date to compensate for the loss.
Renewed push to refinance underwater PLS borrowers
On Tuesday, President Obama gave a speech in Phoenix regarding housing policy where he
mentioned a focus on helping more homeowners refinance. their mortgage. The fact sheet
included as part of this announcement included the following statement: "Expand eligibility for
17.
Page 1 04 of 259 9 August. 2013
Nomura 1 Securitized Products Weekly
refinancing to. many hundreds of thousands of eligible borrowers. who do not have government
backed mortgages by creating special programs through the Federal Housing Administration
(FHA) or Fannie Mae and Freddie. Mac."
One plan that has been discussed recently. which would allow underwater. PLS borrowers to.
refinance their loans is Senator Jeff Merkley's 'Rebuilding. American Homeownership Act of
2013' bill.. This bill proposes a mechanism for refinancing underwater PLS loans. into a government-guaranteed loan through the creation of a new government entity .. This bill was
originally expected to have been introduced in January. but was actually introduced in late July ..
Under the. proposed bill, borrower eligibility requirements for the plan include the following:
• Borrowers must be current for the past six months and not more than 30 days
delinquent over the past year
• First lien, owner occupied
• Updated LTV between 80. and 140
• Originated before May 31 , 2009
• The new loan balance must not exceed conforming balance. limits.
The table below shows the estimated eligibility of the plan as of today. We estimate that 11% of
subprime, 14% of Alt-A, and 17% of prime borrowers qualify for the plan based on the
requirements listed above and have a WAC greater than 4.5%. The number of borrowers
eligible for the plan today is 1 0-15% lower than the estimate in February 2013 when the initial
draft of the bill was discussed, mainly due to improvements in borrower equity.
Fig. 4: Percentage of borrowers with refi incentive potentially eligible under the Merkley Refinance Bill
Sector % with refi incentive
Subprime 11%
Option ARM 1%
Alt-A 14%
Prime 17%
Source: Loan Performance, Nomura
Separately, a pilot program similar. to the. Merkley bill. was introduced earlier this. year in
Multnomah County, Oregon. In this. program, funds from the Troubled Asset Relief Program will.
be used to refinance underwater loans in PLS. deals. that have a 105-125 LTV and only modest
payment problems in the past, and borrowers. must sign a hardship affidavit.. The program was
announced in late February and became operational in mid-June and thus we have not seen
the effect of this. program on prepayments yet.
As we stated in the. past,. we. expect that there. is a low probability. that this proposal is. ultimately.
implemented given the legislative. hurdles involved in creating a new government entity to
refinance. the. borrowers. We. expect that the government is unlikely. to incur. the significant
budgetary. cost associated with taking on this. additional credit risk especially. given the current
contentious fiscal environment. Alternatively, if the bill assesses. a special g-fee to pay for itself,
that would make the planless feasible ..
Housing Update
The. Corelogic June home price index posted an 11.9% year. over year gain reflecting the 16th
consecutive. month of. year-over-year. increases .. Based on the strong performance over. the. past
month. (+ 1.9%) we revise our. HPA forecast to+ 10.5% in 2013, +4.5% in 2014, and +3% in
2015.
18
Page 1 OS of 259 9 August. 2013
Nomura 1 Securitized Products Weekly
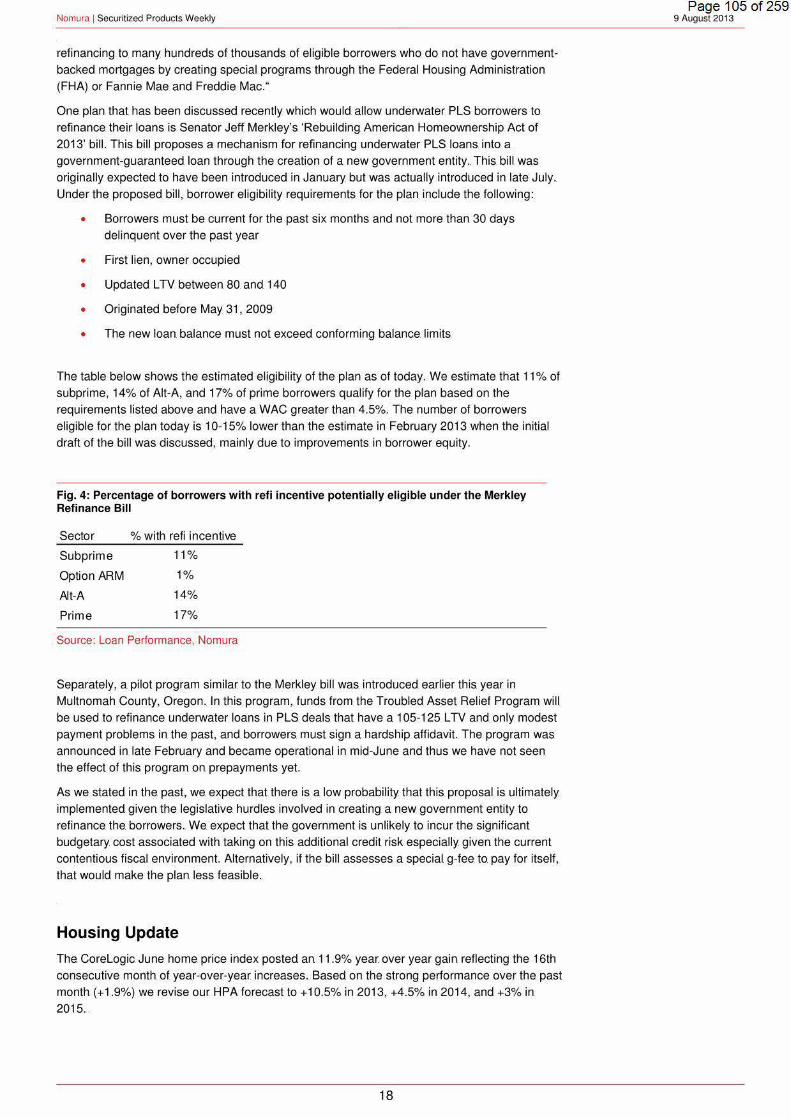
Despite higher rates in May and June, we have. not seen a significant pull back in mortgage
indicators yet, suggesting that the positive momentum for housing may continue in the near
term. However,. the lack of visible. housing inventory is starting to ease, and by late 2013 we
expect that the. effect of higher rates. and. a lower contribution from investor demand will
moderate. the pace of future home price growth. In addition, DTI restrictions. in the final OM rule
will. likely moderate the pace of. future home price growth due to lackluster income. growth.
Fig. 5: Home price growth (month over month and annual change)
14% 3.5%
12% 3.0%
10% 2.5%
8% 2.0%
6% 1.5%
4% 1.0%
2% 0.5%
-2% -0.5%
-4% -1.0%
-6% Jun -11 Sep -11 Dec-11
-1.5% Mar-12 Jun -12 Sep-12 Dec-12 Mar-13 Jun-13
- YoYchange(%) - MoMchange (rhs)
Source: Corelogic. Nomura
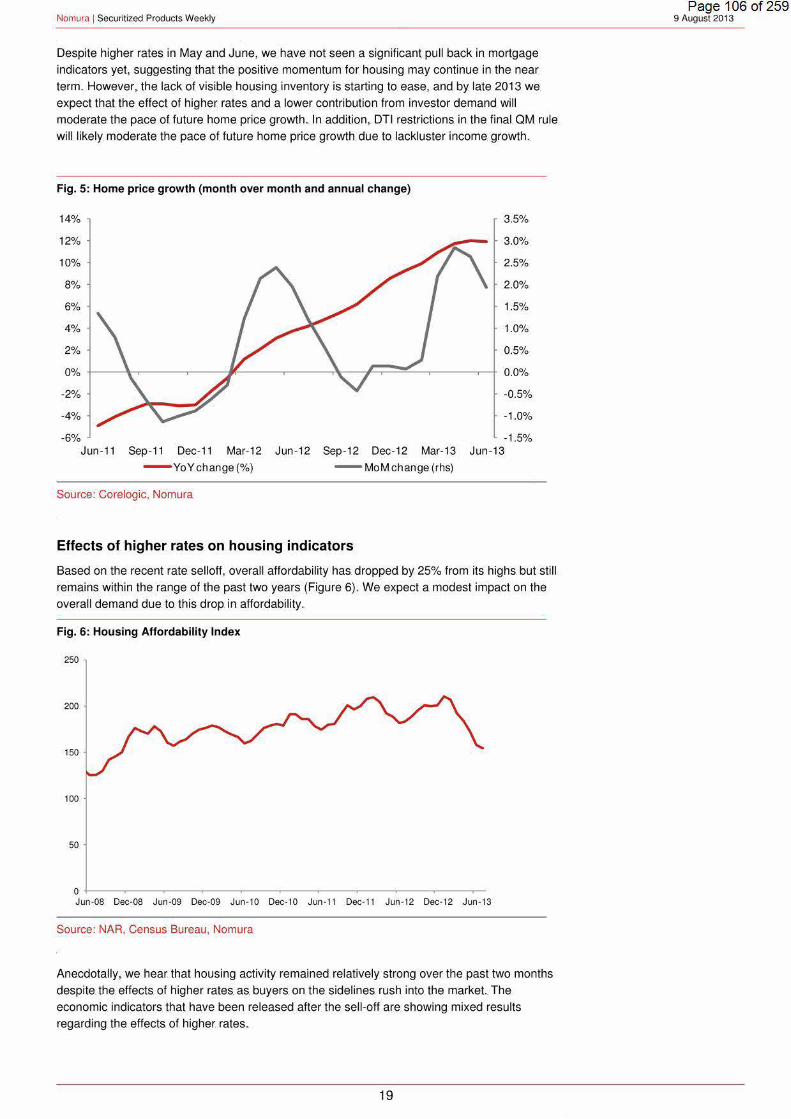
Effects of higher. rates. on. housing indicators.
Based on the recent rate selloff, overall affordability has. dropped by 25% from its highs but still
remains. within the range of the past two years (Figure 6). We expect a modest impact on the
overall demand due. to this drop in affordability ..
Fig. 6: Housing Affordability Index
250
200
150
100
50
o +---~----~----r---~----~--~~---r----~--~-----r-Jun-08 Dec-08 Jun-09 Dec·09 Jun-10 Dec-10 Jun-11 Dec-11 Jun-12 Dec-12 Jun-13
Source: NAR, Census Bureau, Nomura
Anecdotally, we hear that housing activity remained relatively strong over the past two months
despite the. effects of higher rates. as. buyers on the sidelines. rush into the market. The
economic indicators. that have. been released after the. sell-oft are. showing mixed results
regarding. the effects of higher rates ..
19
Page 1 06 of 259 9 August 2013
Nomura 1 Securitized Products. Weekly
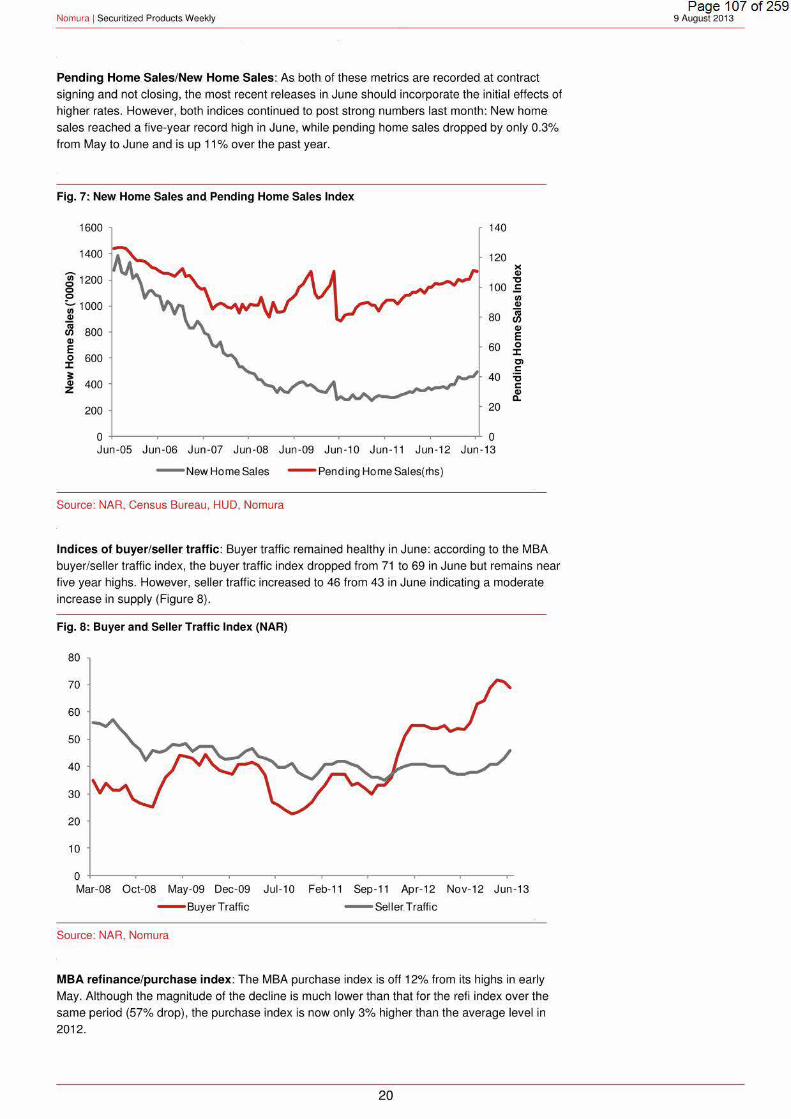
Pending. Home Sales/New Home. Sales : As. both. of these metrics are recorded at contract
signing and not closing, the. most recent releases in June. should incorporate the initial effects. of
higher. rates. However, both indices continued to post strong. numbers. last month: New home.
sales reached a five-year record high in June, while pending home sales dropped by only 0.3%.
from May to June and is up 11% over the past year.
Fig. 7~ New Home. Sales and Pending Home Sales Index
1600 140
1400 120 )( IV "C ~ 1200
g 100 .E
80 ~ 1000 IV
~ 800 60
IV E ~ 600 ~ ~ 400
40
200 20
0 0 Jun -05 Jun-06 Jun-07 Jun -08 Jun -09 Jun -10 Jun-11 Jun-12 Jun-13
- New Home. Sales - Pending Home Sales(rhs}
Source: NAR, Census Bureau, HUD, Nomura
VI IV
~ Cl1 E 0
::z::: Cl s::: "C s::: IV
11.
Indices. of buyer/seller traffic: Buyer traffic remained healthy in June: according to the MBA
buyer/seller traffic index, the buyer traffic index dropped from 71 to 69 in June but remains near
five year highs. However, seller traffic increased to 46 from 43 in June indicating a moderate
increase in supply (Figure 8).
Fig. 8:. Buyer and. Seller Traffic Index (NAR)
80
70
60
50
40
30
20
10
0 +-----~----~----~----~----.-----.-----.-----.------r Mar-08 Oct-08 May-09 Dec-09 Jul-10 Feb-11 Sep-11 Apr-12 Nov-12 Jun-13
- Buyer Traffic - Seller. Traffic
Source: NAR, Nomura
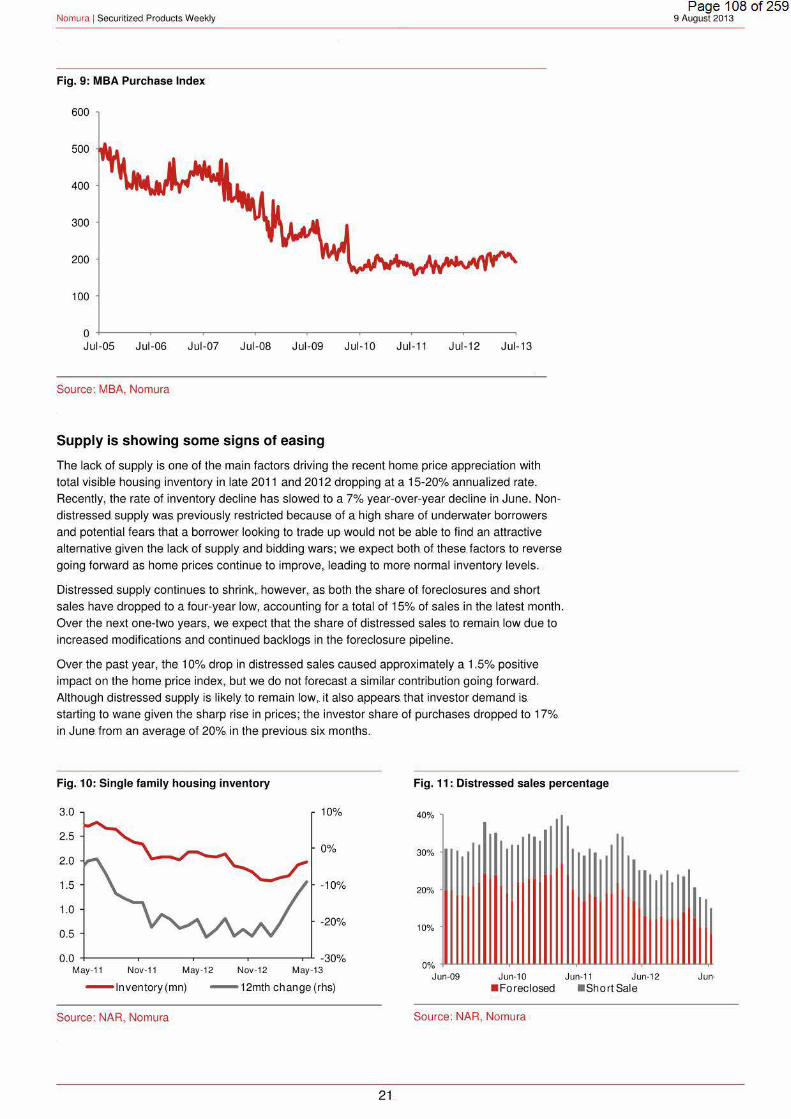
MBA refinance/purchase index: The MBA purchase index is off 12% from its highs in early
May. Although the magnitude of the decline is much lower than that for the refi index over the
same period (57% drop), the purchase index is now only 3% higher than the average level in
201 2.
20
Page 1 07 of 259 9 August. 2013
Nomura 1 Securitized Products Weekly
Fig. 9: MBA Purchase Index
600
500
400
300
200
100
0 +-----~------~-----.------,------,------~-----.r-----~ Jul-05 Jul-06 Jul-07 Jul-08 Jul-09 Jul-10 Jul-11 Jul-12 Jul-13
Source: MBA, Nomura
Supply is showing some signs of easing
The lack of supply is one of the main factors driving the recent home. price appreciation with.
total visible. housing inventory in late 2011 and 2012 dropping at a 15-20% annualized rate.
Recently, the rate of inventory decline has slowed to a 7% year-over-year decline. in June. Non
distressed supply was. previously restricted because of a high share of underwater borrowers
and potential fears that a borrower. looking to trade. up would not be able to find an attractive
alternative. given the. lack of supply and bidding wars; we. expect both. of these. factors. to reverse
going forward as home prices continue to improve, leading to more. normal inventory levels.
Distressed supply continues to shrink,. however, as both. the share of foreclosures and short
sales have. dropped to. a four-year. low,. accounting for a total of 15% of. sales. in the. latest month.
Over the next one-twe. years, we. expect that the share of distressed sales to remain low due to
increased modifications and continued backlogs in the foreclosure pipeline.
Over the past year, the. 1 0% drop in distressed sales caused approximately a 1.5% positive
impact on the home. price index,. but we do not forecast a similar contribution going forward ..
Although distressed supply is likely to. remain low,. it also. appears. that investor demand is.
starting. to wane. given the. sharp rise in prices; the. investor. share. of purchases dropped to 17%
in June. from an average of. 20% in the. previous. six months ..
Fig. 10: Single family housing inventory
3.0
2.5
2.0
1.5
1.0
0.5
10%
0%
-10%
-20%
Fig. 11 :. Distressed sales percentage
40%
30%
20%
10%
Page 1 08 of 259 9 August. 2013
0.0 -30% May-11 Nov-11 May-12 Nov-12 May-13
0"/o ~~~~LYULUU~~~~UL~~~LU~~¥
Jun-09 Jun-10 Jun-11 Jun-12 - lnventory(mn) - 12mth change (rhs) • Foreclosed • sho rt Sale
Source: NAR, Nomura Source: NAR, Nomura
21.
Nomura 1 Securitized Products. Weekly
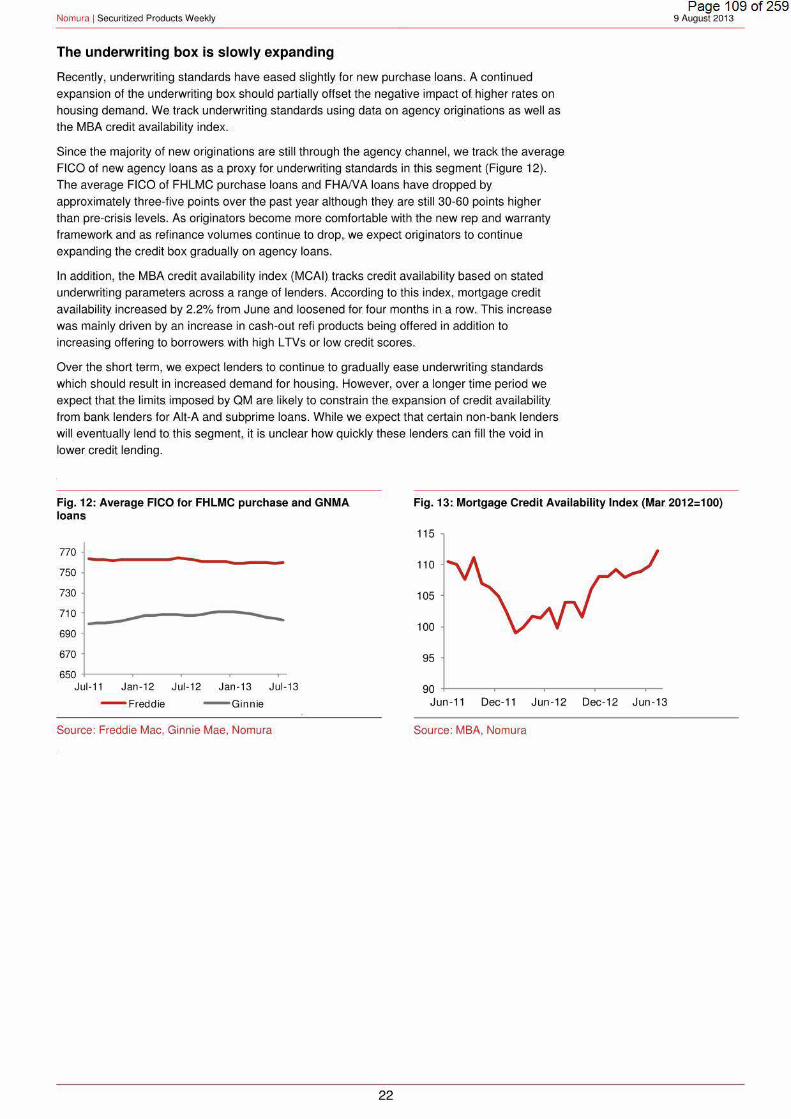
The underwriting box. is slowly expanding
Recently, underwriting standards have eased slightly. for new purchase loans. A continued
expansion of the underwriting box should partially offset the negative impact of. higher rates on
housing demand. We. track underwriting. standards using data on agency. originations as well as
the. MBA credit availabil ity index . .
Since the majority of new originations are stil l through the agency channel, we track the average
FICO of new agency loans as a proxy for underwriting standards. in this. segment (Figure 12). The. average FICO of FHLMC purchase loans. and FHAIV A loans. have. dropped by
approximately three-five points over the past year although they are still 30-60 points higher
than pre-crisis levels. As originators become more. comfortable with. the. new rep and warranty
framework and as. refinance volumes continue. to drop, we expect originators to continue
expanding the credit box gradually. on agency loans.
In addition, the. MBA credit availability index (MCAI) tracks credit availability based on stated
underwriting parameters across a range of lenders. According to this index,. mortgage credit
availability increased by 2.2% from June. and loosened for. four months. in a row .. This increase
was. mainly driven by an increase in cash-out refi. products being offered in addition to.
increasing offering to borrowers. with high L TVs. or. low credit scores ..
Over the. short term, we expect lenders. to continue. to. gradually ease underwriting standards
which. should result in increased demand for housing. However, over a longer time period we.
expect that the. limits. imposed by QM are likely to constrain the. expansion of credit availability
from bank lenders for Alt-A and subprime loans. While. we expect that certain non-bank lenders.
will. eventually lend to. this segment, it is unclear how quickly these lenders. can fill the void in
lower credit lending.
Page 1 09 of 259 9 August. 2013
Fig. 12: Average FICO for FHLMC purchase and. GNMA loans.
Fig. 13: Mortgage Credit Availability Index (Mar 2012=100)
770
750
730
710
690
670
----~---------------650 +------.-----.------.-----~
Jul-11 Jan-12 Jul-12 Jan-13 Jul·1 3
- Freddie - Ginnie
Source: Freddie Mac, Ginnie Mae, Nomura
22
115
110
105
100
95
90 +-----~------r------r-----.-Jun-11 Dec-11 Jun -1 2 Dec-12 Jun -13
Source: MBA, Nomura

Nomura 1 Securitized Products Weekly
Appendix
Fig. 1: Overall trading volume over the past six months
5.0
4.5
4.0 '2 .c 3.5 ~
~3.0 E ..2 2.5
g 2.0 iii 0 1.5 1-
1.0
0.5
0. 0 -t-.....--.....--.....---,--...,.--.--.---r---.---.----.---.--.---,---.c
- customer Buy - customer Sell
Source: TRACE, Nomura
Fig. 2~ Monthly change in. dealer position
4
3
2
l
0
( 1)
(2)
(3}
Page 11 0 of 259 9 August. 2013
Dealer to Dealer
Jul-12 Aug-12 Sep-12 Oct-12 Nov-12 Dec-12 Jan-13 Feb-13 Mar-13 Apr-13 May-13 Jun-13 Jul-13 Aug-13
•PRE-2005 • 2005-2007 • POST-2007
Source: TRACE, Nomura
Fig. 3: Composition of trading activity for the past two weeks for. Customer Buy (left} and Customer Sell (right} transactions
• IG 2004and earl ier • IG 2004 and earlier
• IG 2005-2007 IG 2005-2007
IG Post2007 IG Post2007
• Non-IG2004and • Non-IG2004and earlier earlier
• Non-IG2005-2007 • Non-IG2005·2007
Non-IGPost2007 Non -IG Post2007
Source: TRACE, Nomura
23
Nomura 1 Securitized Products Weekly
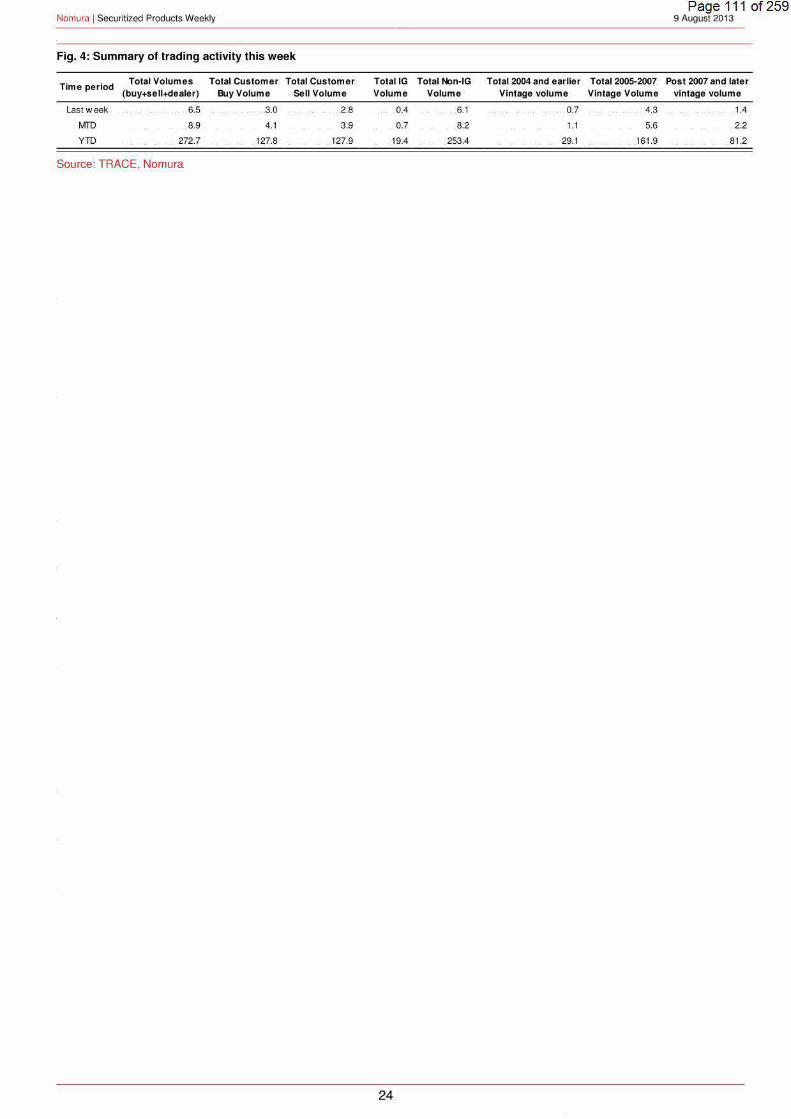
Fig .. 4: Summary of trading activity this. week
Time period Total Volumes. Total Customer Total Customer.
(buy+sell+dealer) Buy Volume Sell Volume
Last week 65 .. 3.0 ... 2.8
MTO 8.9 4.1 3.9
YID ... 272.7 .. 127.8 .. 127.9
Source: TRACE,. Nomura
TotaiiG Total Non·IG Volume Volume
.. ... .0.4 ..... 6.1
0.7 8.2
. 19.4 .253.4
24.
Total 2004 and earlier Total2005-2007 Vintage volume Vintage Volume
.. 0.7 4.3
1.1 5.6
29.1 ... 161.9
Page 111 of 259 9 August 2013
Post 2007 and later. vintage volume
1.4
2.2
.. 81 .2
Nomura 1 Securitized Products Weekly
CMBS Markets
Vornado, Skyline, Rouse
After a slow start to. the. week, CMBS spreads finished unchanged to marginally. tighter, despite
continued talk of Fed tapering, which caused equities to. trade. lower .. Benchmark GG 1 0 spreads
closed 2bp tighter on the week,. finishing. at 149bp over. swaps. The. focus. remained on new
issue. in the. early part of the week following the placement of WFRBS 2013-C15 .. New issue
paper was well bid and lower credit tranches priced moderately tighter than last week's
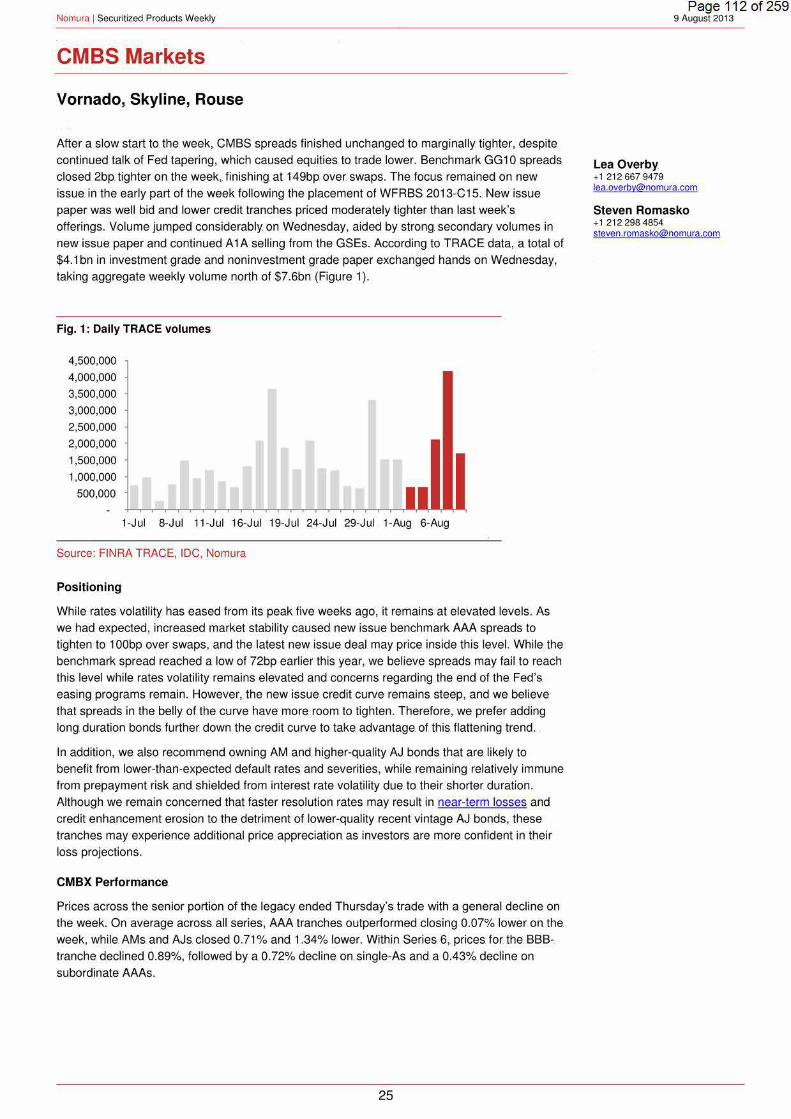
offerings. Volume jumped considerably. on Wednesday, aided by strong. secondary volumes in
new issue paper and continued A 1 A selling from the GSEs. According to TRACE data, a total of $4.1 bn in investment grade and non investment grade paper exchanged hands on Wednesday,
taking aggregate weekly volume north of $7.6bn (Figure 1 ).
Fig. 1: Daily TRACE volumes
4,500,000
4,000,000
3,500,000
3,000,000
2,500,000
2,000,000
1,500,000
1,000,000
500,000
1-Jul 8-Jul 11-Jul 16-Jul 19-Jul 24-Jul 29-Jul 1-Aug 6-Aug
Source: FINRA TRACE, IDC, Nomura
Positioning
While rates volatility has eased from its peak five weeks ago, it remains at elevated levels. As
we had expected, increased market stability caused new issue benchmark AAA spreads to
tighten to 1 OObp over swaps, and the latest new issue deal may price inside this level. While the
benchmark spread reached a low of 72bp earlier this year, we believe spreads may fail to reach
this level while rates volatility remains elevated and concerns regarding the end of the Fed's
easing programs remain. However, the new issue credit curve remains steep, and we believe
that spreads in the belly of the curve have more. room to. tighten . Therefore, we prefer adding.
long. duration bonds. further down the credit curve to take. advantage. of this flattening trend . .
In addition, we also recommend owning AM and higher-quality AJ bonds that are. likely to
benefit from lower-than-expected default rates and severities, while remaining relatively immune
from prepayment risk and shielded from interest rate volatility due to their shorter duration.
Although we remain concerned that faster resolution rates may result in near-term losses and
credit enhancement erosion to the detriment of lower-quality recent vintage AJ bonds, these
!ranches may experience additional price appreciation as investors are more confident in their
loss projections.
CMBX Performance.
Prices across the senior portion of the legacy ended Thursday's trade with a general decline on
the week. On average across. all. series, AAA !ranches. outperformed closing 0.07% lower on the.
week, while. AMs and AJs. closed 0.71% and 1.34% lower. Within Series 6,. prices for. the. 888-.
tranche. declined 0.89%, followed by a 0.72% decline. on single-As and a 0.43% decline on
subordinate AAAs.
25
Page 112 of 259 9. August 2013
lea Overby +1 2126679479. [email protected]
Steven Romasko + 1 212.298 4854 [email protected]
Nomura 1 Securitized Products Weekly
Fig. 2:. CMBX weekly price changes (through Thursday's close)
Page 113 of 259 9 August 2013
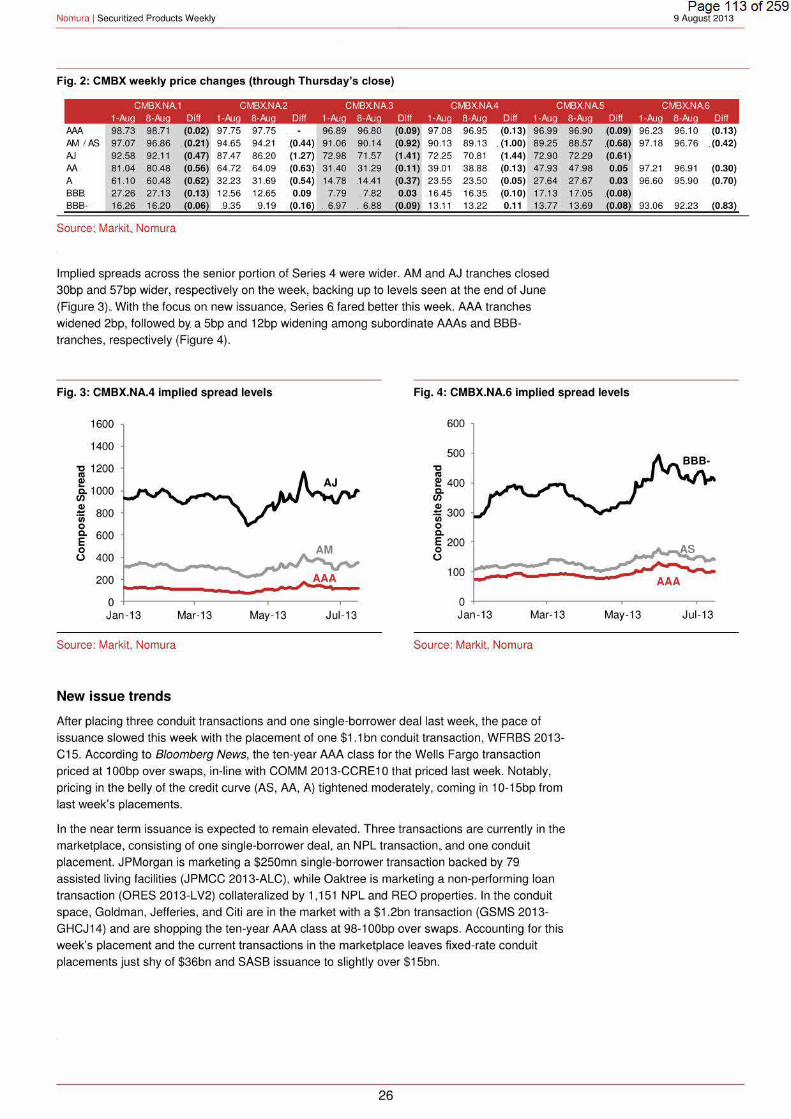
CMBXNA1 CMBXNA2 CMBXNA3 CMBXNA4 CMBXNA5 CMBXNA6 1-Aug 8-Aug D1ff 1-Aug 8-Aug Diff 1-Aug 8-Aug D1ff 1-Aug 8-Aug D1ff 1-Aug 8-Aug D1ff 1-Aug 8-Aug D1ff
AM 98.73 98.71 {0.02) 97.75 .97.75 96.89 96.80 (0.09) .9708 96.95 (0.13) 96.99 /JM I AS 97.07 96.86 {0.21) 94.65 94.21 (0.44) 91 .06 90.14 (0.92) 90.13 89.13 {1 .00) 89.25 AJ 92.58 92.11 (0.47) 87.47 86.20 (1 .27) 72.98 71.57 (1.41) 72.25 70.81 {1.44) 72.90 AA 81.04 80.48 (0.56) 64.72 64.09 (0.63) 31.40 31 .29 (0.11) 39.01 38.88 (0.13) 47.93 A 61.10 60.48 (0.62) 32.23 31.69 (0.54) .14.78 .14.41 (0.37) 23.55 23.50 (0.05) 27.64 BBB. 27.26 27.13 (0.13) 12.56 .12.65 0.09 7.79 . 7.82 0.03 16.45 16.35 (0.10) 17.13 BBB· 16.26 16.20 {0.06) .9.35 9.19 (0.16) . 6.97 . 6.88 (0.09) 13.11 13.22 0.11 13.77
Source: Markit, Nomura
Implied spreads across the senior portion of Series 4 were wider. AM and AJ tranches closed
30bp and 57bp wider, respectively on the week, backing up to levels seen at the end of June
(Figure 3) . With the. focus. on. new issuance, Series 6. fared better this week. AAA tranches
widened 2bp, followed by a 5bp and 12bp widening among subordinate AAAs and BBB
tranches, respectively (Figure 4).
.96.90 .(0.09) 88.57 (0.68) 72.29 (0.61) 47.98 0.05 27.67 0.03 17.05 (0.08) 13.69 {0.08)
Fig. 3: CMBX.NA.4 implied spread levels Fig. 4: CMBX.NA.6 implied spread levels
1600
1400
-g 1200 Q)
~ 1000 Q)
-~ 800 0 Q. 600 E 0 (.) 400
200
"0 cu
600
500
~ 400 Q. en Q)
-~ 300 0 Q.
E 200 0 (.)
100
.96.23 .96.1 0 (0.13) 97.18 96.76 (0.42)
97.21 96.91 (0.30) 96.60 95.90 (0.70)
93.06 92.23 (0.83)
0 +--------.---------.--------,- 0 +--------.--------~--------.-Jan -13 Mar-13 May-13 Jul-13 Jan-13 Mar-13
Source: Markit, Nomura Source: Markit, Nomura
New issue t rends
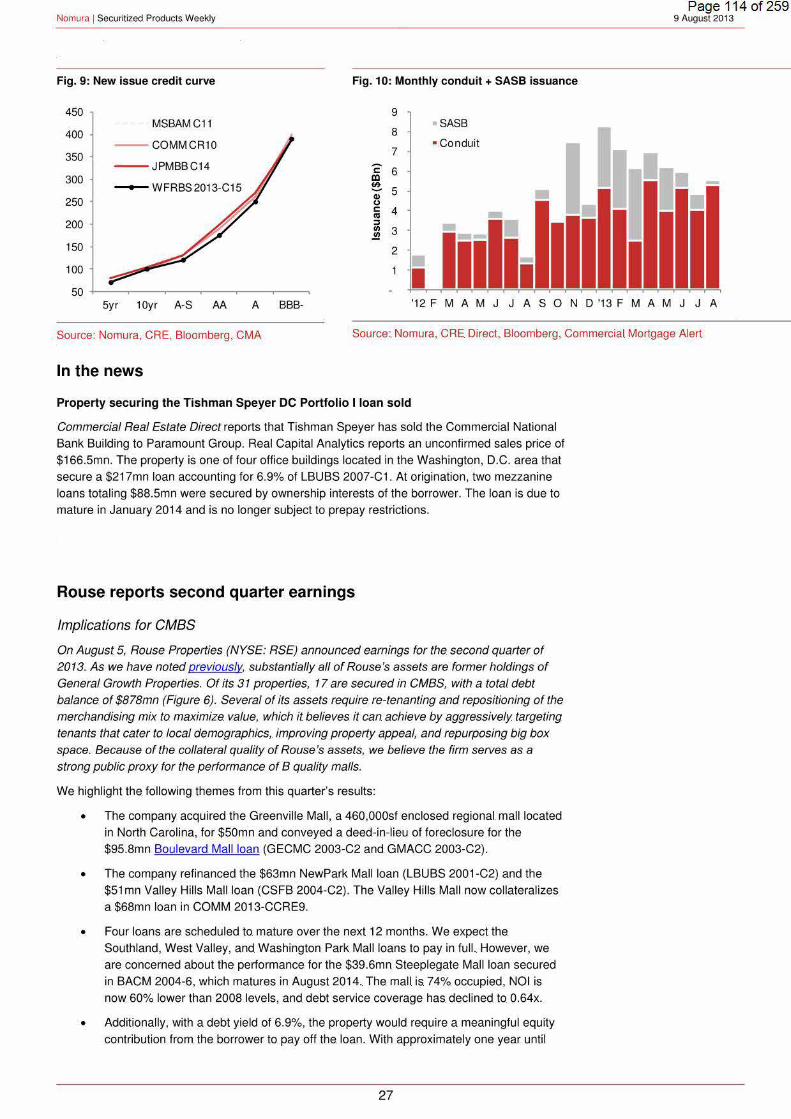
After placing three conduit transactions and one single-borrower deal last week, the pace of
issuance slowed this week with the placement of one $1 .1 bn conduit transaction, WFRBS 2013-
C15. According to Bloomberg News, the ten-year AAA class for the Wells Fargo transaction
priced at 100bp over swaps, in-line. with COMM 2013-CCRE 1 0 that priced last week. Notably,
pricing in the belly of the credit curve (AS, AA, A) t ightened moderately, coming in 1 0-15bp from
last week's placements.
In the near term issuance is. expected to remain elevated. Three transactions are currently in the
marketplace, consisting of one single-borrower deal,. an. NPL transaction,. and one. conduit
placement. JPMorgan. is marketing a $250mn. single-borrower transaction backed by 79.
assisted living facilities (JPMCC 2013-ALC), while Oaktree is marketing a non-performing loan
transaction (ORES 2013-LV2) collateralized by 1,151 NPL and REO properties. In the conduit
space, Goldman, Jefferies, and Citi are in the market with a $1.2bn transaction (GSMS 2013-
GHCJ14) and are shopping the ten-year AAA class at 98-100bp over swaps. Accounting for this
week's placement and the current transactions in the marketplace leaves fixed-rate conduit
placements just shy of $36bn and SASB issuance to slightly over $15bn.
26
May-13 Jul-13
Nomura 1 Securitized Products Weekly
Fig. 9:. New issue credit curve
450
400
350
300
250
200
150
100
MSBAMC11
--COMMCR10
--JPMBBC14
--WFRBS2013·C15
50 +---~--~----.----.--~~~
Fig. 10: Monthly conduit+ SASB issuance
9
8. • SASS
7 • Conduit
~
s:: 6 a:l ~ 5 • Q) u s:: 4 -CIS ::J -Vl 3 ~
2
Page 114 of 259 9 August. 2013
5yr 10yr A·S AA A BBB· '12 F M A M J J A S 0 N D '13 F M A M J J A
Source: Nomura,. CRE, Bloomberg, CMA Source: Nomura, CRE Direct, Bloomberg, Commercial Mortgage Alert
In the news
Property securing the Tishman Speyer DC Portfolio I loan sold
Commercial Real Estate Direct reports that Tishman Speyer has sold the Commercial National
Bank Building to Paramount Group. Real Capital Analytics reports an unconfirmed sales price of
$166.5mn. The property is one of four office buildings located in the Washington, D.C. area that
secure a $217mn loan accounting for 6.9% of LBUBS 2007-C1. At origination, two mezzanine
loans totaling $88.5mn were secured by ownership interests of the borrower. The loan is due to
mature in January 2014 and is no longer subject to prepay restrictions.
Rouse reports second quarter earnings
Implications for CMBS
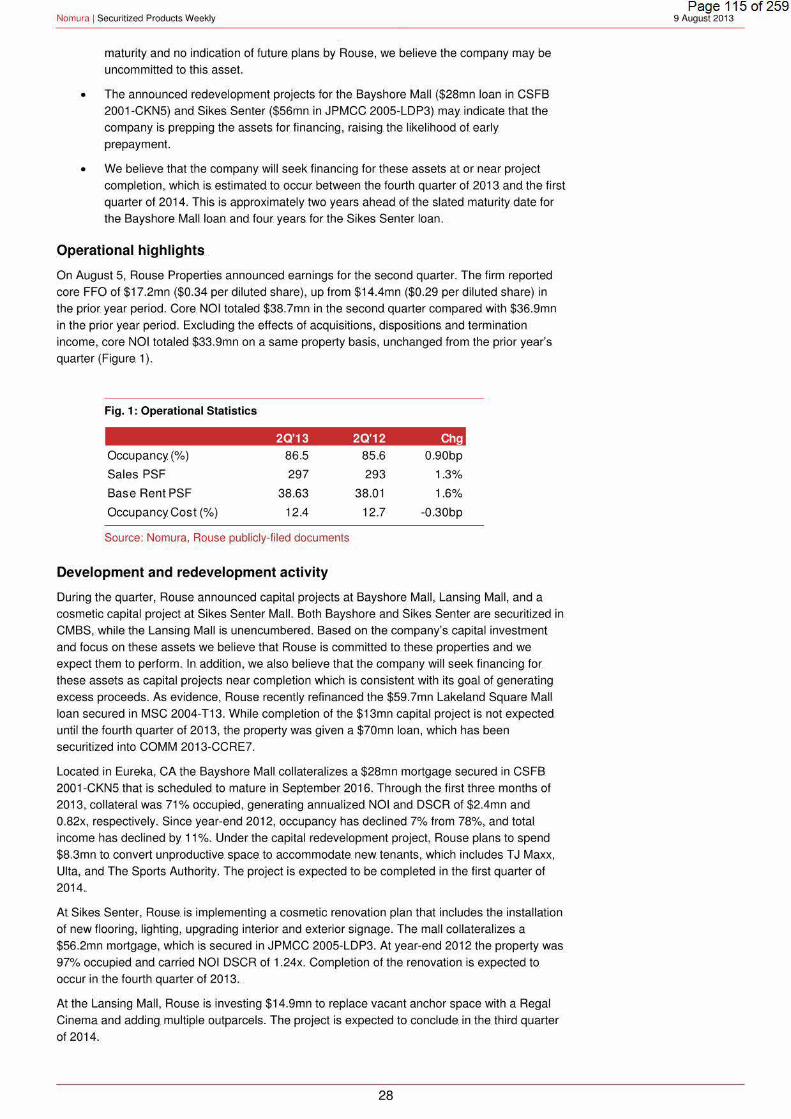
On August 5, Rouse Properties (NYSE: RSE) announced earnings for the. second quarter of
2013. As we have noted previously, substantially all of Rouse's assets are former holdings of
General Growth Properties. Of its 31 properties, 17 are secured in CMBS, with a total debt
balance. of $878mn (Figure 6). Several of its assets require re -tenanting and repositioning of the
merchandising mix to maximize. value, which it believes it can achieve by aggressively targeting
tenants that cater to local demographics, improving property appeal, and repurposing big box
space. Because of the collateral quality of Rouse 's assets, we believe the firm serves as a
strong public proxy for the performance of 8 quality malls.
We highlight the. following themes from this quarter's results:
• The company acquired the Greenville Mall, a 460,000sf enclosed regional. mall located
in North Carolina, for $50mn and conveyed a deed-in-lieu of foreclosure for the
$95.8mn Boulevard Mall loan (GECMC 2003-C2 and GMACC. 2003-C2).
• The company refinanced the $63mn NewPark Mall loan (LBUBS 2001-C2) and the
$51 mn Valley Hills Mall loan (CSFB 2004-C2) . The Valley Hills Mall now collateralizes
a $68mn loan in COMM 2013-CCRE9.
• Four loans are scheduled tO. mature over the next 12 months. We expect the.
Southland, West Valley, and Washington Park Mall loans to pay in fu ll.. However, we
are. concerned about the. performance for the. $39.6mn Steeplegate Mall loan secured
in BACM 2004-6, which matures in August 2014 .. The mall is. 74% occupied, NOI is
now 60% lower than 2008 levels, and debt service coverage has. declined tO. 0.64x.
• Additionally, with a debt yield of 6.9%, the property would require a meaningful equity
contribution from the borrower to pay off the. loan. With approximately one year until
27
Nomura 1 Securitized Products Weekly
maturity and no indication of future plans by Rouse, we believe the company may be
uncommitted to this. asset.
• The announced redevelopment projects for. the. Bayshore Mall ($28mn. loan in CSFB
2001-CKN5) and Sikes Senter ($56mn in JPMCC 2005-LDP3). may indicate that the
company is prepping. the assets. for financing, raising the likelihood of. early
prepayment.
• We believe. that the company will seek financing for these assets at or near project
completion, which. is. estimated to. occur. between the. fourth quarter of 2013 and the first
quarter of. 2014. This. is approximately two. years ahead of. the slated maturity date. for
the. Bayshore Malt loan and four. years for the Sikes Senter loan.
Operational highlights .
On August 5, Rouse Properties announced earnings for the second quarter. The firm reported
core FFO of $17.2mn ($0.34 per diluted share), up from $14.4mn ($0.29 per diluted share) in
the prior year period. Core. NOI totaled $38. 7mn in the second quarter compared with $36.9mn
in the prior year period. Excluding. the effects. of acquisitions, dispositions and termination
income, core NOI totaled $33.9mn on. a same property basis, unchanged from the prior year's
quarter (Figure 1 ).
Fig. 1: Operational Statistics
20'13 20'12 Chg
Occupancy(%) 86.5 85.6 0.90bp
Sales PSF 297 293 1.3%
Base Rent PSF 38 .63 38.01 1.6%
Occupancy Cost(%) 12.4 12.7 -0.30bp
Source: Nomura, Rouse publicly-filed documents
Development and redevelopment activity
During the quarter, Rouse announced capital projects at Bayshore Mall, Lansing Mall, and a
cosmetic. capital project at Sikes. Senter. Mall.. Both Bayshore and Sikes. Senter. are securitized in
CMBS,. while. the Lansing Mall is unencumbered. Based on the company's capital investment
and focus on these assets we. believe that Rouse is committed to. these. properties and we.
expect them to. perform. In addition,. we. also. believe that the. company will seek financing for.
these. assets as capital projects near completion which is. consistent with its goal of. generating
excess proceeds. As evidence, Rouse recently refinanced the $59.7mn Lakeland Square Mall
loan secured in MSC 2004-T13. While completion of the $13mn capital project is not expected
until the fourth quarter of 2013, the property was given a $70mn loan, which has been
securitized into COMM 2013-CCRE7.
Located in Eureka, CA the Bayshore Mall collateralizes a $28mn mortgage secured in CSFB
2001-CKN5. that is. scheduled to mature. in September 2016. Through the. first three. months of
2013,. collateral was 71% occupied, generating annualized NOI and DSCR of $2.4mn and
0.82x,. respectively. Since year-end 2012,. occupancy has. declined 7% from 78%,. and total
income has. declined by 11%. Under. the capital redevelopment project, Rouse. plans to. spend
$8.3mn to convert unproductive space to. accommodate. new tenants, which includes T J Maxx,
Ulta,. and The. Sports Authority. The. project is. expected to be completed in the. first quarter. of
2014 ..
At Sikes. Senter, Rouse. is implementing a cosmetic renovation plan that includes the installation
of new flooring, lighting, upgrading interior and exterior signage. The mall collateralizes a
$56.2mn mortgage, which is secured in JPMCC 2005-LDP3. At year-end 2012 the property was
97% occupied and carried NOI DSCR of 1.24x .. Completion of the. renovation is. expected to.
occur in the. fourth. quarter of 2013 . .
At the Lansing Mall, Rouse is investing $14.9mn to replace vacant anchor space with a Regal
Cinema and adding multiple outparcels. The project is expected to conclude. in the. third quarter
of 2014.
28
Page 115 of 259 9 August. 2013

Nomura 1 Securitized Products Weekly
Acquisition and disposition activity
Subsequent to the. quarter,. Rouse acquired the Greenville. Mall. for $50.3mn,. assuming. a
$41. 7mn mortgage. (not securitized). Located in North Carolina, the. 460,000sf mall generates in
line shopping sales of $375psf and is anchored by. Belks, JCPenney. and Dunham's. Sports.
According to Rouse the. asset is. the only enclosed regional mall within a 40 mile radius ..
On the disposition front, the company provided a deed-in-lieu of foreclosure The. Boulevard Mall
located in Las Vegas, NV .. As. we. have written previously, the property collateralizes a $95.8mn
mortgage securitized across GECMC. 2003-C2. and GMACC 2003-C2. The collateral. is 89%
occupied and produces NOI debt service coverage of 0.99x .. Based on current NOI and a
stressed cap rate. methodology, we. project a 20% to 30%.1oss. severity range for. this. asset.. .
Financing activity
During the quarter the company obtained financing for two loans. Consistent with our
expectation, Rouse refinanced the. $62.9mn NewPark Mall loan securitized in LBUBS 200 1-C2,
replacing. it with a $71.5mn,. four-year, non-recourse floating rate. loan with. a coupon of
Libor+405bp. It also placed a new $68mn non-recourse. mortgage loan on the. Valley Hills Mall
(COMM 2013-CCRE9), defeasing the. $52mn loan secured in CSFB. 2004-C2.
Rouse faces four upcoming maturities within the next 12 months, as the loans on Southland Mall, West Valley Mall, Washington Park Mall, and Steeplegate Mall come due (Figure 2). With
debt yields in excess of 12% for Southland, West Valley, and Washington Park, we believe that
Rouse will be able to successfully refinance these assets. However, we are concerned about
the impending maturity of the $39.6mn Steeplegate Mall loan.
Fig. 2: Rouse's upcoming maturity schedule
Deal Loan Name Pre a Bal $mn Loca t1on Occ % NOI DSCR DY Maturi
GCCFC 2004·GG1 Southland Mall (1) 71.9 Hayward, CA 91 11.11 1.93x 15.5%
BSCMS 2003-Tl2 West Val ley Mall (1) 47.1 Tracy, CA 94 6.18 1.31x 13.1%
WBCMT 2004-C12 Washington. Park Mall 11.0 Bartlesvil le, OK 95 1.60 1.81x 14.5%
BACM 2004-6 Steeplegate Mall (1) 39.6 Concord, NH 95 2.74 0.64x 6.9%
Source: Nomura, Trepp, Rouse publicly-filed documents
Steeplegate: a continual decline in occupancies and NO/
Scheduled to mature in August 2014, the Steeplegate Mall faces a variety of performance
issues. Through the first three months of 2013, the collateral generated annualized NOI of
$2.7mn which is sufficient to create five consecutive annual declines, an aggregate drop of 60%
since 2008. Over the same timeframe, occupancy has declined from 97% to 86% based on
remitted data (Figures 3 and 4). According to. Rouse's second quarter 2013. filings, mall
occupancy is substantially lower, totaling 74%. The substantial drop in occupancy is mainly
caused by the closure of Circuit City (7% of NRA), as well as national brands such as Gap and
Coach.4
Based on current NOI, cash flow is substantially. below debt coverage levels and the. asset's
current debt yield of 6.9% indicates. that refinancing would require a meaningful equity.
contribution from the borrower to right size the. value. Through the first quarter of 2013, the.
property generated NOI DSCR of 0.64x.
On the company's fourth quarter conference call in March, Rouse stated that cap rates forB
Malls, or mid-market malls, are transacting. in the 7% to 8% range. Applying a 7.5% cap rate. to.
current NOI indicates. a current valuation of $39.1 mn, roughly equivalent to. the. outstanding
debt.. This implies that the company would have. to. fund $16mn in equity to. reach a 65%. LTV,.
which. is the. conduit average for retail loans. securitized in 2013 .. While this. contribution would
sufficiently recapitalize the. asset, we believe. the property is. unlikely to obtain financing. in its
current condition without a capital investment plan.
• Ben Leubsdorf, "Gap's departure leaves hole", The Concord Monitor, 28 January 2011 , http ://www.concordmonitor.com/news/4592658-95/steepleqatemall-qap-coach-newsshop
29
Jan-14
Jan-14
Apr-14
Aug-14
Page 116 of 259 9 August 2013

Nomura 1 Securitized Products Weekly
With approximately one. year until. maturity and no indication of future. plans by Rouse, we.
believe the. company may be uncommitted to this asset. Barring. any substantial. leasing. activity
over the next year, we believe this asset faces heightened default risk at maturity.
Page 117 of 259 9 August 2013
Fig. 3~ Steeplegate NOI t rend since. securitizat ion Fig. 4~ Steeplegate occupancy trends
$8,000,000
$7,000,000
$6,000,000
$5,000,000
$4,000,000
$3,000,000
$2,000,000
$1 ,000,000
$0
60%decline in NO/ since
2008*
'04 '05 '06 '07 '08 '08 '09 '1 0 '11 '1 2 '13
*Based on 10' 13 annualized NOt
98
96
94
92
90
88
86
84
82
80 '04 '06 '08
Source: Nomura, Trepp Source: Nomura, Trepp
Assessing the likelihood of loan prepayment
Following. the resolution of these. four. assets, Rouse will have fulfil led its CMBS maturity
obligations until 2016 .. However, five. loans. within its. portfolio would still retain their. prepayment
option, as specified under GGP's bankruptcy resolution. Based on prior commentary, several.
factors influence Rouses decision to refinance an asset including:
• Decreasing the amount of recourse financing
• Reducing the weighted average interest rates
• Laddering and extending the debt maturity profi le
• Generating excess refinancing proceeds.
Using Rouse's criteria, we can estimate the likelihood of loan prepayment For our estimates,
we. apply a 7.5% cap rate to the most recent NOI to value. the properties and assume the. assets.
can secure takeout financing at a 65% LTV and a 4. 73% interest rate. We base our cap rate.
assumption on commentary from Rouse, our LTV estimate on historical data, and our interest
rate equates to the recent rate given to. the Valley Hills MaiL
At this. cap rate, all. five. of the remaining. loans carry a valuation in excess of their current loan
balance. However, none of these malls could refinance at a 65% LTV without an equity
contribution from the company. As a result, we believe that Rouse will likely concentrate its
financing efforts on the upcoming 2014 maturities (Southland and West Valley) and malls with a
current capital investment program, such as the Bayshore Mall and Sikes Senter. Thereafter,
the company may potentially invest the loan proceeds into the remaining malls to rehabilitate
the assets before refinancing (Figure 5).
Fig. 5: CMBS loans open to prepayment ($ in millions)
proceed Int . sav1ngs Prepay Bal Value@ s @ 65 Rem Current f romreh@ Net
Deal Loan Occ Smn Matun 1101 75%cap LTV Term(mo cpn % 473% Benefit
GCCFC04·GGt Southland Mall 90 71.9 Jan-14 11.1 148 24 5 3.62"/o (1) 24
BSCMS 03· T12 West Valley Mall 92 47. 1 Jan-14 6.5 87 9 5 3.43% (0) 9
BACM04-6 Steeplegate Mall 87 48.6 Aug-14 2.7 36 (25) 12 4.94% 1 (24)
LBUBSOH :::l Vista Ridge. Mall 93 72.4 Apr·16 7.4 98 (8) 32 6.87% 5 (3)
JFMCC0 1·CIB2 Collin C..eek Mall 97 61.0 Ju~16 5.0 67 (17) 35 6.78% 6 (11)
CSFB Ot -CKN5 Bayshore Mall 71 28.1 Aug-16 2.4 32 (7) 36 7.13% 3 (4)
GECM:: 05-C4 Grand Traverse Mall 83 60.8 Feb-17 5.6 74 (12) 42 5.02% 3 (10)
JFMCC05·LDP3 Sikes Senter 97 56.2 Jun-17 5.3 71 (10) 46 5.20% 3 (7)
Source: Nomura, Trepp
30
'09 '11 '13
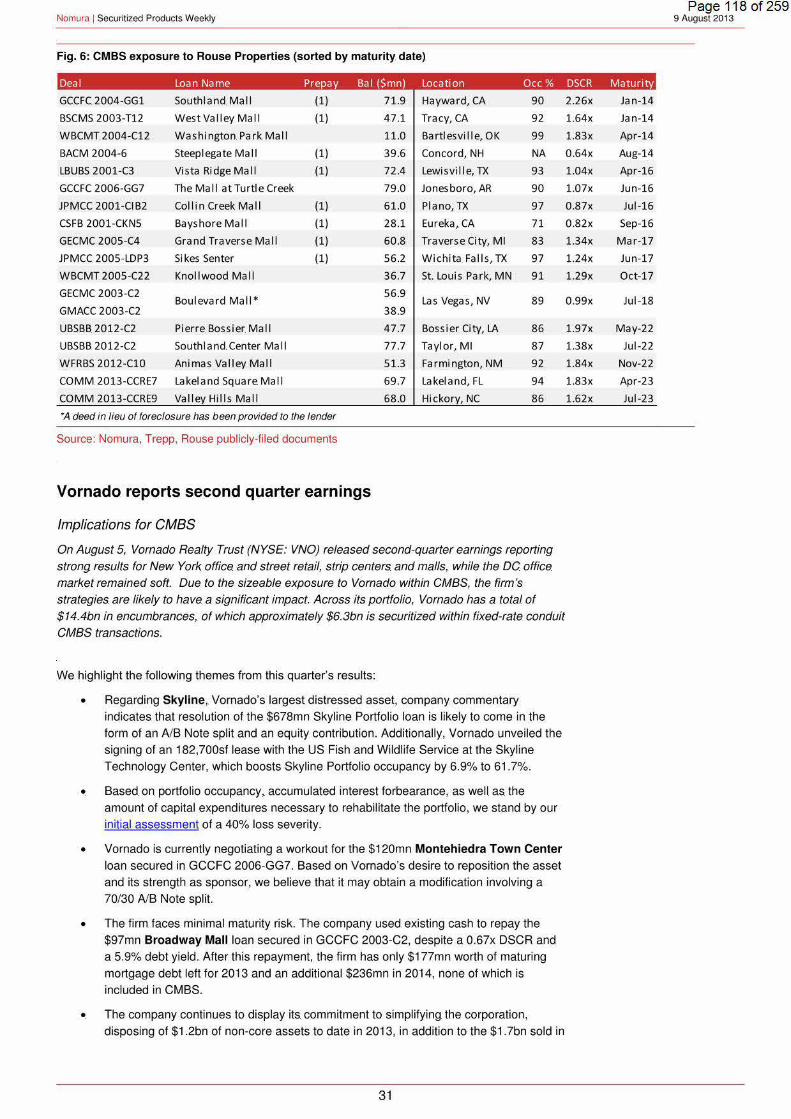
Nomura 1 Securitized Products Weekly
Fig. 6: CMBS exposure to Rouse Properties. (sorted by maturity date)
Deal loan Name Prepay Bal ($mn) locat1on Occ% DSCR Maturity
GCCFC 2004-GG1 Southland Ma l l (1) 71.9 Hayward, CA 90
BSCMS 2003-Tl2 West Va ll ey Ma l l (1) 47.1 Tracy, CA 92
WBCMT 2004-C12 Washington Park Mal l 11.0 Bartlesvi lie, OK 99
BACM 2004-6 Steeplegate Mall (1) 39.6 Concord, NH NA
l BUBS 2001-C3 Vista RidgeMal l (1) 72.4 lewisville, TX 93
GCCFC 2006-GG7 The Mall at Turtle Creek 79.0 Jonesboro, AR 90
JPMCC 2001-CIB2 Col l in Creek Mall (1) 61.0 Plano, TX 97
CSFB 2001-CKN5 Bayshore Mall (1) 28.1 Eureka, CA 71
GECMC 200S-C4 Grand. Traverse Ma II (1) 60.8 Traverse City, Ml 83
JPMCC 2005-l DP3 Sikes. Senter (1) 56.2 Wichita Falls, TX 97
WBCMT 2005-C22 Knollwood Mal l 36.7 St.louis Park, MN 91
GECMC 2003-C2 Boulevard Ma l l*
56.9 las Vegas, NV 89
GMACC 2003-C2 38.9
UBSBB. 2012-C2 Pierre Bossier. Mal l 47.7 Bossier City, LA 86
UBSBB 2012-C2 South I and. Center. Ma II 77.7 Taylor, Ml 87
WFRBS 2012-C10. Animas Valley Mall 51.3 Fa rmington, NM 92
COMM 2013-CCRE7 lakeland Square Ma l l 69.7 lakeland,. Fl 94
COMM 2013-CCRE9 Val ley Hills Ma ll 68.0 Hickory, NC 86
*A deed in lieu of foreclosure has been provided to the lender
Source: Nomura, Trepp, Rouse publicly-filed documents
Vornado reports second quarter earnings
Implications for CMBS
On August 5, Varnado Realty Trust (NYSE: VNO) released second-quarter earnings reporting
strong results for New York office and street retail, strip centers and malls, while the DC office market remained soft. Due to the sizeable exposure to Varnado within CMBS, the firm's strategies are likely to have a significant impact. Across its portfolio, Varnado has a total of $14.4bn in encumbrances, of which approximately $6.3bn is securitized within fixed-rate conduit CMBS transactions.
We highlight the following themes from this quarter's results:
• Regarding Skyline, Varnado's largest distressed asset, company commentary
indicates that resolution of the $678mn Skyline Portfolio loan is likely to come in the
form of an NB Note split and an equity contribution. Additionally, Vornado unveiled the
signing of an 182,700sf lease with the US Fish and Wildlife Service at the Skyline
Technology Center, which boosts Skyline Portfolio occupancy by 6.9% to 61.7%.
• Based on portfolio occupancy, accumulated interest forbearance, as well as. the
amount of capital expenditures necessary to rehabilitate the portfolio, we stand by our
initial assessment of a 40% loss severity.
• Vornado is currently negotiating a workout for the $120mn Montehiedra Town Center
loan secured in GCCFC 2006-GG7. Based on Varnado's desire to reposition the asset
and its strength as sponsor, we believe that it may obtain a modification involving a
70/30 NB Note split.
• The firm faces minimal maturity risk. The company used existing cash to repay the
$97mn Broadway Mall loan secured in GCCFC 2003-C2, despite a 0.67x DSCR and
a 5.9% debt yield. After this repayment, the firm has only $177mn worth of maturing
mortgage debt left for 2013 and an additional $236mn in 2014, none of which is
included in CMBS.
• The company continues to display its. commitment to simplifying the corporation,
disposing of $1.2bn of non-core assets to date in 2013, in addition to the $1.7bn sold in
31
2.26x Jan-14
1.64x Jan-14
1.83x Apr-14
0.64x Aug-14
1.04x Apr-16
1.07x Jun-16
0.87x Jul-16
0.82x Sep-16
1.34x Mar-17
1.24x Jun-17
1.29x Oct-17
0.99x Jul-18
1.97x May-22
1.38x Jul-22
1.84x Nov-22
1.83x Apr-23
1.62x Jul -23
Page 118 of 259 9 August 2013
Nomura 1 Securitized Products Weekly
2012. The. firm alsO. announced an. additional $500mn of. non-core. asset dispositions;
however,. we. believe that this. activity is concentrated among smaller. balance. retail
assets, and its. effect on CMBS is likely to. be. limited.
Operational. highlights
Varnado reported comparable Funds from Operations of $244mn for the quarter, or $1.30 per.
share, a 22%. increase. from the. prior. year's quarter. FFO gains are primarily attributed to. strong
EBITDA growth among the New York segment and modest growth within the retail. segment,
which offset a continuation. of poor. performance in the. DC market..
The fi rm reported $3.5bn in liquidity consisting of $1.1 bn of. cash and $2.4bn of undrawn
revolving credit facilities, a $1 bn increase from year-end 2012. The. liquidity build is attributed to
proceeds from asset sales and secured debt financing. In addition to the $1.7bn in non-core
assets sold in 2012, Varnado has. disposed of $1.2bn year to date. In the second quarter,
Varnado disposed of 12 assets, including. LNR, assets in San Jose,. Philadelphia, and a portfolio
of small. retail. assets ..
It also completed a $550mn refinancing of Independence Plaza (previously secured in COMM
2005-FL 11 and 2006-FL 12), generating $137mn in its share of proceeds. The company's
existing cash was used to. repay $149mn in mortgage debt, which included the $97mn
Broadway Mall loan that was. previously secured in GCCFC 2003-C2. The. firm has. only $177mn
worth of. maturing mortgage debt left for 2013 and an additional $236mn in 2014, none of which
is. included in CMBS.
Segment results
Varnado's portfolio of assets is divided into four major segments, comprising its New York
holdings of office. and retail properties, its. DC office portfolio and its portfolio of. retail. strip
centers and malls. The. firm also. retains a smaller segment of other assets. containing properties
such. as. the. Chicago Merchandise. Mart,. 555. California Street,. and its real estate. fund ..
Varnado's New York and Washington businesses together account for approximately 90% of
company EBITDA ...
The. New York segment produced $235.7mn of comparable EBITDA which is $28.2mn or
13.6%. ahead of last year's second. quarter .. The division benefited from. increased leasing
activity across all product segments, a decline. in subletting and broad demand from a variety of
tenants .. On the call it stated that, with a 12% availability rate, New York is near a "tipping point"
to becoming a landlord's market.
The 300,000sf of. sublease space put on the market by AXA at 1290 Avenue. of. the Americas
(VNDO 2012·6AVE) has. been leased, with. Morgan Stanley, Sirius,. and Remi Martin taking
space. The property is now 97.4% occupied.
Within its Retail segment, the strips and malls business generated $53.9mn of comparable
EBITDA, approximately 3% ahead of last year's second quarter. High barrier to entry locations
and strong anchors continue. tO. drive segment leasing . .
The Washington segment generated $84.8mn of comparable EBITDA in the three months.
ending June 2013, which is nearly 7% behind last year's second quarter. BRAG-related
vacancies and a sluggish lease. environment continue. to weigh. on the. performance of. this
segment. Segment occupancy declined by an additional 20bp from the. first quarter. to 83.6%,
impacted by a 54.8% occupancy rate at Skyline. Varnado expects the sluggish performance to
bottom in the third quarter, before rebounding in the fourth, causing full-year 2013 EBITDA to
come. in $10-$15mn lower than 2012.
Skyline to secure a new tenant and a modification
While Varnado's news on the Washington segment was generally negative, the firm reported
positive developments for the. Skyline Portfolio. During the earnings call, the company
announced that it is. in. the. process of signing an 182,700st lease. with the. United States Fish
and Wildlife Service. who wil l move. into Skyline Technology Center in mid-2014 .. The.
Washington Business Journal reported previously that Varnado was. in. contention for. the.
32
Page 119 of 259 9. August 2013.

Nomura 1 Securitized Products Weekly
$8.7mn lease.5 The building was fully vacated by BRAG in late 2011. With this lease, Varnado
will have re-leased over 54% of the 2mn sf of BRAC space that has expired to date. The signing
of the Fish and Wildlife Service will raise occupancy for Skyline by 6.9%, taking the overall level
to 61.7%. Fish and Wildlife will join Analytic Services who moved into 88,000 square feet earlier
this year. As we estimated last quarter, the addition of the Fish and Wildlife lease has the
potential to add $5.2mn to NOI ,. increasing DSCR levels. from 0.96x to 1.09x.
Background
As a refresher, this $896mn loan is securitized pari passu across three trusts,
GECMC 2007-1 , JPMCC 2007-LDPX and BACM 2007-1 .. The loan is
collateralized by a first mortgage on eight multi-story office. buildings containing
approximately 2.56mn sf located in Falls Church,. Virginia. At securitization the
portfolio was 97% occupied and generated $52.9mn in NOI resulting in 1.34x
debt service. coverage. The portfolio was largely impacted by the Base
Realignment and Closure (BRAG) statute, which required the Department of Defense to relocate from 2.4mn square feet in its buildings in Northern Virginia
to government-owned military bases.
As a result of. the consolidation, portfolio occupancy declined to 86% by year
end 2011. The loan was transferred to the special servicer, CW Capital, in the
first quarter of 2012, who executed an interest forbearance agreement for the
duration of the modification negotiations. which has accumulated to $47.5mn.
On the. call, Varnado indicated that it is in the final stages of negotiation and has an agreement
on the structure. of the. modification for this loan. According to the company:
" the arrangement will allow us to infuse the capital that's necessary to re-lease that building in approximately the middle of the capital stack of the loan where we think we have a secure interest ... the lender would also rather have us lease up the property ... than giving back the keys right now"
Varnado expects the modification documents to become public over the next two to three
months. The. commentary suggests that the special servicer wil l grant a modification in the form
of an AlB. note split , in line with our initial assessment in July 201 2 .. Based on portfolio
occupancy, the. size of the forbearance, as. well as the amount of capital expenditures
necessary to rehabilitate. portfolio, we stand by our initial assessment of a modification involving
an AlB note split, resulting in a 40% loss severity upon resolution.
Fig. 1: CMBS exposure to Skyline
Loan Deal Bal ($mn) Pet Occ '12 DSCR Maturity Skyline Portfolio
Source: Nomura, Trepp
GECMC 2007-C1
JPMCC 2007-LDPX BACM2007-1
Negotiating a modification for Montehiedra
678.0 203.4 203.4 271 .2
7%
5% 13%
58% 0.96x
On the conference call, Varnado noted that it is negotiating for a modification of. the $120mn
Montehiedra Town Center loan secured in GCCFC 2006-GG?, which transferred to the special
serving in June. According to the company, the. asset has deteriorated and is currently impacted
by several competing centers. Through the. first three months. of the year, the. asset reported an
NOI DSCR of 1.05x, down from 1.14x for. the full -year 2012. The. collateral is now 89%
occupied, down from 98% at securitization, and faces additional rollover risk with the Marshall
lease expiry in January 2014.
5 Daniel J.Semovitz,. "Arlington bracing for. loss of Fish and Wildlife headquarters", The Washington Business Journal, 13 June 2013, http://www.bizjournals.com/washington/breaking ground/2013/06/arlington-bracing-for-loss-ofsecond.html?page- all
33
Feb-17
Page 120 of 259 9 August 2013
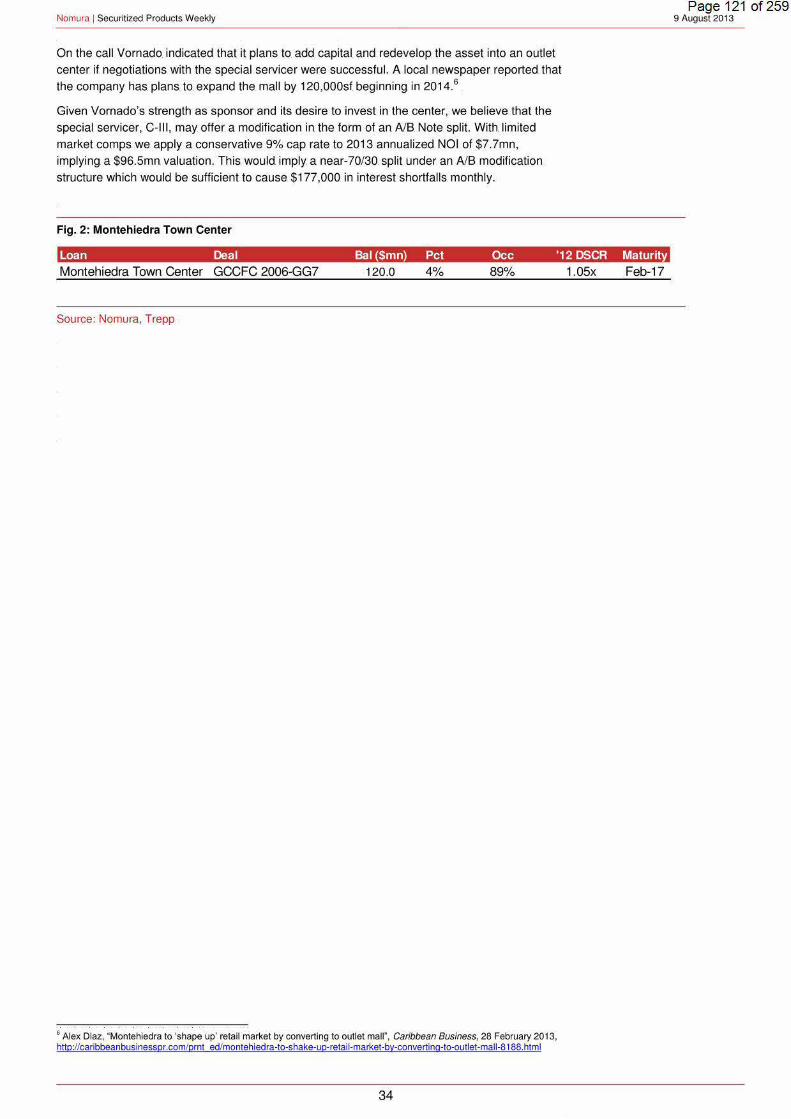
Nomura 1 Securitized Products Weekly
On the call Varnado. indicated that it plans to. add capital and redevelop the asset into an outlet
center if negotiations with the. special servicer were successfuL A local newspaper reported that
the company has. plans to. expand the mall by 120,000sf. beginning in 2014.6
Given Varnado's strength as sponsor and its desire to invest in the center, we believe that the
special servicer, C-111 , may offer. a modification in the form of an NB. Note split. With. limited
market comps we. apply a conservative 9% cap rate. to 2013 annualized NOI of $7.7mn,
implying. a $96.5mn valuation. This. would imply. a near-70/30. split under an NB modification
structure which. would be sufficient to cause. $177,000 in interest shortfalls. monthly.
Fig. 2: Montehiedra Town Center
Loan Deal Bal ($mn Pet Occ '12 DSCR Maturity Montehiedra Town Center GCCFC 2006-GG? 120.0 4% 89%
Source: Nomura, Trepp
6 Alex Diaz, "Montehiedra to 'shape up' retail market by converting to outlet mall", Caribbean Business, 28 February 2013, http ://caribbeanbusinesspr.com/prnt ed/montehiedra-to-shake-up-retail-market-by-converting-to-outlet-mall-8188.html
34
1.05x Feb-17
Page 121 of 259 9 August. 2013

Nomura 1 Securitized Products Weekly Page 122 of 259
9 August 2013
Disclosure Appendix A-1
ANALYST CERTIFICATIONS
Each research analyst identified herein certifies that all of the v iews expressed in this report by such analyst accurately reflect his or. her personal views about the subject securities and issuers. In addition, each research analyst identified on the cover page hereof hereby certifies that no part of his. or her compensation was, is, or will be,. directly or indirectly related to the specific. recommendations or views that he or she has. expressed in this research report, nor. is it tied to any specific investment banking transactions performed by Nomura Securities International, Inc .• Nomura International pic or any other Nomura Group company.
Important Disclosures. Online availability of research and conflict-of-interest disclosures Nomura research is. available. on www.nomuranow.com/research,. Bloomberg, CapitaiiQ, Factset, MarkitHub,. Reuters. and ThomsonOne. Important disclosures may be read at http://go.nomuranow.com/research/globalresearchportal/pages/disclosures/disclosures.aspx or requested from Nomura Securities International, Inc., on 1-877-865·5752. If you have any difficulties with the website, please email [email protected] for help.
The analysts responsible for preparing this report have received compensation based upon various factors including the firm's total revenues, a portion of which is generated by Investment Banking activities. Unless otherwise noted, the non-US analysts listed at the front of this report are not registered/qualified as research analysts under FINRNNYSE rules. may not be associated persons of NSI, and may not be subject to FINRA Rule. 2711. and NYSE Rule 472. restrictions. on communications. with covered. companies, public appearances, and trading. securities. held by a research analyst account.
Nomura Global Financial. Products Inc. ("NGFP") Nomura Derivative Products Inc .. ("NDPI") and. Nomura International pic. ("Niplc") are registered with the Commodities Futures Trading Commission and the National Futures Association (NFA) as swap dealers. NGFP, NDPI, and Nlplc are generally engaged in the trading of swaps and other derivative products, any of which may be the subject of this report.
ADDITIONAL DISCLOSURES REQUIRED IN THE U.S .. Principal Trading: Nomura Securities International, Inc and its affiliates will usually trade as principal in the fixed income securities (or in related derivatives) that are. the. subject of. this. research. report. Analyst Interactions with other. Nomura Securities. International .. Inc .. Personnel: The. fixed income research analysts of Nomura Securities International, Inc and its affiliates regularly interact with sales and trading desk personnel in connection with obtaining liquidity and pricing information for their respective coverage universe.
Valuation methodology • Fixed Income Nomura's Fixed. Income Strategists express views on the price of. securities and financial markets by providing trade. recommendations. These can be relative value recommendations, directional trade recommendations, asset allocation recommendations, or a mixture of all three. The analysis which is embedded in a trade recommendation would include, but not be limited to:. • Fundamental analysis regarding whether a security's price deviates from its underlying macro-. or. micro-economic. fundamentals .. • Quantitative analysis of. price variations. ·Technical factors such as regulatory changes, changes to risk appetite in the market, unexpected rating actions, primary market activity and supply/ demand considerations. The timeframe for a trade recommendation is variable. Tactical ideas have a short timeframe, typically less than three months. Strategic trade ideas have a longer timeframe of typically more than three months ..
Disclaimers This document contains material that has been prepared by the Nomura entity identified at the top or bottom of page 1 herein, if any, and/or, with the sole or joint contributions of one or more Nomura entities whose employees and their respective affil iations are specified on page 1 herein or identified elsewhere. in the. document. The. term "Nomura Group" used herein refers. to. Nomura Holdings, Inc .. or. any of. its affiliates. or. subsidiaries and may refer to one or more Nomura Group companies including: Nomura Securities Co., Ltd. ('NSC') Tokyo, Japan; Nomura International pic ('Niplc'), UK; Nomura Securities International, Inc. ('NSI'), New York, US; Nomura. International (Hong Kong) Ltd. ('NIHK'), Hong Kong; Nomura Financial Investment (Korea) Co., Ltd .. ('NFIK'), Korea (Information on Nomura analysts registered with the Korea Financial Investment Association ('KOFIA') can be found on the KOFIA Intranet at http://dis.kofia.or.kr) ; Nomura Singapore Ltd .. ('NSL'), Singapore (Registration number 197201440E, regulated by the Monetary Authority of Singapore); Nomura Australia Ltd. ('NAL'), Australia (ABN 48 003 032 513), regulated by the Australian Securities. and Investment Commission ('ASIC') and holder. of. an Australian financial services. licence. number. 246412;. P.T .. Nomura Indonesia ('PTNI'), Indonesia; Nomura Securities Malaysia Sdn. Bhd. ('NSM'), Malaysia; NIHK, Taipei Branch ('NITB'), Taiwan; Nomura Financial Advisory and Securities (India) Private Limited. ('NFASL'), Mumbai, India (Registered Address: Ceejay House, Level 11, Plot F, Shivsagar Estate, Or. Annie Besant Road, Worli , Mumbai· 400 018, India ; Tel: +91 22 4037 4037, Fax: +91 22 4037 4111; SEBI Registration No: BSE INB011299030, NSE INB231299034, INF231299034, INE 231299034, MCX: INE261299034) and Nlplc, Madrid Branch ('Niplc, Madrid'). 'CNS Thailand' next to an analyst's name on the front page of a research report indicates that the analyst is employed by Capital Nomura Securities Public Company Limited ('CNS') to. provide research. assistance. services. to. NSL under. a Research Assistance. Agreement. CNS. is not a Nomura entity. THIS MATERIAL IS: (I) FOR YOUR PRIVATE INFORMATION, AND WE ARE NOT SOLICITING ANY ACTION BASED UPON IT; (II) NOT TO BE CONSTRUED AS AN OFFER TO SELL OR A SOLICITATION OF AN OFFER TO BUY ANY SECURITY IN ANY JURISDICTION WHERE SUCH OFFER OR SOLICITATION WOULD BE ILLEGAL; AND (Ill) BASED UPON INFORMATION FROM SOURCES THAT WE CONSIDER RELIABLE, BUT HAS NOT BEEN INDEPENDENTLY VERIFIED BY NOMURA GROUP. Nomura Group does. not warrant or. represent that the. document is. accurate, complete, reliable, fit for. any particular purpose or. merchantable. and does not accept liability for any act (or decision not to act) resulting from use of this document and related data. To the maximum extent permissible all warranties and other assurances by Nomura group are hereby excluded and Nomura Group shall have no liability for the use, misuse, or distribution of this information. Opinions or estimates expressed are current opinions as of the original publication date appearing on this material and the information, including the opinions and estimates contained herein, are subject to change without notice. Nomura Group is under no duty to update th is document. Any comments. or. statements. made. herein are those of the author(s) and may differ. from views held by other parties within. Nomura Group .. Clients should consider whether any advice or recommendation in this report is suitable. for their particular circumstances and, if appropriate, seek professional advice, including tax advice. Nomura Group does not provide tax advice.
35
Page 123 of 259 Nomura 1 Securitized Products Weekly 9 August. 2013
Nomura Group, and/or its officers, directors and employees, may, to. the extent permitted by applicable law and/or. regulation, deal as principal, agent, or. otherwise, or. have long or short positions in, or. buy or. sell,. the. securities, commodities or. instruments, or options or other derivative instruments based thereon, of issuers. or securities mentioned herein. Nomura Group companies may also act as market maker or. liquidity provider (within. the. meaning of. applicable regulations in the. UK) in the financial instruments of the issuer. Where. the activity of market maker is carried out in accordance with the definition. given to it by specific laws and regulations of the US or other jurisdictions, this will be. separately disclosed within the specific issuer disclosures •. This document may contain information obtained from third parties, including. ratings from credit ratings agencies. such as Standard & Poor's. Reproduction and distribution of third party content in any form is prohibited except with the prior written permission of the related third party. Third party content providers do. not guarantee the. accuracy, completeness, timeliness. or availability of. any information, including ratings, and are not responsible for any errors. or omissions. (negligent or. otherwise), regardless of the. cause, or. for the. resu lts. obtained from the. use. of such content .. Third party content providers give no express or implied warranties, including, but not limited to, any warranties of. merchantability or fitness. for. a particular purpose or. use. Third party content providers shall not be liable. for any direct, indirect, incidental,. exemplary, compensatory, punitive,. special. or consequential. damages, costs,. expenses, legal fees, or losses (including lost income. or profits and opportunity costs) in connection with any. use of. their. content,. including ratings. Credit ratings are. statements. of opinions and are not statements of. fact or recommendations to. purchase hold or sell. securities. They do. not address. the. suitability of securities or. the suitability of. securities for investment purposes, and should not be relied on as. investment advice .. Any MSCI sourced information in th is document is the exclusive property of MSCI Inc. ('MSCI'). Without prior written permission of MSCI, this information and any other. MSCI. intellectual. property may not be. reproduced, re-disseminated or. used to. create any financial products, including any indices. This. information is. provided on an "as. is" basis .. The. user. assumes the. entire risk of any use made. of this. information .. MSCI, its. affiliates and any third party involved in, or related. to, computing or. compiling. the. information hereby expressly disclaim all. warranties of. originality, accuracy, completeness, merchantability or fitness for a particular purpose with respect to any of this. information. Without limiting any of the foregoing, in no. event shall. MSCI,. any of its affil iates. or any third party involved in, or. related to,. computing or. compil ing the. information have any liability for any damages of any kind. MSCI and the MSCI indexes are services marks of MSCI and its affi liates. Investors should consider. this document as only a single factor. in making. their. investment decision and,. as such,. the report should not be viewed as. identifying or suggesting. all risks,. direct or indirect, that may be. associated with any investment decision .. Nomura Group produces a number. of different types of research product including, among others, fundamental analysis, quantitative analysis and short term trading ideas; recommendations contained in one type of. research product may differ from recommendations contained in other types of research product, whether as a result of differing time horizons,. methodologies or. otherwise .. Nomura Group publishes research product in a number of different ways including the posting of product on. Nomura Group portals and/or distribution directly to clients. Different groups of. cl ients may receive different products and services. from the. research department depending on their individual. requirements. Clients. outside. of the. US. may access. the. Nomura Research Trading. Ideas platform (Retina) at http://go.nomuranow.com/equities/tradingideas/retina/ Figures presented herein may refer to past performance or simulations based on past performance which are. not re liable. indicators of. future. performance. Where. the information contains an indication of future performance, such forecasts may not be a reliable indicator of. future. performance. Moreover,. simulations. are based on models. and simplifying assumptions which may oversimplify and not reflect the future distribution of returns. Certain securities. are. subject to fluctuations. in exchange rates. that could have. an. adverse. effect on the. value. or price of,. or income derived from, the. investment. The. securities. described herein may not have been registered under. the US Securities Act of 1933. (the '1933 Act'), and, in such case, may not be offered or sold in the. US or. to US persons unless they have. been registered under the 1933. Act, or. except in compliance with an exemption from the. registration requirements of the 1933. Act Unless. governing law permits otherwise, any transaction should be. executed via a Nomura entity in your home jurisdiction. This document has. been approved for distribution in the. UK and European Economic. Area as. investment research by Nlplc. Nlplc is authorised by the Prudential Regulation Authority and regulated by the. Financial Conduct Authority and the Prudential Regulation Authority. Nlplc is a member of the London Stock Exchange. This document does not constitute. a personal recommendation within the meaning of applicable regulations in the UK,. or. take into. account the. particular investment objectives, financial situations,. or needs. of individual. investors. This. document is. intended only for investors. who. are. 'eligible counterparties' or. 'professional. clients'. for. the purposes of applicable regulations in the. UK,. and may not,. therefore,. be redistributed to persons who. are 'retail clients' for such purposes. This document has been approved by NIHK, which is regulated by the Hong Kong. Securities. and Futures. Commission, for distribution in. Hong Kong by NIHK. This document has. been. approved for distribution in Australia by NAL,. which is. authorized and regulated in Australia by the ASIC. This document has also been approved fo r distribution in Malaysia by NSM. In Singapore, this document has been distributed by NSL. NSL accepts legal responsibil ity for the content of this document,. where it concerns securities,. futures and foreign exchange, issued. by their. foreign affiliates in respect of recipients who are not accredited,. expert or. institutional. investors. as. defined by the Securities. and Futures Act (Chapter 289). Recipients of this document in Singapore should contact NSL in respect of matters arising from, or. in connection with, this document.. Unless prohibited by the provisions of Regulation S of the. 1933 Act, this material is distributed in the. US, by NSI,. a US-registered broker-dealer,. which accepts responsibility for its. contents. in accordance. with the. provisions of Rule. 15a-6, under the US Securities. Exchange Act of 1934. This document has not been approved for distribution to persons other than 'Authorised Persons', 'Exempt Persons' or. ' Institutions' (as defined by the Capital. Markets Authority) in the Kingdom of Saudi Arabia. ('Saudi Arabia') or. to clients other. than 'professional. clients'. (as defined by the Dubai Financial Services Authority) in the United Arab Emirates ('UAE') by Nomura Saudi Arabia, Nlplc or. any other. member of Nomura Group,. as the. case. may be. Neither. this. document nor. any copy thereof may be. taken or. transmitted or distributed, directly or indirectly, by any person other than those authorised to do so into Saudi Arabia or in the UAE or to any person other than 'Authorised Persons', 'Exempt Persons' or 'Institutions' located in Saudi Arabia or to clients other than 'professional cl ients' in the UAE. By accepting to receive. this document,. you represent that you are not located in Saudi. Arabia or that you are an 'Authorised Person', an 'Exempt Person' or an ' Institution' in Saudi Arabia or. that you are. a 'professional. client' in the. UAE and agree to. comply with these. restrictions .. Any failure. to comply with these restrictions. may constitute a violation of the laws of. the. UAE or Saudi. Arabia .. NO PART OF THIS MATERIAL MAY BE (I) COPIED, PHOTOCOPIED, OR DUPLICATED IN ANY FORM, BY ANY MEANS; OR (II) REDISTRIBUTED WITHOUT THE PRIOR WRITTEN CONSENT OF A MEMBER OF NOMURA GROUP .. If this document has been distributed by electronic transmission, such as e-mail, then such transmission cannot be guaranteed to be secure or error-free. as. information could be intercepted, corrupted, lost, destroyed, arrive late. or incomplete, or contain viruses. The sender. therefore does. not accept liability for any errors or omissions in the contents of this document, which. may arise as. a result ot electronic. transmission. If verification is required, please request a hard-copy version. Nomura Group manages conflicts with respect to the production of research through its compliance policies and procedures (including, but not limited to, Conflicts. of Interest,. Chinese. Wall. and Confidentiality policies} as well. as. through the. maintenance. of Chinese walls. and employee training. Additional information is available upon request and disclosure information is available at the Nomura Disclosure web page: http://go.nomuranow.com/research/globalresearchportal/pages/disclosures/disclosures.aspx Copyright© 2013. Nomura Securities International. Inc ... All rights reserved.
36.