Embed Size (px)
Citation preview

Investor Presentation
October 2016

Industry Overview

INDUSTRY SIZE AND STRUCTURE
Perfumed Hair Oil Segment
FMCG
Rs. 2,58,122 cr
Hair Care
Rs. 19,064 cr
Shampoo
Rs. 5,678 cr
(30%)*
Perfumed Oil
Rs. 6,411 cr
(34%)*
Coconut Based Oil
Rs. 3475 cr
(18%)*
Hair Conditioners
Rs. 461 cr
(2%)*
Hair Dyes
Rs. 3,038 cr
(16%)*
Hair Oil Market
Coconut based Oils
(35%)**
Amla
based Oils
(15%)**
Light Hair Oils
(16%)** Cooling Oils
(9%) **
Others
(25%)**
MAT MAR 16
* Value based share of Hair Care Market
** Value based share of Hair Oil Market
7% CONTRIBUTION

610 710
831
1,080
1,311
1,474 1,503 1,602
802
0
200
400
600
800
1,000
1,200
1,400
1,600
1,800
08-09 09-10 10-11 11-12 12-13 13-14 14-15 15-16 16-17 YTD Sep
18.4 19.9
22.4
26.8 30.0
31.9 31.0 32.3
16.2
0.0
5.0
10.0
15.0
20.0
25.0
30.0
35.0
08-09 09-10 10-11 11-12 12-13 13-14 14-15 15-16 16-17 YTD Sep
4,498 5,044
5,728
6,981 7,867
8,676 9,278
9,886
4,923
0
2,000
4,000
6,000
8,000
10,000
12,000
08-09 09-10 10-11 11-12 12-13 13-14 14-15 15-16 16-17 YTD Sep
197 214
236 238 247 269
251 253
127
0
50
100
150
200
250
300
08-09 09-10 10-11 11-12 12-13 13-14 14-15 15-16 16-17 YTD Sep
Hair Oil Market in India
Overall Hair Oil Market – Volume Overall Oil Market – Value
Light Hair Oil – Volume Light Hair Oil – Value
Hair Oils category is declining slightly as compared to H1 FY16. LHO segment shows slight value growth. Source: AC Nielsen Retail Audit Report, Sept 2016; LHO nos. adjusted from 15-16 for like to like comparison
3
(In ‘
000 K
Ltr
)
(Rs.
Cr.
)
H1-O
-H1 -
0.9
%
(In ‘
000 K
Ltr
)
H1-O
-H1 –
2.3
%
H1-O
-H1
0.2
%
H1-O
-H1
1.2
%
(Rs.
Cr.
)

284 360
441
594
746
861 897 964
480
0
200
400
600
800
1,000
1,200
08-09 09-10 10-11 11-12 12-13 13-14 14-15 15-16 16-17 YTD Sep
8.1 9.6
11.0
13.9
16.3 18.1 17.9 18.7
9.3
0.0 2.0 4.0 6.0 8.0
10.0 12.0 14.0 16.0 18.0 20.0
08-09 09-10 10-11 11-12 12-13 13-14 14-15 15-16 16-17 YTD Sep
Light Hair Oil Market in India
Almond Drops Hair Oil Market - Volume Almond Drops Hair Oil Market - Value
Bajaj Almond Drops shows slight drop in volume & value in H1
(Rs.
Cr.
)
4
Light Hair Oil – Volume Light Hair Oil – Value
(In ‘
000 K
Ltr
)
(Rs.
Cr.
)
(In ‘
000 K
Ltr
)
Source: AC Nielsen Retail Audit Report, Sept 2016; LHO nos. adjusted from 15-16 for like to like comparison
H1-O
-H1 -
1.5
%
H1-O
-H1 -
0.3
%
18.4 19.9
22.4
26.8 30.0
31.9 31.0 32.3
16.2
0.0
5.0
10.0
15.0
20.0
25.0
30.0
35.0
08-09 09-10 10-11 11-12 12-13 13-14 14-15 15-16 16-17 YTD Sep
610 710
831
1,080
1,311
1,474 1,503 1,602
802
0
200
400
600
800
1,000
1,200
1,400
1,600
1,800
08-09 09-10 10-11 11-12 12-13 13-14 14-15 15-16 16-17 YTD Sep
H1-O
-H1
0.2
%
H1-O
-H1
1.2
%

Market Shares Trends in Light Hair Oil Category (All India -
Urban Plus Rural)
Source: AC Nielsen Retail Audit Report, Sept 2016
Market Share in the Light Hair Oil Category, LHO nos. adjusted from 15-16 for like to like comparison.
Volume MS Value MS
5
44.1% 48.0% 49.1%
51.9% 54.4%
56.6% 57.7% 58.0% 57.0%
0.0%
10.0%
20.0%
30.0%
40.0%
50.0%
60.0%
70.0%
08-09 09-10 10-11 11-12 12-13 13-14 14-15 15-16 16-17 YTD Sep
47%
51% 53%
55% 57% 58% 60% 60% 59.9%
0%
10%
20%
30%
40%
50%
60%
70%
08-09 09-10 10-11 11-12 12-13 13-14 14-15 15-16 16-17 YTD Sep

6
Market Shares Trends in Total Hair Oil Category (All India -
Urban Plus Rural)
Source: AC Nielsen Retail Audit Report, Sept 2016
4.1% 4.5%
4.7%
5.8%
6.6% 6.7% 7.1%
7.4% 7.3%
0.0%
1.0%
2.0%
3.0%
4.0%
5.0%
6.0%
7.0%
8.0%
08-09 09-10 10-11 11-12 12-13 13-14 14-15 15-16 16-17 YTD Sep
6.3%
7.1% 7.7%
8.5%
9.5% 9.9% 9.7% 9.7% 9.7%
0.0%
2.0%
4.0%
6.0%
8.0%
10.0%
12.0%
08-09 09-10 10-11 11-12 12-13 13-14 14-15 15-16 16-17 YTD Sep
Volume MS Value MS

ADHO – Relative Market Share – Value Trend
Strong Relative market share demonstrates the strength of the brand
Relative Market share is the ratio of Bajaj Almond Drops market
share to the next largest competitor in LHO segment
7
Source: AC Nielsen Retail Audit Report, Sept 2016; LHO nos. adjusted from 15-16 for like to like comparison
2.1
2.7
3.2 3.4
4.0 4.3 4.2 4.3
4.5
0.0
0.5
1.0
1.5
2.0
2.5
3.0
3.5
4.0
4.5
5.0
08-09 09-10 10-11 11-12 12-13 13-14 14-15 15-16 16-17 YTD Sep
Relative MS Value

ADHO – Relative Market Shares – Value
Source – AC Nielsen Retail Audit Report, Sept 16
Relative Market share is the ratio of Almond Drops market share value to the next largest competitor in LHO segment
Rank is the position of ADHO in respective state
8
States Relative Market
Share Rank
Delhi 3.7 1
Rajasthan 1.6 1
Punjab 3.2 1
HP-JK 3.6 1
Haryana 4.4 1
NZ 2.9 1
Madhya Pradesh 3.7 1
Chhattisgarh 6.9 1
UP 3.3 1
Uttaranchal 4.0 1
CZ 3.8 1
Assam 4.6 1
Bihar 10.2 1
Jharkhand 7.5 1
States Relative
Market Share Rank
North East 2.2 1
Orissa 6.5 1
WB 2.6 1
EZ 5.5 1
Maharashtra 4.5 1
Mumbai 3.2 1
Gujarat 2.0 1
WZ 3.2 1
AP 1.3 1
Karnataka 5.0 1
Kerala 1.3 1
TN 1.0 1
SZ 1.9 1
All India 4.5 1

Statewise Market Share
Source: AC Nielsen Retail Audit Report, Sept 16
9
16-17 YTD Sep LHO Volume ADHO Proportion % (Vol) ADHO Market Share % (Vol)
Saliency Urban Rural Total Urban Rural
All India 100.0% 57 43 57.0 54.5 60.7
Delhi 6.1% 100 0 54.3 54.3
Raj 6.0% 53 47 46.5 51.1 42.3
Punjab 4.0% 69 31 54.5 52.7 59.2
Har 6.4% 76 24 58.4 55.2 71.2
HP-JK 0.5% 43 57 50.3 47.2 52.9
MP 10.0% 51 49 56.7 56.0 57.5
Chattisgarh 3.6% 42 58 70.3 62.8 76.9
UP 25.1% 43 57 60.6 58.2 62.5
Uttar 1.1% 55 45 57.9 52.5 66.3
Assam 3.1% 39 61 65.8 59.7 70.4
Bihar 8.0% 45 55 77.9 72.4 83.2
JharKhand 1.6% 56 44 69.3 67.1 72.4
North East 1.4% 58 42 40.5 37.9 44.6
Orissa 1.9% 54 46 67.5 61.9 75.6
WB 7.2% 58 42 42.6 39.9 47.1
Guj 4.1% 68 32 52.9 49.2 62.4
Maha 7.1% 73 27 58.1 58.4 57.4
AP 1.1% 88 12 50.1 51.2 42.8
Kar 1.2% 75 25 65.6 63.6 72.5
Kerala 0.1% 86 14 28.9 31.2 19.8
TN 0.3% 99 1 33.9 36.5 4.3

Light Hair Oil Market – Key Characteristics
Rural –Urban break up of LHO market Share of Distribution Channels in LHO market
SKU wise break up of LHO market Region wise break up of LHO market
Urban dominated
segment due to its
relatively higher
pricing
50ml and above
SKUs contribute
the maximum in
the repertoire.
Sales tend to be
concentrated in
the Central part of
the country
Grocers dominate
distribution
10
Source: AC Nielsen Retail Audit Report, YTD Sept 2016
61%
39%
AI Urban AI Rural
3%
8% 5%
6%
78%
Modern Trade Pan Plus Chemists Cosmetics Grocers
10%
23%
36%
32%
0-15 ml 16-50 ml 51-100 ml >100 ml
25%
36%
24%
11%
3%
NZ CZ EZ WZ SZ

Company Overview

Bajaj Corp Ltd. (BCL) – An
Overview
Part of Bajaj Group which has business interests
in varied industries including sugar, consumer
goods, power generation & infrastructure
development
Subsidiary of Bajaj Resources Ltd. (BRL)
BCL is the exclusive licensee of brands
owned by BRL
Brands licensed to BCL for 99 years from
2008
Key brand – Bajaj Almond Drops Hair Oil
2nd largest brand in the overall hair oils
segment
Market leader with 59.9% market share* of
LHO market
Premium positioning commands one of the
highest per unit prices in the industry
New Product Launch: Bajaj Amla Hair Oil
Other brands - Brahmi Amla, Bajaj Kailash Parbat
Cooling Oil and Jasmine (all hair oil brands),
Black tooth powder and skincare products under
Nomarks brand.
Bajaj Almond Drops Hair Oil - A premium perfumed
hair oil containing almond oil and Vitamin E
Competitors – Keo Karpin (Dey’s Medical), Hair &
Care (Marico), Clinic All Clear (HUL)
Bajaj Brahmi Amla Hair Oil - Traditional heavy hair
oil. Brand has been in existence since 1953
Competitors - Dabur Amla, Dabur Sarson Amla
Bajaj Amla – Variant in the low price amla hair oil
segment catering to price conscious consumers
Competitors - Shanti Badam Amla Hair Oil (Marico)
Bajaj Jasmine Hair Oil - A Jasmine flower perfumed
hair oil. In demand due to cultural significance.
Bajaj Kala Dant Manjan – An oral care product for
the rural market.
*Source: AC Nielsen Retail Audit Report, YTD Sept 2016.
Bajaj Kailash Parbat Cooling Oil – An ayurvedic
formulation containing Sandal & Almond extracts
Competitors: Himani Navratna
12
Haircare Portfolio

Bajaj Nomarks Creams for
Normal Skin, Oily Skin & Dry Skin Types, available in
sizes 12g(Normal skin) & 25g
Bajaj Nomarks Facewash for
Clear Glowing Fairness (50g) & Neem Facewash (15g, 50g & 100g)
Bajaj Nomarks Soaps
Herbal Scrub Soap and Neem Soap, available in sizes 125g
Bajaj Nomarks Exfoliating Scrub (50g)
& Bajaj Nomarks Face Pack (25g)
Skincare Portfolio

Bajaj Almond Drops - A Premium Brand
Source: AC Nielsen Retail Audit
Report Sept 2016 Almond Drops has created a unique positioning for itself through initiatives like product differentiation
(Almond based), focused marketing, unique packaging (glass vs. plastic used by competition etc.)
. . . But not at the cost of pricing power
Comparative Price of Different Brands for 100 ml in the Hair Oil Segment
Strong Market Share (Val) Growth in Recent Years
(MR
P o
f 100m
l (R
s.)
Competitor Brands
14
[VALUE]
42
60 60
30
45 56 42
50
66
0
10
20
30
40
50
60
70
Amla Hair Oil
Brahmi Amla Almond Drops
Kailash Parbat
Parachute Keo Karpin Dabur Vatika Dabur Amla Hair & Care Navratna
47% 51% 53% 55% 57% 58% 60% 60% 59.9%
0%
10%
20%
30%
40%
50%
60%
70%
08-09 09-10 10-11 11-12 12-13 13-14 14-15 15-16 16-17 YTD Sep

Consumer Profile- Bajaj Almond Hair Drops Oil Users
For Light Hair Oils, the consumer is skewed towards SEC A,B and younger age
group.
— Gender
Male- 43%
Female- 57%
— Age Group
25 to 35 yrs ( 58% of users)
— Socio Economic Class (SEC)- Urban
A – 21%
B – 36%
C – 30%
Source – Last U&A (2012) 15

Strong Distribution Network
Over the years, BCL has created a large distribution network (that continues to grow) which can be
leveraged to introduce new products
Factory (8)
OWN – Himachal Pradesh -2, Uttarakhand- 1
THIRD PARTY - Himachal Pradesh-2, Bangladesh-1, Uttarakhand- 2
Central Warehouse (1)
Regional Distribution Centre (29)
Urban Distribution Rural Distribution
Redistribution Stockist
1,590
Retail Outlets 1470185
Super Stockist - 225
Sub-Stockist 5940
Retail Outlets - 2196733
Distribution Network Distribution Structure
16
Strong Distribution Network
The company reaches
consumers through 3.6mn
retail outlets serviced by
7751 distributors (including
MT stockists) and 13818
wholesalers

Van Operations
Started in FY 13 with a objective of increasing Rural Sales
Piloted 39 Vans in Q4 FY 13
Currently operating 109 vans (for Sales)
Vans cover 7328 uncovered Towns and Villages on a monthly basis
For YTD Sept 16,
— Bajaj Almond Drops Hair Oil got 43.1 % of its sales from Rural India (Vol
offtake)
— Volume Growth in Rural India – 0.2% (Urban + Rural = -1.5%)
— Market share vol in Rural India – 60.7% (Urban + Rural = 57%)
17
*Source: AC Nielsen Retail Audit Report, Sept 2016.

Chairman
Mr. Kushagra Nayan Bajaj
Managing Director
Mr. Sumit Malhotra
President Operations
Mr. Apoorv Bajaj
CFO
Mr. V.C. Nagori
VP - Finance
Mr. D.K. Maloo
Company
Secretary –
Hitesh
Kanani
Head-
Treasury
3 Works
Manager
(3 MUs)
Head-
QC &
R&D Sr. Mgr
Plng &
Distribution
Head
Regional
Commercial
Manager- 5
in No's
DGM –South &
West
AGM -
North
AGM-
East
GM –IT
Mr. Dharmesh
J. Sanghavi
GM- Operations
Mr. Kabir Sahni
Head IB
Mr. Pankaj
Banerjee
Mktg Head A
Dangi
VP – HR
Mr. Subhamay
Chatterjee
Sales Head
R Ghosh
DGM Key Acts.
AGM / Sr.
Mgr-
Finance
Organization Structure
18
AGM -
Central
Mr Manoj
Gupta Head
Internal
Audit
Country
Manager-
Bangladesh,
Nepal, GCC and
SEAN
Head -
Purchase
Mr. Subroto
Ghosh
Head – Supply
Chain &
Procurement
Mr. Devendra Jain
President- Sales &
Marketing -
Mr.Sandeep Verma
AGM
L&D
DGM ESS
Sr.
Manager
Payroll
Category
Managers
Head Legal
Mr. Ashish Kr.
Panigrahi

Financial Information
Summary Income Statement Summary Balance Sheet
Brandwise Sales Break-Up for Qtr 2 FY 2017 Key Highlights
Strong demonstrated growth track record
Among the highest EBITDA margins in the
industry
19
Particulars Q2FY17 Q2FY16 HY 1 FY 17 HY 1 FY 16
Sales (Net) 196.15 189.57 399.88 389.71
EBITDA 68.30 65.75 140.36 133.13
EBITDA Margin 34.82% 34.68% 35.10% 34.16%
Profit Before Tax & Exceptional Item
80.81
71.54
158.91
143.52
Exceptional Item (Trademark & Intellectual Properties)
6.64
11.75
18.38
23.49
Profit Before Tax(PBT)
74.17
59.79 140.53
120.03
Net Profit after Tax 58.30 47.03 110.50 94.42
Net Profit Margin 29.72% 24.81% 27.63% 24.23%
Particulars As on 30.09.2016
As on 31.03.2016 (Rs. In Crore)
Shareholders Equity 596.31 485.82
Net Fixed Assets 46.57 65.59
Investments
(including Bank FDs, Bank CDs and Government Securities & Bonds) 535.08 414.93
Net Current Assets 14.66 5.30
ADHO 92.4%
KPCO 0.1%
BAHO 1.6%
AHO 1.9%
JHO 0.6%
BTP 0.1%
NOMARKS 3.3%
(Rs. In Crore) (Rs. In Crore)

EBITDA & PAT Performance
20
Rs. in Crore
Particulars Q2FY17 Q2FY16 YoY% HY 1 FY
17 HY 1 FY
16 YoY%
EBITDA 68.30 65.75 3.87% 140.36 133.13 5.43%
Profit Before Tax & Exceptional Item
80.81 71.54 12.96% 158.91 143.52 10.72%
Exceptional Item (Trademark & Intellectual Properties)
6.64 11.75 18.38 23.49
Profit Before Tax (PBT)
74.17 59.79 24.05% 140.53 120.03 17.08%
Profit After Tax (PAT) 58.30 47.03 23.95% 110.50 94.42 17.03%

Profit & Loss Q2 and I Half FY2017
21
Rs. in Crore
Particulars Q2FY17 Q2FY16 YoY% HY 1 FY 17 HY 1 FY 16 YoY% Net Sales 196.15 189.57 3.47% 399.88 389.71 2.61% Other Operating Income 0.63 0.55 1.21 1.28 Material Cost 66.17 72.98 136.56 150.24 % of Sales 33.74% 38.50% 34.15% 38.55% Employees Cost 14.64 11.20 28.46 22.32 % of Sales 7.47% 5.91% 7.12% 5.73% Advertisement & Sales Prom. 26.94 19.19 53.40 43.74 % of Sales 13.73% 10.12% 13.35% 11.22% Other Expenses 20.73 21.00 42.31 41.56 % of Sales 10.57% 11.08% 10.58% 10.66% EBITDA 68.30 65.75 3.87% 140.36 133.13 5.43% % of Sales 34.82% 34.68% 35.10% 34.16% Other Income 14.92 7.79 23.28 14.43 Finance Cost 0.22 0.01 0.42 0.02 Depreciation 1.09 0.96 2.11 1.96 Corporate Social Responsibility 1.10 1.03 2.20 2.06 Profit Before Tax & Exceptional Item 80.81 71.54 12.96% 158.91 143.52 10.72% Exceptional Item (Trademark & Intellectual Properties) 6.64 11.75 18.38 23.49 Profit Before Tax(PBT) 74.17 59.79 24.05% 140.53 120.03 17.08% Tax Expenses 15.87 12.76 30.03 25.61 Profit After Tax(PAT) 58.30 47.03 23.95% 110.50 94.42 17.03% % of Sales 29.72% 24.81% 27.63% 24.23% Basic & Diluted EPS (Rs.) 3.95 3.19 7.49 6.40

Sales for the quarter ended September’16 has increased by 3.47%.
Sales for the half year ended September’16 has increased by 2.61%.
Sales Performance
22
189.57 196.15
0
50
100
150
200
250
Q2 FY16 Q2 FY17
In `
Cro
res
Sales (Value) : Q2FY16 v/s Q2FY17
389.71 399.88
0
50
100
150
200
250
300
350
400
450
HY1 FY16 HY1 FY17
In `
Cro
res
Sales (Value) : HY1 FY 16 v/s FY1 FY17

Statement of Quarter wise Sales (Volume & Value)
STATEMENT OF QUARTERWISE SALES (VOLUME - In Cases )
STATEMENT OF QUARTERWISE SALES (VALUE - In Rs. Crores)
23
ADHO KPCO BAHO AHO Nomarks Others Total
FY 17 FY 16 FY 17 FY 16 FY 17 FY 16 FY 17 FY 16 FY 17 FY 16 FY 17 FY 16 FY 17 FY 16
Q1
1,269,703
1,241,928
7,483
7,435
11,801
14,073
45,072
49,630
29,195
40,210
8,081 7,538
1,371,335
1,360,814
Q2
1,210,568
1,191,034
2,107
1,856
15,376
16,751
40,865
45,290
27,225
41,136
7,640 8,445
1,303,780
1,304,512
Total
2,480,271
2,432,962
9,590
9,291
27,177
30,824
85,937 94,920
56,420 81,346
15,721 15,983
2,675,115
2,665,326
ADHO KPCO BAHO AHO Nomarks Others Total
FY 17 FY 16 FY 17 FY 16 FY 17 FY 16 FY 17 FY 16 FY 17 FY 16 FY 17 FY 16 FY 17 FY 16
Q1
188.72
183.11
0.64
1.29
2.36
2.68
4.18
4.27
6.37
7.57
1.46
1.22
203.73
200.13
Q2
181.18
172.57
0.17
0.23
3.10
3.23
3.79
3.83
6.54
8.28
1.37
1.43
196.15
189.57
Total
369.90
355.68
0.81
1.52
5.46
5.91
7.97
8.10
12.91
15.85
2.83
2.65
399.88
389.71
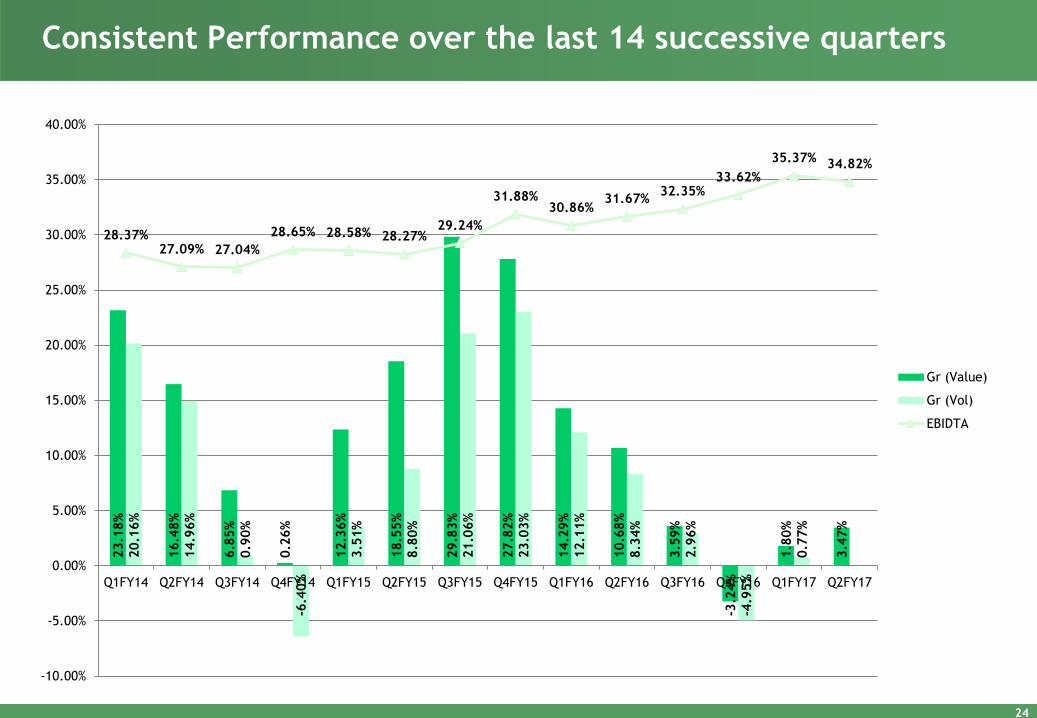
Consistent Performance over the last 14 successive quarters
24
23.1
8%
16.4
8%
6.8
5%
0.2
6%
12.3
6%
18.5
5%
29.8
3%
27.8
2%
14.2
9%
10.6
8%
3.5
9%
-3.2
4%
1.8
0%
3.4
7%
20.1
6%
14.9
6%
0.9
0%
-6.4
0%
3.5
1%
8.8
0%
21.0
6%
23.0
3%
12.1
1%
8.3
4%
2.9
6%
-4.9
5%
0.7
7%
28.37% 27.09% 27.04%
28.65% 28.58% 28.27% 29.24%
31.88% 30.86%
31.67% 32.35%
33.62%
35.37% 34.82%
-10.00%
-5.00%
0.00%
5.00%
10.00%
15.00%
20.00%
25.00%
30.00%
35.00%
40.00%
Q1FY14 Q2FY14 Q3FY14 Q4FY14 Q1FY15 Q2FY15 Q3FY15 Q4FY15 Q1FY16 Q2FY16 Q3FY16 Q4FY16 Q1FY17 Q2FY17
Gr (Value)
Gr (Vol)
EBIDTA

Breakup of RM/PM Costs (for Q2 FY 17)
* Consumption is 34.02% of Sales
*For Bajaj Almond Drops
25
Key Raw & Packing Material % to Sales % to Total Cost
LLP 8.17% 24.02%
Glass Bottles 9.17% 26.94%
Refined Veg. Oil 4.37% 12.86%
Perfumes & other additives 3.59% 10.55%
Corrugated Boxes 1.79% 5.25%
Caps 2.03% 5.95%
Others 4.91% 14.43%
TOTAL 34.02% 100.00%

Change in Prices of Key Ingredients
During the quarter average price of LLP decreased to Rs 44.55/Kg from Rs 58.82/Kg in corresponding
quarter of previous year.
Prices of Refined Oil decreased to Rs 78.41/Kg from Rs 82.02/Kg in corresponding quarter of previous
year.
26
58.82 59.30 44.55 44.22
0
20
40
60
80
100
Qtr2 FY16 vs FY17 HY1 FY16 vs FY17
Am
ou
nt
(Rs
.)
Per Kg Rates of LLP
82.02 77.64 78.41 77.13
0
20
40
60
80
100
Qtr2 FY16 vs FY17 HY1 FY16 vs FY17
Am
ou
nt
(Rs
.)
Per Kg Rates of Oil

Fund Position
Fund Position:
The total Fund available with the company as on 30th September’ 2016
is Rs. 414.45 Crores
This has been invested in Bank Fixed Deposits, AAA rated PSU Bonds, Commercial
Papers, Government Securities and Liquid MFs.
There is no investment in ANY Inter Corporate Deposit
27
Particulars Amount (Rs. in Crores)
Bank FDs 7.98
Bonds 400.47
Liquid Plans of Mutual Funds 6.00
Total 414.45

Dividend Payout History
Year No. of Shares
(in Lacs)
Face
Value
Dividend Payout
(Rs in Lacs) % to Capital
Dividend per
share
(Rs.)
2015-16 1,475 1 16962.50 1150% 11.50
2014-15 1,475 1 16962.50 1150% 11.50
2013-14 1,475 1 9,587.50 650% 6.50
2012-13 1,475 1 9,587.50 650% 6.50
2011-12 1,475 1 5,900.00 400% 4.00
2010-11 295 5 2,802.50 190% 9.50
28

Managerial Bandwidth
As a constant endeavour to add to the Managerial capabilities within the company
we constantly engage in in-house and out bound training programs
Further to make all the functions better equipped in terms of bench strength the
company is also in the process of recruiting experienced managers from well
known FMCG companies
In this process – Mr. Sandeep Verma has joined the organisation as President-
Sales & Marketing. He is an Mechanical Engineer from Motilal Nehru Engineering
College, Allahabad and holds a Management Degree from IIM, Lucknow. Mr. Verma
has worked more than 14 years in different function in HUL.
Mr. Sandeep Verma will lead the Sales & Marketing Department and contribute
towards the company’s change management process.
29

Corporate Governance
Bajaj Corp Ltd is a part of the Bajaj Group of companies. The other listed entity
in the group is Bajaj Hindusthan Sugar Ltd
Bajaj Corp Ltd has not and will not transfer funds from and to any other company
within the Bajaj Group
The Company acquired in September 2011 (Uptown Properties) owns a piece of
land and building in Worli, Mumbai. Uptown Properties was previously owned by
the C.K. Raheja Group (i.e. Mr. Chandu Raheja)
The corporate Headquarters of Bajaj Corp Ltd will be constructed on this land.
The Construction is expected to be completed by end of 2017.
The Bajaj Group is well aware of issues regarding Corporate Governance and
would like to state that there will be no financial interaction between any of the
listed entities within the group.
30
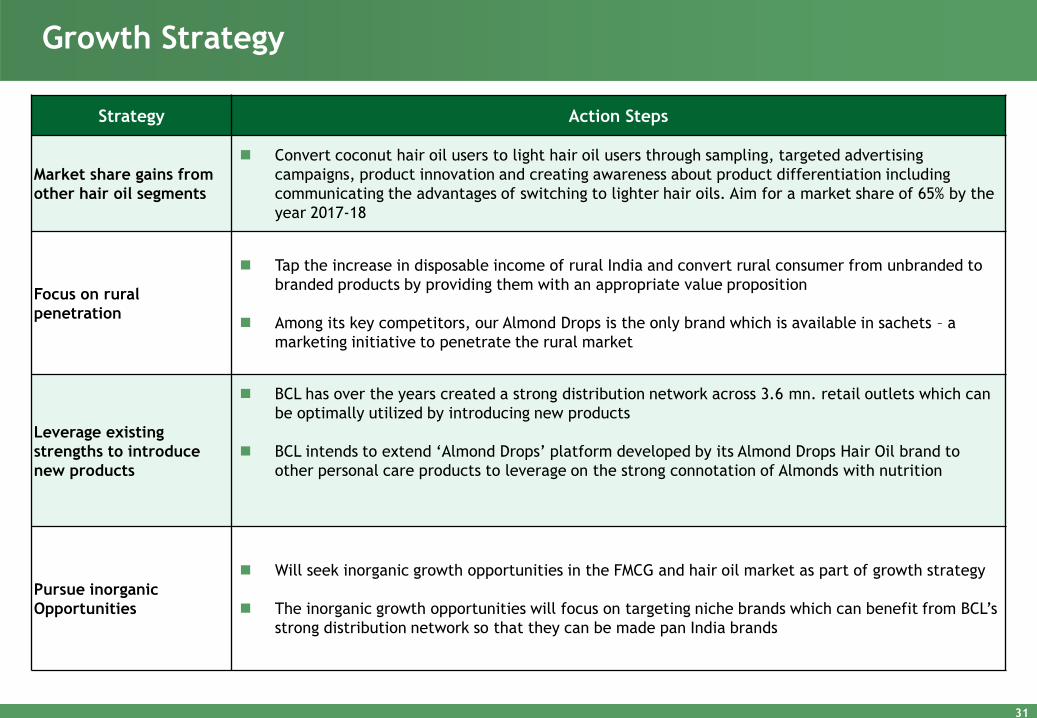
Growth Strategy
Strategy Action Steps
Market share gains from
other hair oil segments
Convert coconut hair oil users to light hair oil users through sampling, targeted advertising
campaigns, product innovation and creating awareness about product differentiation including
communicating the advantages of switching to lighter hair oils. Aim for a market share of 65% by the
year 2017-18
Focus on rural
penetration
Tap the increase in disposable income of rural India and convert rural consumer from unbranded to
branded products by providing them with an appropriate value proposition
Among its key competitors, our Almond Drops is the only brand which is available in sachets – a
marketing initiative to penetrate the rural market
Leverage existing
strengths to introduce
new products
BCL has over the years created a strong distribution network across 3.6 mn. retail outlets which can
be optimally utilized by introducing new products
BCL intends to extend ‘Almond Drops’ platform developed by its Almond Drops Hair Oil brand to
other personal care products to leverage on the strong connotation of Almonds with nutrition
Pursue inorganic
Opportunities
Will seek inorganic growth opportunities in the FMCG and hair oil market as part of growth strategy
The inorganic growth opportunities will focus on targeting niche brands which can benefit from BCL’s
strong distribution network so that they can be made pan India brands
31