Embed Size (px)
Citation preview
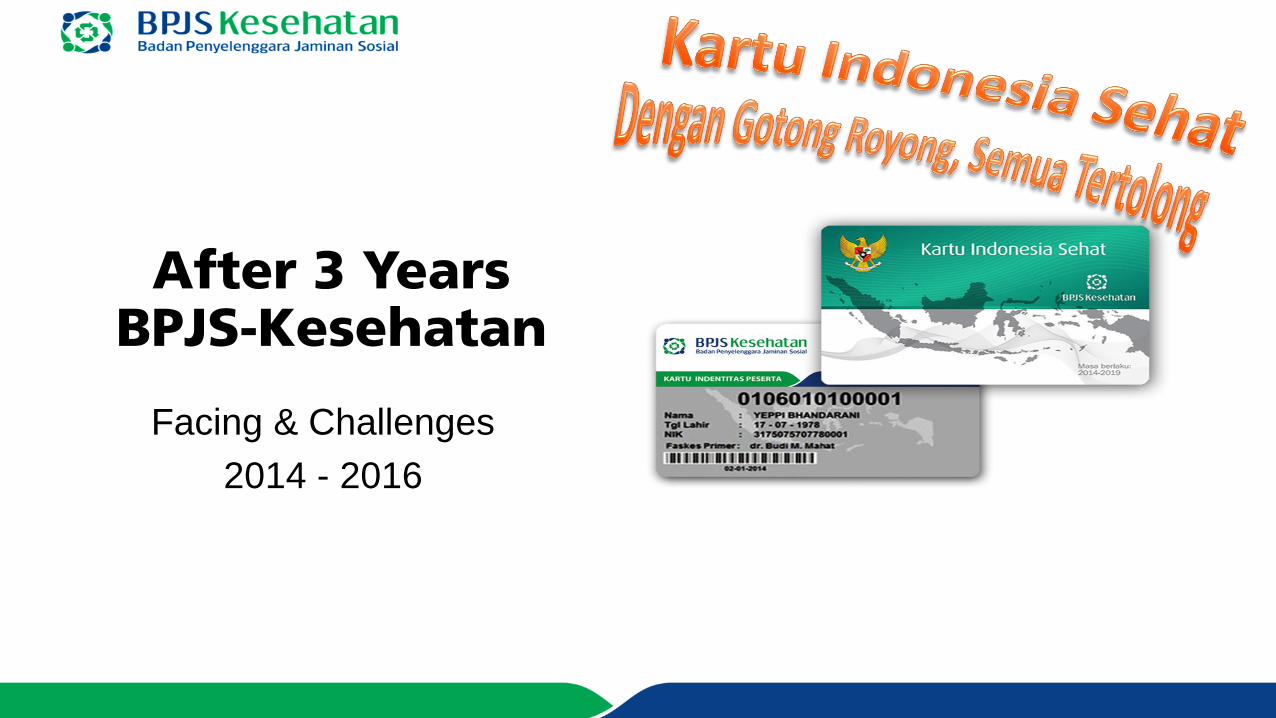
After 3 Years BPJS-Kesehatan
Facing & Challenges
2014 - 2016
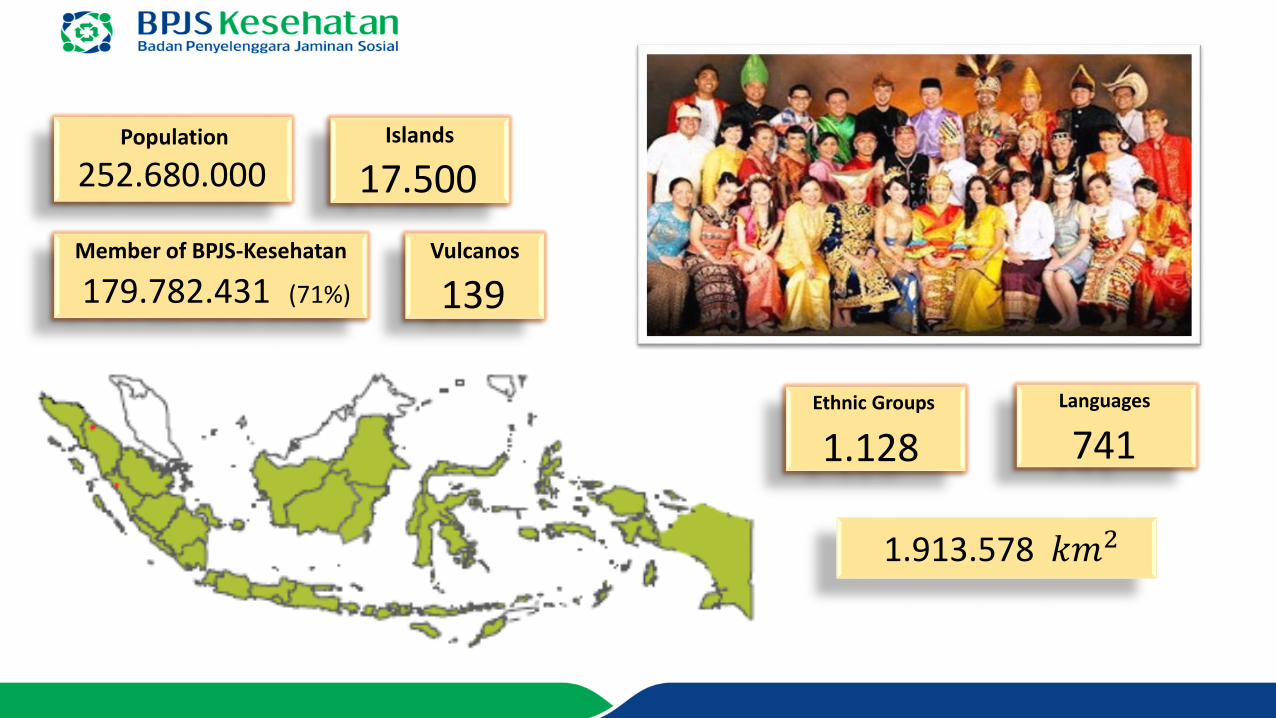
252.680.000Population
179.782.431 (71%)
Member of BPJS-Kesehatan
17.500Islands
1.128Ethnic Groups
741Languages
1.913.578 𝑘𝑚2
139Vulcanos
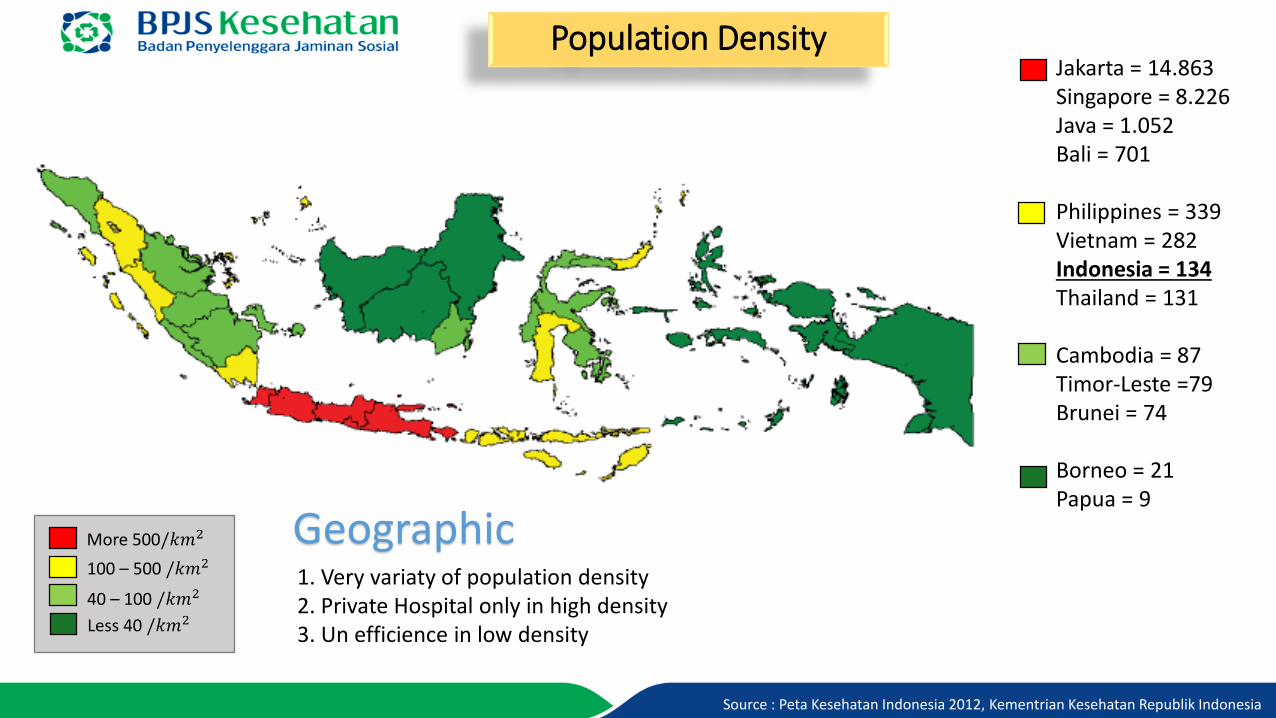
Population Density
More 500/𝑘𝑚2
100 – 500 /𝑘𝑚2
40 – 100 /𝑘𝑚2
Less 40 /𝑘𝑚2
Jakarta = 14.863Singapore = 8.226Java = 1.052Bali = 701
Philippines = 339Vietnam = 282Indonesia = 134Thailand = 131
Cambodia = 87Timor-Leste =79Brunei = 74
Borneo = 21Papua = 9
Geographic 1. Very variaty of population density 2. Private Hospital only in high density3. Un efficience in low density
Source : Peta Kesehatan Indonesia 2012, Kementrian Kesehatan Republik Indonesia

Physician per 100.000
Less 15/100.000
15 – 23 /100.000
23 – 31 /100.000
More 31 /100.000
Jakarta = 68Yogyakarta = 61Aceh = 32
Lampung = 14West Java = 9East Java = 9
Education &Profession
Source : Peta Kesehatan Indonesia 2012, Kementrian Kesehatan Republik Indonesia
Central Java = 21Banten = 18West Nusa Teng = 15
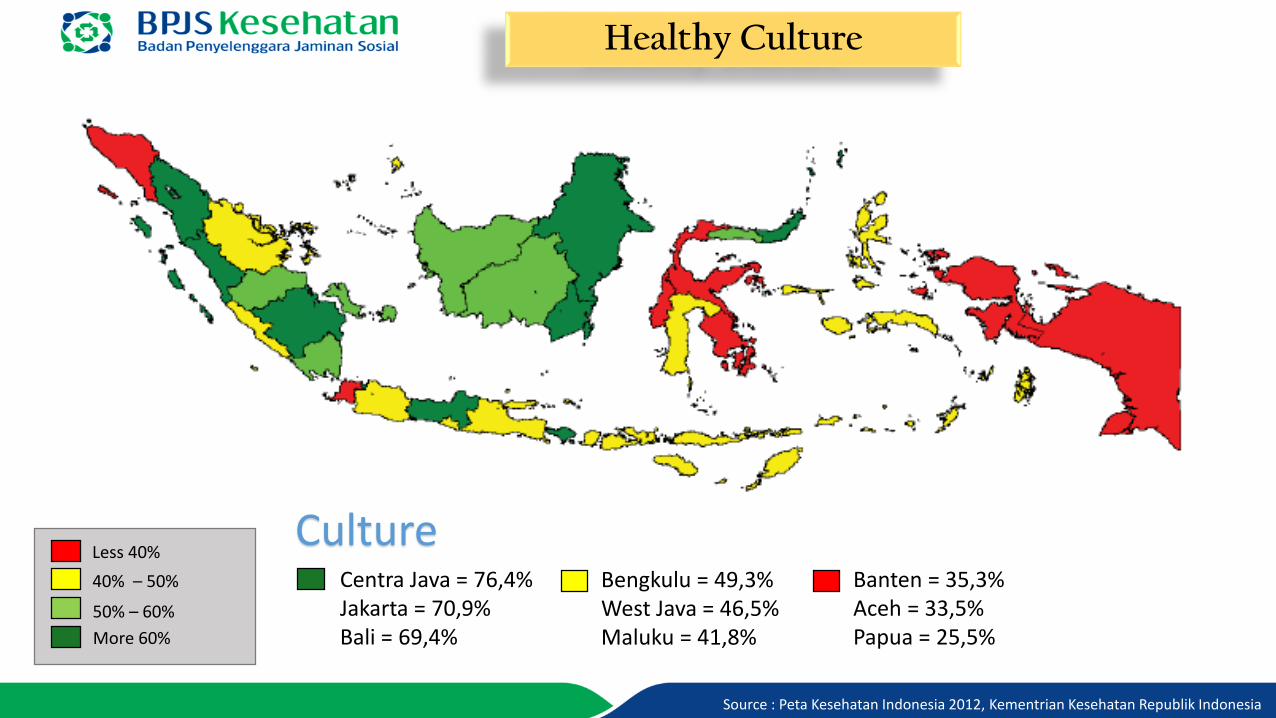
Healthy Culture
Less 40%
40% – 50%
50% – 60%
More 60%
Centra Java = 76,4%Jakarta = 70,9%Bali = 69,4%
Bengkulu = 49,3%West Java = 46,5%Maluku = 41,8%
Banten = 35,3%Aceh = 33,5%Papua = 25,5%
Source : Peta Kesehatan Indonesia 2012, Kementrian Kesehatan Republik Indonesia
Culture

Percentage of The Poor
More 20%
15% – 20%
10% – 15%
Less 10%
Jakarta = 4%Banten = 6%West Java = 9%
East Nusa T = 20%Maluku = 21%Papua = 31%
Education &Economic
Source : Peta Kesehatan Indonesia 2012, Kementrian Kesehatan Republik Indonesia
Lampung = 16%Yogyakarta = 16%West Nusa T = 18%Aceh = 19%
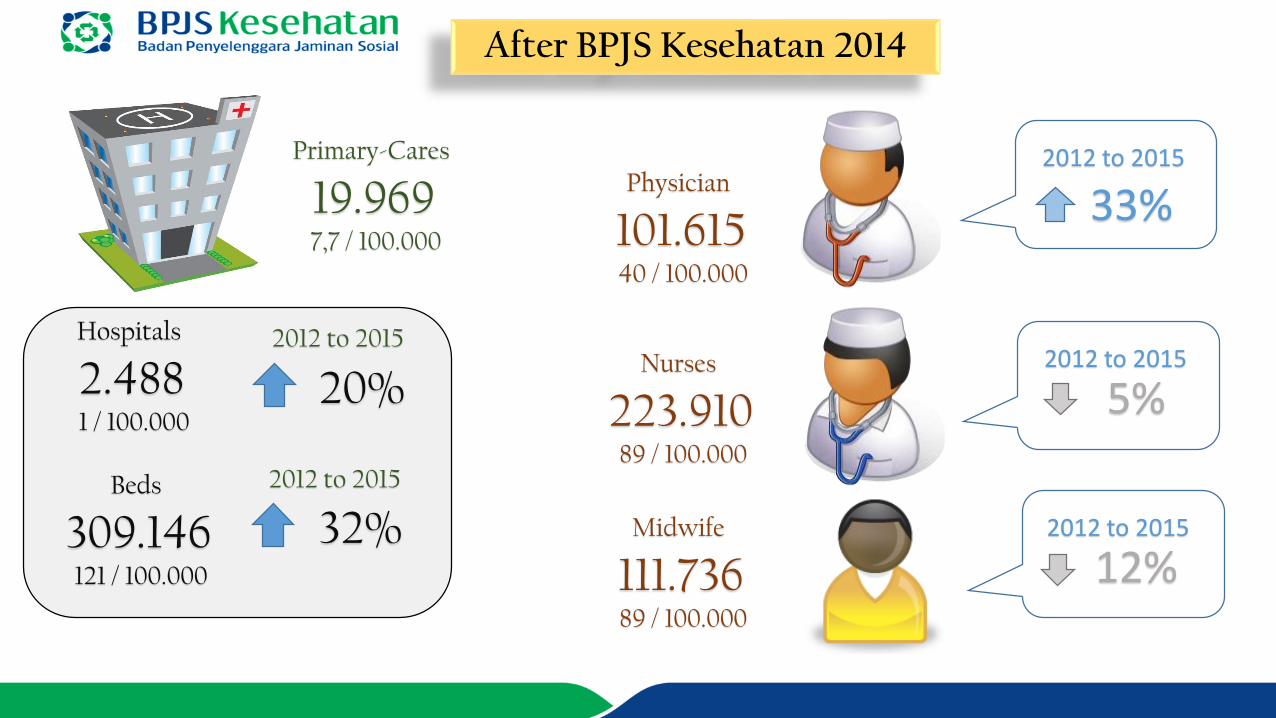
309.146Beds
121 / 100.000
33%2012 to 2015
19.969Primary-Cares
7,7 / 100.000
223.910Nurses
89 / 100.000
111.736Midwife
89 / 100.000
101.615Physician
40 / 100.000
5%2012 to 2015
2.488Hospitals
1 / 100.000
32%
20%
12%2012 to 2015
After BPJS Kesehatan 2014
2012 to 2015
2012 to 2015
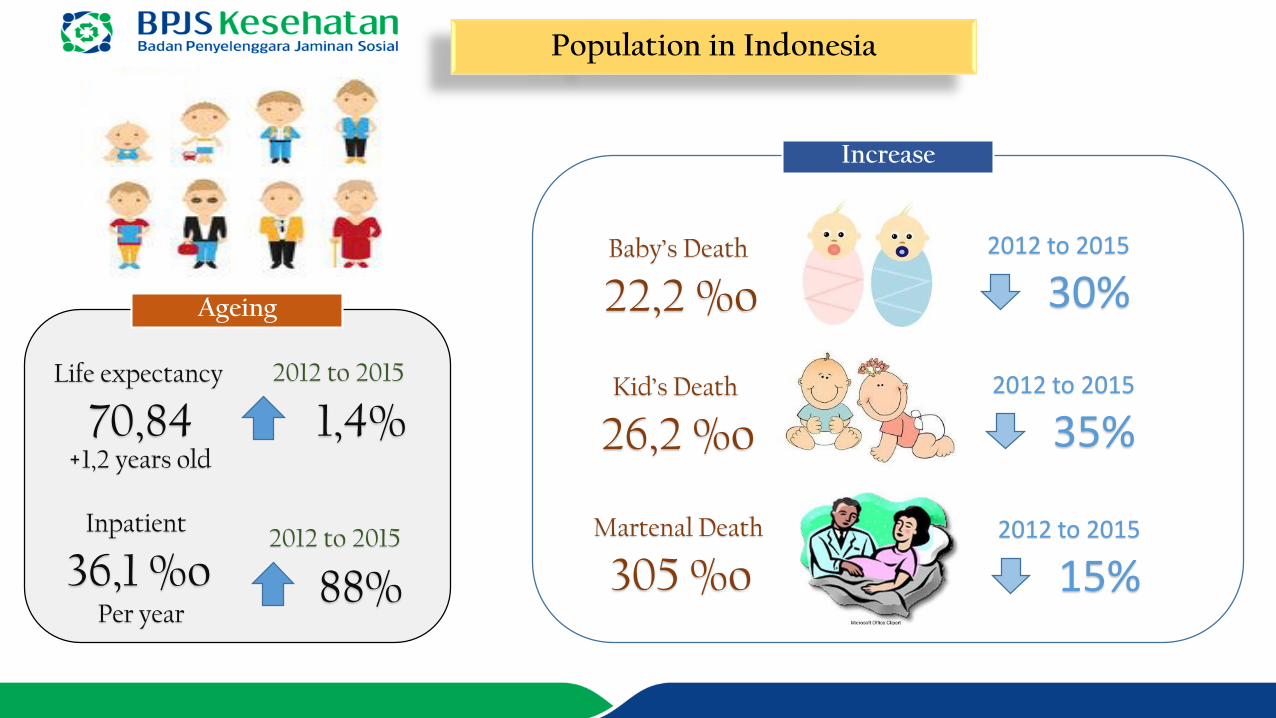
36,1 %oInpatient
Per year
26,2 %oKid’s Death
305 %oMartenal Death
22,2 %oBaby’s Death
70,84Life expectancy
88%
1,4%
30%2012 to 2015
Population in Indonesia
2012 to 2015
2012 to 2015
15%2012 to 2015
35%2012 to 2015
+1,2 years old
Increase
Ageing
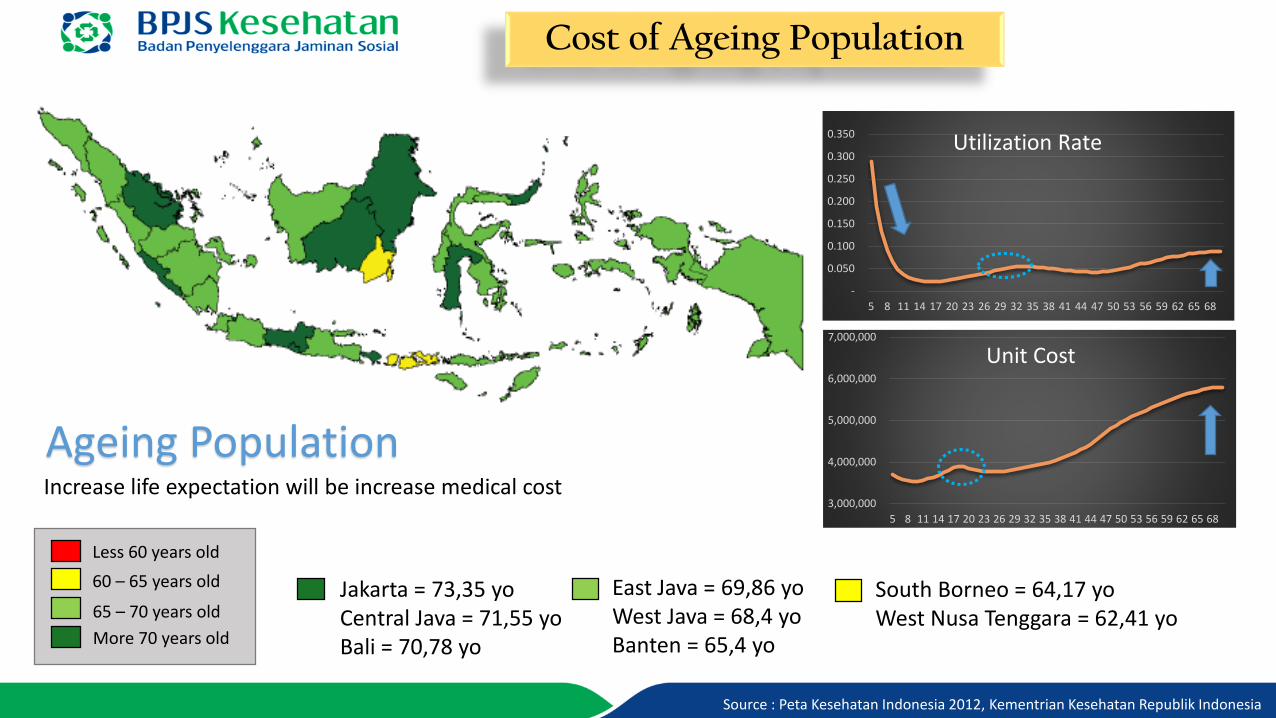
Cost of Ageing Population
Less 60 years old
60 – 65 years old
65 – 70 years old
More 70 years old
Jakarta = 73,35 yoCentral Java = 71,55 yoBali = 70,78 yo
South Borneo = 64,17 yoWest Nusa Tenggara = 62,41 yo
Ageing Population
-
0.050
0.100
0.150
0.200
0.250
0.300
0.350
5 8 11 14 17 20 23 26 29 32 35 38 41 44 47 50 53 56 59 62 65 68
Utilization Rate
3,000,000
4,000,000
5,000,000
6,000,000
7,000,000
5 8 11 14 17 20 23 26 29 32 35 38 41 44 47 50 53 56 59 62 65 68
Increase life expectation will be increase medical cost
East Java = 69,86 yoWest Java = 68,4 yoBanten = 65,4 yo
Source : Peta Kesehatan Indonesia 2012, Kementrian Kesehatan Republik Indonesia
Unit Cost
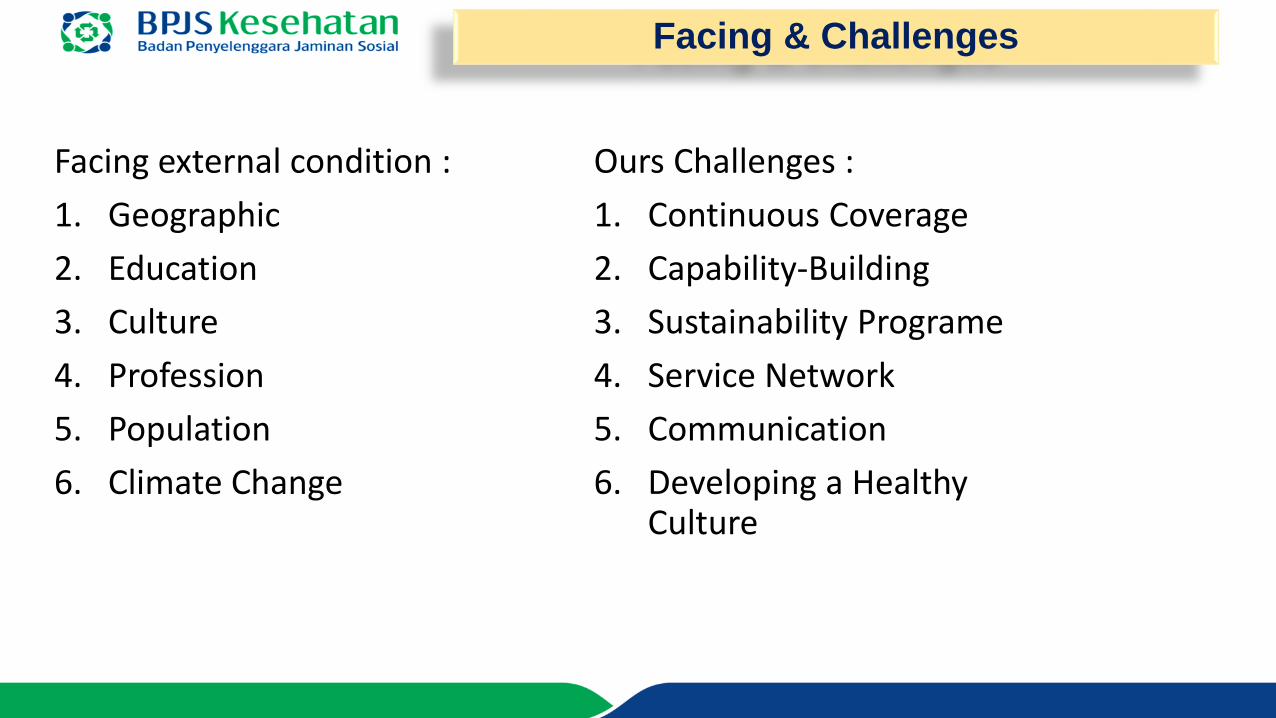
Facing external condition :
1. Geographic
2. Education
3. Culture
4. Profession
5. Population
6. Climate Change
Facing & Challenges
Ours Challenges :
1. Continuous Coverage
2. Capability-Building
3. Sustainability Programe
4. Service Network
5. Communication
6. Developing a Healthy Culture
@BPJSKesehatanRIFanpage:
BPJS Kesehatan
BPJS Kesehatan bpjskesehatan@bpjskesehatan_ri
www.bpjs-kesehatan.go.id