Embed Size (px)
Citation preview
3Q18 Results: Slow but Sure! Household consumption, which contributed 55.26% to total GDP in 3Q18, grew by 5.01% YoY. The Retail Sales Index also continued to increase, up by 4.77% YoY throughout 9M18 (vs 6.04% in 8M18), driven by independence festivals and major international events such as the 2018 Asian Games. Revenue from consumption sector companies included in our coverage in 9M18 recorded an average increase amounting to 11.95% YoY, reflecting 74.12%/73.50% of the MNCS/Consensus’ target. We predict FY18E-FY19F, the consumption sector has the potential to improve with a rate of retail sales growth at the level of 3.59%/4.66% YoY, in line with expectations of GDP growth increasing 5.2%/5.3%. 2019: Hoping for Populist Government Policies, although... We see the Government continuing to focus on populist policies to encourage people's purchasing power in FY19F through : 1) Increasing the amount of funds for the Hope Family Program (PKH); 2) Resisting any increase in fuel and electricity rates until the end of FY19F; 3) Increasing allocation of village funds to IDR85 trillion in FY19F; 5) Increasing Provincial Minimum Wage Increase (UMP) of 8.03% in FY19F; 6) Increasing Non-Cash Food Aid to 15.6 million families; 7) Broadening number of beneficiaries covered by BPJS Kesehatan. Shadowed by Negative Sentiment for the FY19F Free Float Adjustment Plan The implementation of the free float adjustment by the IDX, which will take effect from February 2019, is expected to exert a negative impact on the pace of stock movement, especially in the consumer goods sector whose weight per 12 November 2018 to the overall LQ45 index cap was 27.2%; it may potentially decline significantly, to 13%, following the implementation. However, we do believe investors will be rational, understanding that this policy does not affect Company fundamentals. Overweight Outlook with Top Picks: GGRM, HOKI, ICBP and SIDO We predict that in FY18E-FY19F the consumption sector has the potential to improve with the cigarette segment and FMCG as attractive options. The trend of better purchasing power and the momentum of the political year are factors that must be considered. In addition, the development of e-commerce, prices of raw materials and exchange rate fluctuations are of particular concern. By looking at a number of positive catalysts and risks, we assess the Consumer Sector in Indonesia as OVERWEIGHT, with GGRM (BUY; TP: IDR85,500), HOKI (BUY; TP: IDR1,230), ICBP (BUY; TP: IDR9,600) and SIDO (BUY; TP: IDR1,050) as preferred shares.
CONSUMER SECTOR UPDATE Waiting for the Harvest
Sources: Bloomberg, MNCS (as of November 15, 2018)
Please see important disclaimer at the back of this report
Page 1 www.mncsekuritas.id MNC Sekuritas 1-500-899 [email protected]
SECTOR UPDATE REPORT
MNC Sekuritas Research Division | November, 15 2018
Research Analyst
Victoria Venny [email protected] (021) 2980 3111 ext. 52236
Research Associate Krestanti Nugrahane Widhi [email protected] (021) 2980 3111 ext. 52166
Ticker Market Cap
(IDR bn) PER (x) PBV (x)
Rec. Target Price
(IDR) FY18E FY19F FY18E FY19F HOKI 1.887,99 20.63 19.02 3.43 3.05 BUY 1,230 ICBP 101,458.59 24.16 22.18 4.68 4.24 BUY 9,600
GGRM 148,250.98 17.93 16.02 3.32 3.11 BUY 85,500 SIDO 12,000.00 19.11 16.93 3.88 3.72 BUY 1,050 UNVR 305,200.00 33.20 41.10 39.21 46.36 BUY 44,700

Sector Update Report | MNC Sekuritas Research Division
Please see important disclaimer at the back of this report
Page 2 www.mncsekuritas.id MNC Sekuritas 1-500-899 [email protected]
Household consumption as the main driver of national economic growth, contributed 55.26% to total GDP in 3Q18, with a growth of 5.01% YoY even though the figure was lower than that of 2Q18, which marked 5.14% YoY. Retail sales, which is one of the driving factor for consumer sector growth, have been observed as on an increase, with the Retail Sales Index up by 4.77% YoY in 9M18 (vs 6.04% in 8M18) driven by independence festivals and major international events such as the 2018 Asian Games. Meanwhile, the Consumer Confidence Index (CCI) in 3Q18 weakened by 1.24% YoY, in line with the end of the peak of the 2Q18 holiday season. However, based on an October 2018 Bank Indonesia consumer survey, consumer optimism was sustained, supported by expectations of clothing commodity sales that grew by 28.4% YoY.
Slow but sure, with Household Spending Power up by 5.01% in 3Q18
Exhibit 01. Consumer Confidence Index, Retail Sales Index and GDP Trend
Source : Bank Indonesia
150 150
174 171 174182 187 188
194
207 204 206 203
218
204210
204
228
214
117 116 120 119 119111 107 104
111 112 113 116 118124 123 123 123 125 123
0
50
100
150
200
250
1Q14
2Q14
3Q14
4Q14
1Q15
2Q15
3Q15
4Q15
1Q16
2Q16
3Q16
4Q16
1Q17
2Q17
3Q17
4Q17
1Q18
2Q18
3Q18
4.3%
4.4%
4.5%
4.6%
4.7%
4.8%
4.9%
5.0%
5.1%
5.2%
5.3%
5.4%
Retail Sales Index Quarterly (RHS) Consumer Confidence Index Quarterly (LHS) GDP Growth % YoY (RHS)
Satisfactory Performance of Consumer Player, with an average 11.95% YoY increase in Sales
We predict that consumption sector has the potential to improve at FY18E-1H19F, with a rate of retail sales growth at a level of 3.59%/4.66% YoY, in line with expectations of 5.2%/5.3% GDP growth. The BI Survey results also found that Retail Sales in 4Q18E are relatively higher, in line with seasonal factors of Christmas and New Year celebrations, although they will slow slightly in 1Q19F. In addition, optimism was shown by the performance improvement of several players in the consumption sector in 9M18. Company revenue from the consumption sector included in our coverage in 9M18 recorded an average increase of 11.95% YoY, reflecting 74.12%/73.50% of MNCS/Consensus’ target. ERAA led revenue growth, with a significant increase of 52.12% YoY, followed by MAPI (18.35% YoY), HOKI (17.78% YoY), and GGRM (13.60% YoY). Furthermore, ERAA saw the highest net profit growth of companies in its field at 185.84% YoY, followed by MAPI (124.42% YoY), HOKI (95.06%), and RALS (43.36% YoY). INDF meanwhile experienced a decrease in net profit of -13.57% YoY in line with the weakening of the rupiah exchange rate against the dollar and weakening CPO prices. We believe that this achievement reflects how purchasing power of the public has begun to improve in 9M18, where the performance results of consumer players are on average in line with Consensus’ target.
Sector Update Report | MNC Sekuritas Research Division
Please see important disclaimer at the back of this report
Page 3 www.mncsekuritas.id MNC Sekuritas 1-500-899 [email protected]
As usual, the momentum of a presidential election to be held in FY19F impels the government to favor populist policies, in an effort to stimulate public purchasing power in FY18E/FY19F. Among the main programs to improve social protection programs are: 1) Strengthening the Family Hope Program (PKH) through 100% higher benefits, with a target of 10 million beneficiary families (while the previous year it only reached 5 million); 2) Increasing the number of recipients of National Health Insurance (JKN) assistance to 96.8 million, from a previous year’s figure of 92.4 million; 3) Gradually raising the target for Bantuan Pangan Non Tunai to 15.6 million recipient families, and renovating the rice distribution program (Beras Sejahtera); 4) Increased allocation of village funds, from IDR60 trillion in FY18E to IDR85 trillion in FY19F; 5) Increasing the basic salary of civil servants as well as retirees by an average of 5%, and raising work allowances for members of TNI and Polri up to 70%; 6) Resisting increases in fuel and electricity rates until the end of FY19F; 7) Increasing the provincial minimum wage (UMP) to 8.03% for FY19F (vs 8.71% in FY18).
Hoping for Populist Government Policies
Exhibit 02. Financial Highlight 9M18
Sources : Bloomberg as of November 07, 2018, MNCS
Ticker Revenue (IDR Bn) Net Profit (IDR Bn) Net Profit Margin (%)
9M17 9M18 % YoY % Cons % MNCS 9M17 9M18 % YoY % Cons % MNCS 9M17 9M18
HOKI 1,923.62 900.05 1,060.10 17.78 71.77 76.82 36.28 70.76 95.06 79.15 78.15 4.03 6.68
ICBP 104,665.62 27,430.48 29,478.28 7.47 76.44 77.72 3,041.69 3,484.92 14.57 81.73 82.97 11.09 11.82
INDF 50,487.45 53,120.23 54,742.19 3.05 74.53 72.75 3,262.53 2,819.94 (13.57) 68.30 65.14 6.14 5.15
GGRM 153,446.02 61,523.11 69,889.35 13.60 75.49 75.73 5,417.95 5,761.18 6.34 69.11 69.69 8.81 8.24
HMSP 442,008.69 72,293.90 77,534.84 7.25 73.09 72.82 9,337.93 9,690.30 3.77 73.27 72.15 12.92 12.50
KLBF 63,047.04 15,089.90 15,678.30 3.90 73.99 72.48 1,779.41 1,804.43 1.41 73.47 72.11 11.79 11.51
SIDO 12,150.00 1,857.48 1,944.22 4.67 71.45 70.34 380.38 480.11 26.22 74.54 76.46 20.48 24.69
UNVR 326,564.00 31,213.51 31,531.50 1.02 73.71 73.84 5,229.40 7,303.49 39.66 92.80 98.69 16.75 23.16
ERAA 5,311.35 16,653.87 25,333.32 52.12 72.84 78.23 222.68 636.51 185.84 80.75 65.63 1.34 2.51
MAPI 13,529.00 11,683.83 13,827.67 18.35 72.97 74.44 248.50 557.67 124.42 90.20 86.34 2.13 4.03
RALS 8,337.80 4,418.04 4,516.77 2.23 72.16 70.16 367.80 527.27 43.36 98.73 73.17 8.32 11.67
Market Cap (IDR Bn)
Exhibit 03. Some of Government Policies
Sources : Detik.com, Ministry of Finance, MNCS
Sector Update Report | MNC Sekuritas Research Division
Please see important disclaimer at the back of this report
Page 4 www.mncsekuritas.id MNC Sekuritas 1-500-899 [email protected]
A Favor for Cigarette and FMCG Players
We see the Government continuing to focus on populist steps from its choice of distribution and use of funds through the state budget to be a positive catalyst for strengthening the purchasing power of Indonesian people in FY18E/FY19F. The expansion of subsidies for revenue is also reflected in the increased FY19F State Budget budget, where total state expenditures are projected at IDR2,462.3 trillion, for a significant increase from a previous IDR2,220.7 trillion.
The government has decided to cancel the cigarette excise tariff increase scheduled for FY19F, continuing to impose FY18 cigarette excise with a weighted average of 10.04%. We believe this decision will exert a positive impact on the tobacco products industry. In addition, based on Nielsen research, SKM Full Flavor (FF) cigarettes will continue to dominate national cigarette sales, with an increase in market share to 40.70% in 1Q18 (vs 37.60% in 1Q17). The massive demand for cigarette products, especially SKM FF, will certainly benefit GGRM, the market leader in the SKM FF segment, with a portion of ~80% of total sales volume. We also note how players in the FMCG sector will still harvest profits, in line with the increase in people's purchasing power, as reflected in higher volume per trip for food and beverage segment by 8%/2% in MAT June 2018 and spend per trip for the food and beverage segment increased by 8%/ 11% in MAT June 2018.
Exhibit 04. FMCG Volume and Value Spend per Trip
Source : 2Q18 FMCG Report, Kantar WorldPanel
Shadowed by Negative Sentiment from the FY19F Free Float Adjustment Plan
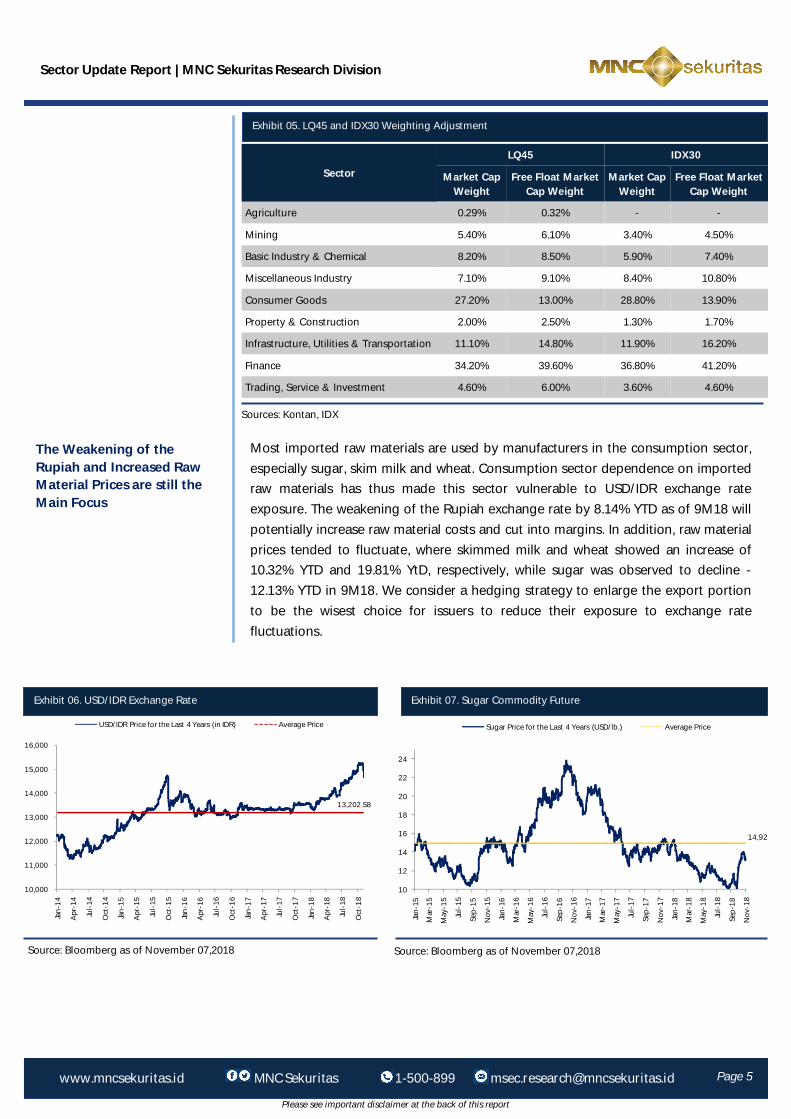
The Indonesia Stock Exchange will implement an adjustment to its index calculation method by adding a “free float ratio indicator” to the market capitalization of the LQ45 and IDX30 Index, planned to be implemented in February 2019. We estimate that this policy will exert a negative impact on the pace of stock movement, especially in the consumer goods sector where per 12 November 2018 the weight of the consumer goods segment to the overall market cap of the LQ45 index is 27.2%, but will have the potential to decline to just 13% after the implementation. We thus predict that the shares of HMSP and UNVR (the largest weight) could be significantly affected by the selloff. News of this policy provoked an outflow of investors to release shares with a small free float in the consumption sector. However, they will likely come to understand that this policy does not affect company fundamentals.
Sector Update Report | MNC Sekuritas Research Division
Please see important disclaimer at the back of this report
Page 5 www.mncsekuritas.id MNC Sekuritas 1-500-899 [email protected]
Exhibit 05. LQ45 and IDX30 Weighting Adjustment
Sources: Kontan, IDX
LQ45 IDX30
Market Cap Weight
Free Float Market Cap Weight
Market Cap Weight
Free Float Market Cap Weight
Agriculture 0.29% 0.32% - -
Mining 5.40% 6.10% 3.40% 4.50% Basic Industry & Chemical 8.20% 8.50% 5.90% 7.40% Miscellaneous Industry 7.10% 9.10% 8.40% 10.80%
Consumer Goods 27.20% 13.00% 28.80% 13.90% Property & Construction 2.00% 2.50% 1.30% 1.70% Infrastructure, Utilities & Transportation 11.10% 14.80% 11.90% 16.20%
Finance 34.20% 39.60% 36.80% 41.20% Trading, Service & Investment 4.60% 6.00% 3.60% 4.60%
Sector
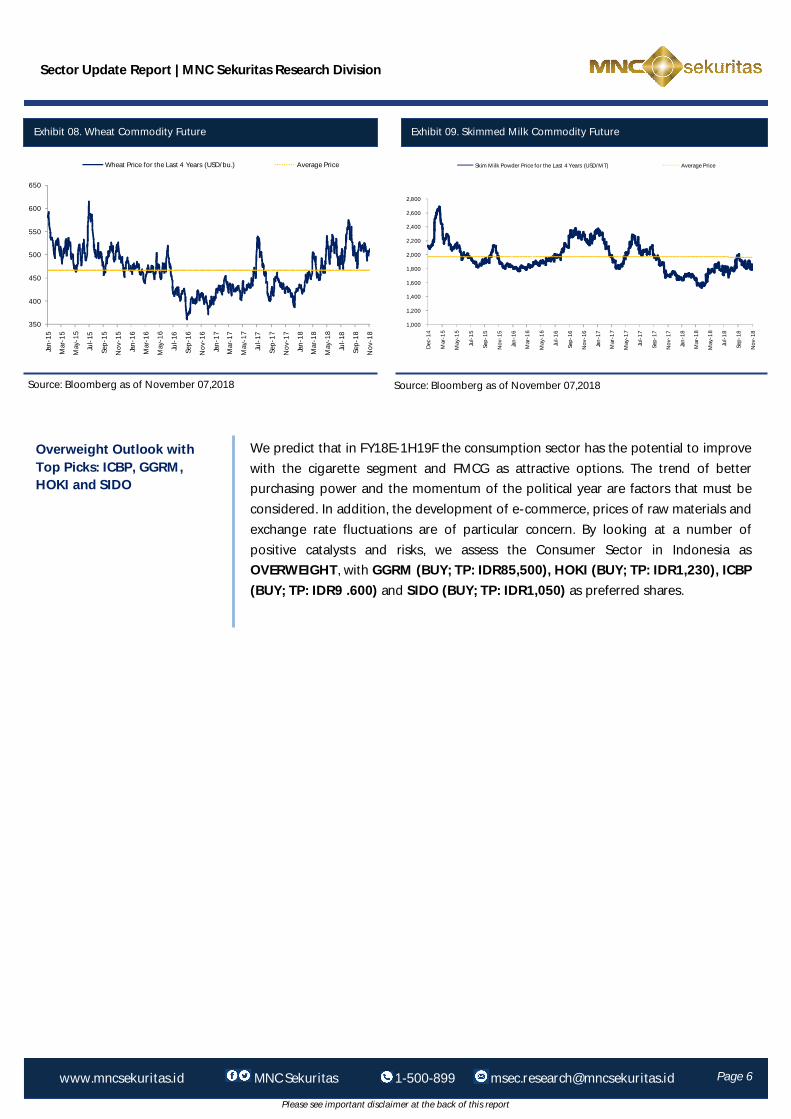
The Weakening of the Rupiah and Increased Raw Material Prices are still the Main Focus
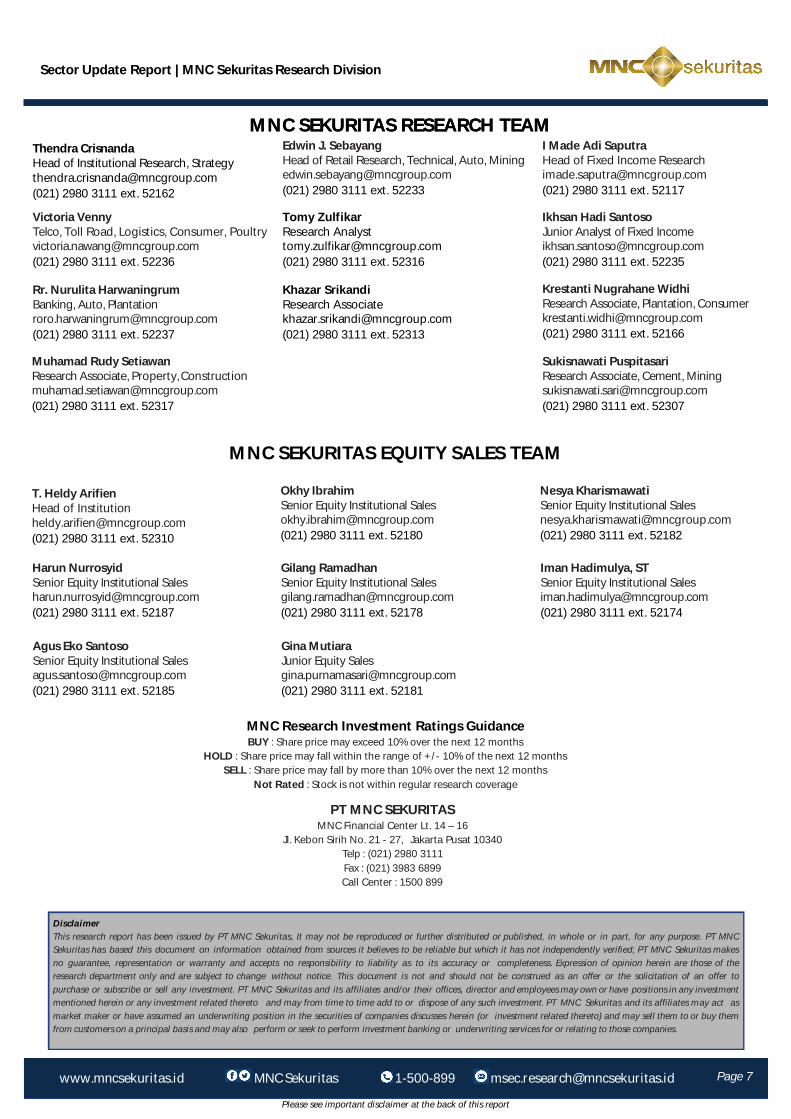
Most imported raw materials are used by manufacturers in the consumption sector, especially sugar, skim milk and wheat. Consumption sector dependence on imported raw materials has thus made this sector vulnerable to USD/IDR exchange rate exposure. The weakening of the Rupiah exchange rate by 8.14% YTD as of 9M18 will potentially increase raw material costs and cut into margins. In addition, raw material prices tended to fluctuate, where skimmed milk and wheat showed an increase of 10.32% YTD and 19.81% YtD, respectively, while sugar was observed to decline -12.13% YTD in 9M18. We consider a hedging strategy to enlarge the export portion to be the wisest choice for issuers to reduce their exposure to exchange rate fluctuations.
10,000
11,000
12,000
13,000
14,000
15,000
16,000
Jan-
14
Apr
-14
Jul-
14
Oct
-14
Jan-
15
Apr
-15
Jul-
15
Oct
-15
Jan-
16
Apr
-16
Jul-
16
Oct
-16
Jan-
17
Apr
-17
Jul-
17
Oct
-17
Jan-
18
Apr
-18
Jul-
18
Oct
-18
USD/IDR Price for the Last 4 Years (in IDR) Average Price
13,202.58
14,92
10
12
14
16
18
20
22
24
Jan-
15
Mar
-15
May
-15
Jul-
15
Sep-
15
Nov
-15
Jan-
16
Mar
-16
May
-16
Jul-
16
Sep-
16
Nov
-16
Jan-
17
Mar
-17
May
-17
Jul-
17
Sep-
17
Nov
-17
Jan-
18
Mar
-18
May
-18
Jul-
18
Sep-
18
Nov
-18
Sugar Price for the Last 4 Years (USD/lb.) Average Price
Source: Bloomberg as of November 07,2018
Exhibit 06. USD/IDR Exchange Rate Exhibit 07. Sugar Commodity Future
Source: Bloomberg as of November 07,2018
Sector Update Report | MNC Sekuritas Research Division
Please see important disclaimer at the back of this report
Page 6 www.mncsekuritas.id MNC Sekuritas 1-500-899 [email protected]
Overweight Outlook with Top Picks: ICBP, GGRM, HOKI and SIDO
We predict that in FY18E-1H19F the consumption sector has the potential to improve with the cigarette segment and FMCG as attractive options. The trend of better purchasing power and the momentum of the political year are factors that must be considered. In addition, the development of e-commerce, prices of raw materials and exchange rate fluctuations are of particular concern. By looking at a number of positive catalysts and risks, we assess the Consumer Sector in Indonesia as OVERWEIGHT, with GGRM (BUY; TP: IDR85,500), HOKI (BUY; TP: IDR1,230), ICBP (BUY; TP: IDR9 .600) and SIDO (BUY; TP: IDR1,050) as preferred shares.
Source: Bloomberg as of November 07,2018
Exhibit 08. Wheat Commodity Future Exhibit 09. Skimmed Milk Commodity Future
Source: Bloomberg as of November 07,2018
350
400
450
500
550
600
650
Jan-
15
Mar
-15
May
-15
Jul-
15
Sep-
15
Nov
-15
Jan-
16
Mar
-16
May
-16
Jul-
16
Sep-
16
Nov
-16
Jan-
17
Mar
-17
May
-17
Jul-
17
Sep-
17
Nov
-17
Jan-
18
Mar
-18
May
-18
Jul-
18
Sep-
18
Nov
-18
Wheat Price for the Last 4 Years (USD/bu.) Average Price
1,000
1,200
1,400
1,600
1,800
2,000
2,200
2,400
2,600
2,800
Dec
-14
Mar
-15
May
-15
Jul-1
5
Sep-
15
Nov
-15
Jan-
16
Mar
-16
May
-16
Jul-1
6
Sep-
16
Nov
-16
Jan-
17
Mar
-17
May
-17
Jul-1
7
Sep-
17
Nov
-17
Jan-
18
Mar
-18
May
-18
Jul-1
8
Sep-
18
Nov
-18
Skim Milk Powder Price for the Last 4 Years (USD/MT) Average Price
Sector Update Report | MNC Sekuritas Research Division
Please see important disclaimer at the back of this report
Page 7 www.mncsekuritas.id MNC Sekuritas 1-500-899 [email protected]
MNC SEKURITAS RESEARCH TEAM
Disclaimer This research report has been issued by PT MNC Sekuritas, It may not be reproduced or further distributed or published, in whole or in part, for any purpose. PT MNC Sekuritas has based this document on information obtained from sources it believes to be reliable but which it has not independently verified; PT MNC Sekuritas makes no guarantee, representation or warranty and accepts no responsibility to liability as to its accuracy or completeness. Expression of opinion herein are those of the research department only and are subject to change without notice. This document is not and should not be construed as an offer or the solicitation of an offer to purchase or subscribe or sell any investment. PT MNC Sekuritas and its affiliates and/or their offices, director and employees may own or have positions in any investment mentioned herein or any investment related thereto and may from time to time add to or dispose of any such investment. PT MNC Sekuritas and its affiliates may act as market maker or have assumed an underwriting position in the securities of companies discusses herein (or investment related thereto) and may sell them to or buy them from customers on a principal basis and may also perform or seek to perform investment banking or underwriting services for or relating to those companies.
MNC SEKURITAS RESEARCH TEAM Edwin J. Sebayang Head of Retail Research, Technical, Auto, Mining [email protected] (021) 2980 3111 ext. 52233
I Made Adi Saputra Head of Fixed Income Research [email protected] (021) 2980 3111 ext. 52117
Victoria Venny Telco, Toll Road, Logistics, Consumer, Poultry [email protected] (021) 2980 3111 ext. 52236
Rr. Nurulita Harwaningrum Banking, Auto, Plantation [email protected] (021) 2980 3111 ext. 52237
Khazar Srikandi Research Associate [email protected] (021) 2980 3111 ext. 52313
Ikhsan Hadi Santoso Junior Analyst of Fixed Income [email protected] (021) 2980 3111 ext. 52235
Thendra Crisnanda Head of Institutional Research, Strategy [email protected] (021) 2980 3111 ext. 52162
Tomy Zulfikar Research Analyst [email protected] (021) 2980 3111 ext. 52316
MNC Research Investment Ratings Guidance BUY : Share price may exceed 10% over the next 12 months
HOLD : Share price may fall within the range of +/- 10% of the next 12 months SELL : Share price may fall by more than 10% over the next 12 months
Not Rated : Stock is not within regular research coverage
PT MNC SEKURITAS MNC Financial Center Lt. 14 – 16
Jl. Kebon Sirih No. 21 - 27, Jakarta Pusat 10340 Telp : (021) 2980 3111 Fax : (021) 3983 6899 Call Center : 1500 899
MNC SEKURITAS EQUITY SALES TEAM
T. Heldy Arifien Head of Institution [email protected] (021) 2980 3111 ext. 52310
Okhy Ibrahim Senior Equity Institutional Sales [email protected] (021) 2980 3111 ext. 52180
Nesya Kharismawati Senior Equity Institutional Sales [email protected] (021) 2980 3111 ext. 52182
Harun Nurrosyid Senior Equity Institutional Sales [email protected] (021) 2980 3111 ext. 52187
Gilang Ramadhan Senior Equity Institutional Sales [email protected] (021) 2980 3111 ext. 52178
Iman Hadimulya, ST Senior Equity Institutional Sales [email protected] (021) 2980 3111 ext. 52174
Agus Eko Santoso Senior Equity Institutional Sales [email protected] (021) 2980 3111 ext. 52185
Gina Mutiara Junior Equity Sales [email protected] (021) 2980 3111 ext. 52181
Muhamad Rudy Setiawan Research Associate, Property, Construction [email protected] (021) 2980 3111 ext. 52317
Sukisnawati Puspitasari Research Associate, Cement, Mining [email protected] (021) 2980 3111 ext. 52307
Krestanti Nugrahane Widhi Research Associate, Plantation, Consumer [email protected] (021) 2980 3111 ext. 52166


![Shadowed Neighborhoods Based on Fuzzy Rough Transformation ... · As fuzzy rough sets [21], [22], shadowed sets [14], [26] were proposed by Pedrycz to bridge rough sets [17], [18]](https://img.pdfslide.us/doc/110x75/5fb04222827f80709a3c08be/shadowed-neighborhoods-based-on-fuzzy-rough-transformation-as-fuzzy-rough-sets.jpg)