Embed Size (px)
Citation preview
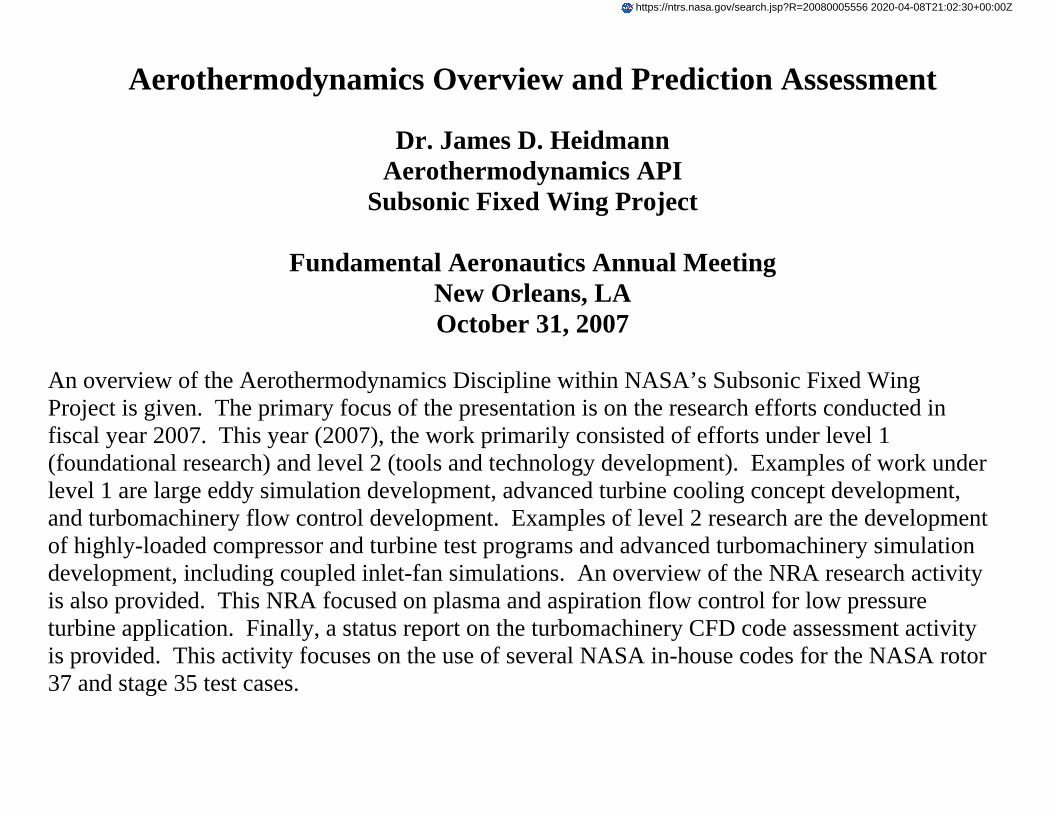
Aerothermodynamics Overview and Prediction Assessment
Dr. James D. Heidmann Aerothermodynamics API
Subsonic Fixed Wing Project
Fundamental Aeronautics Annual Meeting New Orleans, LA October 31, 2007
An overview of the Aerothermodynamics Discipline within NASA’s Subsonic Fixed Wing Project is given. The primary focus of the presentation is on the research efforts conducted in fiscal year 2007. This year (2007), the work primarily consisted of efforts under level 1 (foundational research) and level 2 (tools and technology development). Examples of work under level 1 are large eddy simulation development, advanced turbine cooling concept development, and turbomachinery flow control development. Examples of level 2 research are the development of highly-loaded compressor and turbine test programs and advanced turbomachinery simulation development, including coupled inlet-fan simulations. An overview of the NRA research activity is also provided. This NRA focused on plasma and aspiration flow control for low pressure turbine application. Finally, a status report on the turbomachinery CFD code assessment activity is provided. This activity focuses on the use of several NASA in-house codes for the NASA rotor 37 and stage 35 test cases.
https://ntrs.nasa.gov/search.jsp?R=20080005556 2020-04-08T21:02:30+00:00Z
1
National Aeronautics and Space Administration
www.nasa.gov
Aerothermodynamics Overview and Prediction Assessment
Dr. James D. HeidmannAerothermodynamics API
Subsonic Fixed Wing Project
Fundamental Aeronautics Annual MeetingNew Orleans, LAOctober 31, 2007
2
National Aeronautics and Space Administration
www.nasa.gov
Outline
• Aerothermodynamics Overview
• In-House Research Progress
• Turbomachinery Code Assessment
• NRA Research Progress
• Summary
3
National Aeronautics and Space Administration
www.nasa.gov
Aerothermodynamics Research Objectives
• Develop fundamental understanding and enabling technologies required for concepts such as ultra-high bypass engines, high power density cores, and embedded engines for hybrid wing vehicles.
• Dramatically improve engine thermal efficiency, reduce fuel burnand emissions, and reduce weight and complexity of engine systems.
• Improve understanding through experimental and analytical study of engine inlets, fans, compressors, turbines, and nozzlesand their interactions.
4
National Aeronautics and Space Administration
www.nasa.gov
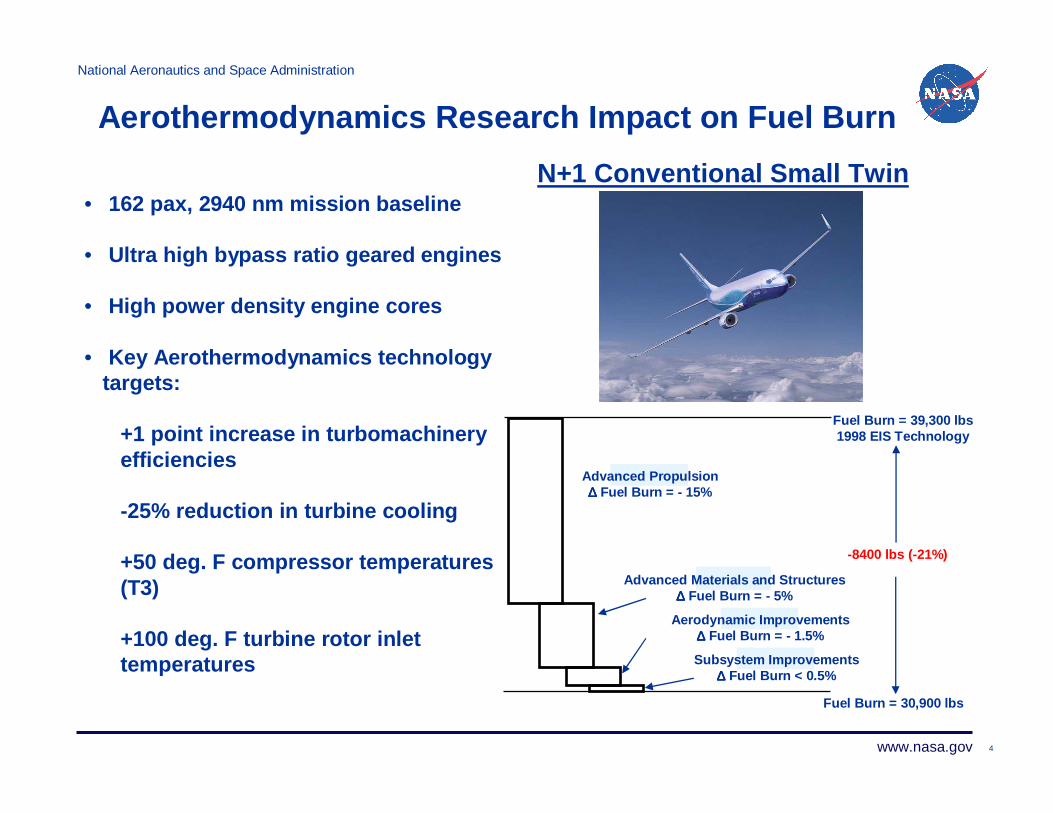
Aerothermodynamics Research Impact on Fuel Burn
N+1 Conventional Small Twin• 162 pax, 2940 nm mission baseline
• Ultra high bypass ratio geared engines
• High power density engine cores
• Key Aerothermodynamics technology targets:
+1 point increase in turbomachinery efficiencies
-25% reduction in turbine cooling
+50 deg. F compressor temperatures (T3)
+100 deg. F turbine rotor inlet temperatures
Fuel Burn = 39,300 lbs1998 EIS Technology
-8400 lbs (-21%)
Aerodynamic Improvements∆∆∆∆ Fuel Burn = - 1.5%
Fuel Burn = 30,900 lbs
Advanced Materials and Structures∆∆∆∆ Fuel Burn = - 5%
Advanced Propulsion∆∆∆∆ Fuel Burn = - 15%
Subsystem Improvements∆∆∆∆ Fuel Burn < 0.5%
5
National Aeronautics and Space Administration
www.nasa.gov
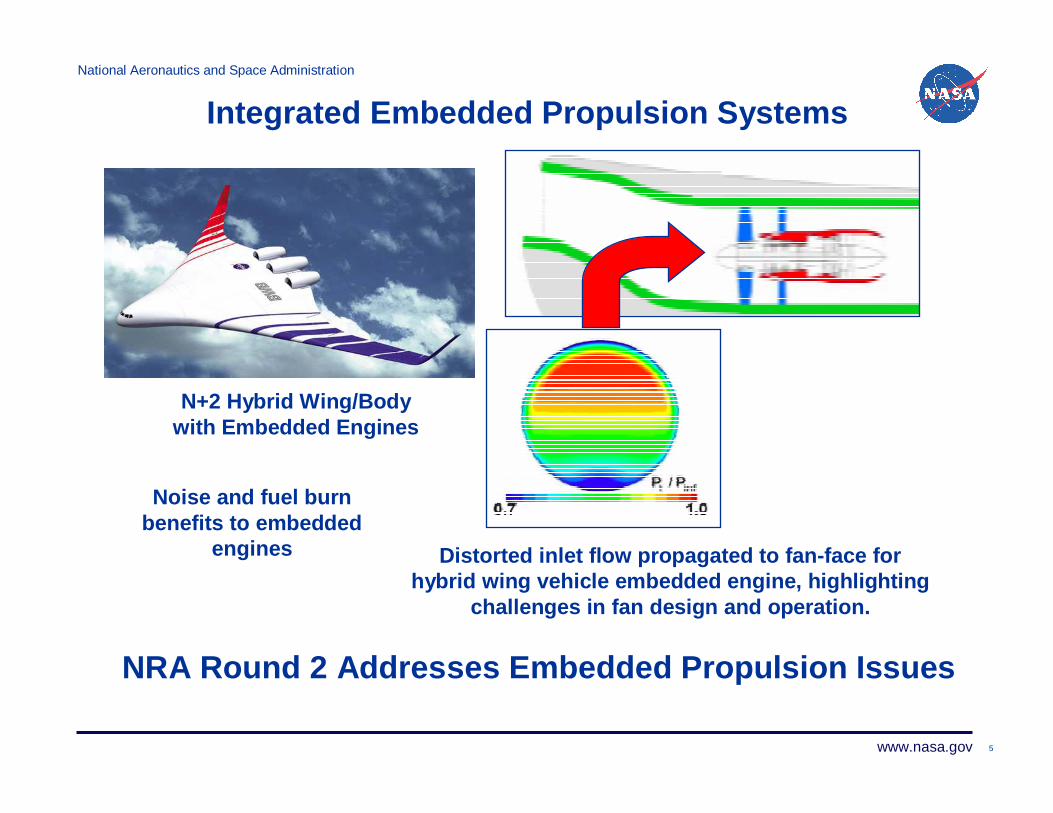
Integrated Embedded Propulsion Systems
N+2 Hybrid Wing/Bodywith Embedded Engines
Distorted inlet flow propagated to fan-face forhybrid wing vehicle embedded engine, highlighting
challenges in fan design and operation.
NRA Round 2 Addresses Embedded Propulsion Issues
Noise and fuel burn benefits to embedded
engines
6
National Aeronautics and Space Administration
www.nasa.gov
Aerothermodynamics Research Areas:
• NRA Cooperative Agreements & Contracts
• Foundational Research: • Model and Method Development• Flow Control Development• Cooling Concept Development
• Technologies & Tool Development• Turbomachinery Simulation Development• Advanced Compression System Development• Advanced Cooled Turbine Development• Advanced Inlet and Nozzle Development• Turbomachinery Code Assessment
7
National Aeronautics and Space Administration
www.nasa.gov
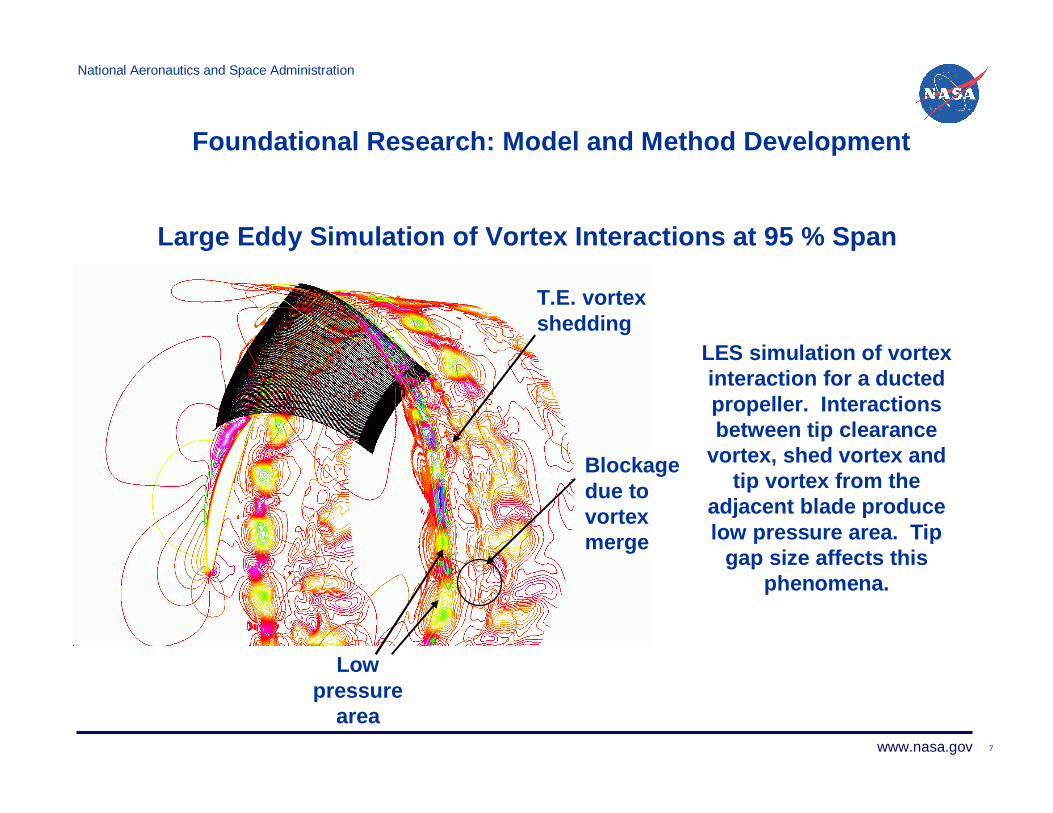
Foundational Research: Model and Method Development
LES simulation of vortex interaction for a ducted propeller. Interactions between tip clearance
vortex, shed vortex and tip vortex from the
adjacent blade produce low pressure area. Tip
gap size affects this phenomena.
T.E. vortex shedding
Blockage due to vortex merge
Low pressure
area
Large Eddy Simulation of Vortex Interactions at 95 % Span
8
National Aeronautics and Space Administration
www.nasa.gov
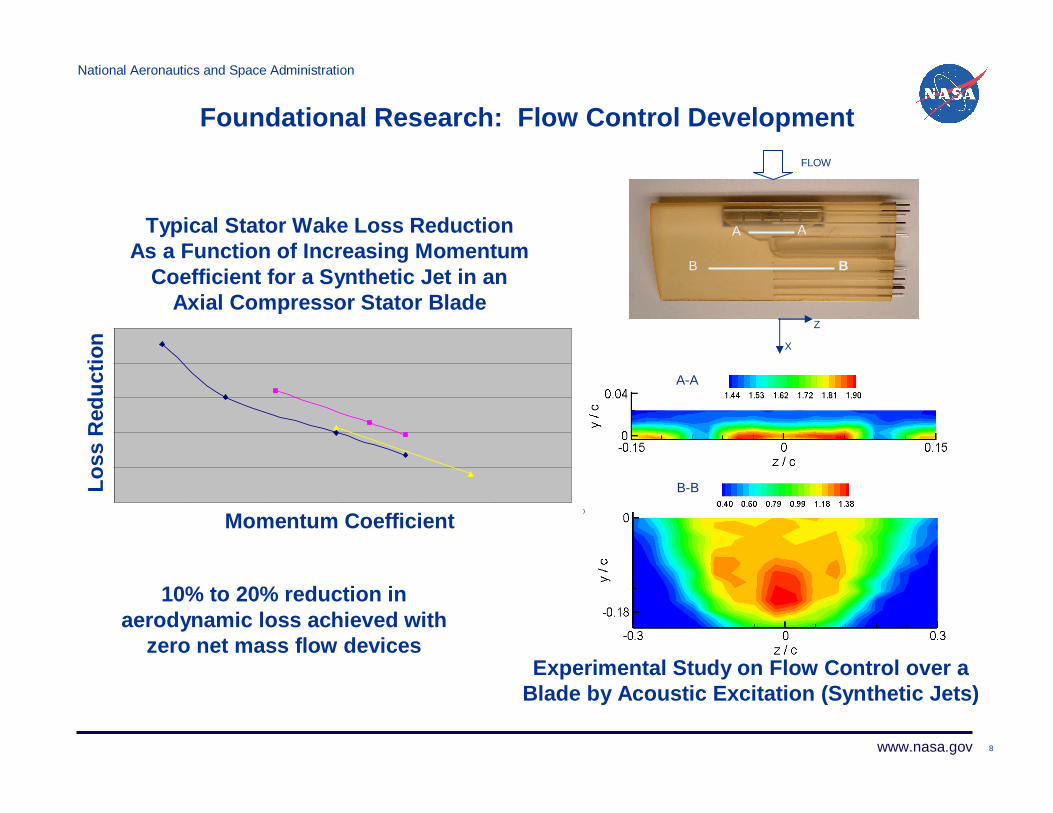
Foundational Research: Flow Control Development
B-B
A-A
A A
B B
FLOW
X
Z
Experimental Study on Flow Control over a Blade by Acoustic Excitation (Synthetic Jets)
Typical Stator Wake Loss Reductionas a Function of Increas ing Mom entum Coeff icient
Synthetic Jet in Axial Com pr essor s tator b lade
-25.0%
-20.0%
-15.0%
-10.0%
-5.0%
0.0%
0.000000 0.002000 0.004000 0.006000 0.008000 0.010000 0.012000
M o ment um C o ef f i c i ent
Typical Stator Wake Loss ReductionAs a Function of Increasing Momentum
Coefficient for a Synthetic Jet in anAxial Compressor Stator Blade
Momentum Coefficient
Lo
ss R
edu
ctio
n
10% to 20% reduction in aerodynamic loss achieved with
zero net mass flow devices
9
National Aeronautics and Space Administration
www.nasa.gov
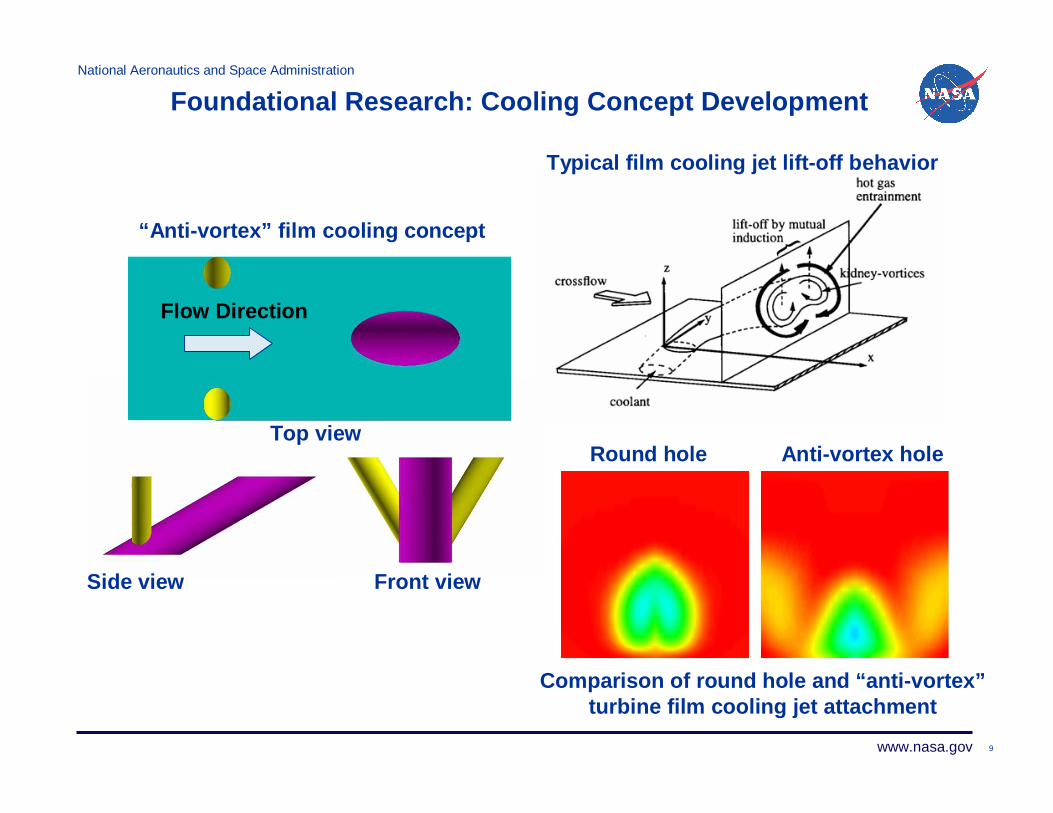
Foundational Research: Cooling Concept Development
Comparison of round hole and “ anti-vortex”turbine film cooling jet attachment
Typical film cooling jet lift-off behavior
Side view Front view
Flow Direction
“ Anti-vortex” film cooling concept
Round hole Anti-vortex holeTop view
10
National Aeronautics and Space Administration
www.nasa.gov
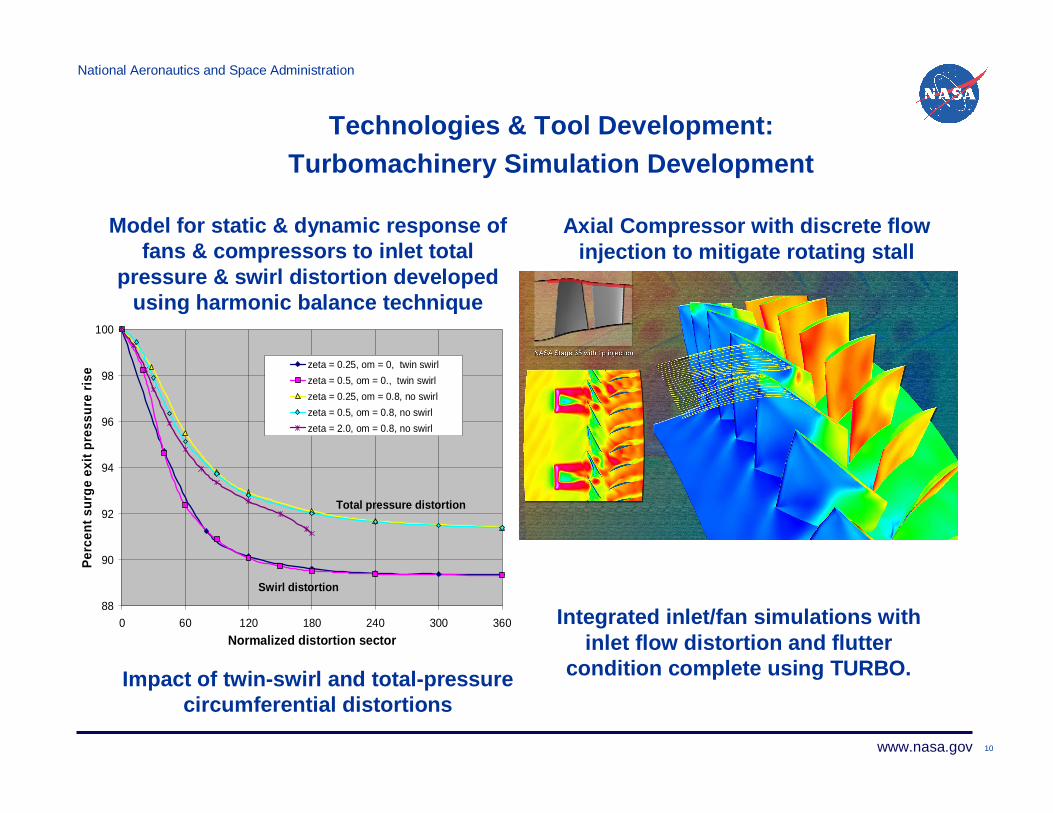
Technologies & Tool Development:Turbomachinery Simulation Development
Axial Compressor with discrete flow injection to mitigate rotating stall
88
90
92
94
96
98
100
0 60 120 180 240 300 360
Normalized distortion sector
Per
cen
t su
rge
exit
pre
ssu
re r
ise zeta = 0.25, om = 0, twin swirl
zeta = 0.5, om = 0., twin swirl
zeta = 0.25, om = 0.8, no swirl
zeta = 0.5, om = 0.8, no swirl
zeta = 2.0, om = 0.8, no swirl
Swirl distortion
Total pressure distortion
Impact of twin-swirl and total-pressure circumferential distortions
Model for static & dynamic response of fans & compressors to inlet total
pressure & swirl distortion developed using harmonic balance technique
Integrated inlet/fan simulations with inlet flow distortion and flutter
condition complete using TURBO.
11
National Aeronautics and Space Administration
www.nasa.gov
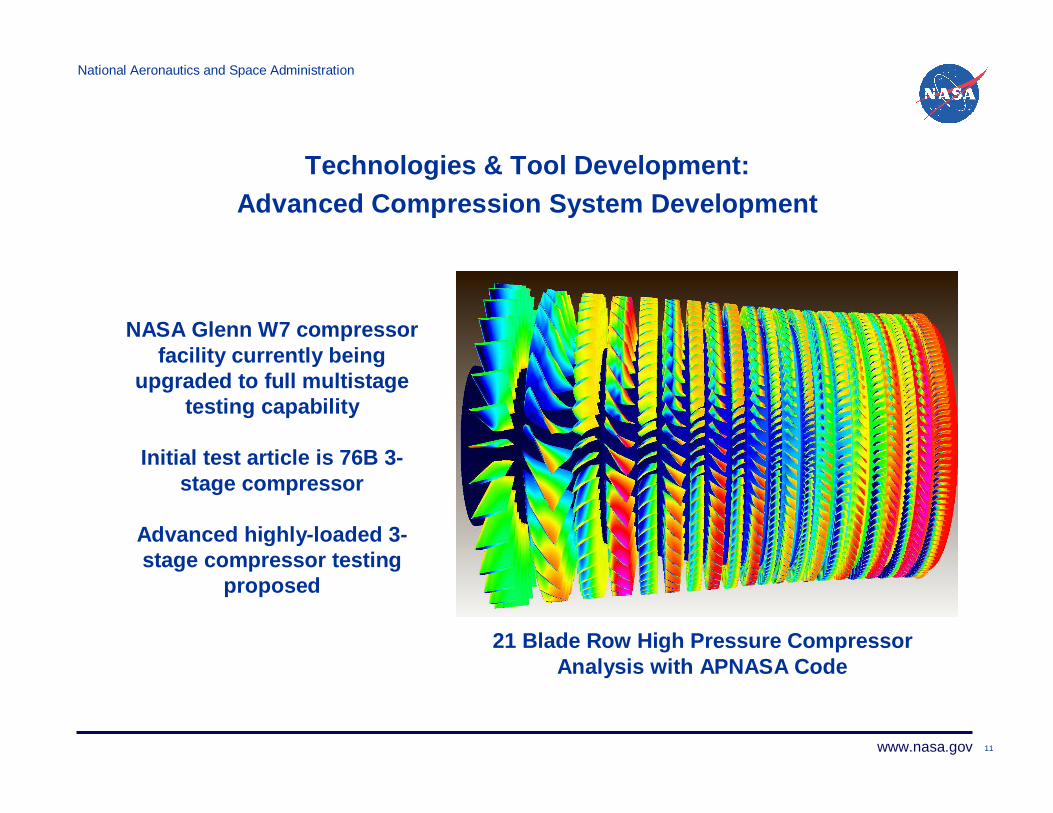
Technologies & Tool Development:Advanced Compression System Development
21 Blade Row High Pressure CompressorAnalysis with APNASA Code
NASA Glenn W7 compressor facility currently being
upgraded to full multistage testing capability
Initial test article is 76B 3-stage compressor
Advanced highly-loaded 3-stage compressor testing
proposed
12
National Aeronautics and Space Administration
www.nasa.gov
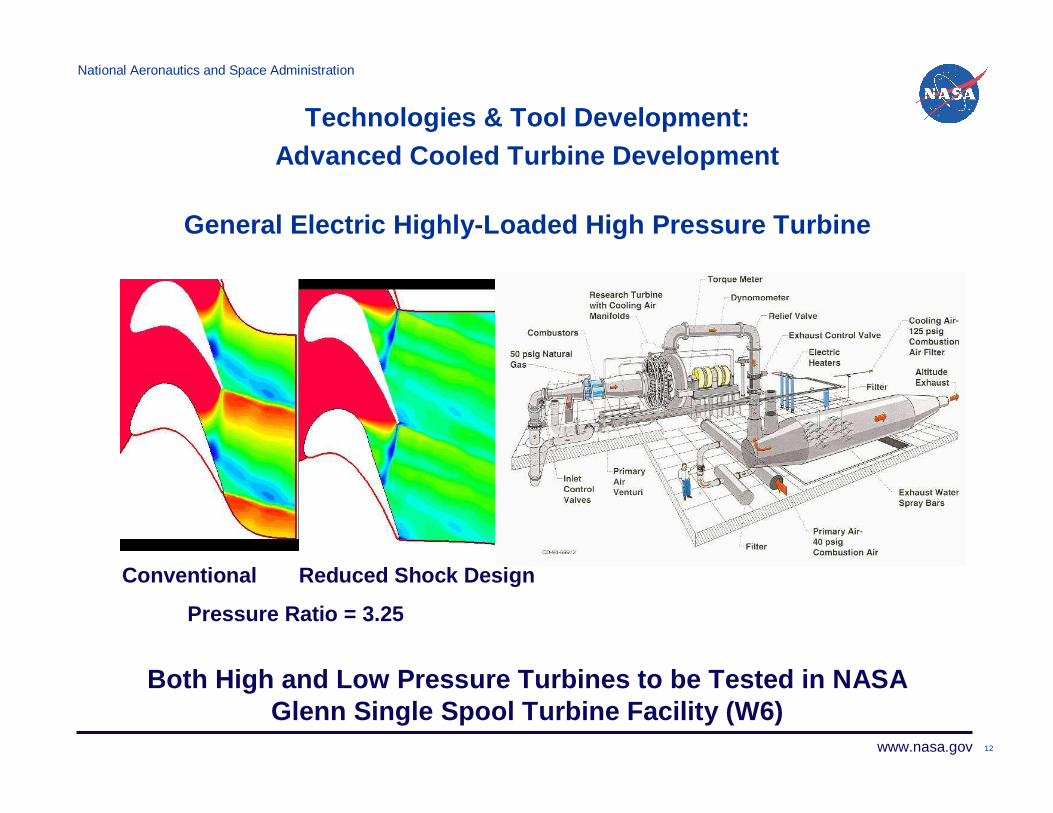
Technologies & Tool Development:Advanced Cooled Turbine Development
General Electric Highly-Loaded High Pressure Turbine
Both High and Low Pressure Turbines to be Tested in NASAGlenn Single Spool Turbine Facility (W6)
Conventional Reduced Shock Design
Pressure Ratio = 3.25
13
National Aeronautics and Space Administration
www.nasa.gov
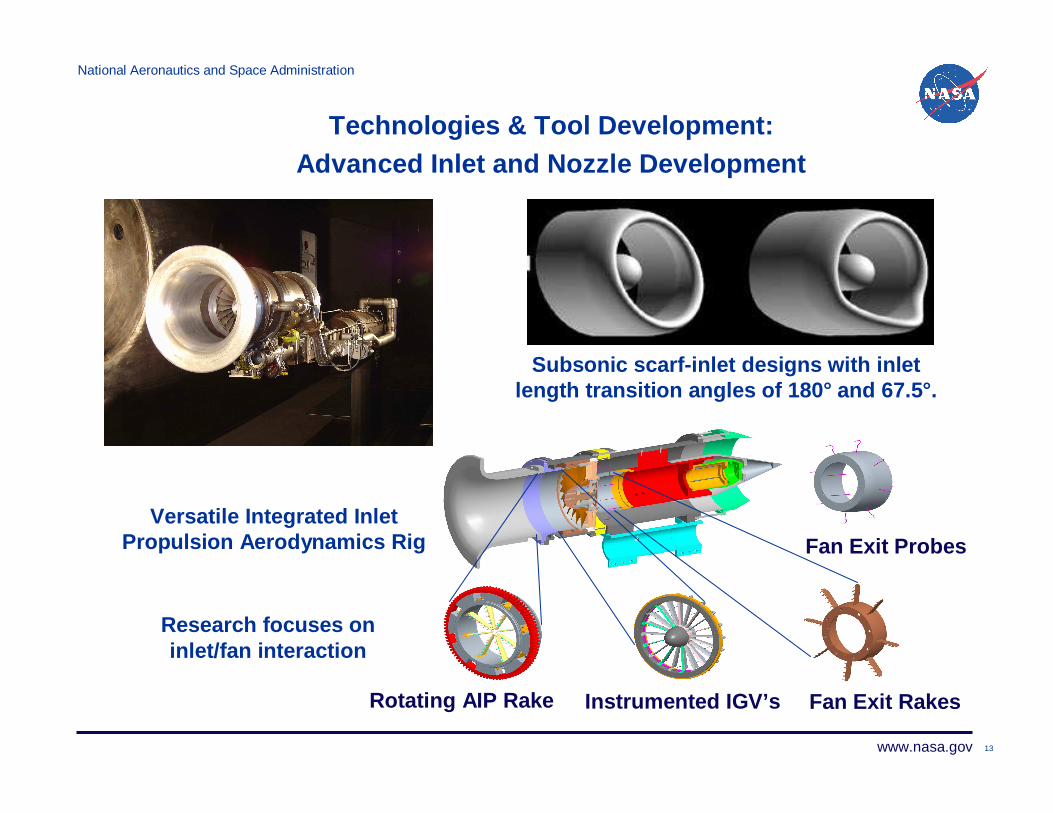
Technologies & Tool Development:Advanced Inlet and Nozzle Development
Subsonic scarf-inlet designs with inletlength transition angles of 180° and 67.5°.
Versatile Integrated InletPropulsion Aerodynamics Rig Fan Exit Probes
Rotating AIP Rake Fan Exit RakesInstrumented IGV’s
Research focuses on inlet/fan interaction
14
National Aeronautics and Space Administration
www.nasa.gov
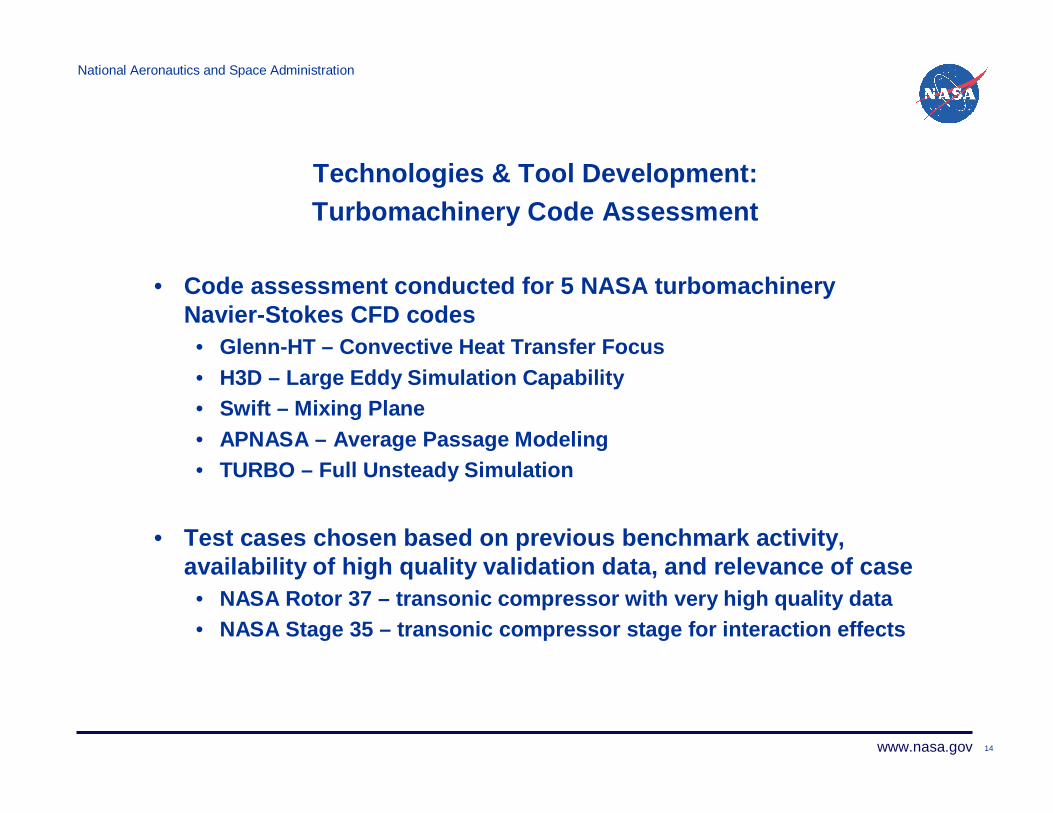
Technologies & Tool Development:Turbomachinery Code Assessment
• Code assessment conducted for 5 NASA turbomachinery Navier-Stokes CFD codes• Glenn-HT – Convective Heat Transfer Focus• H3D – Large Eddy Simulation Capability• Swift – Mixing Plane• APNASA – Average Passage Modeling• TURBO – Full Unsteady Simulation
• Test cases chosen based on previous benchmark activity, availability of high quality validation data, and relevance of case• NASA Rotor 37 – transonic compressor with very high quality data• NASA Stage 35 – transonic compressor stage for interaction effects
15
National Aeronautics and Space Administration
www.nasa.gov
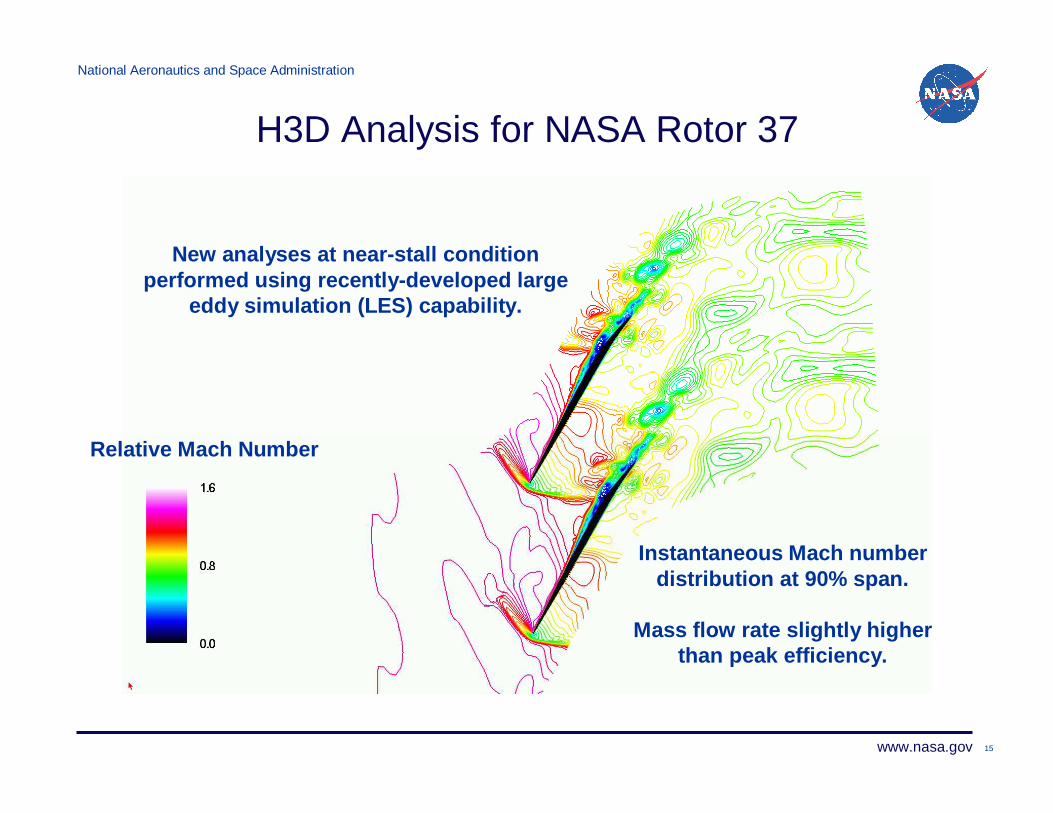
H3D Analysis for NASA Rotor 37
Relative Mach Number
New analyses at near-stall condition performed using recently-developed large
eddy simulation (LES) capability.
Instantaneous Mach number distribution at 90% span.
Mass flow rate slightly higher than peak efficiency.
16
National Aeronautics and Space Administration
www.nasa.gov
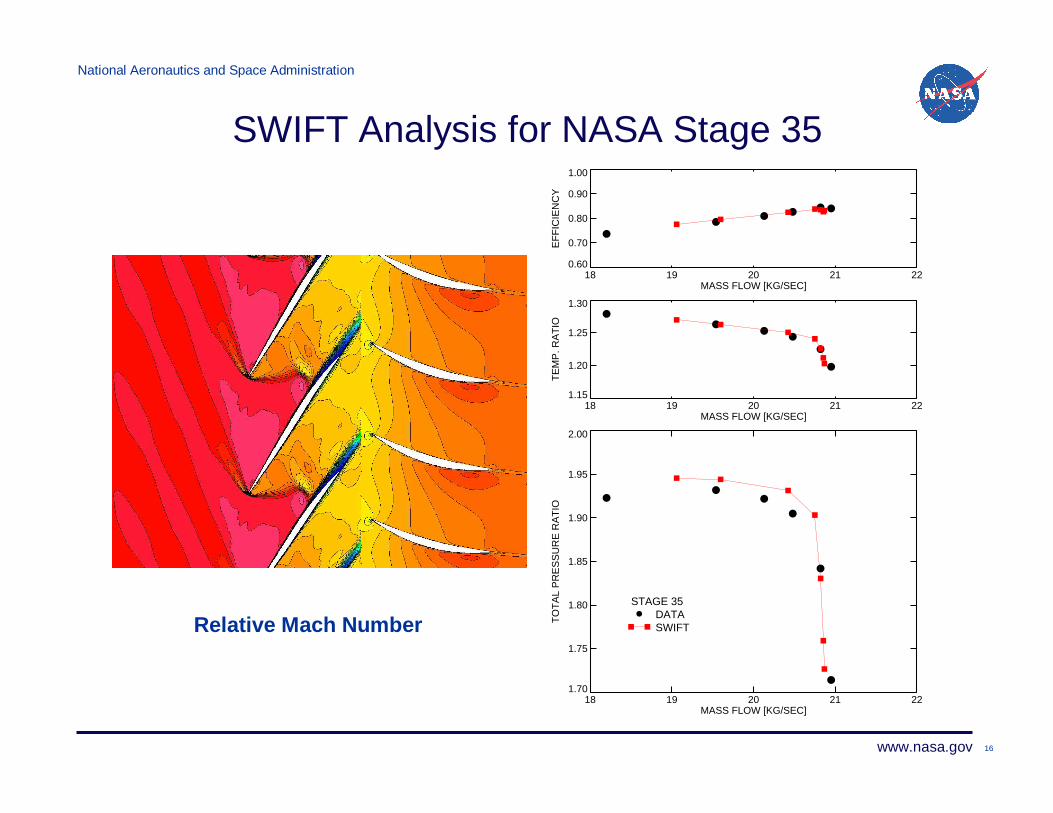
SWIFT Analysis for NASA Stage 35
18 19 20 21 22MASS FLOW [KG/SEC]
1.70
1.75
1.80
1.85
1.90
1.95
2.00
TO
TA
L P
RE
SS
UR
E R
AT
IO
STAGE 35DATASWIFT
18 19 20 21 22MASS FLOW [KG/SEC]
1.15
1.20
1.25
1.30
TE
MP
. RA
TIO
18 19 20 21 22MASS FLOW [KG/SEC]
0.60
0.70
0.80
0.90
1.00
EF
FIC
IEN
CY
Relative Mach Number
17
National Aeronautics and Space Administration
www.nasa.gov
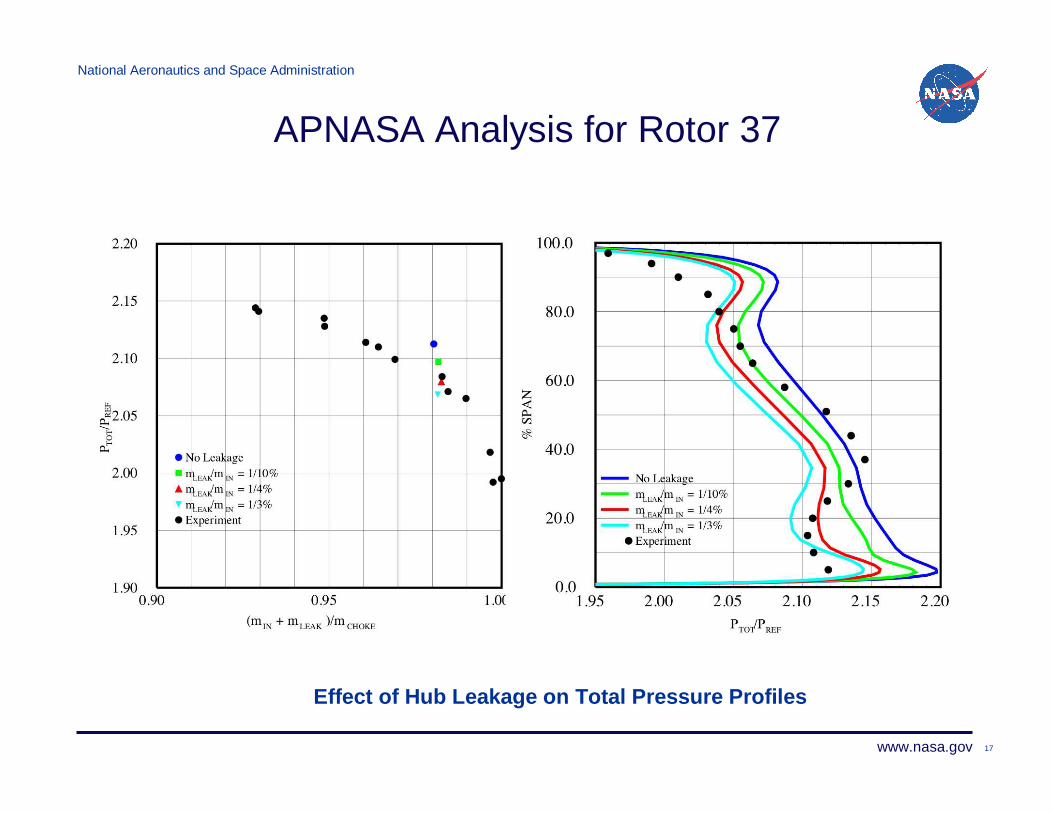
APNASA Analysis for Rotor 37
Effect of Hub Leakage on Total Pressure Profiles
18
National Aeronautics and Space Administration
www.nasa.gov
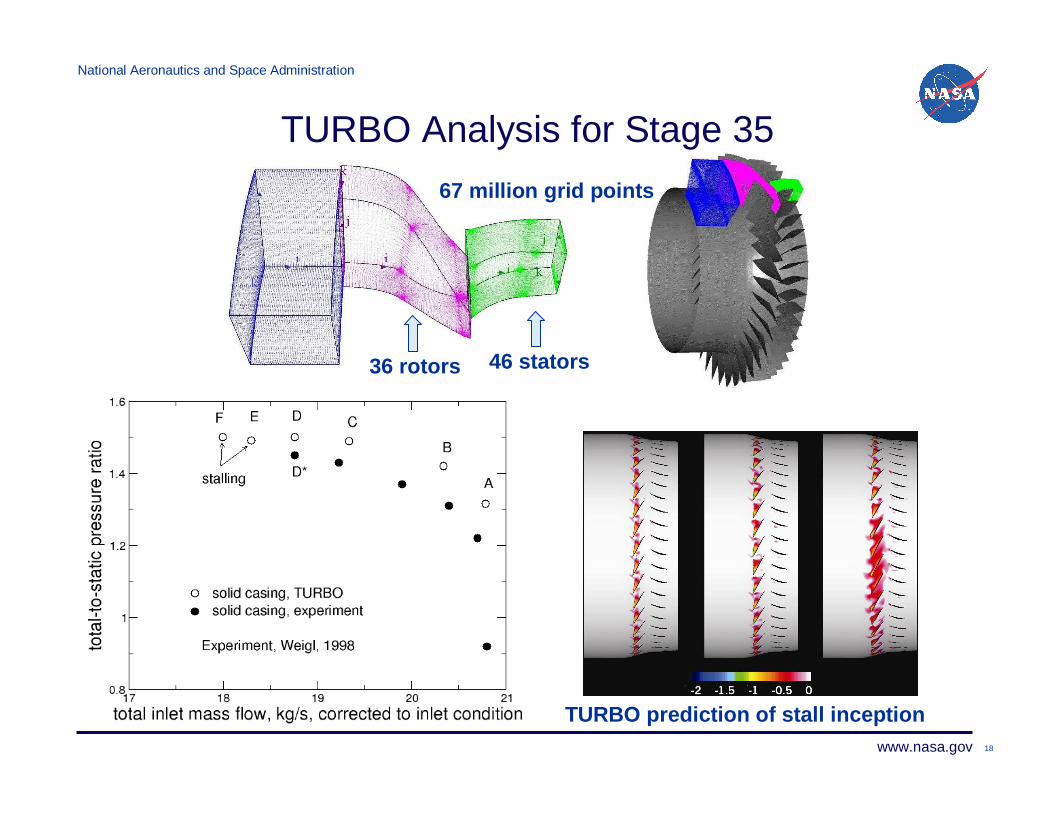
TURBO Analysis for Stage 35
36 rotors 46 stators
67 million grid points
TURBO prediction of stall inception
19
National Aeronautics and Space Administration
www.nasa.gov
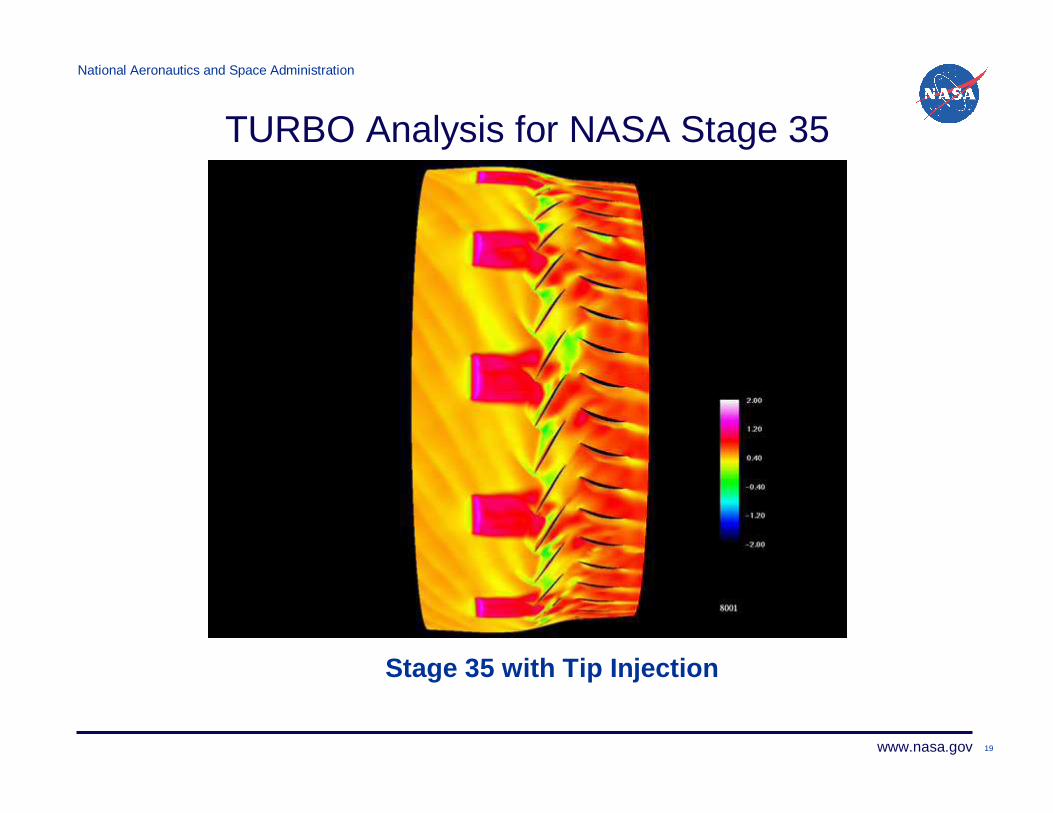
Stage 35 with Tip Injection
TURBO Analysis for NASA Stage 35
20
National Aeronautics and Space Administration
www.nasa.gov
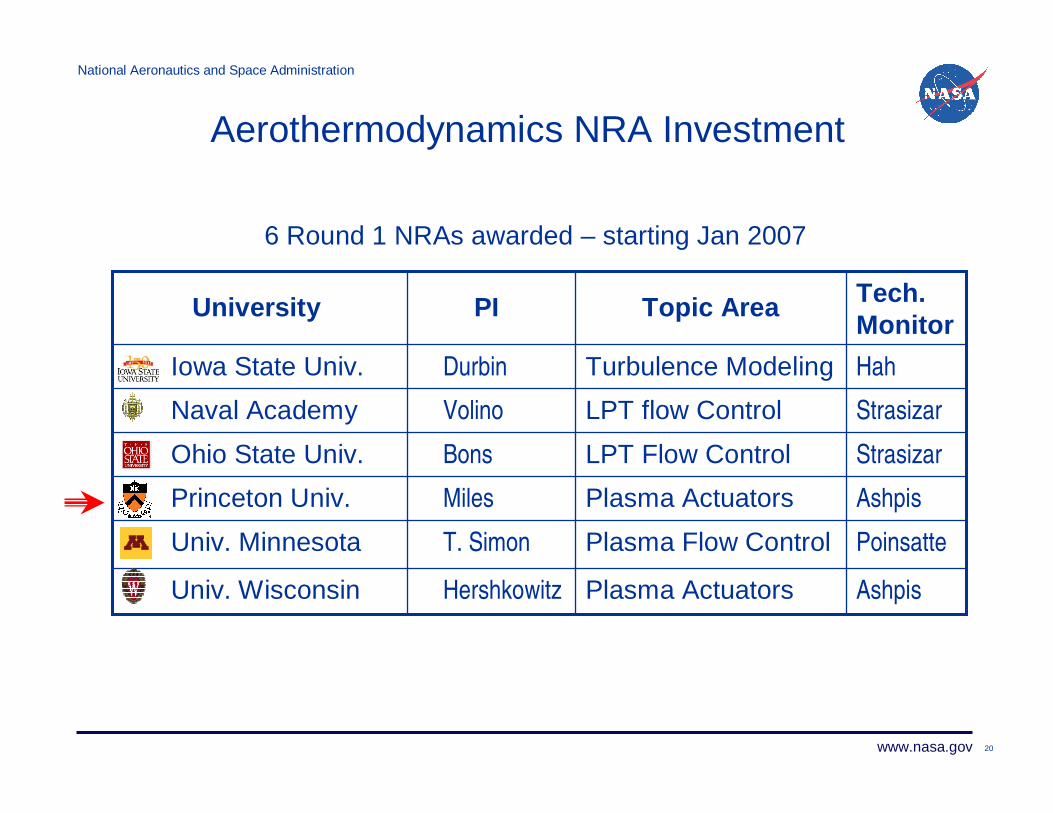
Aerothermodynamics NRA Investment
6 Round 1 NRAs awarded – starting Jan 2007
AshpisPlasma ActuatorsHershkowitzUniv. Wisconsin
PoinsattePlasma Flow ControlT. SimonUniv. Minnesota
AshpisPlasma ActuatorsMilesPrinceton Univ.
StrasizarLPT Flow ControlBonsOhio State Univ.
StrasizarLPT flow ControlVolinoNaval Academy
HahTurbulence ModelingDurbinIowa State Univ.
Tech. Monitor
Topic AreaPIUniversity
21
National Aeronautics and Space Administration
www.nasa.gov
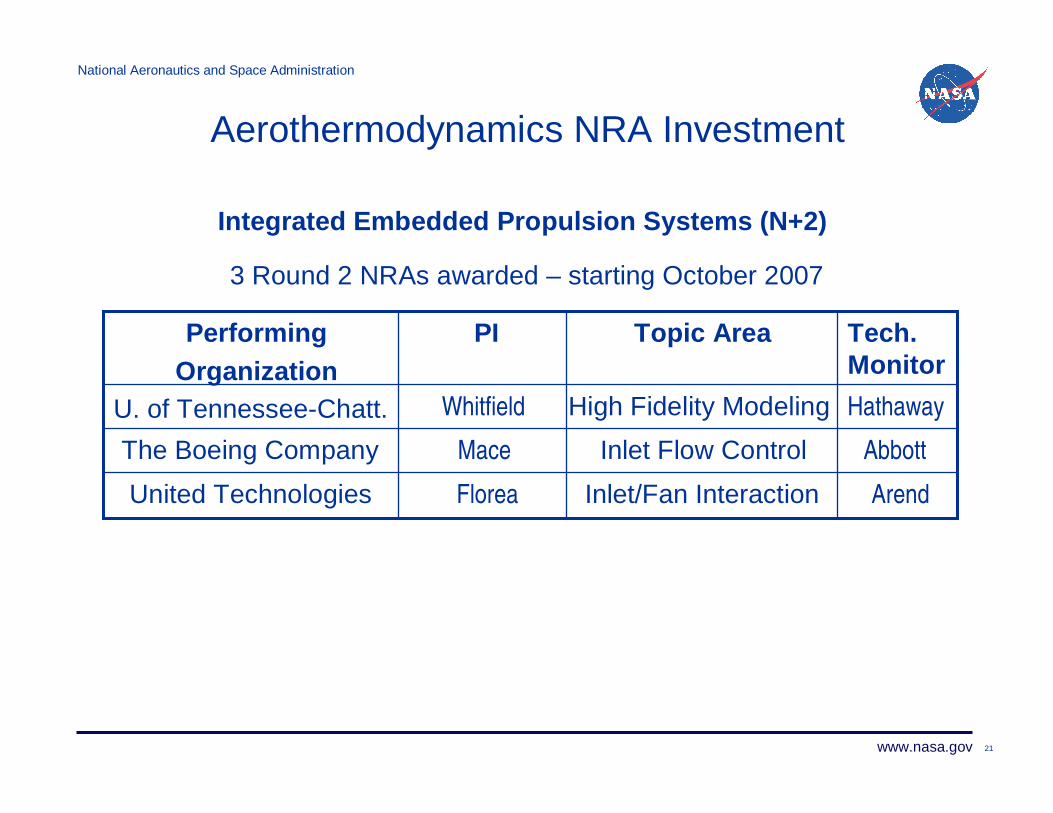
Aerothermodynamics NRA Investment
3 Round 2 NRAs awarded – starting October 2007
Integrated Embedded Propulsion Systems (N+2)
ArendInlet/Fan InteractionFloreaUnited Technologies
AbbottInlet Flow ControlMaceThe Boeing Company
HathawayHigh Fidelity ModelingWhitfieldU. of Tennessee-Chatt.
Tech. Monitor
Topic AreaPIPerformingOrganization
22
National Aeronautics and Space Administration
www.nasa.gov
INSULATOR
ELECTRODE
ELECTRODE
DBD PLASMA
���������������� ���������
��������������������
������������������
����
�
�
����������������������
��������������������
������������������
����
ω�
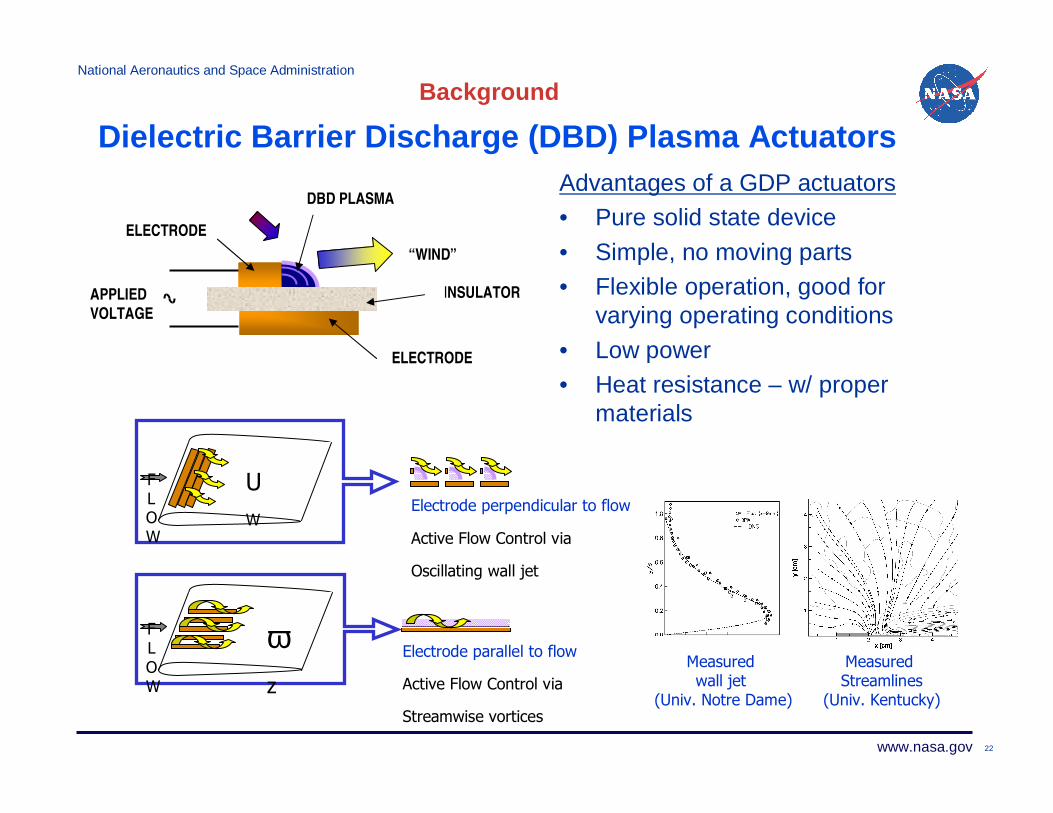
Dielectric Barrier Discharge (DBD) Plasma ActuatorsAdvantages of a GDP actuators• Pure solid state device
• Simple, no moving parts• Flexible operation, good for
varying operating conditions
• Low power• Heat resistance – w/ proper
materials
���� ����������
����!"����#���$
Background
APPLIED VOLTAGE
“WIND”
���� ��������������
����!%��� �&'$
23
National Aeronautics and Space Administration
www.nasa.gov
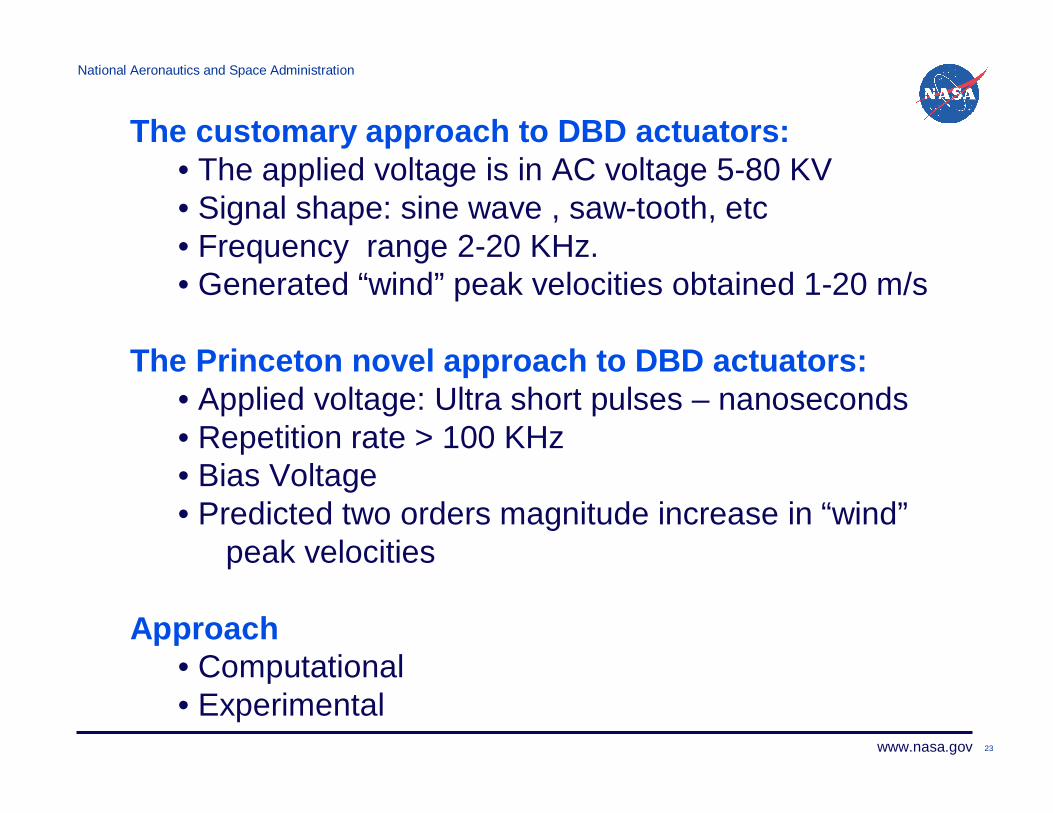
The customary approach to DBD actuators:• The applied voltage is in AC voltage 5-80 KV • Signal shape: sine wave , saw-tooth, etc • Frequency range 2-20 KHz.• Generated “wind” peak velocities obtained 1-20 m/s
The Princeton novel approach to DBD actuators:• Applied voltage: Ultra short pulses – nanoseconds• Repetition rate > 100 KHz • Bias Voltage• Predicted two orders magnitude increase in “wind”
peak velocities
Approach• Computational• Experimental
24
National Aeronautics and Space Administration
www.nasa.gov
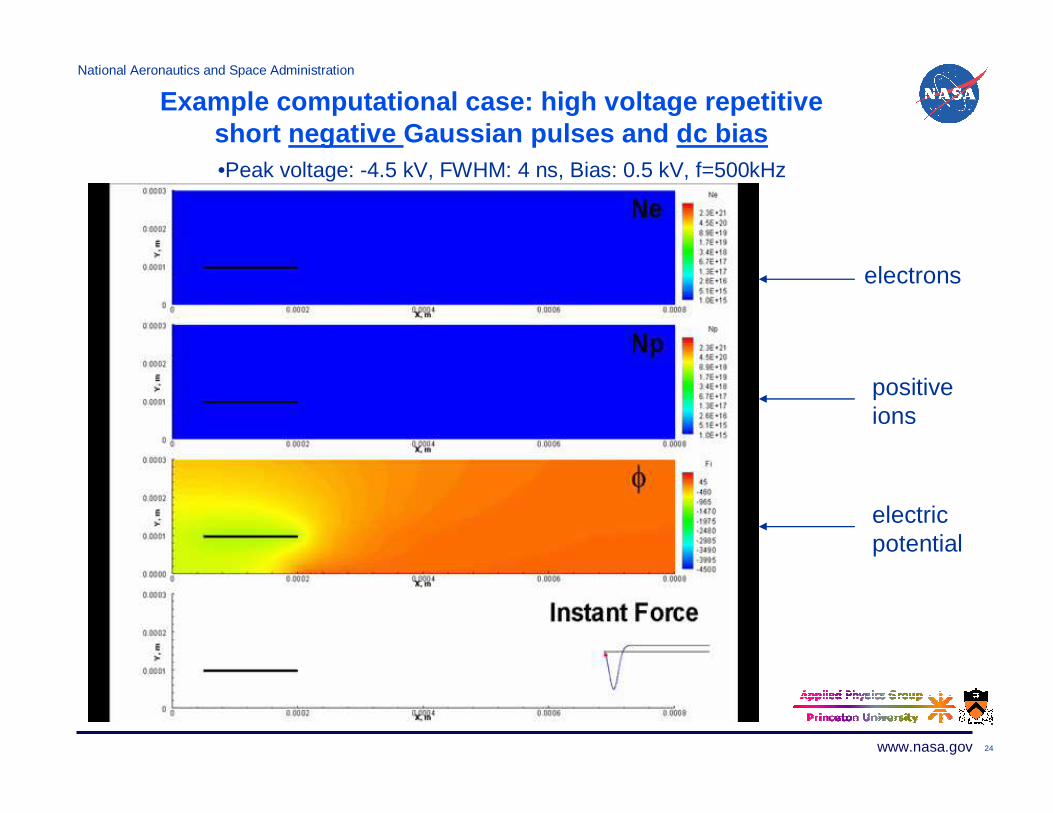
Example computational case: high voltage repetitive short negative Gaussian pulses and dc bias•Peak voltage: -4.5 kV, FWHM: 4 ns, Bias: 0.5 kV, f=500kHz
electrons
positive ions
electricpotential
25
National Aeronautics and Space Administration
www.nasa.gov
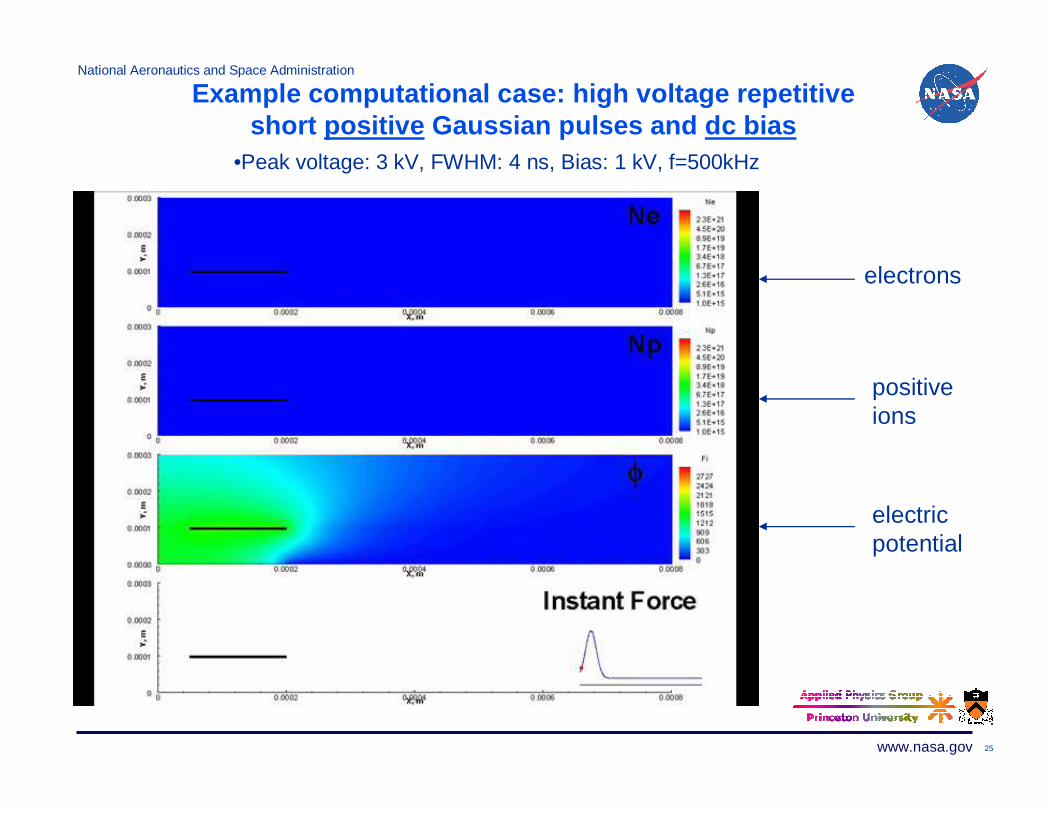
Example computational case: high voltage repetitive short positive Gaussian pulses and dc bias
•Peak voltage: 3 kV, FWHM: 4 ns, Bias: 1 kV, f=500kHz
electrons
positive ions
electricpotential
26
National Aeronautics and Space Administration
www.nasa.gov
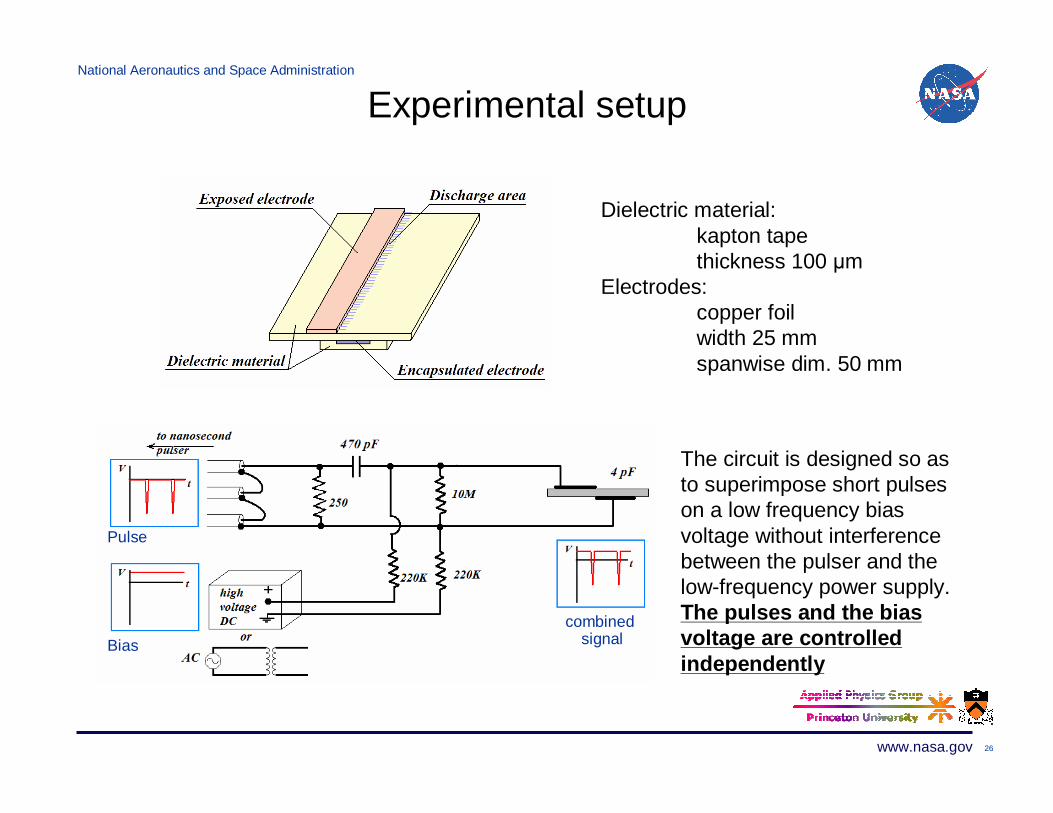
Experimental setup
Dielectric material:kapton tapethickness 100 m
Electrodes:copper foilwidth 25 mmspanwise dim. 50 mm
The circuit is designed so as to superimpose short pulses on a low frequency bias voltage without interference between the pulser and the low-frequency power supply. The pulses and the bias voltage are controlled independently
Pulse
Bias
combinedsignal
27
National Aeronautics and Space Administration
www.nasa.gov
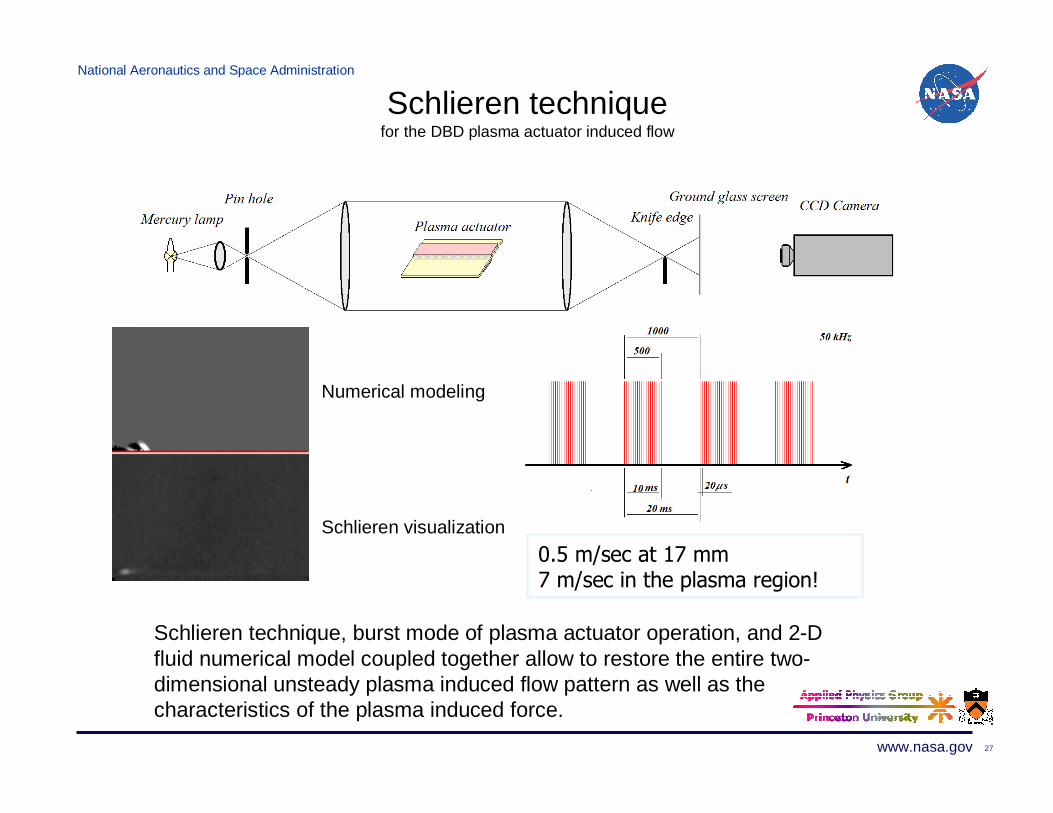
Schlieren techniquefor the DBD plasma actuator induced flow
Schlieren technique, burst mode of plasma actuator operation, and 2-D fluid numerical model coupled together allow to restore the entire two-dimensional unsteady plasma induced flow pattern as well as the characteristics of the plasma induced force.
(!)�*�����+,��,�*������-������������.
Numerical modeling
Schlieren visualization
28
National Aeronautics and Space Administration
www.nasa.gov
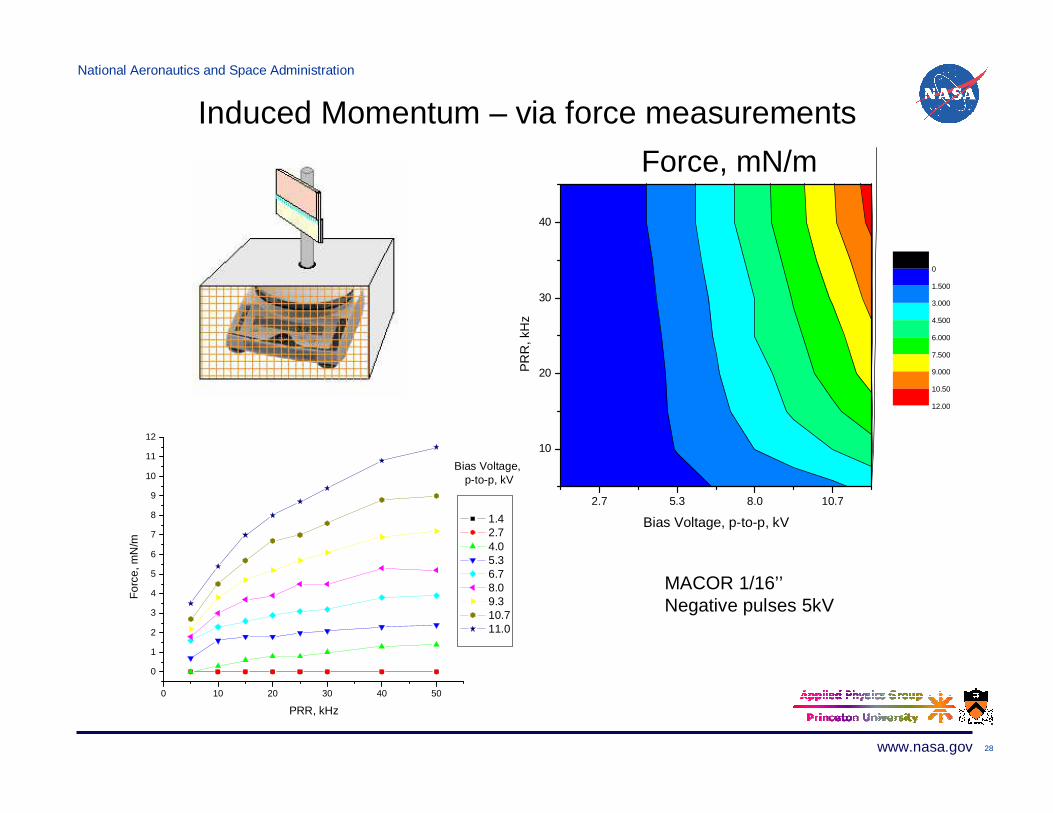
Induced Momentum – via force measurements
2.7 5.3 8.0 10.7
10
20
30
40
Force, mN/m
Bias Voltage, p-to-p, kVP
RR
, kH
z
0
1.500
3.000
4.500
6.000
7.500
9.000
10.50
12.00
MACOR 1/16’’Negative pulses 5kV
0 10 20 30 40 50
0
1
2
3
4
5
6
7
8
9
10
11
12
Bias Voltage, p-to-p, kV
For
ce, m
N/m
PRR, kHz
1.4 2.7 4.0 5.3 6.7 8.0 9.3 10.7 11.0
29
National Aeronautics and Space Administration
www.nasa.gov
Princeton NRA Summary
• Progress has been made in deriving significantinsights into the effect of the applied voltage and the role of the bias voltage.
• The discharge is efficiently controlled by ultra-short pulsing,• Gas acceleration is controlled by the bias voltage• The effects can be controlled independently
• Progress has been made in further development of the numerical code – algorithm and parallelization
• Numerical simulation already provided clear guidance for experiments. • Experiments point to needed code improvements
30
National Aeronautics and Space Administration
www.nasa.gov
Aerothermodynamics Summary
• Aerothermodynamics technologies play a critical role in the Subsonic Fixed Wing Project goals, particularly with respect to performance and fuel burn.
•NASA in-house efforts making progress in both foundational research and technology & tool development.
•Turbomachinery code assessment activity progressing with latest tools for NASA rotor 37 and stage 35.
•Significant investment in external research through NRA rounds 1 & 2
•Round 1 focus on flow control•Round 2 focus on embedded engine issues