Embed Size (px)
Citation preview

Adult Basic Education/English as a Second Language Program Details Adult Basic Education (ABE) and English as a Second Language (ESL) are provided by community and technical colleges and, to a lesser extent, community-based organizations. Among the ABE/ESL participants included in this report, 98 percent received their education at community and technical colleges and 2 percent received instruction at community-based organizations. This report is limited to adults who identified employment-related reasons for enrolling in basic skills courses and who proceeded to take only basic skills courses.1 Those who took basic skills courses for non-employment-related reasons are not included, although their learning progress is tracked by the State Board for Community and Technical Colleges.
ABE provides instruction in reading, writing, and mathematics for adults whose skills are at or below the eighth grade level; GED Test Preparation in basic academic skills beyond ABE for participants whose goal is to pass the high school equivalency examination; and High School Completion instruction for adults who want to earn an adult high school diploma. Students enrolled in Integrated Basic Education and Skills Training (I-BEST), for those transitioning into professional technical/academic certificate and degree programs, are briefly discussed in the net benefit section of this chapter, but are more extensively analyzed as part of the student population studied in the chapter on Community and Technical Colleges (CTC) Professional-Technical Education.
ESL provides basic skills instruction and non-transfer level instruction across a wide range of competency levels in reading, writing, speaking, and listening in English. Some I-BEST programs also include ESL instruction.
1 Individuals taking both vocational courses and basic skills are included in the chapter on CTC Professional-Technical Education, which presents net impact estimates for participants taking a blend of basic skills and vocational training.
Every year, the Workforce Board measures the performance of
key workforce programs. In this report, you’ll find out more
about the program and who is served, the metrics used to
measure performance and how the program performed.
2014 Workforce Training Results Adult Basic Education / English as a Second Language
1

Participant Profile For this 2014 report, researchers studied the results of 25,825 participants who left an ABE/ESL program during the most recent reporting year.2 ABE/ESL serves the most racially and ethnically diverse participants of any workforce development program in this report. The percentage of African Americans in ABE is higher than the percentage of African Americans statewide (16 percent versus 3 percent), Asians (15 percent versus 7 percent), Hispanics (20 percent versus 12 percent), and Pacific Islanders (2 percent versus .6 percent). The percentage of ABE/ESL participants who are an ethnic/racial minority is significantly higher than the percentage of minorities statewide. Non-whites comprised 64 percent of the participants, the same percentage as last year’s report.3
Source: Community and Technical Colleges Administrative Data 2011-12 and 2011 American Community Survey.
Some 58 percent of participants were women, the same percentage as the previous report.
2 The 2014 Workforce Training Results reports are based on data observed as recently as 2012-2013 for individuals exiting programs during 2011-12. 3In this report, unless otherwise stated, racial and ethnic minority groups are mutually exclusive; that is, an individual belongs to one group only. The groups include the following: Hispanics of any race (also referred to as Hispanics); non-Hispanic African Americans (also referred to as African Americans); non-Hispanic Asians (also referred to as Asians); non-Hispanic Pacific Islanders (also referred to as Pacific Islanders); non-Hispanic Native Americans and Alaskan Natives (also referred to as Native Americans); non-Hispanic multiracial (also referred to as multiracial); and non-Hispanic whites (also referred to as whites). According to the 2011 U.S. Census Bureau estimates for Washington from the American Community Survey, 72 percent are white; 3 percent are African American; 1 percent are Native American; 7 percent are Asian; 1 percent are Pacific Islander; 4 percent are multiracial; and 12 percent are Hispanic.
16% 15%
2%
20%
3%
36%
8% 3%
7% .6%
12%
1%
72%
4%
AfricanAmerican
Asian PacificIslanders
Hispanic NativeAmerican
White Other/Multiracial
Adult Basic Education Participants by Race and Ethnicity
ABE Participants State Population
2014 Workforce Training Results Adult Basic Education / English as a Second Language
2

Source: Community and Technical Colleges Administrative Data 2011-12. The median age of participants leaving an ABE/ESL program was 29 years old. A quarter of participants were under age 23, while a quarter of the participants were over age 39. Tracking ABE/ESL Progress The Workforce Board routinely measures the performance of our state’s largest workforce programs. As a customer-focused advocate for Washington’s workers and employers, the Workforce Board strives to provide performance accountability, verifying whether worker education and training programs provide a return on investment for participants and taxpayers. The Workforce Training Results report seeks to answer five core questions:
• Did participants get the skills they needed? • Did participants get a job and how much were they paid? • Were employers satisfied with the preparation workers received? • Has the program made a difference in the participant’s success? • Did participants and the public receive a return on their investment?
Data Comes From State Wage Files The 2014 Workforce Training Results includes information obtained from Employment Security Department wage files in Washington, Idaho, and Oregon, and federal employment records for 2012-13.
42%
58%
Men Women
Adult Basic Education Participants by Gender
2014 Workforce Training Results Adult Basic Education / English as a Second Language
3

Net Impact Study Adds More Insight into Program Performance In addition, the report includes a comprehensive Net Impact Study. Conducted every four years, this study provides a head-to-head comparison of participants and non-participants to help answer a central question: How much of a workforce participant’s success in obtaining a job, or a higher wage, is due to the workforce program? By comparing program participants with similar individuals who did not participate in a workforce training program, the Net Impact Study indicates whether employment and earnings gains are due to the workforce program, or if workers could have made this progress on their own. This research also allows for a more detailed analysis as to whether the participant and the public received a return on their investment in the program. Did Participants Have a Job and How Much Were They Paid? To find out whether participants had jobs and how much they earned, participant records were matched with Employment Security Department wage files from Washington and neighboring states.4 According to record matches, 49 percent of ABE/ESL participants had employment during the third quarter after they left the program- nearly the same percentage of employed participants observed in 2013 (48 percent). Their median hourly wage of $11.17, and median annual earnings of $17,074, was very similar the prior program year.5 After a decline from 2008 to 2011, employment has increased slightly and earnings have stayed flat since 2012.
4 These files contain quarterly earnings and hours worked information on those individuals with employment reported for unemployment insurance (UI) benefits purposes (approximately 90 percent of in-state employment, with self-employment, active duty military, and those working for religious nonprofit organizations being the major groups of employers not included). 5 Annual earnings are calculated as third quarter earnings multiplied by four. Quarterly earnings are the result of hourly wage rates and the number of hours worked in a calendar quarter. All wages and earnings are stated in first quarter 2013 dollars.
Turn to page 17 for the Net Impact Study. Conducted every four years,
this in-depth report adds extra value to 2014 Workforce Training
Results. The study provides a side-by-side comparison of participants
vs. similar non-participants, answering the question of whether
the program is making a difference.
2014 Workforce Training Results Adult Basic Education / English as a Second Language
4

Employment and Earnings for Adult Basic Education/English as a Second Language Participants, 2014
Performance Measure Results
Employment Rate* 49%
Full Time Employment ** 49%
Median Hourly Wage*** $11.17
Median Quarterly Hours 384
Median Annualized Earnings*** $17,074 * These figures apply to those with employment reported to state employment agencies six to nine months after leaving the program. Rate does not include self-employment, employment outside the Northwest or military service and thus understates total employment by approximately 10 percent. **Full-time employment averages 30 or more hours per week. ***Earnings/wages expressed in first quarter 2013 dollars in order to account for inflation. Earnings of ABE/ESL Participants To better gauge the financial effectiveness of Washington’s workforce programs, it helps to frame income levels. One common yardstick is the federal poverty level. In 2013, the federal poverty level for one person was $11,490 per year.6 ABE/ESL participants were able to support a median 2.4 people at the poverty level—meaning they could support themselves plus one and a half other people. They did not have enough earnings to support themselves, let alone others, at 200 percent of the poverty level (.7 people). Number of People Supported at Poverty Level by Participant Income
Performance Measure 2010 2011 2012 2013 2014
Number of people supported at poverty level
2.8 people
2.5 people
2.4 people
2.4 people
2.4 people
Number of people supported at 200 percent poverty*
0.8 people
0.8 people
0.7 people
0.7 people
0.7 people
*The number of people supported at the 200 percent of poverty level appears to stay the same because of rounding.
6 Poverty levels from 2013 were used in this edition of Workforce Training Results to measure the results of workforce programs on participants observed in 2012-13. The federal poverty level is determined by the Department of Health and Human Services. The level varies according to family size. The number is adjusted for inflation and reported annually in the form of poverty guidelines. Public assistance programs typically define eligibility income limits as some percentage of the federal poverty level.
2014 Workforce Training Results Adult Basic Education / English as a Second Language
5

The next table shows employment and earnings over the course of five study periods. This data is also represented in a graph on the following page for the years 2010-2014. Employment and Earnings Trends for ABE/ESL Participants
Performance Measure
2010 2011 2012 2013 2014
Employment Rate (Self-Reported) N/A 61% N/A N/A N/A
Employment Rate* (State Records) 55% 46% 46% 48% 49%
Full Time Employment**
53% 49% 48% 50% 49%
Median Quarterly Hours 402 385 382 386 384
Median Hourly Wage*** $18,537 $17,471 $17,071 $17,007 $17,074
Median Annualized Earnings***
$11.94 $11.51 $11.32 $11.17 $11.17
*These figures apply to those with employment reported to the state’s Employment Security Department six to nine months after leaving program. Rate does not include self-employment, employment outside the Northwest or military service and thus understates total employment by approximately 10 percent. **Full-time employment averages 30 or more hours per week. ***Earnings/wages expressed in first quarter 2013 dollars in order to account for inflation. A survey conducted in 2011 of Adult Basic Education participants revealed that 38 percent received medical benefits, and 28 percent received retirement benefits. The percentage of participants who were employed on the 2014 report is very similar to those employed on the 2013 report (48 percent vs 49 percent).
2014 Workforce Training Results Adult Basic Education / English as a Second Language
6

Source: Workforce Training Results 2010-14. Rate does not include self-employment, employment outside the Northwest or military service and thus understates total employment by approximately 10 percent. Median annualized earnings for ABE/ESL participants are similar to the two previous reports, $17,074 this year compared to $17,007 in 2013 and $17,071 in 2012.
Source: Workforce Training Results 2010-14. Note: This chart shows annualized earnings in 2013 first quarter dollars to account for inflation.
55%
49%
0%
20%
40%
60%
80%
2010 2011 2012 2013 2014
Perc
ent
Empl
oyed
Adult Basic Education Employment Rate
Percent of all participants with reported employment in the third quarter after exit from program.
$18,537
$17,074
$0
$5,000
$10,000
$15,000
$20,000
$25,000
2010 2011 2012 2013 2014
Med
ian
Earn
ings
Adult Basic Education Earnings Inflation adjusted annualized earnings to 2013 first quarter dollars for all participants with
reported employment in the third quarter after exit from program.
2014 Workforce Training Results Adult Basic Education / English as a Second Language
7

Adult Basic Education Employment by Industry Employment among ABE/ESL participants is heavily concentrated in services, retail trade, and manufacturing industries. The percentage of participants employed in services is four percentage points above last year (59 versus 55 percent). Employment in the retail trades and manufacturing has increased one percentage point each.
Source: Matches with Employment Security Department data in third quarter after exiting program.
Industry Group59% Services15% Retail Trades10% Manufacturing
3% Construction3% Natural Resources and Mining3% Transportation, Warehousing and Utilities3% Wholesale Trade2% Financial Services1% Public Administration
0.5% InformationBreakout of Services Industry
18% Accommodation and Food Services12% Administrative and Support and Waste Management and Remediation Services10% Health Care
7% All Other Services7% Social Assistance2% Arts, Entertainment, and Recreation2% Education Services1% Professional, Scientific, and Technical Services
Breakout of Retail Trade Industry4% Department Stores and Warehouse Clubs4% Groceries, Supermarkets & Specialty Foods2% All Other Retail2% Clothing and Accessories Stores1% Gas Stations/Convenience Stores1% Motor Vehicle and Accessories Sales1% Home furnishings,Garden,Hardware
Breakout of Manufacturing4% Food & Beverage4% All Other Manufacturing1% Transportation Equipment1% Fabricated Metal Products1% Wood & Paper Products
Note: Industry groups are based on North American Industry Classification System codes.
2014 Workforce Training Results Adult Basic Education / English as a Second Language
8

Relationship of Training to Employment In 2011, the Workforce Board surveyed ABE/ESL participants who had left their program in 2009-10. The survey provided data on employment and participant satisfaction with the training. The survey was conducted by telephone and was completed by 253 participants. To measure the extent to which a participant’s education program and training related to employment, we asked participants three questions:
1. How related was the program to their job? 2. How important was the training in getting hired? 3. Are the skills they learned useful in their job?
Asking about the relationship between training and employment in different ways can produce more complete information. For example, some participants said their training was not related to their job, but nevertheless found the skills acquired were useful on the job. Among ABE participants employed six to nine months after leaving a program, 15 percent said their training was “very related” to their job. A further 39 percent reported the training was “moderately related” to their job. Compared to 2008, participants in 2011 reported slightly lower rates of training related to employment, by 3 percentage points in each category.
Source: Workforce Board’s Participant Satisfaction Survey 2011.
2014 Workforce Training Results Adult Basic Education / English as a Second Language
9
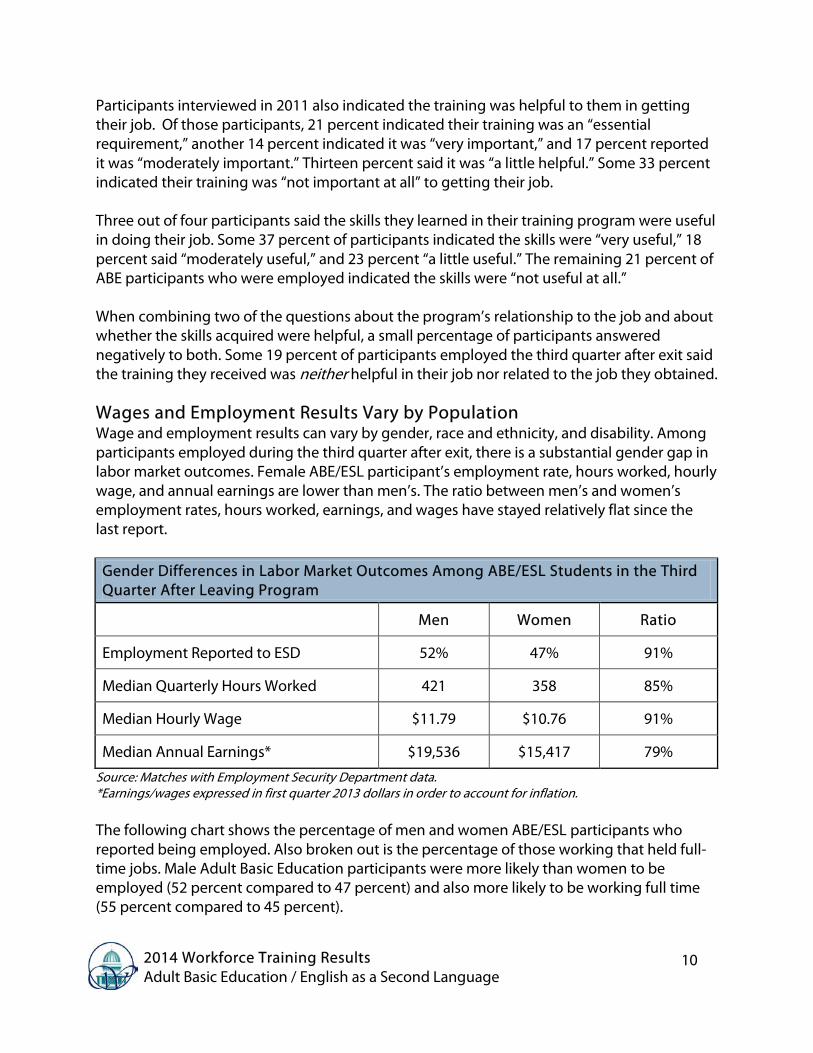
Participants interviewed in 2011 also indicated the training was helpful to them in getting their job. Of those participants, 21 percent indicated their training was an “essential requirement,” another 14 percent indicated it was “very important,” and 17 percent reported it was “moderately important.” Thirteen percent said it was “a little helpful.” Some 33 percent indicated their training was “not important at all” to getting their job. Three out of four participants said the skills they learned in their training program were useful in doing their job. Some 37 percent of participants indicated the skills were “very useful,” 18 percent said “moderately useful,” and 23 percent “a little useful.” The remaining 21 percent of ABE participants who were employed indicated the skills were “not useful at all.” When combining two of the questions about the program’s relationship to the job and about whether the skills acquired were helpful, a small percentage of participants answered negatively to both. Some 19 percent of participants employed the third quarter after exit said the training they received was neither helpful in their job nor related to the job they obtained. Wages and Employment Results Vary by Population Wage and employment results can vary by gender, race and ethnicity, and disability. Among participants employed during the third quarter after exit, there is a substantial gender gap in labor market outcomes. Female ABE/ESL participant’s employment rate, hours worked, hourly wage, and annual earnings are lower than men’s. The ratio between men’s and women’s employment rates, hours worked, earnings, and wages have stayed relatively flat since the last report. Gender Differences in Labor Market Outcomes Among ABE/ESL Students in the Third Quarter After Leaving Program
Men Women Ratio
Employment Reported to ESD 52% 47% 91%
Median Quarterly Hours Worked 421 358 85%
Median Hourly Wage $11.79 $10.76 91%
Median Annual Earnings* $19,536 $15,417 79%
Source: Matches with Employment Security Department data. *Earnings/wages expressed in first quarter 2013 dollars in order to account for inflation. The following chart shows the percentage of men and women ABE/ESL participants who reported being employed. Also broken out is the percentage of those working that held full-time jobs. Male Adult Basic Education participants were more likely than women to be employed (52 percent compared to 47 percent) and also more likely to be working full time (55 percent compared to 45 percent).
2014 Workforce Training Results Adult Basic Education / English as a Second Language
10

Source: Matches with Community and Technical Colleges Administrative Data and Employment Security Department data.
Race/Ethnicity Plays Role ABE/ESL program graduates had different employment rates when comparing race and ethnicity. The highest employment rate was found among Hispanics (56 percent), followed by Asians (55 percent), African Americans (50 percent), Pacific Islanders, (48 percent) whites (44 percent), and Native Americans (33 percent). Of those ABE/ESL participants who were working, the percentage with full-time employment also varied according to race and ethnicity. Hispanics had the highest percentage working full time (56 percent), followed by Asian (55 percent), African Americans (50 percent), Pacific Islanders (48 percent), and whites (42 percent). The lowest percentage working full time was Native Americans (38 percent). The highest wages were earned by Hispanics ($11.76), Asians ($11.43), and Native Americans ($11.22) and slightly lower wages among whites ($10.95), Pacific Islanders ($10.83), and African Americans ($10.82). Hispanics have the highest earnings, at $19,147, followed by Asians ($18,917), African Americans ($16,503), Pacific Islanders ($16,186), whites ($14,840), and Native Americans ($13,010).
52% 55%
47% 45%
Employed Full Time (among those employed)
Adult Basic Education Employment by Gender Men Women
2014 Workforce Training Results Adult Basic Education / English as a Second Language
11

Source: Matches with Community and Technical Colleges Administrative Data and Employment Security Department data.
Disability Impacts Employment, Earnings Among 2014 ABE/ESL participants, 3.1 percent had a disability (less than the 12.5 percent of the general population who have a disability).7 Participants with disabilities did less well in the labor market than other participants; they were less likely to have employment reported to the state’s Employment Security Department (36 percent versus 49 percent for participants without a disability). This is similar to the percentage observed in the last report (34 percent compared to 49 percent). Participants with disabilities were also less likely to work full time than participants without a disability (35 percent compared to 50 percent). The median hourly wage of participants with disabilities was 93 percent of the amount earned by participants without a disability ($10.44 compared to $11.17), and median annual earnings were 73 percent of those without a disability ($12,468 compared to $17,157).
7 2011 U.S. Census Bureau estimates from the American Community Survey, Table S0201 - Selected Population Profile in the United States.
50% 55%
48%
56%
33%
44% 50%
55% 48%
56%
38% 42%
AfricanAmerican
Asian PacificIslander
Hispanic NativeAmerican
White
Adult Basic Education Employment by Race/Ethnicity Employed Full Time (among those employed)
2014 Workforce Training Results Adult Basic Education / English as a Second Language
12

Source: Community and Technical Colleges Administrative Data and Employment Security Department data matches 2011-12. Participant Survey According to survey results, 73 percent of participants indicated they entered an ABE/ESL program to learn skills for a new job. Participants also said they enrolled for their own personal enjoyment or improvement (91 percent), or to improve their English speaking or reading skills (70 and 72 percent respectively). As in previous studies, the large majority of participants received instruction in reading and writing. About half of participants received instruction in math. Fewer received training in workplace skills such as problem solving, diversity, and work habits. The highest percentage of participants, 76 percent, said they gained reading skills, followed closely by 75 percent who reported writing skills.
36% 35%
49% 50%
Employed Full Time (among those employed)
Adult Basic Education Employment Among People with Disabilities
With Disability Without Disability
2014 Workforce Training Results Adult Basic Education / English as a Second Language
13

Source: Workforce Board’s Participant Satisfaction Survey 2011.
As in the previous study, most participants reported their skills improved in the areas where they received instruction. Participants tended to report higher levels of improvement with workplace skills, such as teamwork, diversity and work habits than with basic skills such as computer, writing or math.
The percentage of participants who reported a lot of improvement in work habits increased 7 percentage points (from 48 percent to 55 percent). In all other areas the percent who reported their skills improving a lot remained the same or changed only marginally compared to the prior study.
Source: Workforce Board’s Participant Satisfaction Survey 2011.
2014 Workforce Training Results Adult Basic Education / English as a Second Language
14

Participant Satisfaction In general, participants were satisfied with the training they received. Some 93 percent of participants reported being satisfied with their program overall. However, the percentage who stated that they had met their educational objectives decreased from 78 percent in the previous study to 68 percent this year. A majority of participants indicated satisfaction with various program features. Three-quarters of participants reported they were "very satisfied" with program facilities and teaching quality. Compared to the 2008 survey, the program feature with the largest increase of participants reporting they were "very satisfied" was equipment (which increased from 63 to 68 percent). The only feature to have a decrease in the percentage of students reporting they were "very satisfied" was career usefulness, which dropped from 56 percent to 51 percent since the last survey.
Source: Workforce Board’s Participant Satisfaction Survey 2011. The support services that participants were most likely to report needing more services related to finding a job (including resume writing, job opening information, interviewing and career counseling). Participants were more likely than not to receive the services they needed. However, a relatively high 13 percent said they left the program with their need for job counseling unmet. An unmet need for resume writing, other government services, interviewing, and job opening information was reported by about one in every 10 students.8
8 Unmet need refers to cases where the student reports that either they did not receive the required service or what was provided did not meet their needs.
2014 Workforce Training Results Adult Basic Education / English as a Second Language
15

Source: Workforce Board’s Participant Satisfaction Survey 2011. The percentage of participants who reported leaving the program with an unmet need has declined in nearly every category, not only since the last participant survey, but since 2004. The largest decrease in unmet need came in transportation assistance, which dropped from 9 percent to 3 percent since the last survey.
Source: Workforce Board’s Participant Satisfaction Surveys 2002-11.
2014 Workforce Training Results Adult Basic Education / English as a Second Language
16

Net Impact - Did Program Make a Difference in Participant Success? Every four years the Workforce Board conducts net impact and cost-benefit analyses of workforce development programs. This detailed study compares participants and non-participants. The net impact part of this study attempts to measure whether the program made a difference in the participant’s success. Washington is the only state to periodically conduct rigorous net impact evaluations of its workforce programs. The net impact analysis was conducted by the W.E. Upjohn Institute for Employment Research (Upjohn), a national leader in evaluating training programs. To do the analysis, Upjohn studied program participants to see what results they achieved and compared these results with a control group. Individuals who participated in an ABE program were compared to individuals who had similar demographic characteristics, but who did not participate in any of the programs included in the study. The comparison group members were selected from among those who registered with WorkSource, Washington’s one-stop career center system. The most recent net impact analyses examined experiences of participants who left the ABE/ESL Training program through 2009. The short-term impact (Program Year 2007-08) was observed in 2008-09, while the long-term impact (Program Year 2005-06) was observed from 2006-07 through 2008-09. Impact on Employment and Earnings: Participants vs. Control Group
ABE/ESL Participants Short-term^ Long-term^
Net Employment Impact* No significant positive impact
No significant positive impact
Net Hourly Wage Impact** No significant positive impact
No significant positive impact
Net Quarterly Hours Impact 15.4 15.1
Annualized Earnings** $995 $895
^Short-term is three quarters after program exit. Long-term is average across three years since program exit. *Percentages listed are employment percentage points above those of the control group of non-participants. **Wages and earnings, expressed in first quarter 2013 dollars; represent the average difference between ABE/ESL participants who got jobs and those in the control group who were employed. To estimate these impacts, individuals who received employment-related ABE/ESL education were compared to individuals who had similar characteristics within the state’s employment
The Adult Basic Education program has positive net
impacts on annualized earnings.
2014 Workforce Training Results Adult Basic Education / English as a Second Language
17

service, but who did not participate in any of the programs included in the study.9 Additional estimates were made for a cohort of ABE/ESL participants who also participated in CTC Professional Technical Education. As can be seen above, Adult Basic Education participants worked more hours per quarter than non-participants in the control group. They also garnered higher annualized earnings than those who did not participate. However, the program did not have a significant positive impact on employment and hourly wages.
Costs and Benefits The cost-benefit analysis estimates the value of the net impact on earnings, employee benefits (estimated at 25 percent of earnings), unemployment insurance benefits, and certain taxes.
Program costs include both direct program costs and support payments borne by the government and the earnings students gave up while participating in the program. Benefits and costs are calculated for both the observed period of time and based upon a statistical model that estimated the benefits and costs out to the age of 65. In order to compare benefits and costs in terms of net present values, post-program benefits and costs are discounted by 3 percent per year and all figures are stated in 2013 Q1 dollars to control for inflation. The benefits and costs presented here are based on impacts estimated for students leaving programs in 2005-2006 (observed from 2006-07 through 2008-09), because a longer-term follow up is required for this analysis. The results are for those students who took only basic skills courses in the colleges. For each student in ABE/ESL only, the public (taxpayer) cost is about $2,843 over the length of their enrollment, and the student cost is $117 in foregone earnings while in school. The average ABE/ESL student makes no net gains in earnings in either the first two and one-half years after leaving college or during the course of working life to age 65 compared to similar individuals who did not participate in any of the workforce development programs.
9 The net impact study excludes individuals who enrolled in ABE/ESL programs for personal enhancement or non-employment-related purposes.
2014 Workforce Training Results Adult Basic Education / English as a Second Language
18

Participant and Public Benefits and Costs per Participant in Community and Technical Colleges ABE Programs
Note: Benefits and costs are expressed in 2013 first quarter dollars. Upjohn estimated the impact of the net change in earnings of Social Security, Medicare, federal income, and state sales taxes.
Again, the above findings are for students who participated in ABE/ESL only and do not include students who also participated in professional-technical education or other training. In contrast, Integrated Basic Skills Education and Training (I-BEST), that combines adult education with professional-technical training, has significant positive impacts on participant employment and earnings.
Impact on Employment and Earnings: I-BEST Participants vs. Control Group
I-BEST Participants Short-term^
Net Employment Impact* 3.9 percentage points
Net Hourly Wage Impact** $1.40
Net Quarterly Hours Impact 35.3
Annualized Earnings** $2,645
^Short-term is three quarters after program exit. Long-term results are not yet available for I-BEST. *Percentages listed are employment percentage points above those of the control group of non-participants. **Wages and earnings, expressed in first quarter 2013 dollars; represent the average difference between I-BEST participants who got jobs and those in the control group who were employed.
Participant Public Participant PublicBenefits *
Earnings - - - -Fringe Benefits - - - -Taxes - - - -
TransfersUI -$736 $736 -$1,103 $1,103
Costs Foregone net earnings $117 $13 $117 $13 Program costs $0 -$2,843 $0 -$2,843
Benefits - - - -Costs $117 -$2,830 $117 -$2,830
Total (Net) - - - -
Benefit/CostFirst 2.5 years Lifetime (until 65) Sum of Costs and
Benefits
2014 Workforce Training Results Adult Basic Education / English as a Second Language
19

Summary and Areas for Improvement As reported in previous studies, the employment and earnings results are weak for students who participate in Adult Basic Education without also receiving professional-technical training. Although participants report high levels of satisfaction with their program, the study does not find a positive impact on the average student’s employment and hourly wages. On a positive note, there has been a clear trend over time toward meeting more students’ needs for support services. The findings show a substantial net impact on employment and earnings for students who participated in I-BEST, combining adult education with professional-technical training. These results are strong evidence of the importance of investing resources in I-BEST and similar alternative methods of delivering adult education.
2014 Workforce Training Results Adult Basic Education / English as a Second Language
20